Article

Energy Productivity Potential of Offshore Wind in Poland and Cooperation with Onshore Wind Farm

1
Mineral and Energy Economy Research Institute, Polish Academy of Sciences, 7A Wybickiego St., 31-261 Cracow, Poland
2
Faculty of Electrical Engineering, Warsaw University of Technology, 1 Politechniki Sq., 00-661 Warsaw, Poland
3
Veolia Energia Polska S.A., 2 Puławska St., 02-556 Warsaw, Poland
*
Author to whom correspondence should be addressed.
Appl. Sci. 2023, 13(7), 4258; https://doi.org/10.3390/app13074258
Submission received: 18 February 2023 / Revised: 24 March 2023 / Accepted: 24 March 2023 / Published: 27 March 2023
(This article belongs to the Special Issue Wind Energy: Current Trends, Implementations and Future Developments)

Abstract

:
Wind power is the leader in electricity production among the standing RES technologies, both in Poland and in Europe/World. In Poland, so far there are only onshore wind turbines. Their dynamic increase in installed capacity has been observed, especially between 2011 and 2017. This study analyzed the impact of offshore wind energy on the ability of the Polish power system to meet power demands. For this purpose, methods of statistical analysis (of existing onshore and planned offshore technologies) for the determination of wind turbine productivity based on wind speed components data from the ERA5 service were used. For onshore wind turbines, the value of the capacity factor CF(P) in Poland was 25.5% in 2021 and 30.1% in 2022. As a result of the simulation, it was calculated that for the planned offshore wind farms, the capacity factor CF(B) would be 55.6% under 2022 wind speed conditions. The 2022 peak load demands in the Polish system were also analyzed. The quantitative impact of installing 6 GW of offshore wind turbine capacity on the national power system was also identified.

1. Introduction

In recent years, wind energy has become one of the cheapest sources of electricity in terms of Levelised Cost of Electricity [1,2]. Installed cost reduction of technology as well as technology development is being observed nowadays. This, together with implemented support systems for renewable energy development, has resulted in significant increases in the installed capacity of renewable sources, including wind energy, in Poland and in other countries [3]. The increasing share of electricity generated from these sources has influenced the electricity market and prices in this market. Electricity generated from today’s RESs has an impact on the stabilization of electricity prices in the wholesale market [4,5,6]. In Poland, during days when the value of energy generation from onshore wind turbines is close to or above half of the installed capacity—about 8 GW from onshore wind installed already—the market price of the power exchange is significantly lower than on other days [7]. This is also apparent when the value of the share of wind-generated energy exceeds 20% of the daily energy production [4]. At the same time, this technology only contributes to a certain extent to ensuring that the power demand of the electricity system is met. In addition, wind energy production is unpredictable due to weather conditions, but it is nevertheless possible to make estimates on a different time scale in terms of its quantity.
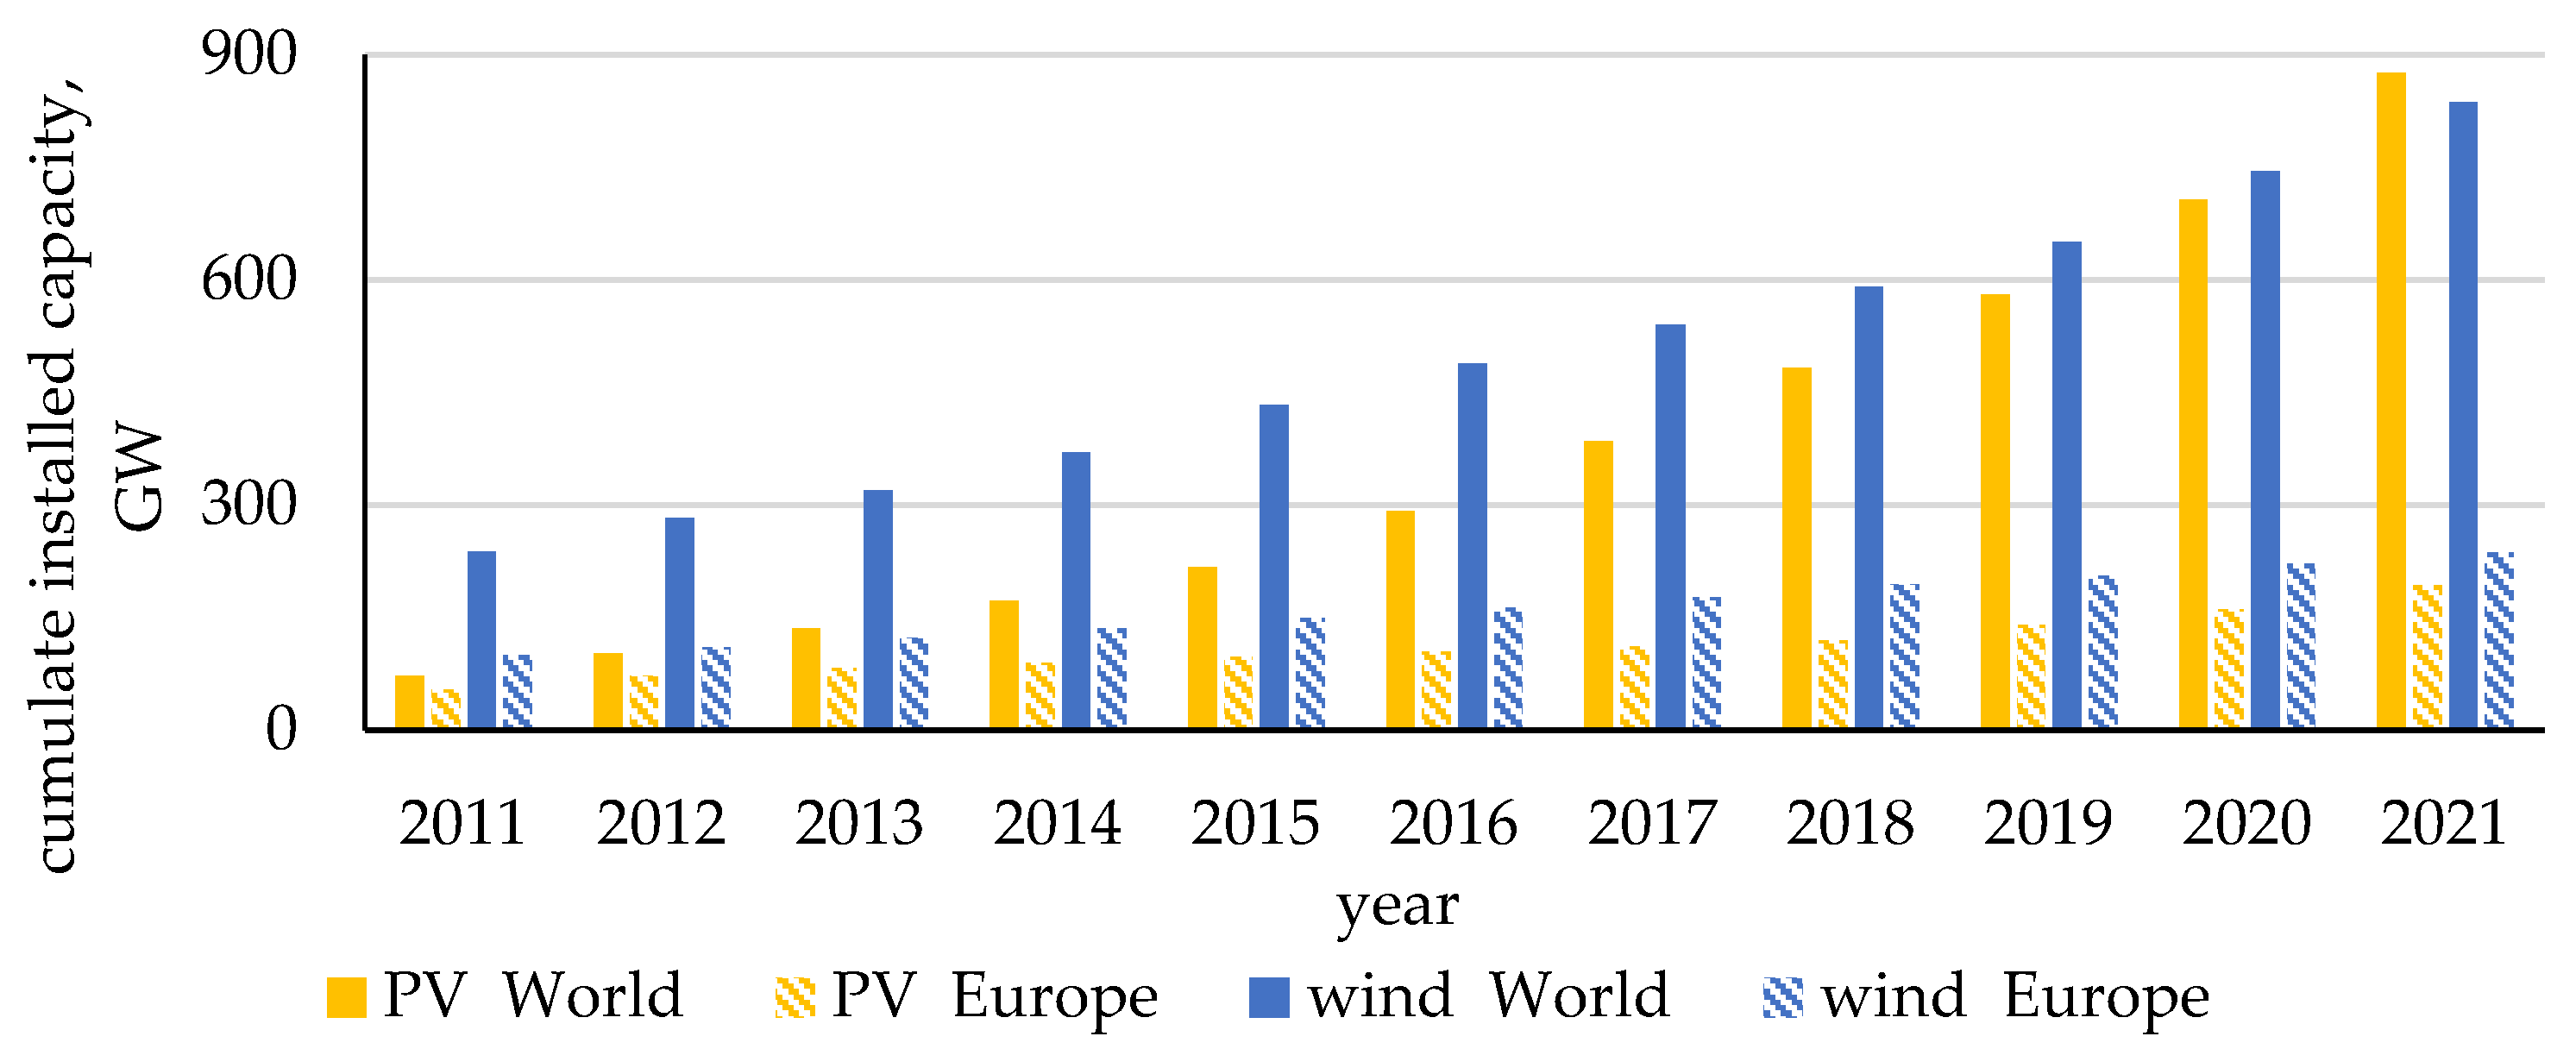
For years, wind power has ranked highest in terms of volume of energy generation among renewable energy sources. In terms of installed capacity, it was only in 2021 that the installed capacity of photovoltaics globally exceeded the installed capacity of wind turbines [8]. Figure 1 presents the cumulative installed capacity in the period of 2011–2021 for wind energy and PV [1].
In 2021, for the first time, solar PV (875 GWp) reached a higher installed capacity worldwide than wind turbines (837 GW) [11]. In Europe, the installed capacity of wind technologies is still higher (236 GW) than in photovoltaic sources (193 GW). In addition, Poland’s PV reached a higher installed capacity than that of wind turbines due to implemented dedicated support programs [12,13].
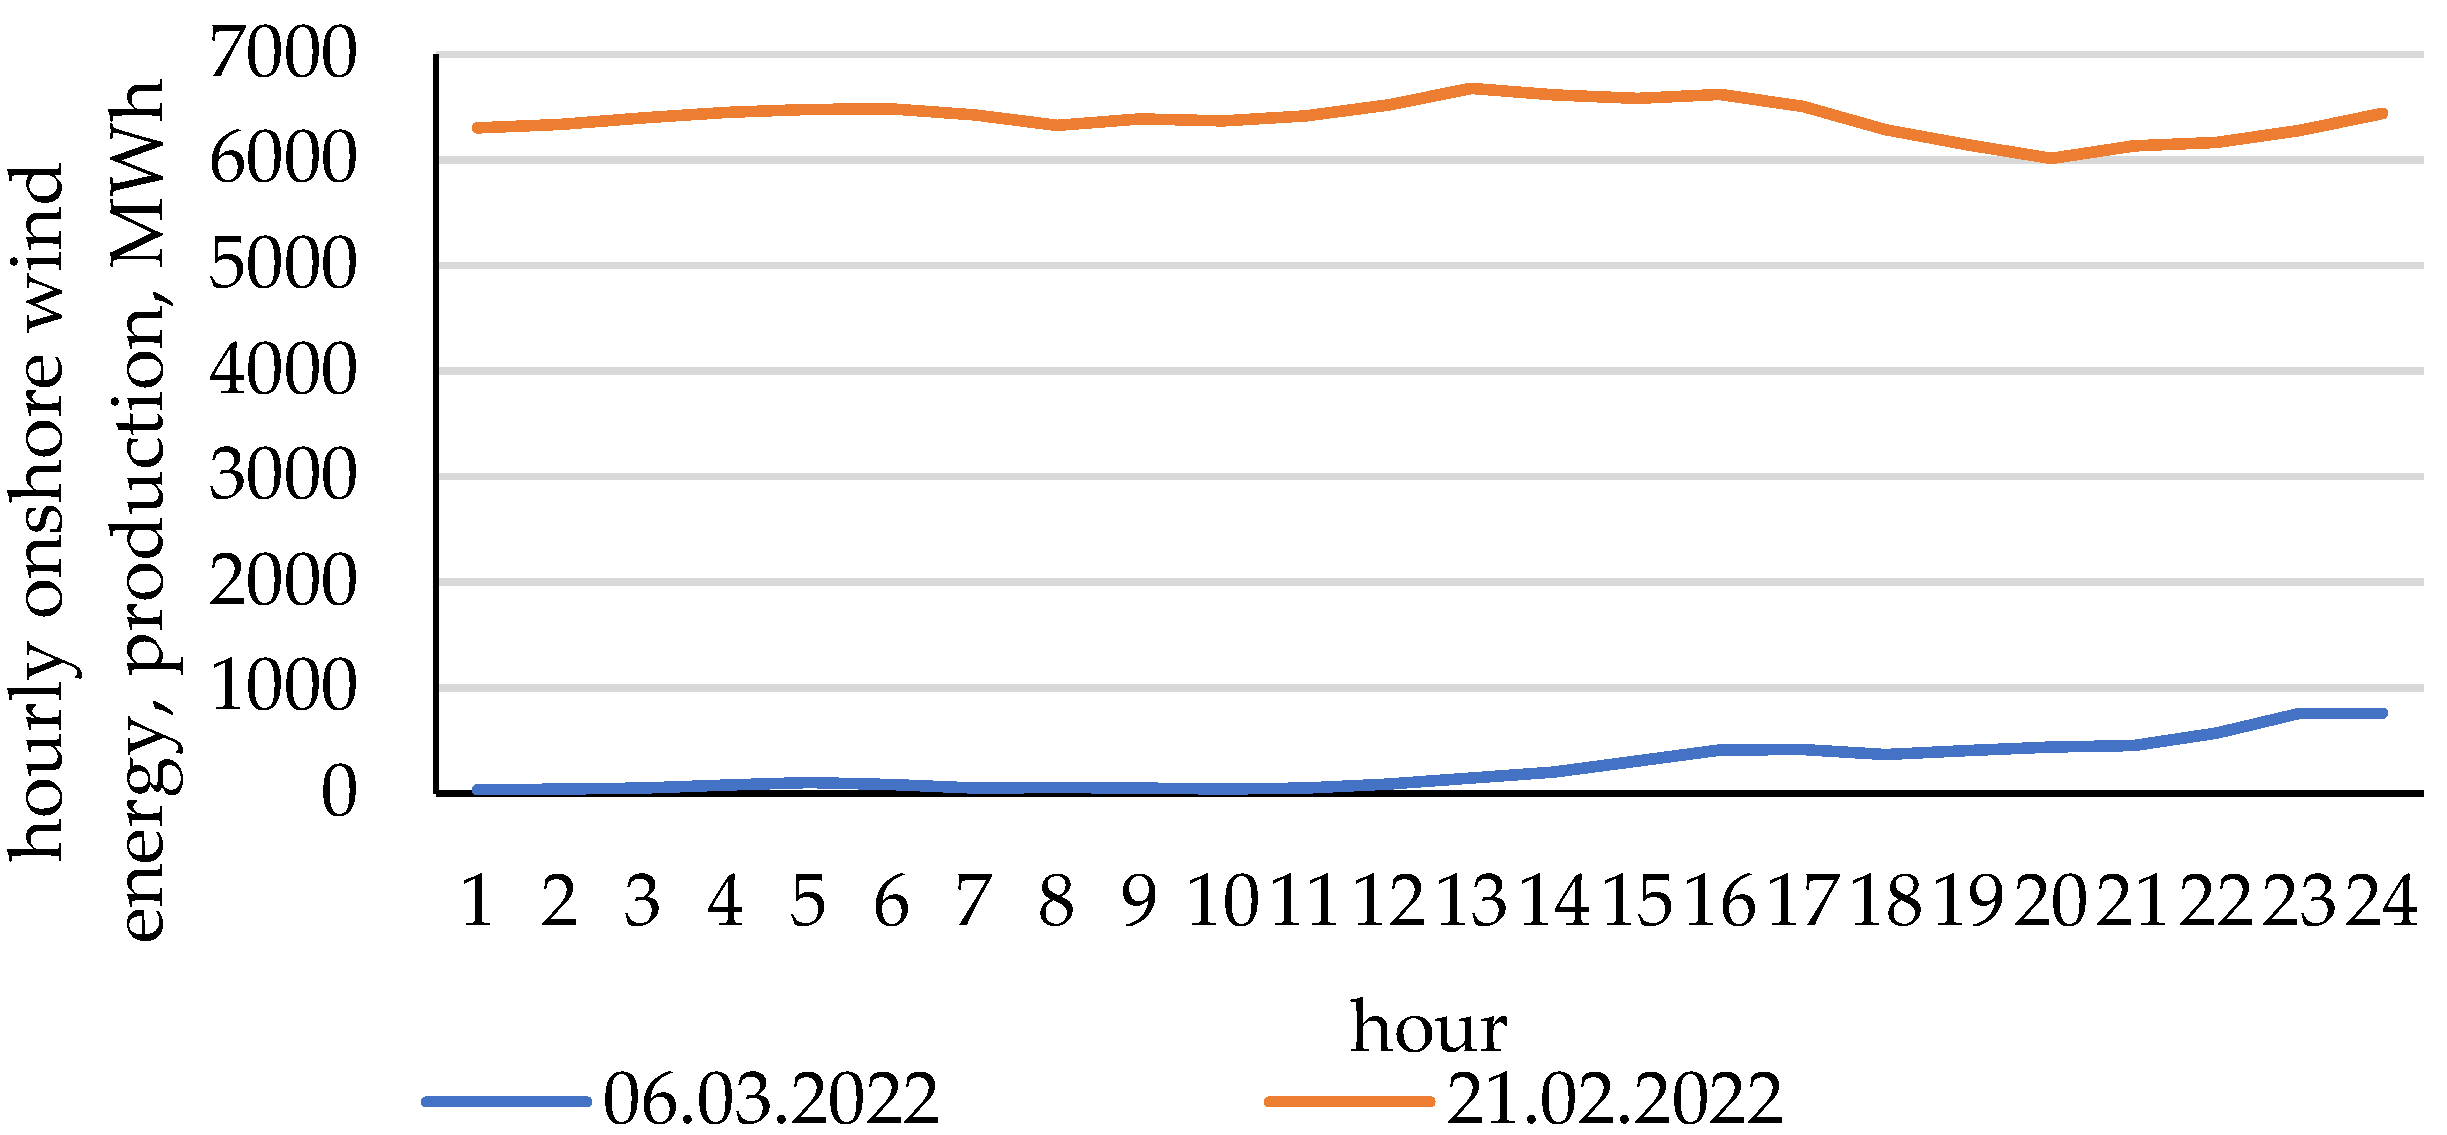
Energy generation from onshore wind in Poland is characterized by high temporal variability; as an example, hourly data from the day with the highest energy production in the first half of 2022 (21 February) and the lowest one (6 March) were selected (Figure 2). In the first interval, hourly energy production was higher than 6000 MWh, and in the second period, hourly energy production for the first half of the day did not exceed 100 MWh. At that time, the total installed wind power capacity in the Polish electricity system was about 7.8 GW—onshore and offshore had not been installed until now (data as of February 2023).
However, capacity utilization from wind turbines differs depending on wind conditions and is limited in Poland onshore (even for seaside areas). One of the possibilities for providing more available capacity and obtaining a higher capacity factor for wind power is the use of offshore wind turbines. This is also the main focus of research for this thesis, including the selection of a methodology for comparing wind sources as well as their complementarity and in terms of overlapping capacity in the electricity system.
In terms of wind energy production, geographical diversification of production is possible [15], and in this respect, offshore wind is a potential extension of this generation’s units—i.e., onshore and offshore diversification of energy production ensues [16].
As is well known, the energy production of wind turbines depends mainly on the wind speed in the area where the wind turbine is located. The assessment of wind energy potential is one of the first necessary steps in the implementation of wind turbine investments. Wind is a highly variable, dynamic element of climate, both spatially and temporally. It depends on the nature of the macro-scale atmospheric circulation over a given region and on physiographic conditions at the local scale. For onshore locations, it is particularly strongly modified in areas with varied relief. Wind speed is decisively influenced by the height and form of the terrain, as well as the roughness of the ground and terrain obstacles. Hilltop passes with a parallel axis and ridges with an axis perpendicular to the prevailing wind direction are particularly predestined to harness wind energy. The selection of wind turbine units according to the meteorological conditions at a given location is important for the availability and capacity factor of the installed wind power capacity. The generating capacity and output of a wind turbine is not stable, regardless of whether they are sited on land or offshore.
At the same time, offshore wind energy is characterized by higher energy generation and stability than that of onshore farms. Wind speed is higher offshore than onshore, and the roughness of the ground and terrain obstacles are limited. They also use other types of turbines. They have higher rated powers and larger diameters for the circle delineated by the rotor blades, and they are most often higher than shore-based turbines. Due to higher wind speeds at sea, those offshore are sometimes designed to operate at wind speeds greater than 25 m/s, which is the limit value for onshore turbines.
In this study, an analysis of how much and whether there is potential for cooperation between offshore and onshore wind energy was carried out. Taking into account the issues of dynamic changes in wind speed geographically—shifting wind speeds most often occur from the northwest to the southeast and from the north to the south—prior to the study, it was assumed that the location and cooperation of onshore and offshore sources would play a role in ensuring the security of the energy supply and power during emergency periods. More and detailed information on cooperation between offshore and onshore sources and other renewable sources, including the correlation in generation between these sources, is presented by Dobrzycki and Roman [17].

Literature Review

Paska and Surma conducted research on the integration of wind energy in the power system to analyze to what extent the capacity installed in wind farms contributes to guaranteeing the coverage of the maximum demand for power and electricity in the national power grid [18,19]. Shojaeiyan et al. introduced an effective intelligent framework for the optimal energy management for hybrid microgrids based on a proposed stochastic scheme [20]. Mu et al. proposed a cumulative model for the spatiotemporal relationships between wind power variations and wind farm dispersion [21]. Kou et al. conducted a review of the wind energy research and found it of great importance to carry out research to improve of the stability of offshore wind farm systems [22].
The offshore energy sector in Poland will also benefit from the support mechanism, which includes the capacity market or RES auctions [7]. In that regard, Kaszyński et al. conducted an analysis of four types of capacity market units in Poland: existing, modernized, planned, and demand response, based on the results of the capacity auctions. Their research demonstrated that the capacity market did not incentivize investment in new generation units during the period under examination [23]. Hayes at al. presented a new method for using ERA5 weather data to model hourly wind generation for individual offshore wind farms [24]. Hallgren et al. presented a comparison of data from four state-of-the-art re-analyses (MERRA2, ERA5, UERRA, NEWA) with LiDAR observations (for four locations in the Baltic Sea with wind profiles up to 300 m). In terms of overall wind performance, ERA5, UERRA and NEWA are similar, and the best choice depends on the application [25].
Many offshore wind farms are planned in Poland; Komorowska et al. analyzed the LCOH (Levelised Cost of Hydrogen), taking into account the geographic coordinates of 23 planned offshore wind farms in the Baltic Sea. A comparative analysis of the costs of hydrogen production from offshore and onshore wind farms in 2030 and 2050 was presented [26]. This paper expands on this issue. Kryzia et al. conducted an analysis of geographical diversification for onshore winds in Poland [15]. This paper extends this theme. Pieczarko and Sołtysik analyzed the impact of wind generation on energy prices on the SPOT market [5], and Rogus et al. conducted a comparative analysis of generation forecasts from wind sources in diametrically different markets and for different wind conditions (Portugal and Poland), indicating the implications for market prices [27]. Talarek et al. presented a comprehensive overview of the recent advancements and obstacles in the Polish wind energy sector, along with the potential opportunities [28]. Pronińska and Księżopolski evaluated the public policy instruments in Poland that govern the establishment of offshore wind farms. They identified, categorized, and evaluated many instruments using multi-criteria and multi-dimensional methods, highlighting their effect on the growth of offshore wind energy in Poland [29].
Based on the above-mentioned articles, there is a lack of methodology assessment related to the influence of offshore wind on the national power system in the Baltic Sea, including Poland. Additionally, there have been no analyses conducted on how offshore wind energy can take part in stabilizing energy production in the power system, particularly with comparison to other renewable sources.
The paper is structured as follows. Section 2 presents the materials and methods for real (onshore) and potential offshore wind energy production calculations. Section 3 focuses on the research results and discussion. Finally, Section 4 presents the conclusions of the research and analysis presented in the article.

2. Materials and Methods

The research includes several methods that contain an algorithm for estimating the energy productivity of offshore wind turbines. Additionally, a calculation for onshore wind energy production was conducted.

2.1. Research Object

In Poland, several offshore wind farms are planned to be built in offshore areas by 2030. Location data for the area of potential Baltic Sea wind farms were averaged, and data was collected for 55.5° N, 17.5° E. Properties of wind turbines that can be installed are included in Table 1.
The performed analysis was not very sensitive to the type of turbines used at sea (the difference in the value of the Cp parameter—coefficient of power—for different manufacturers did not exceed a few percentage points).

2.2. Offshore Wind Energy Calculation Method

The first step in the calculations was to determine the potential wind offshore power. For this purpose, wind speed data was collected for the period 1 January 2022–31 December 2022. The data retrieved for each hour from ERA5 database [31] were
  • u100—the eastward component of the 100 m wind. It is the horizontal speed of air moving towards the east, at a height of 100 m above the surface of the Earth (from ERA5 database, m/s) [32].
  • v100—the northward component of the 100 m wind. It is the horizontal speed of air moving towards the north, at a height of 100 m above the surface of the Earth (from ERA5 database, m/s) [32].
For the data collected in this way, potential average hourly powers of wind turbines were determined, based on the following wind power calculations:
W T P τ = 0 0.5 · C p · ρ · A · w s τ 3 / 1,000,000 N P       i f   w s < c i s p   a n d   w s > c o s p i f   c i s p < w s < r w s i f   r w s < w s < c o s p
where:
WTP Wind turbine power, MW;
τ Hour of year;
Cp Power coefficient of wind turbine, turbine producer data, from Table 1.;
ρ Density of air, 1.2 from [33], kg/m3;
A Cross-sectional area of the wind (swept area), from Table 1, m2;
ws Wind speed, please see Equation (2), m/s;
NP Nominal power of wind turbine, from Table 1, MW;
cisp Cut-in speed, from Table 1, m/s;
cosp Cut-off speed, from Table 1, m/s;
rws Rated wind speed, from Table 1, m/s.
Equation for wind speed based on ERA5 data is presented below:
w s τ = u 100 τ 2 + v 100 τ 2 0.5
where:
ws Wind speed, m/s;
τ Hour of year;
u100 The eastward component of the 100 m wind, from ERA5 database, m/s;
v100 The northward component of the 100 m wind, from ERA5 database, m/s.
Theoretical specific yield for wind turbine energy dived by nominal power:
S Y B , τ = W T P τ N P · 1   h
where:
SY Hourly unit specific yield of wind turbine, MWh/MW;
B Baltic Sea area;
τ Hour of year;
NP Nominal power of wind turbine, from Table 1, MW.
Unit daily specific yield for offshore wind energy production was calculated by the following equation:
S Y d B , d a y = τ d = 1 24   S Y B , d a y , τ d
where:
SYd Daily specific yield, MWh/MW/day;
τd Hour a day;
day Number day in year (1 … 365).
Equations (1)–(4) were included in the methodology for calculating the potential offshore wind energy shown in Figure 3. There are three loops: daily, monthly, and yearly. Based on several outputs, mainly wind speed data, the main result is calculated as the daily specific yield (in unit of kWh/kW/day).

2.3. Onshore Real Wind Energy Production Calculation Method

Calculation of hourly specific yield values (per MW) of onshore wind turbines—based on historical hourly data on energy production and monthly values of installed power, is presented in the equation below:
S Y P , τ = P _ W T τ T N P m o n t h
where:
SY Hourly specific yield of wind turbine (production for each hour—sum in Table 2, capacity per month—Table 2), MWh/MW;
P Onshore (whole existing wind turbines in Poland);
P_WT Real onshore wind energy production in Poland for each hour, data from PSE [34] Table 2, MWh;
τ Hour of year;
TNP Real total nominal power of onshore wind turbine, Table 2 (in month resolution), MW.
In the next step, real value of daily specific yield equals wind energy unit productivity by the following equation:
S Y d P , d a y = τ d = 1 24   S Y P , d a y , τ d
where:
SYd Real daily specific yield of onshore wind turbine, MWh/MW/day.
Simplified algorithm calculation of specific yield for onshore wind turbines in Poland is presented in Figure 4.

2.4. Comparison of Onshore and Offshore Wind Energy Production

Comparison of the use of technology in the form of time share for hourly specific yield ranges:
T T , S Y 1 , S Y 2 = τ   1   i f   ( S Y T ,   τ > S Y 1   &   S Y T ,   τ < S Y 2 ) )   8760
where:
SY1 Lower limit of the range for specific yield, MWh/MW;
SY2 Upper limit of the range for specific yield, MWh/MW.
Difference between specific yield for offshore and onshore wind turbine is obtained by following equation:
d S Y B , P , τ = S Y B , τ S Y P , τ
where:
dSY Hourly difference in specific yield between B and P, MWh/MW.
Onshore and offshore technology compared also by means of capacity factor:
C F T , m o n t h = d a y = 1 e o m m o n t h S Y d ( T , d a y ) e o m m o n t h · 24
where:
CF Capacity factor;
T Offshore Baltic area (B) or onshore (P);
eom Monthly number of days, days/month.

3. Results and Discussion

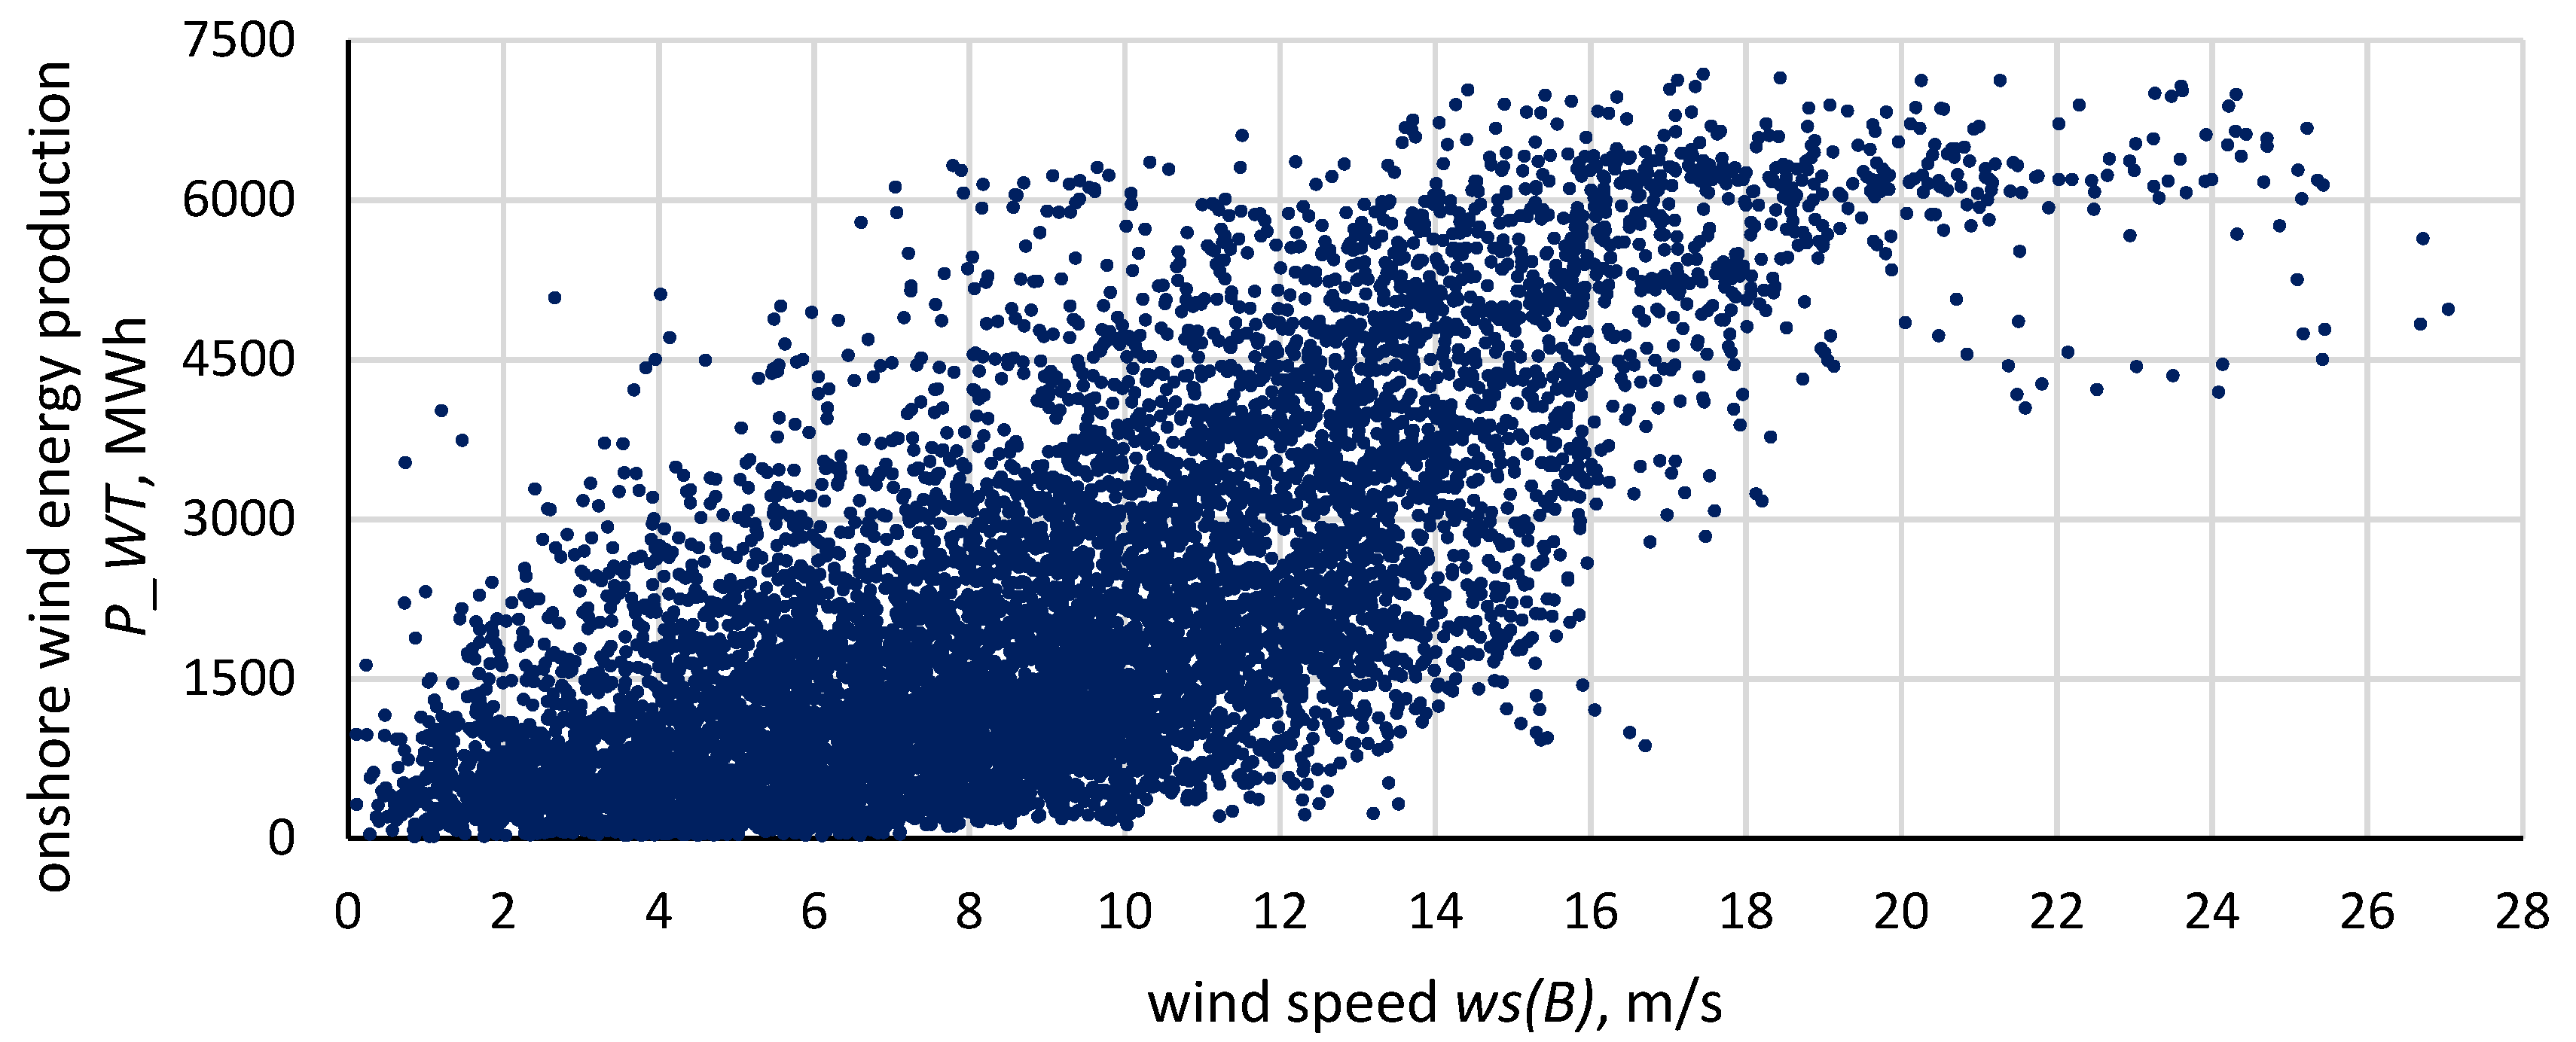
Using Equation (2) and the ERA5 data, the wind speed for the Baltic Sea offshore area was determined. These results were matched with the hourly energy production achieved for onshore wind in Poland. The values thus obtained for the period 1 January 2022–31 December 2022 are shown in Figure 5.
In the figure above, a relatively high convergence of values can be seen; the fit coefficient, R2, is about 0.6. For wind speeds over the Baltic area higher than 12 m/s (rated power), the hourly energy production from the onshore turbine is higher than 1500 MWh in 99% of cases.
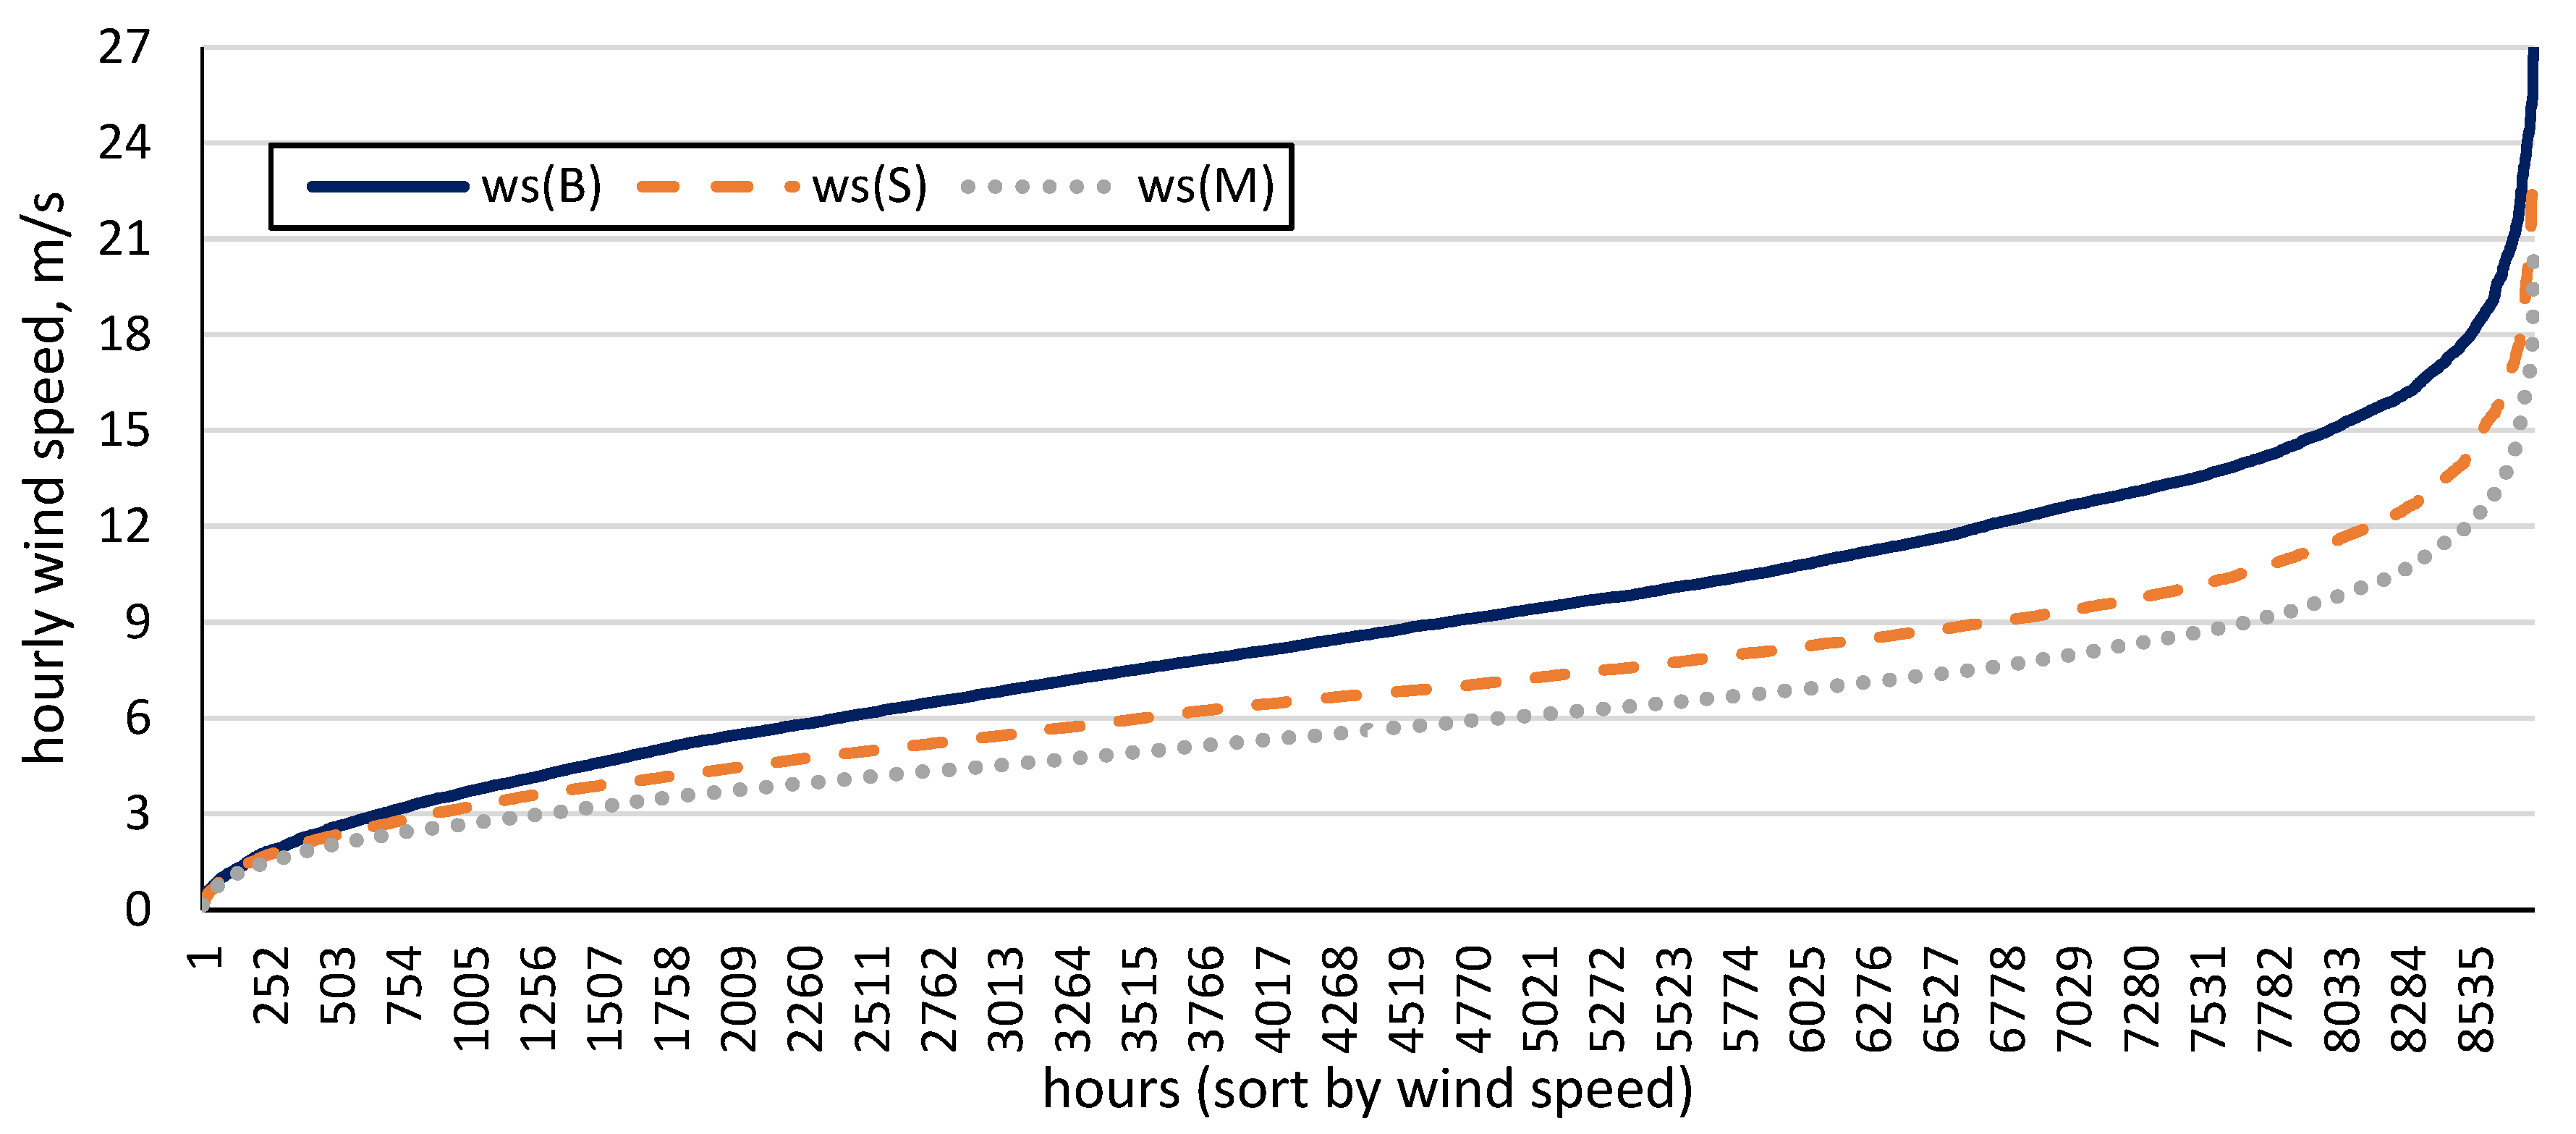
Additionally, based on Equation (2), the wind speed was determined for Slawno city (Zachodnio Pomorskie voivodeship—Seaside district, 100 m above the ground, geographical coordinates: 54.25° N, 16.75° E) and for the Masovian region (central Poland 52.25° N 21.0° E). A comparison of wind speeds in the form of a ranked velocity diagram for the offshore Baltic Sea, Slawno and Masovian region is presented in Figure 6.
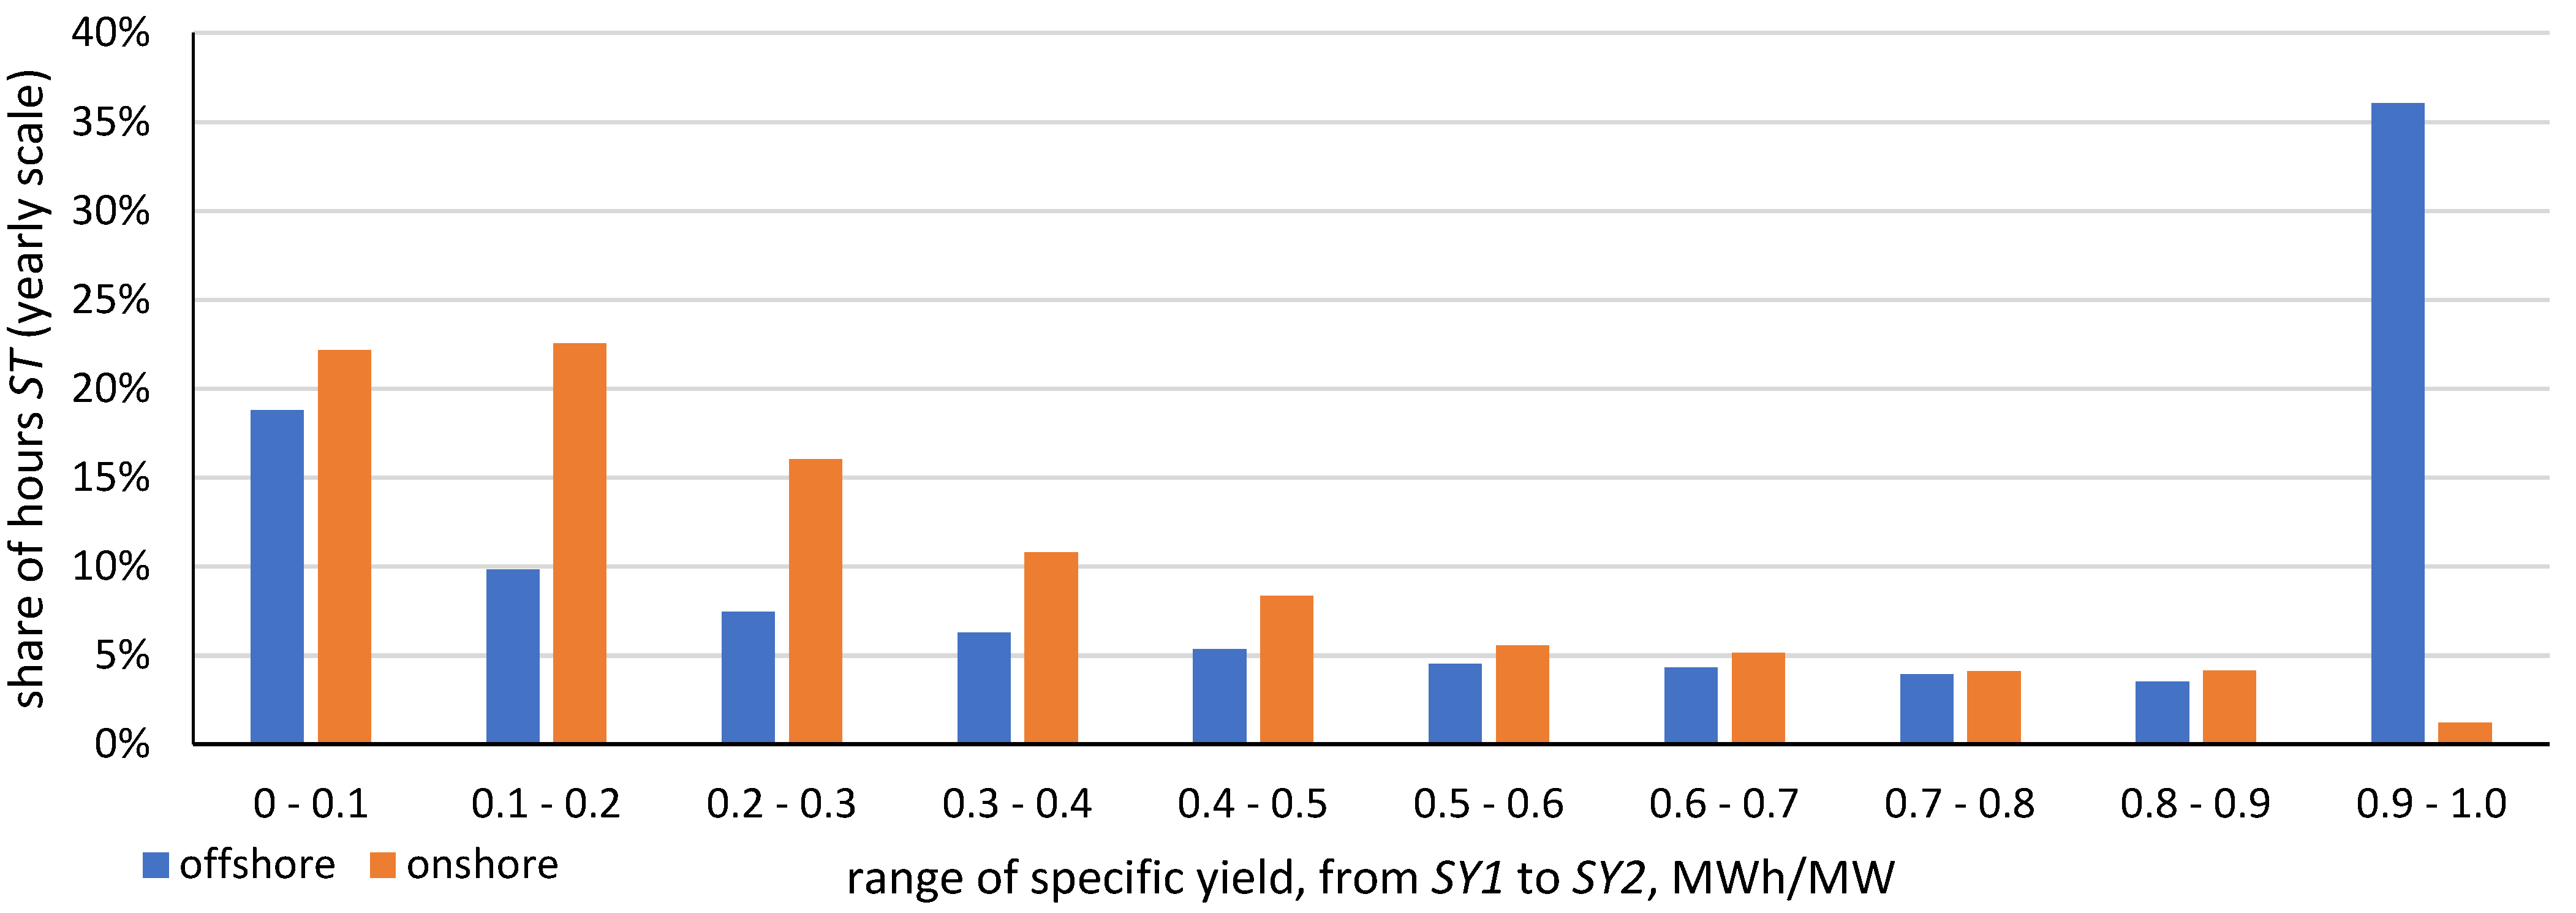
For the Masovian region, 57% of the wind speed hours were lower than 6 m/s; for Slawno it was 41%, and for offshore it was 27%. For wind speeds in excess of 12 m/s for the offshore region, it was more than 2000 h, for Slawno it was 600 h and for the Masovian region it was only 250 h. By applying the results to hourly wind-specific yield, a comparison in the format of share of time ST was obtained (Figure 7).
An offshore-specific yield of more than 0.9 MWh/MW would have occurred in 36.0% of the hours, with about 1.2% onshore. In comparison, a productivity of less than 0.1 MWh/MW occurred for 22.1% of the hours in the analyzed period for onshore and 18.8% of the hours for offshore.
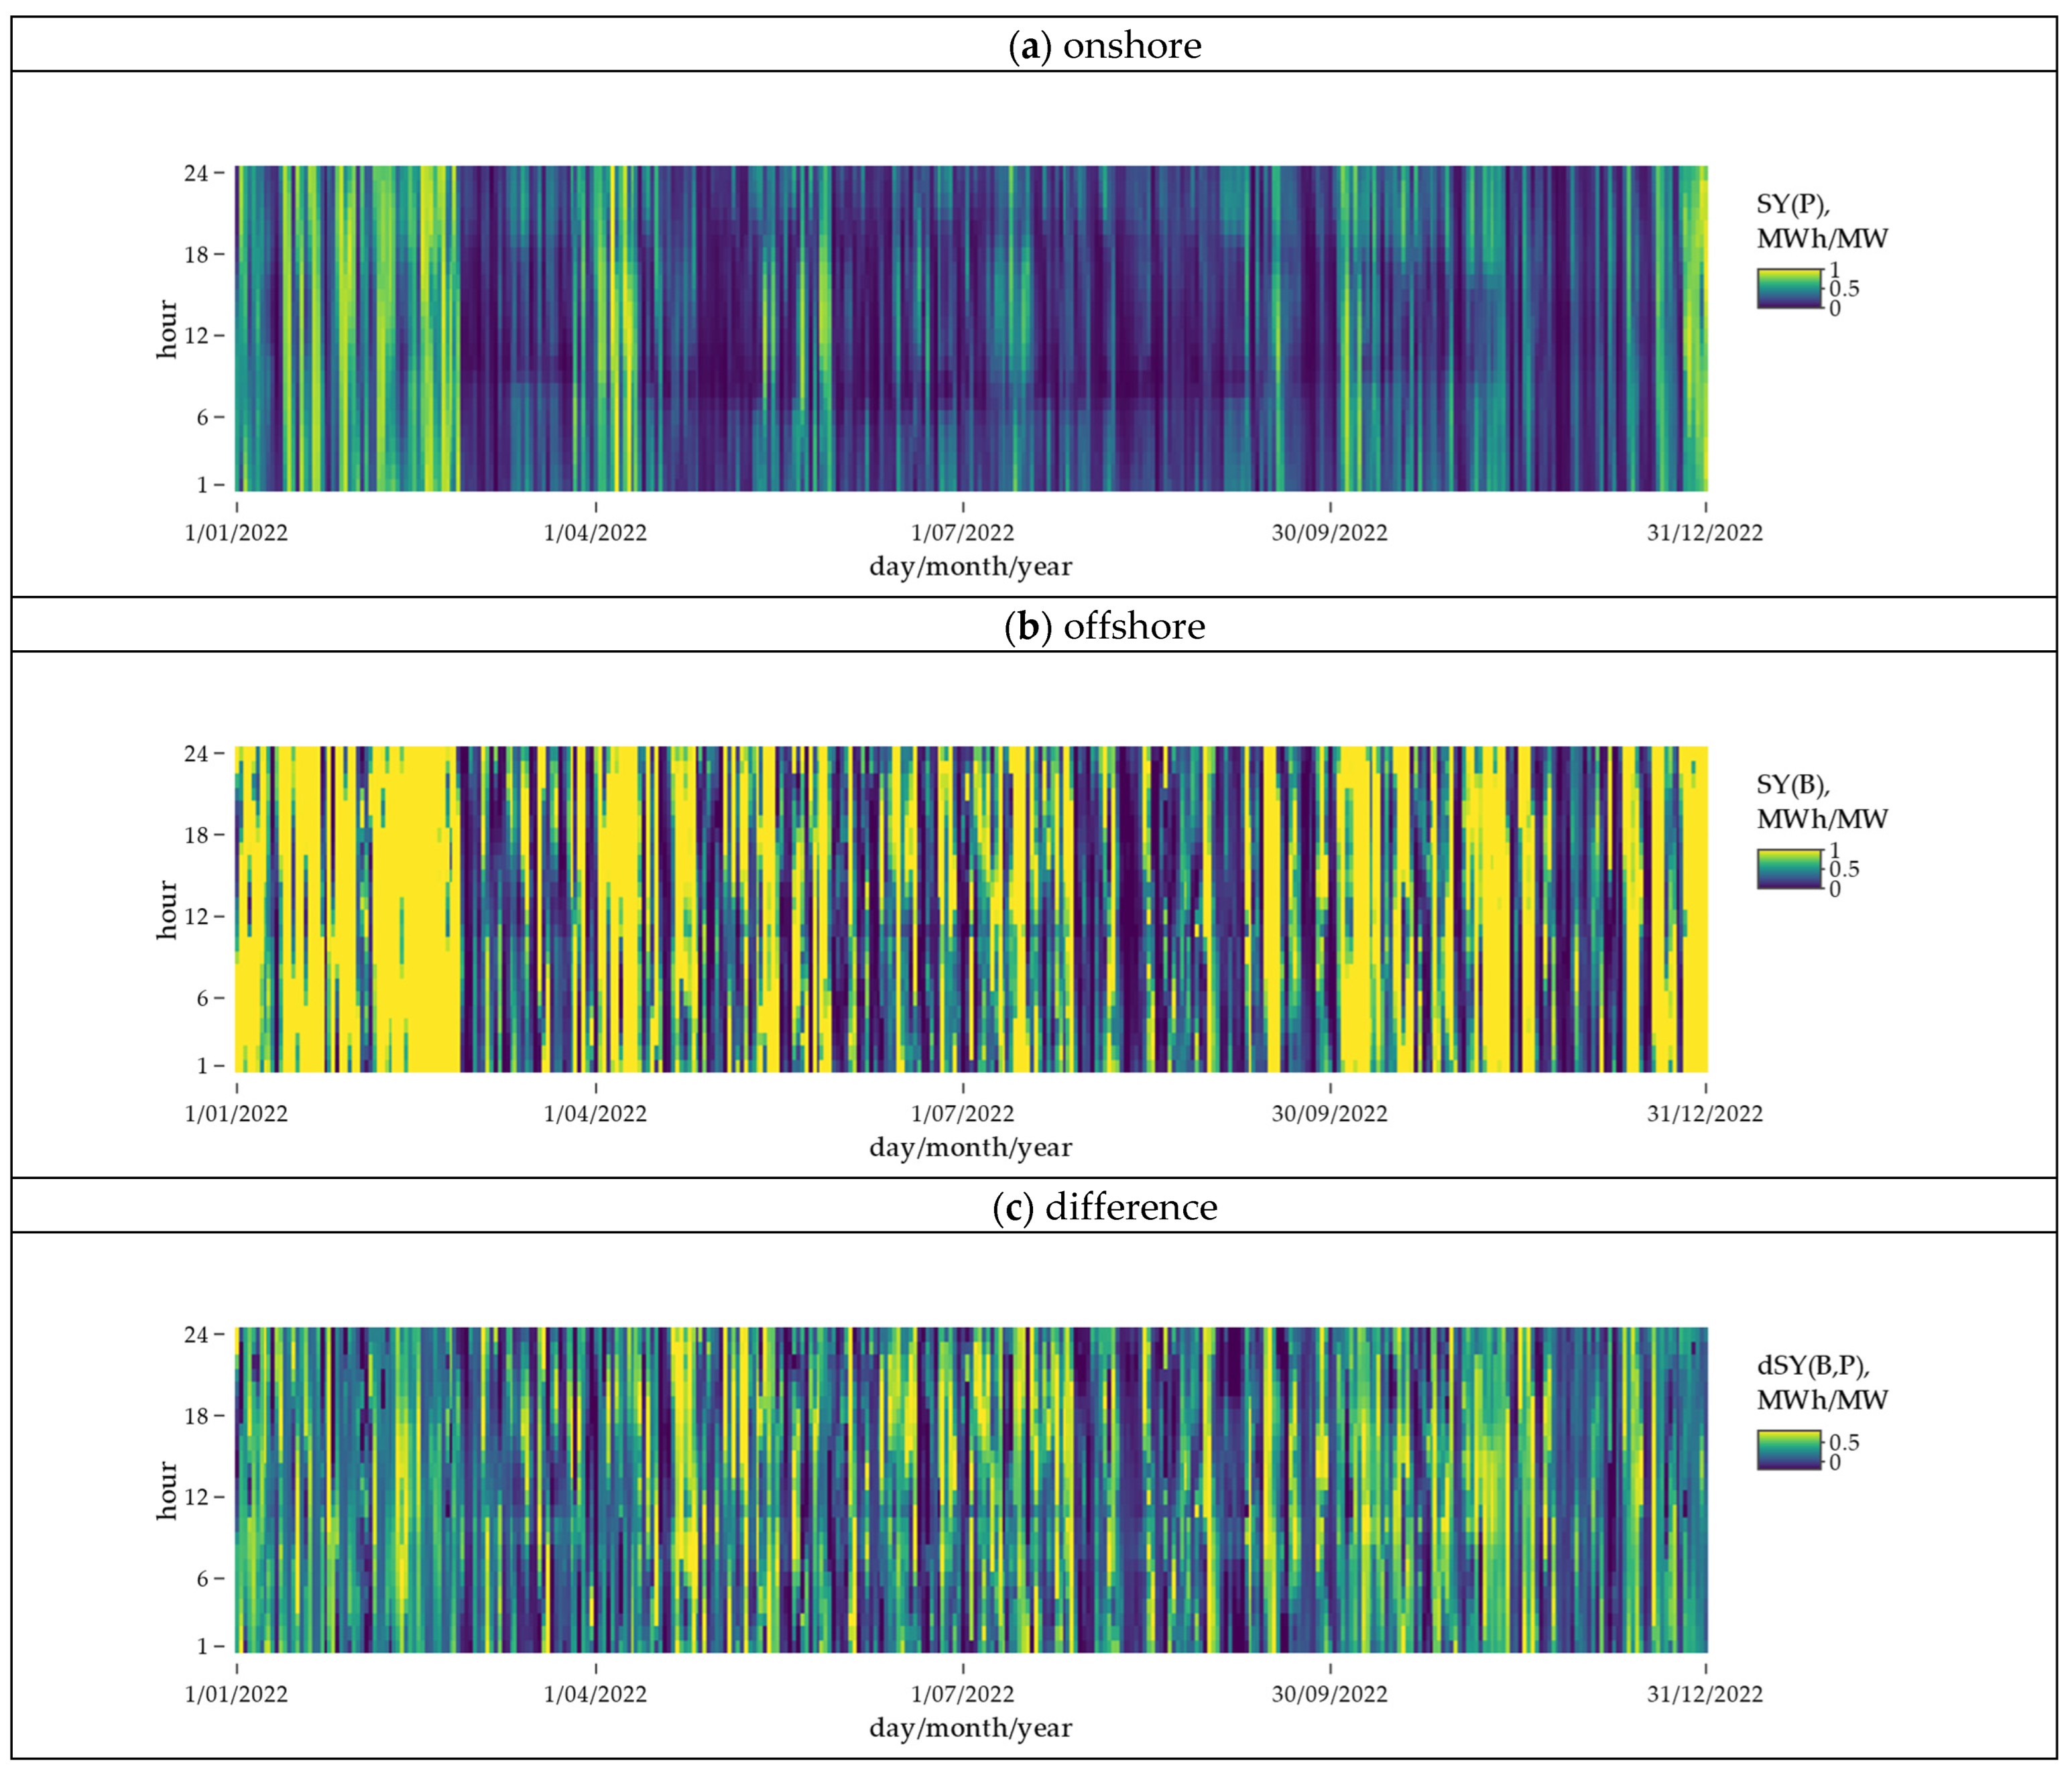
The hourly productivity for onshore (real value, SY(P)) and offshore (from simulation, SY(B)) and the difference (dSY) between these productivities are depicted in Figure 8.
The highest hourly productivity for offshore wind would occur in the first months of 2022. A similar situation occurred for onshore wind turbines. Significantly, the smallest differences in hourly productivity would occur in the summer of 2022. The results from Figure 8 aggregated to daily totals (based on Equations (4) and (6)) are depicted in Figure 9.
In January and February, relatively high productivity was observed from the wind sources; in the following months, only occasionally high productivity was achieved, more often for offshore wind. The fit coefficient R2 was 0.53.
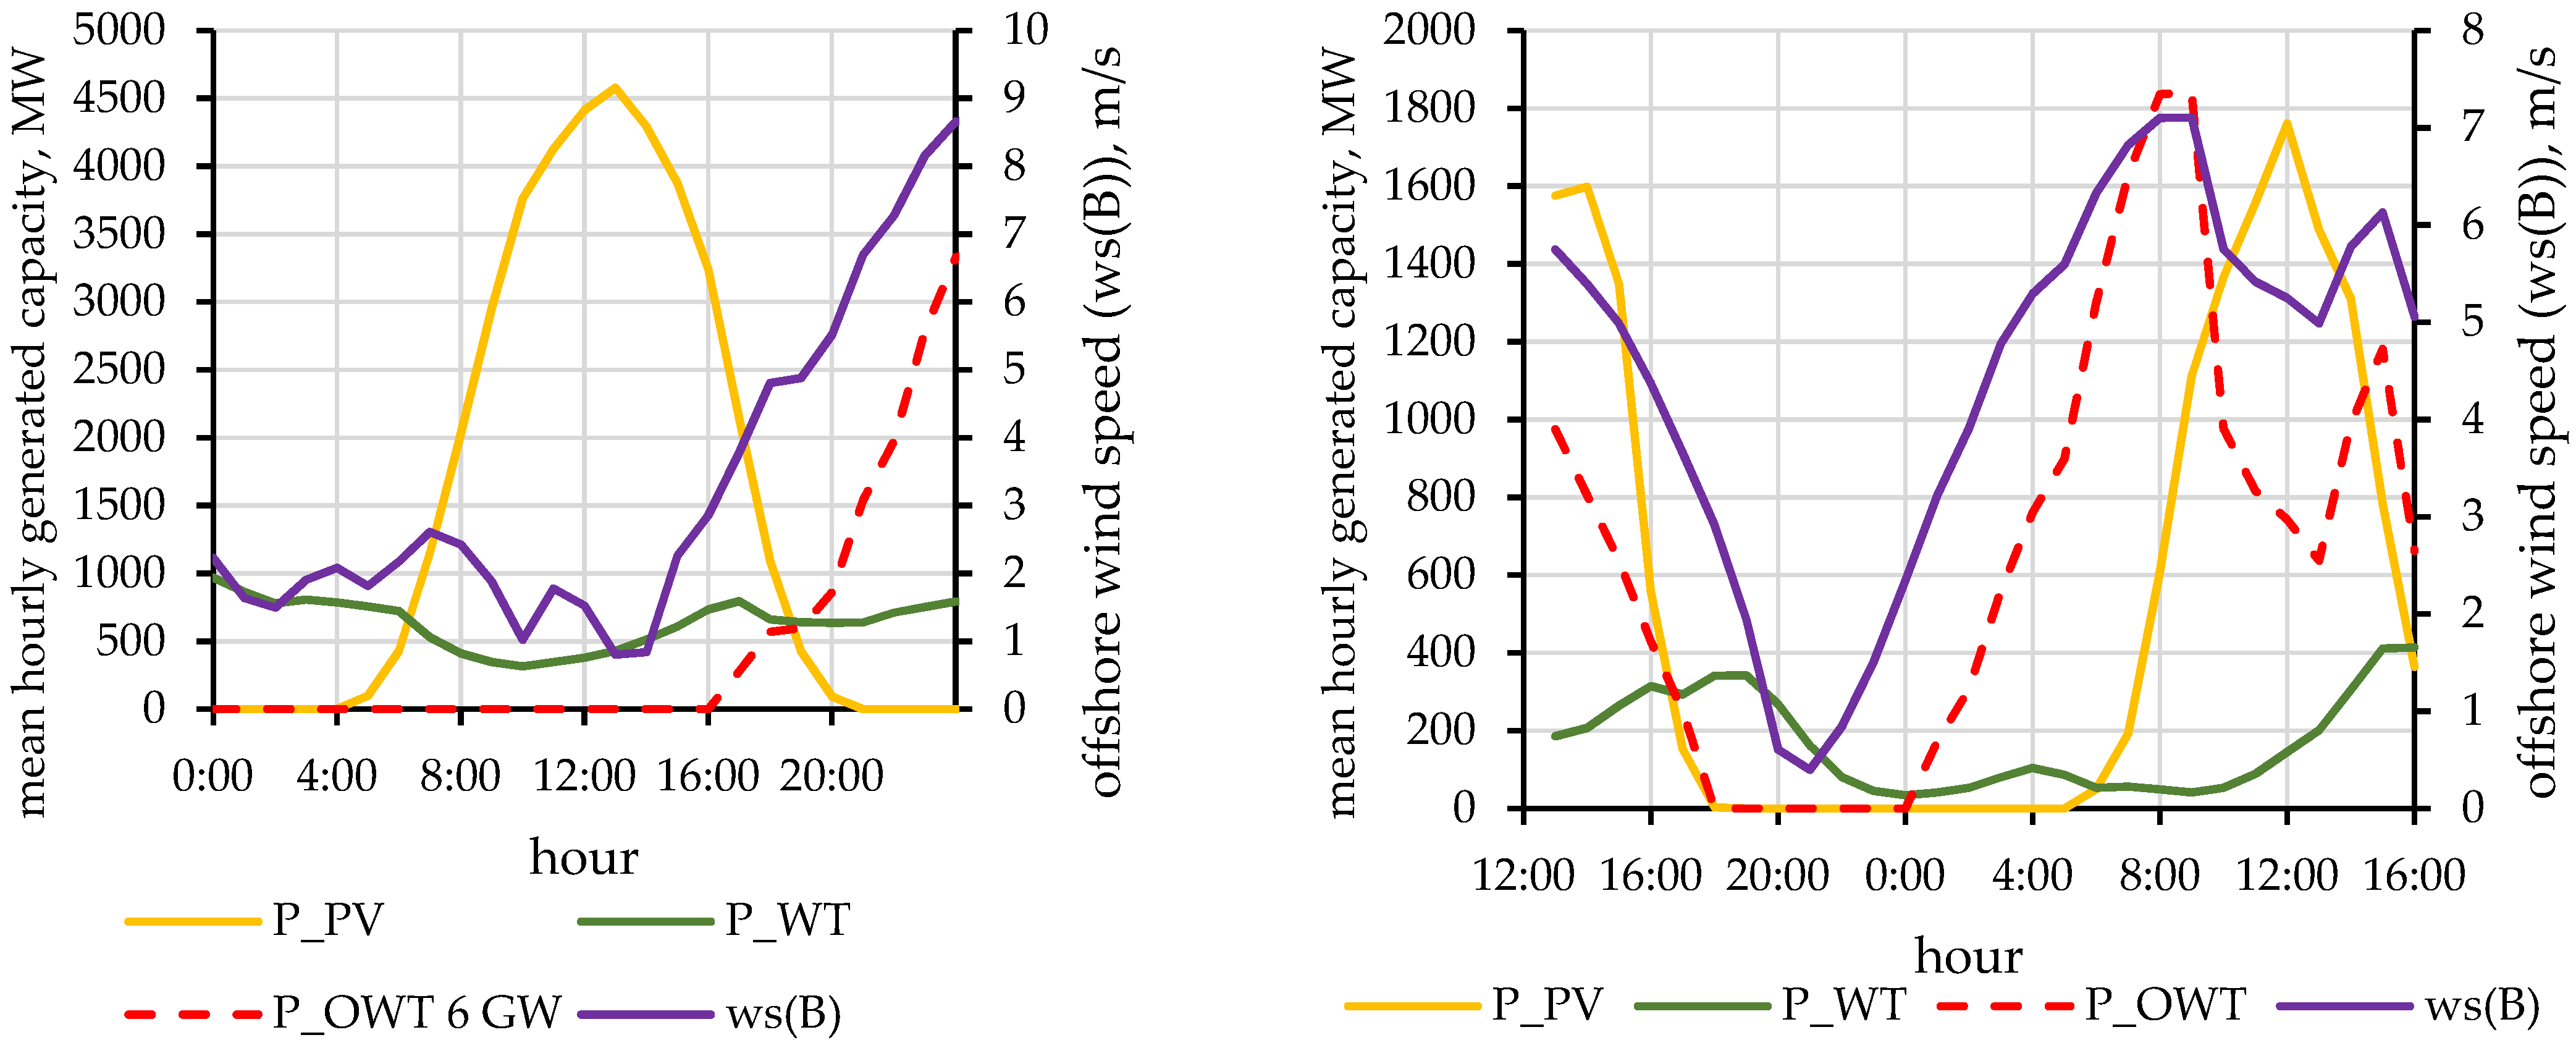
In addition, calculations were made for selected days in 2022. Sample energy production calculations (from onshore and offshore wind, and also photovoltaic) for 5 March 2022 and for 1 August are given in Figure 10.
On 1 August 2022, during the evening, the peak energy consumption (hours 18–22) and potential energy production from offshore wind would increase to complement the decreasing amount of energy production from solar PV (the amount would depend on the issue of scale—installed capacity). During this time, there was also a reduction in available power from onshore wind (from 795 MW to 636 MW). In addition, it was calculated that on that day, by 4pm, the potential energy production from offshore wind would be zero (offshore wind speed values lower than cut-in speed).
On 5 March 2022, during the evening, the peak energy consumption (hours 18–22) and the potential energy production from offshore wind would be zero. At the same time, the actual energy production from solar PV was zero, and the hourly energy production from onshore wind was between 81 and 342 MWh. In contrast, during the morning peak consumption (hours 7–10, 6 March 2022), the potential energy production from offshore wind (despite the lower installed capacity) would exceed the total production from onshore wind. For hour 8 (6 March), there would be 321 MWh of energy from offshore wind and 49 MWh of energy from onshore wind.
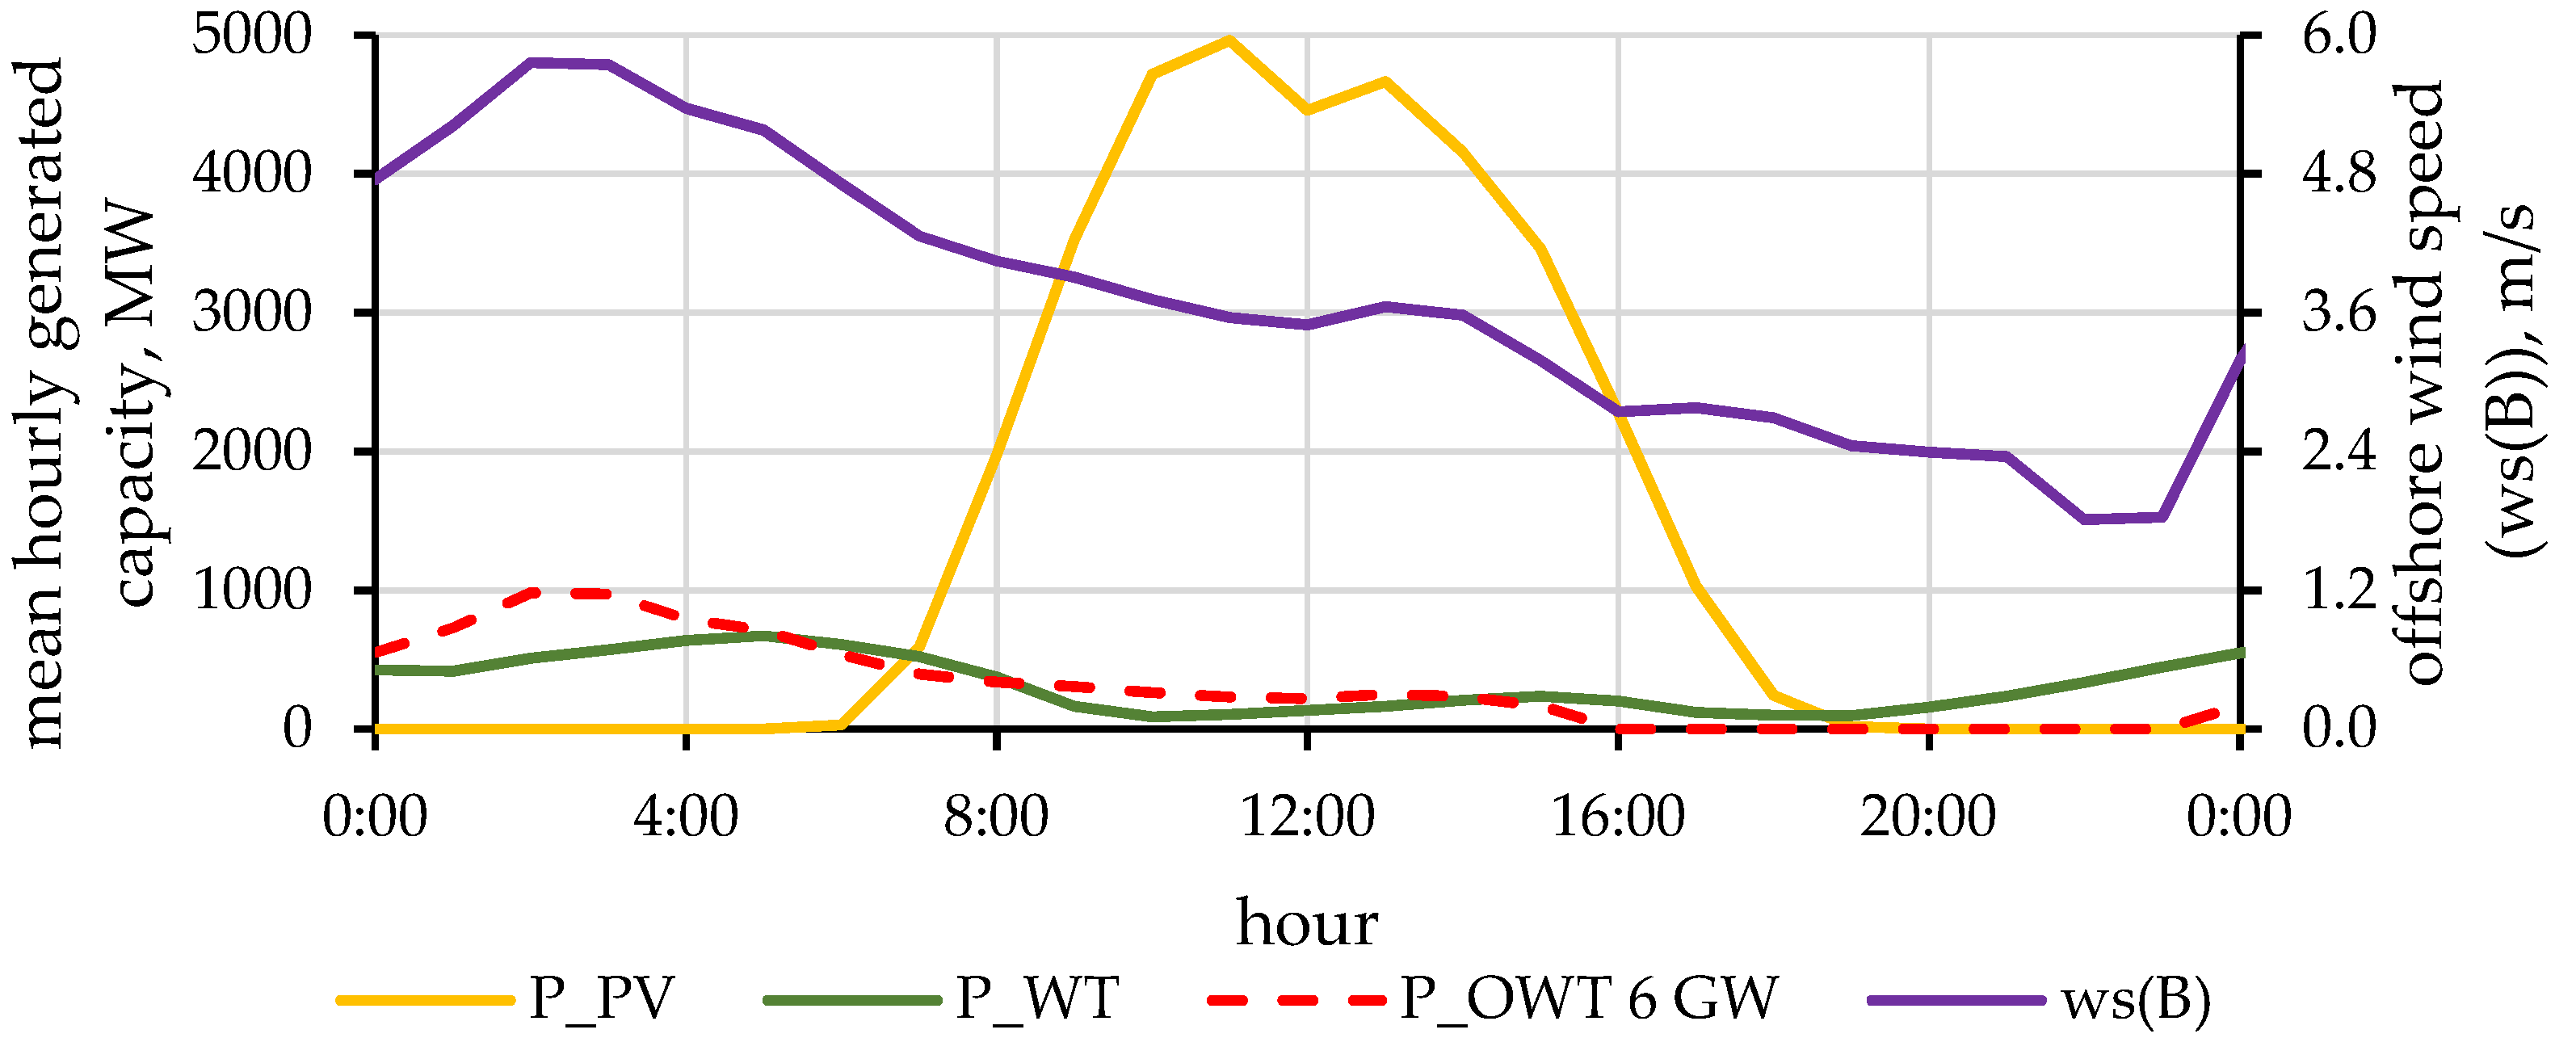
The results of the simulation for 23 September 2022, the day on which the capacity market emergency alert was announce by the Transmission System Operator in Poland [37], are presented in Figure 11.
During real emergency hours on the capacity market, i.e., 19:00–21:00, on 23 September 2022, energy generation from onshore wind was approximately 100 MWh (i.e., less than 2% of the TNP nominal capacity). Energy production from solar PV was zero, and the calculated potential production from offshore wind was zero MWh/MW as well.
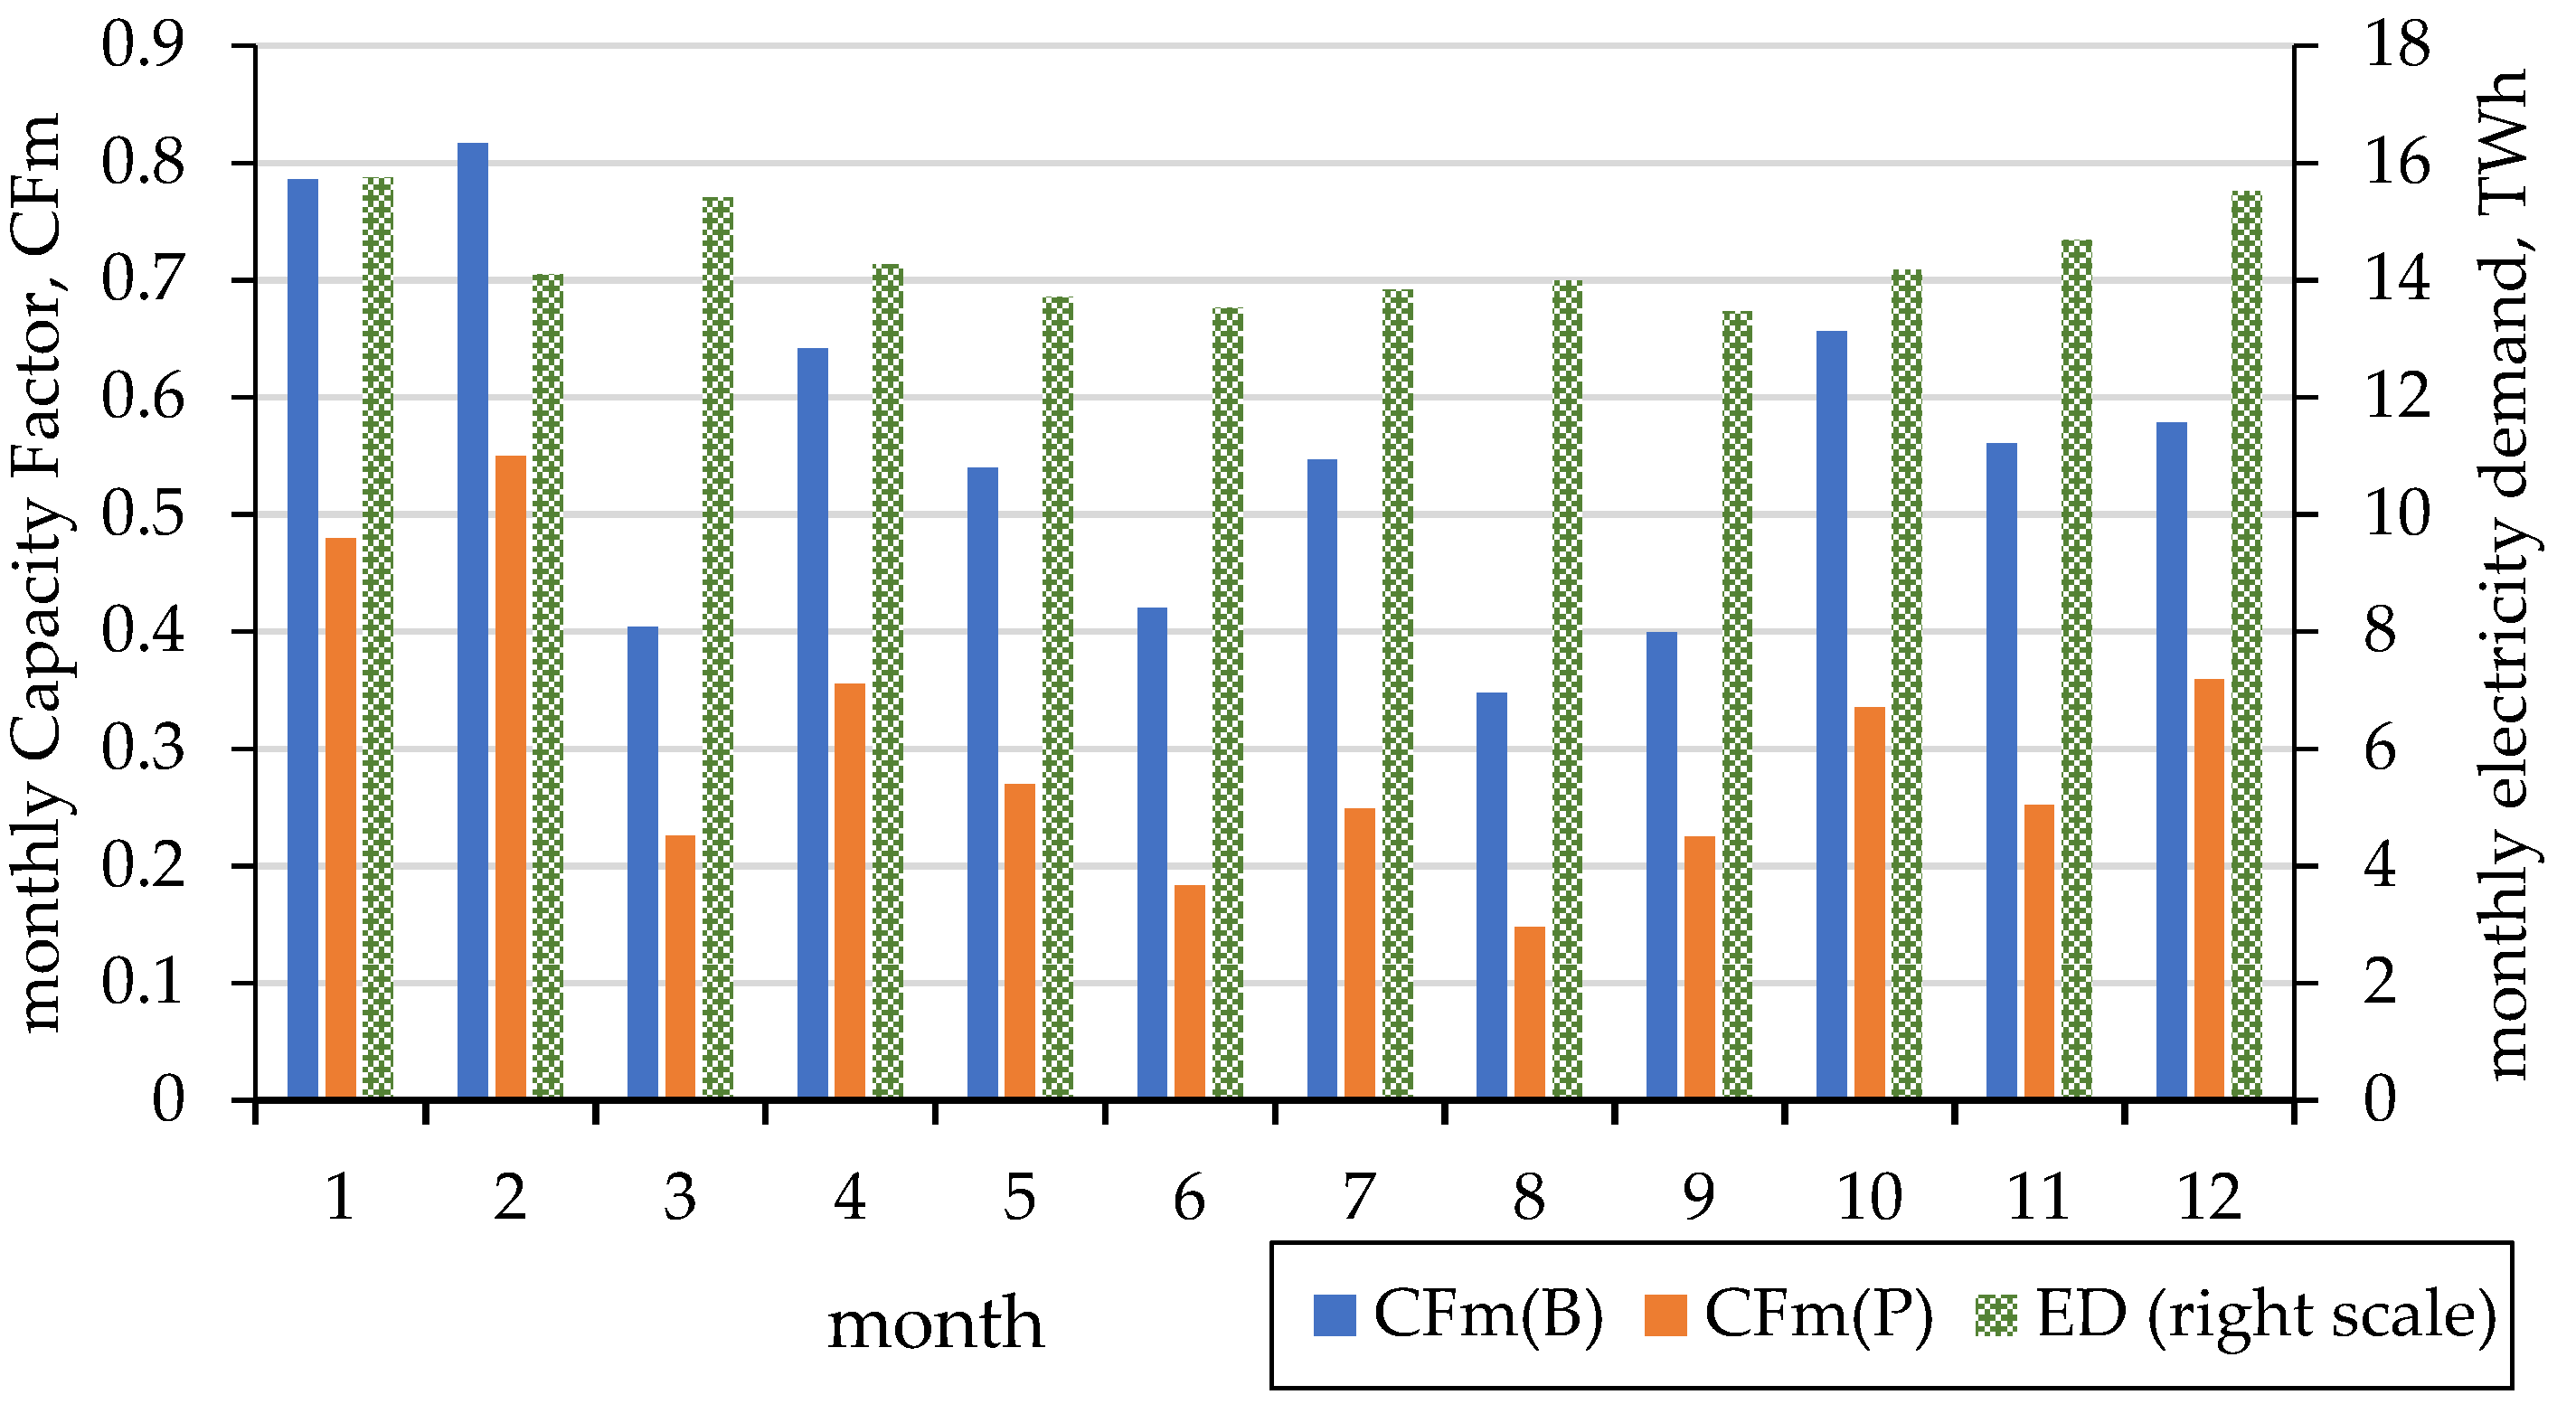
Based on the formulae shown in Section 2.4, the capacity factor was 25.5% in 2021 (CF, the value of energy production, was 15.2 TWh, with an average installed capacity of 6.8 GW); for 2022, details on a monthly scale are presented in Figure 12.
The highest value of the Capacity Factor for onshore wind was observed in February 2022 (55%). The simulated value of the Capacity Factor for offshore wind was also the highest in February (almost 82%). The lowest value was observed in August: 15% for onshore wind and 35% for offshore wind. The highest electricity demand was observed in January, and the lowest was observed in September. There is an observable dependence that in the months with higher demand, the capacity factor value is also higher.
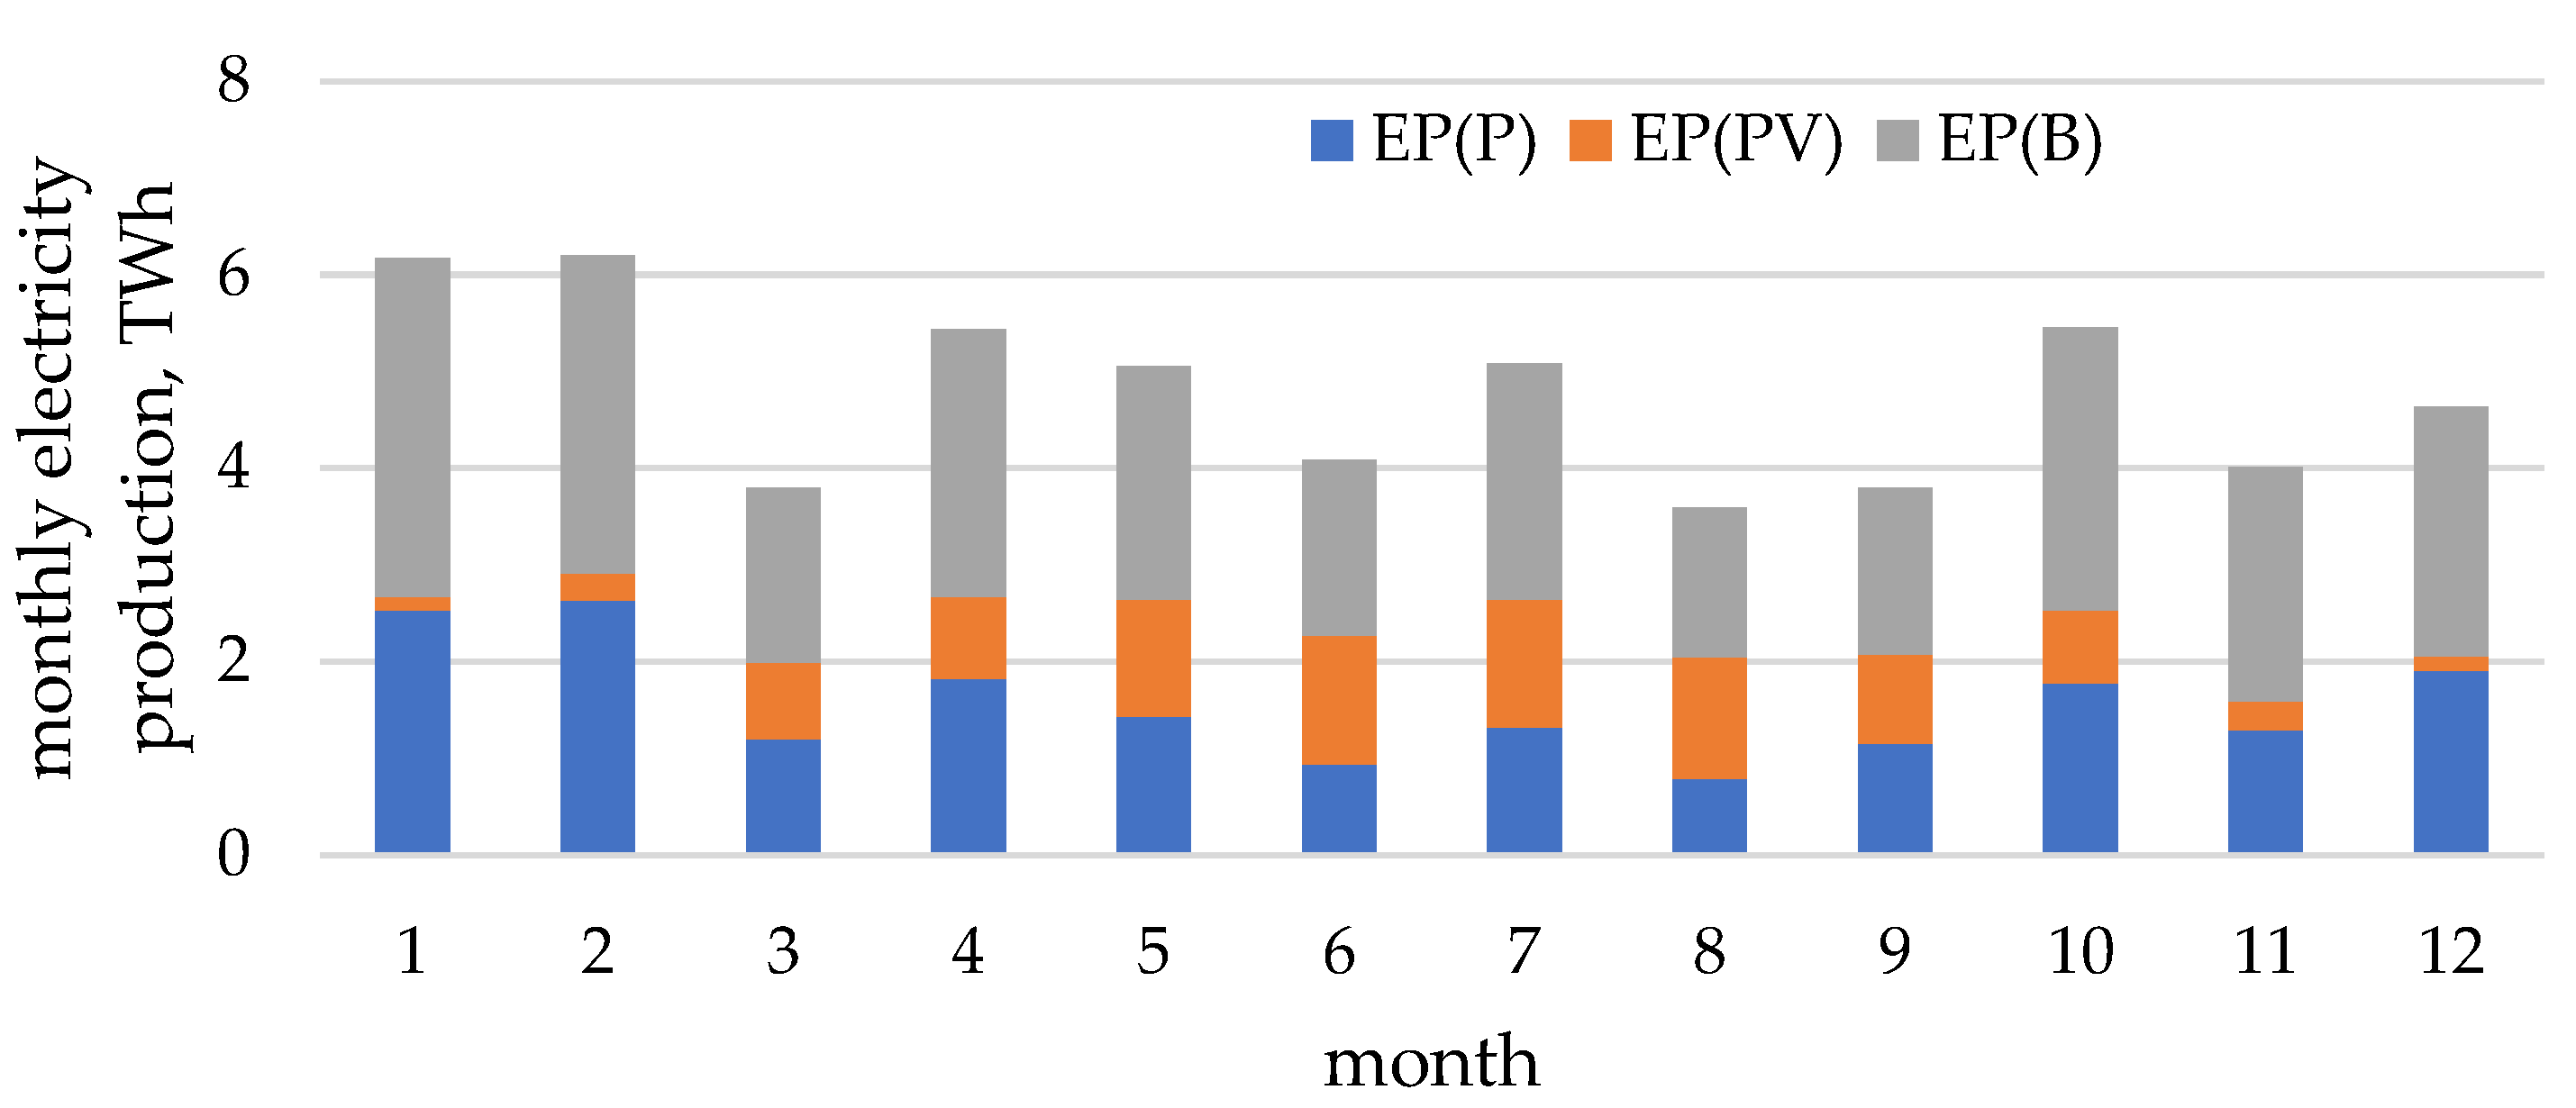
The total amount of generated electricity from PV and wind onshore and wind offshore compared to energy demand is shown in Figure 13.
Total energy production from 6 GW offshore wind can produced 29.2 TWh/year, based on the 2022 ERA5 wind speed data. This means that based on the Kulpa et al. methodology [38], CO2 emissions are reduced by 22.4 million Mg, and use of hard coal is reduced by 13.4 million Mg.

4. Conclusions

The offshore wind sector is developing dynamically in Europe, while offshore wind investments in Poland are only just beginning. The first planned offshore project will be commissioned after 2025. Currently, support for offshore wind projects has been established in Poland and covers 6 GW of installed capacity in the first stage. Based on these expectations, this research was conducted based on the potential impact of such capacity on the power system.
In Baltic Sea conditions, offshore wind is distinguished by its high-capacity factor compared to onshore, with a capacity factor of 30.1% for onshore wind and a potential of 55.6% for offshore wind. This shows a clear advantage for offshore over onshore.
Due to the variability of wind speeds, the guaranteed capacity of wind power plants is considerably lower than that of other conventional electricity generation technologies. Nevertheless, a certain amount of installed wind power capacity contributes to the system’s power demand.
During the emergency period examined in the research, with a potential of 6 GW of offshore capacity planned for construction, these sources did not significantly improve the security of the energy supply. In the emergency period, these sources did not supply power to the system due to weather conditions such as low wind speeds that fell below the cut-in wind speed for the examined Baltic Sea location.
However, in the period of the year considered in this study, these sources will generate electricity that will reduce emissions by approximately 22.4 million metric tons of CO2 by eliminating the burning of 13.4 million metric tons of hard coal on an annual basis.
In the wind speed model considered, based on ERA5, the potential electricity production from these sources will be 29.2 TWh/year (2022 data), representing a 17% contribution to energy demand. At this scale, the 6 GW of installed capacity of these sources will exceed the installed capacity of PV and onshore combined today by 1 TWh (about 12 GW installed in PV sources and about 8 GW in onshore wind). Both onshore and offshore wind are ways to reduce emissions, save fossil fuels, and reduce energy costs.
The further direction of research will be
  • A detailed analysis of the influence of the wind turbine high for productivity factor;
  • Economic analyses—comparison between onshore and offshore wind installation.

Author Contributions

Methodology, P.O. and T.S.; Validation, T.S.; Formal analysis, T.S.; Investigation, P.O.; Data curation, P.O.; Writing—original draft, P.O. and T.S.; Writing—review & editing, T.S.; Visualization, T.S.; Funding acquisition, P.O. All authors have read and agreed to the published version of the manuscript.

Funding

This research received no external funding.

Conflicts of Interest

The author declares no conflict of interest.

References

  1. Olczak, P. Magazynowanie Energii Elektrycznej w Prosumenckich Mikroinstalacjach Fotowoltaicznych; Mokrzycki, E., Ed.; IGSMiE PAN: Kraków, Poland, 2022. [Google Scholar]
  2. Allan, G.; Gilmartin, M.; McGregor, P.; Swales, K. Levelised costs of Wave and Tidal energy in the UK: Cost competitiveness and the importance of “banded” Renewables Obligation Certificates. Energy Policy 2011, 39, 23–39. [Google Scholar] [CrossRef]
  3. Dzikuć, M.; Gorączkowska, J.; Piwowar, A.; Dzikuć, M.; Smoleński, R.; Kułyk, P. The analysis of the innovative potential of the energy sector and low-carbon development: A case study for Poland. Energy Strategy Rev. 2021, 38, 100769. [Google Scholar] [CrossRef]
  4. Olczak, P.; Jaśko, P.; Kryzia, D.; Matuszewska, D.; Fyk, M.I.; Dyczko, A. Analyses of duck curve phenomena potential in polish PV prosumer households’ installations. Energy Rep. 2021, 7, 4609–4622. [Google Scholar] [CrossRef]
  5. Pieczarko, R.; Sołtysik, M. Analysis of the impact of wind sources generation on the level of electricity prices on the SPOT market. Przegląd Elektrotechniczny 2017, 93. [Google Scholar]
  6. Malec, M.; Kinelski, G.; Czarnecka, M. The Impact of COVID-19 on Electricity Demand Profiles: A Case Study of Selected Business Clients in Poland. Energies 2021, 14, 5332. [Google Scholar] [CrossRef]
  7. Kulpa, J.; Olczak, P.; Surma, T.; Matuszewska, D. Comparison of Support Programs for the Development of Photovoltaics in Poland: My Electricity Program and the RES Auction System. Energies 2022, 15, 121. [Google Scholar] [CrossRef]
  8. Dzikuć, M.; Piwowar, A.; Dzikuć, M. The importance and potential of photovoltaics in the context of low-carbon development in Poland. Energy Storage Sav. 2022, 1, 162–165. [Google Scholar] [CrossRef]
  9. EU Market Outlook for Solar Power, 2020–2024. Available online: https://resources.solarbusinesshub.com/solar-industry-reports/item/eu-market-outlook-for-solar-power-2020-2024 (accessed on 16 January 2023).
  10. IRENA Renewable Capacity Statistics. 2022. Available online: https://irena.org/-/media/Files/IRENA/Agency/Publication/2022/Apr/IRENA_RE_Capacity_Statistics_2022.pdf (accessed on 16 January 2023).
  11. Enerdata Global Wind Capacities Increased by 94 GW in 2021 to 837 GW. Available online: https://www.enerdata.net/publications/daily-energy-news/global-wind-capacities-increased-94-gw-2021-837-gw.html (accessed on 12 September 2022).
  12. Olczak, P.; Żelazna, A.; Matuszewska, D.; Olek, M. The “My Electricity” Program as One of the Ways to Reduce CO2 Emissions in Poland. Energies 2021, 14, 7679. [Google Scholar] [CrossRef]
  13. Kulpa, J.; Olczak, P.; Stecuła, K.; Sołtysik, M. The Impact of RES Development in Poland on the Change of the Energy Generation Profile and Reduction of CO2 Emissions. Appl. Sci. 2022, 12, 11064. [Google Scholar] [CrossRef]
  14. PSE Praca KSE—Generacja Źródeł Wiatrowych i Fotowoltaicznych. Doba Handlowa: 2022-07-25. Available online: https://www.pse.pl/dane-systemowe/funkcjonowanie-kse/raporty-dobowe-z-pracy-kse/generacja-zrodel-wiatrowych (accessed on 16 January 2023).
  15. Kryzia, D.; Olczak, P.; Wrona, J.; Kopacz, M.; Kryzia, K.; Galica, D. Dampening Variations in Wind Power Generation Through Geographical Diversification. In IOP Conference Series: Earth and Environmental Science; IOP Publishing: Bristol, UK, 2019; Volume 214. [Google Scholar]
  16. Piwowar, A.; Dzikuć, M.; Dzikuć, M. The potential of wind energy development in Poland in the context of legal and economic changes. In Proceedings of the 17th Conference on Sustainable Development of Energy, Water and Environment Systems (SDEWES 2022), Paphos, Cyprus, 6–10 November 2022. [Google Scholar]
  17. Dobrzycki, A.; Roman, J. Correlation between the Production of Electricity by Offshore Wind Farms and the Demand for Electricity in Polish Conditions. Energies 2022, 15, 3669. [Google Scholar] [CrossRef]
  18. Paska, J.; Surma, T. Elektrownie wiatrowe źródłem energii elektrycznej, czy również mocy? Rynek Energii 2015, 2, 51–58. [Google Scholar]
  19. Paska, J.; Surma, T.; Terlikowski, P.; Zagrajek, K. Electricity generation from renewable energy sources in Poland as a part of commitment to the polish and EU energy policy. Energies 2020, 13, 4261. [Google Scholar] [CrossRef]
  20. Shojaeiyan, S.; Niknam, T.; Nafar, M. A novel bio-inspired stochastic framework to solve energy management problem in hybrid AC-DC microgrids with uncertainty. Int. J. Bio-Inspired Comput. 2021, 18, 165–175. [Google Scholar] [CrossRef]
  21. Mu, G.; Wu, F.; Zhang, X.; Fu, Z.; Xiao, B. Analytic Mechanism for the Cumulative Effect of Wind Power Fluctuations from Single Wind Farm to Wind Farm Cluster. CSEE J. Power Energy Syst. 2022, 8, 1290–1301. [Google Scholar]
  22. Kou, L.; Li, Y.; Zhang, F.; Gong, X.; Hu, Y.; Yuan, Q.; Ke, W. Review on Monitoring, Operation and Maintenance of Smart Offshore Wind Farms. Sensors 2022, 22, 2822. [Google Scholar] [CrossRef]
  23. Kaszyński, P.; Komorowska, A.; Zamasz, K.; Kinelski, G.; Kamiński, J. Capacity Market and (the Lack of) New Investments: Evidence from Poland. Energies 2021, 14, 7843. [Google Scholar] [CrossRef]
  24. Hayes, L.; Stocks, M.; Blakers, A. Accurate long-term power generation model for offshore wind farms in Europe using ERA5 reanalysis. Energy 2021, 229, 120603. [Google Scholar] [CrossRef]
  25. Hallgren, C.; Arnqvist, J.; Ivanell, S.; Körnich, H.; Vakkari, V.; Sahlée, E. Looking for an Offshore Low-Level Jet Champion among Recent Reanalyses: A Tight Race over the Baltic Sea. Energies 2020, 13, 3670. [Google Scholar] [CrossRef]
  26. Komorowska, A.; Benalcazar, P.; Kamiński, J. Evaluating the competitiveness and uncertainty of offshore wind-to-hydrogen production: A case study of Poland. Int. J. Hydrogen Energy 2023. [Google Scholar] [CrossRef]
  27. Rogus, R.; Castro, R.; Sołtysik, M. Comparative Analysis of Wind Energy Generation Forecasts in Poland and Portugal and Their Influence on the Electricity Exchange Prices. Inventions 2020, 5, 35. [Google Scholar] [CrossRef]
  28. Talarek, K.; Knitter-Piątkowska, A.; Garbowski, T. Wind Parks in Poland—New Challenges and Perspectives. Energies 2022, 15, 7004. [Google Scholar] [CrossRef]
  29. Pronińska, K.; Księżopolski, K. Baltic Offshore Wind Energy Development—Poland’s Public Policy Tools Analysis and the Geostrategic Implications. Energies 2021, 14, 4883. [Google Scholar] [CrossRef]
  30. Gaertner, E.; Rinker, J.; Sethuraman, L.; Zahle, F.; Anderson, B.; Barter, G.; Abbas, N.; Meng, F.; Bortolotti, P.; Skrzypinski, W.; et al. Definition of the IEA Wind 15-Megawatt Offshore Reference Wind Turbine Technical Report; NREL: Denver, CO, USA, 2020. [Google Scholar]
  31. Copernicus ERA5 Hourly Data on Single Levels from 1979 to Present. Available online: https://cds.climate.copernicus.eu/cdsapp#!/dataset/reanalysis-era5-single-levels?tab=overview (accessed on 16 March 2022).
  32. ECMWF 2 Metre Temperature. Available online: https://apps.ecmwf.int/codes/grib/param-db?id=167 (accessed on 3 September 2022).
  33. Floors, R.; Nielsen, M. Estimating Air Density Using Observations and Re-Analysis Outputs for Wind Energy Purposes. Energies 2019, 12, 2038. [Google Scholar] [CrossRef] [Green Version]
  34. PSE Dane Systemowe. Available online: https://www.pse.pl/dane-systemowe (accessed on 15 December 2022).
  35. Energy.Instrat.pl Generacja Energii Według Technologii. Available online: https://energy.instrat.pl/generation_by_fuel (accessed on 16 January 2023).
  36. European Centre for Medium-Range Weather Forecasts (ECMWF) ERA5. Available online: https://confluence.ecmwf.int/display/CUSF/ERA5+hourly+data+on+single+level+and+ERA5+hourly+on+pressure+levels+available+again+from+the+CDS?src=contextnavpagetreemode (accessed on 28 August 2022).
  37. MKiŚ Komunikat Ministra Klimatu i Środowiska dot. Ogłoszenia Okresów Zagrożenia na Rynku Mocy. Available online: https://www.gov.pl/web/klimat/komunikat-ministra-klimatu-i-srodowiska-dot-ogloszenia-stanu-zagrozenia-na-rynku-mocy (accessed on 4 January 2023).
  38. Kulpa, J.; Kamiński, P.; Stecuła, K.; Prostański, D.; Matusiak, P.; Kowol, D.; Kopacz, M.; Olczak, P. Technical and Economic Aspects of Electric Energy Storage in a Mine Shaft—Budryk Case Study. Energies 2021, 14, 7337. [Google Scholar] [CrossRef]
Figure 1. Wind turbine and photovoltaic capacity in world and Europe [9,10].
Applsci 13 04258 g001
Figure 2. Hourly onshore wind energy production for 6 March (the lowest daily sum of wind energy production) and for 21 February (the highest daily sum of wind energy production), 2022 year, Poland [14].
Applsci 13 04258 g002
Figure 3. Simplified algorithm of calculation potential wind energy production for each hour.
Applsci 13 04258 g003
Figure 4. Algorithm of calculation unit onshore energy production for each hour based on historical data energy production and onshore wind capacity (per month).
Applsci 13 04258 g004
Figure 5. Onshore wind energy production as a function of offshore wind speed ws(B), Poland, 2022. Source: own calculation based on [14,36].
Applsci 13 04258 g005
Figure 6. Distribution of hours with wind speed data in 2022 for Baltic sea: ws(B), Slawno ws(S) and Masovian Region ws(M).
Applsci 13 04258 g006
Figure 7. Share of time ST in 2022 with ranges of specific yield from SY1 to SY2.
Applsci 13 04258 g007
Figure 8. Hourly value of: (a) real wind energy productivity for onshore wind SY(P); (b) theoretical offshore wind energy productivity, SY(B); (c) difference of wind offshore and onshore energy production—specific yield (dSY).
Applsci 13 04258 g008
Figure 9. Wind energy daily specific yield: offshore SYd(B) and onshore SYd(P), Poland 2022.
Applsci 13 04258 g009
Figure 10. Energy generation and wind speed data for 1 August 2022 and for 5/6 March 2022. Source: own calculation based on [14,36].
Applsci 13 04258 g010
Figure 11. Energy generation and wind speed data for 23 September 2022. Source: own calculation based on [14,36].
Applsci 13 04258 g011
Figure 12. Capacity Factor and monthly electricity demand values in monthly scale in 2022 (Poland). Source: own calculation based on [14,36].
Applsci 13 04258 g012
Figure 13. Monthly energy production values for existing technologies in 2022 (onshore wind and photovoltaic) and also potential energy production for 6 GW offshore wind.
Applsci 13 04258 g013
Table 1. Characteristics of wind turbine for simulation. Source: own study based on [30].
ParameterUnitValue
nominal power (NP)MW15
cut-in wind speed (cisp)m/s3.0
rated wind speed (rws)m/s10.59
cut-out wind speed (cosp)m/s25.0
cross-sectional area of the wind (swept area) (A)m243,005
coefficient of power (Cp)-0.489
Table 2. Monthly data of onshore wind production and installed capacity in Poland; red colour—assumed data. Source: own study based on [14,34,35].
Month of 2022Onshore Wind Energy Generation (Monthly Sum of P_WT), GWhTotal Nominal Power TNP, MW
January2531.5957116.7
February2628.9197184.6
March1194.8477211.6
April1819.47241.5
May1429.397276.5
June939.87483
July1318.57521
August783.457521
September1153.477521
October1775.097709
November1292.687709
December1906.727709
Disclaimer/Publisher’s Note: The statements, opinions and data contained in all publications are solely those of the individual author(s) and contributor(s) and not of MDPI and/or the editor(s). MDPI and/or the editor(s) disclaim responsibility for any injury to people or property resulting from any ideas, methods, instructions or products referred to in the content.

