


Anomaly Detection Method for Unknown Protocols in a Power Plant ICS Network with Decision Tree

Abstract
:1. Introduction
2. Materials and Methods
2.1. Related Work
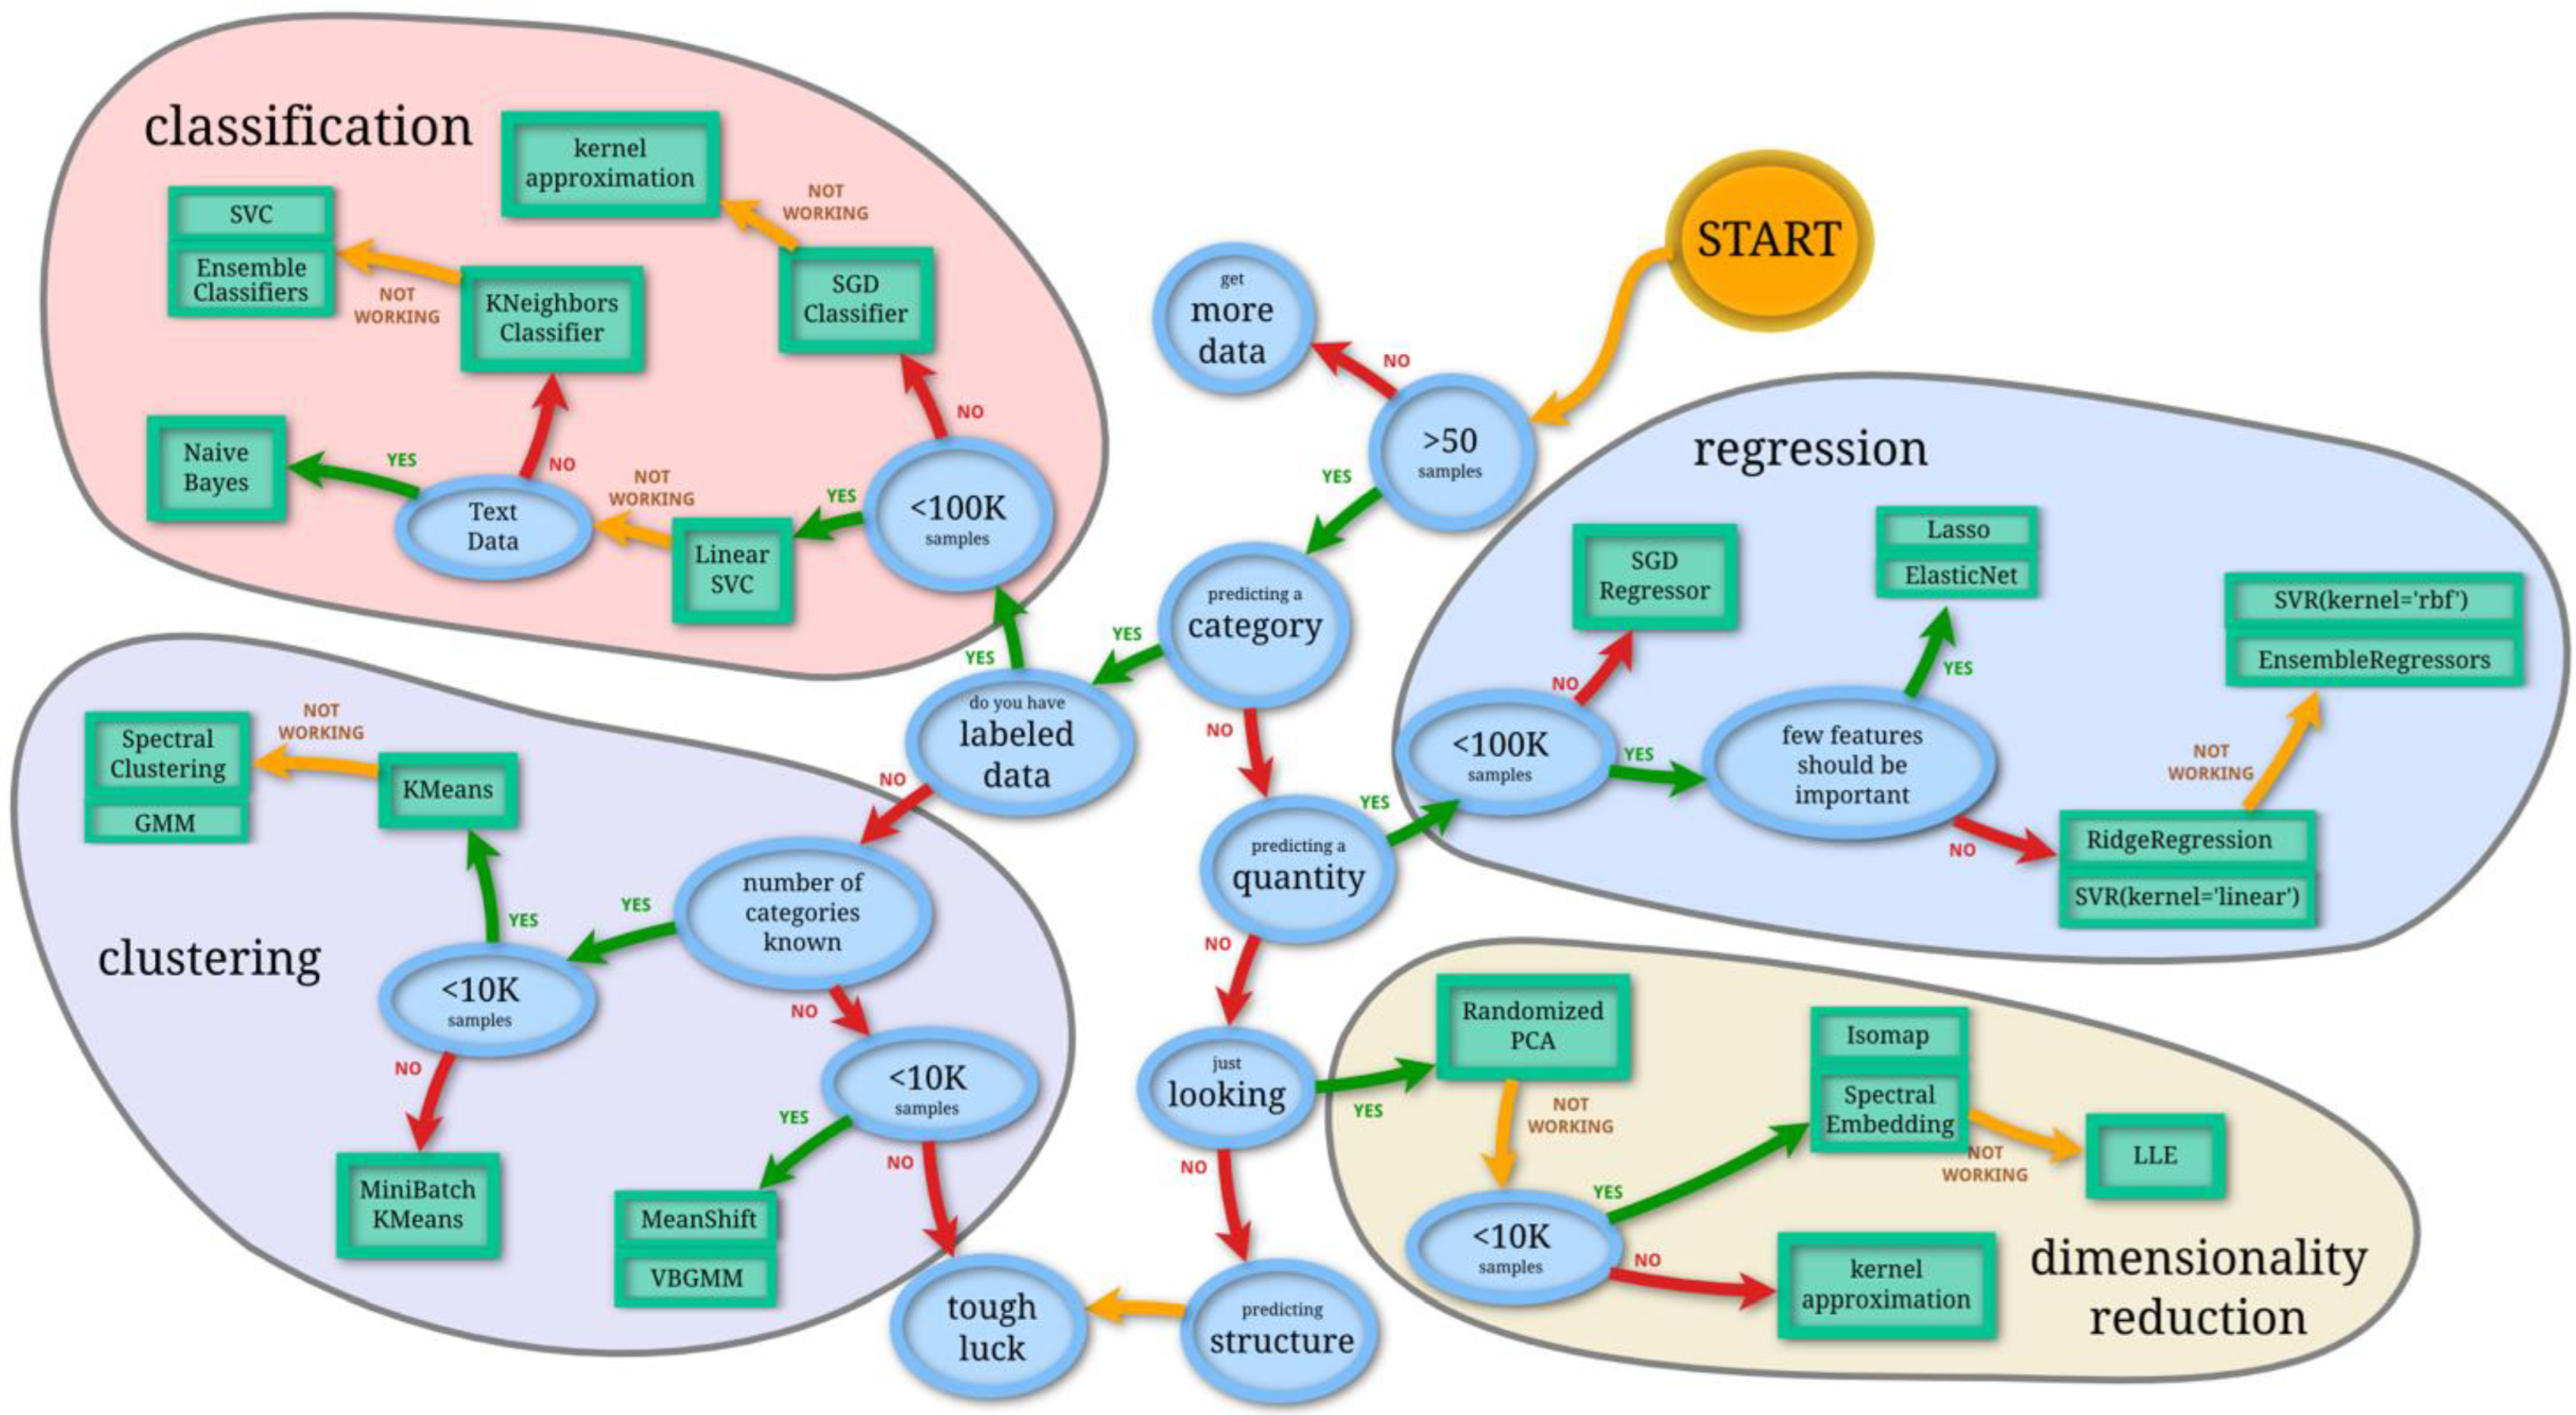
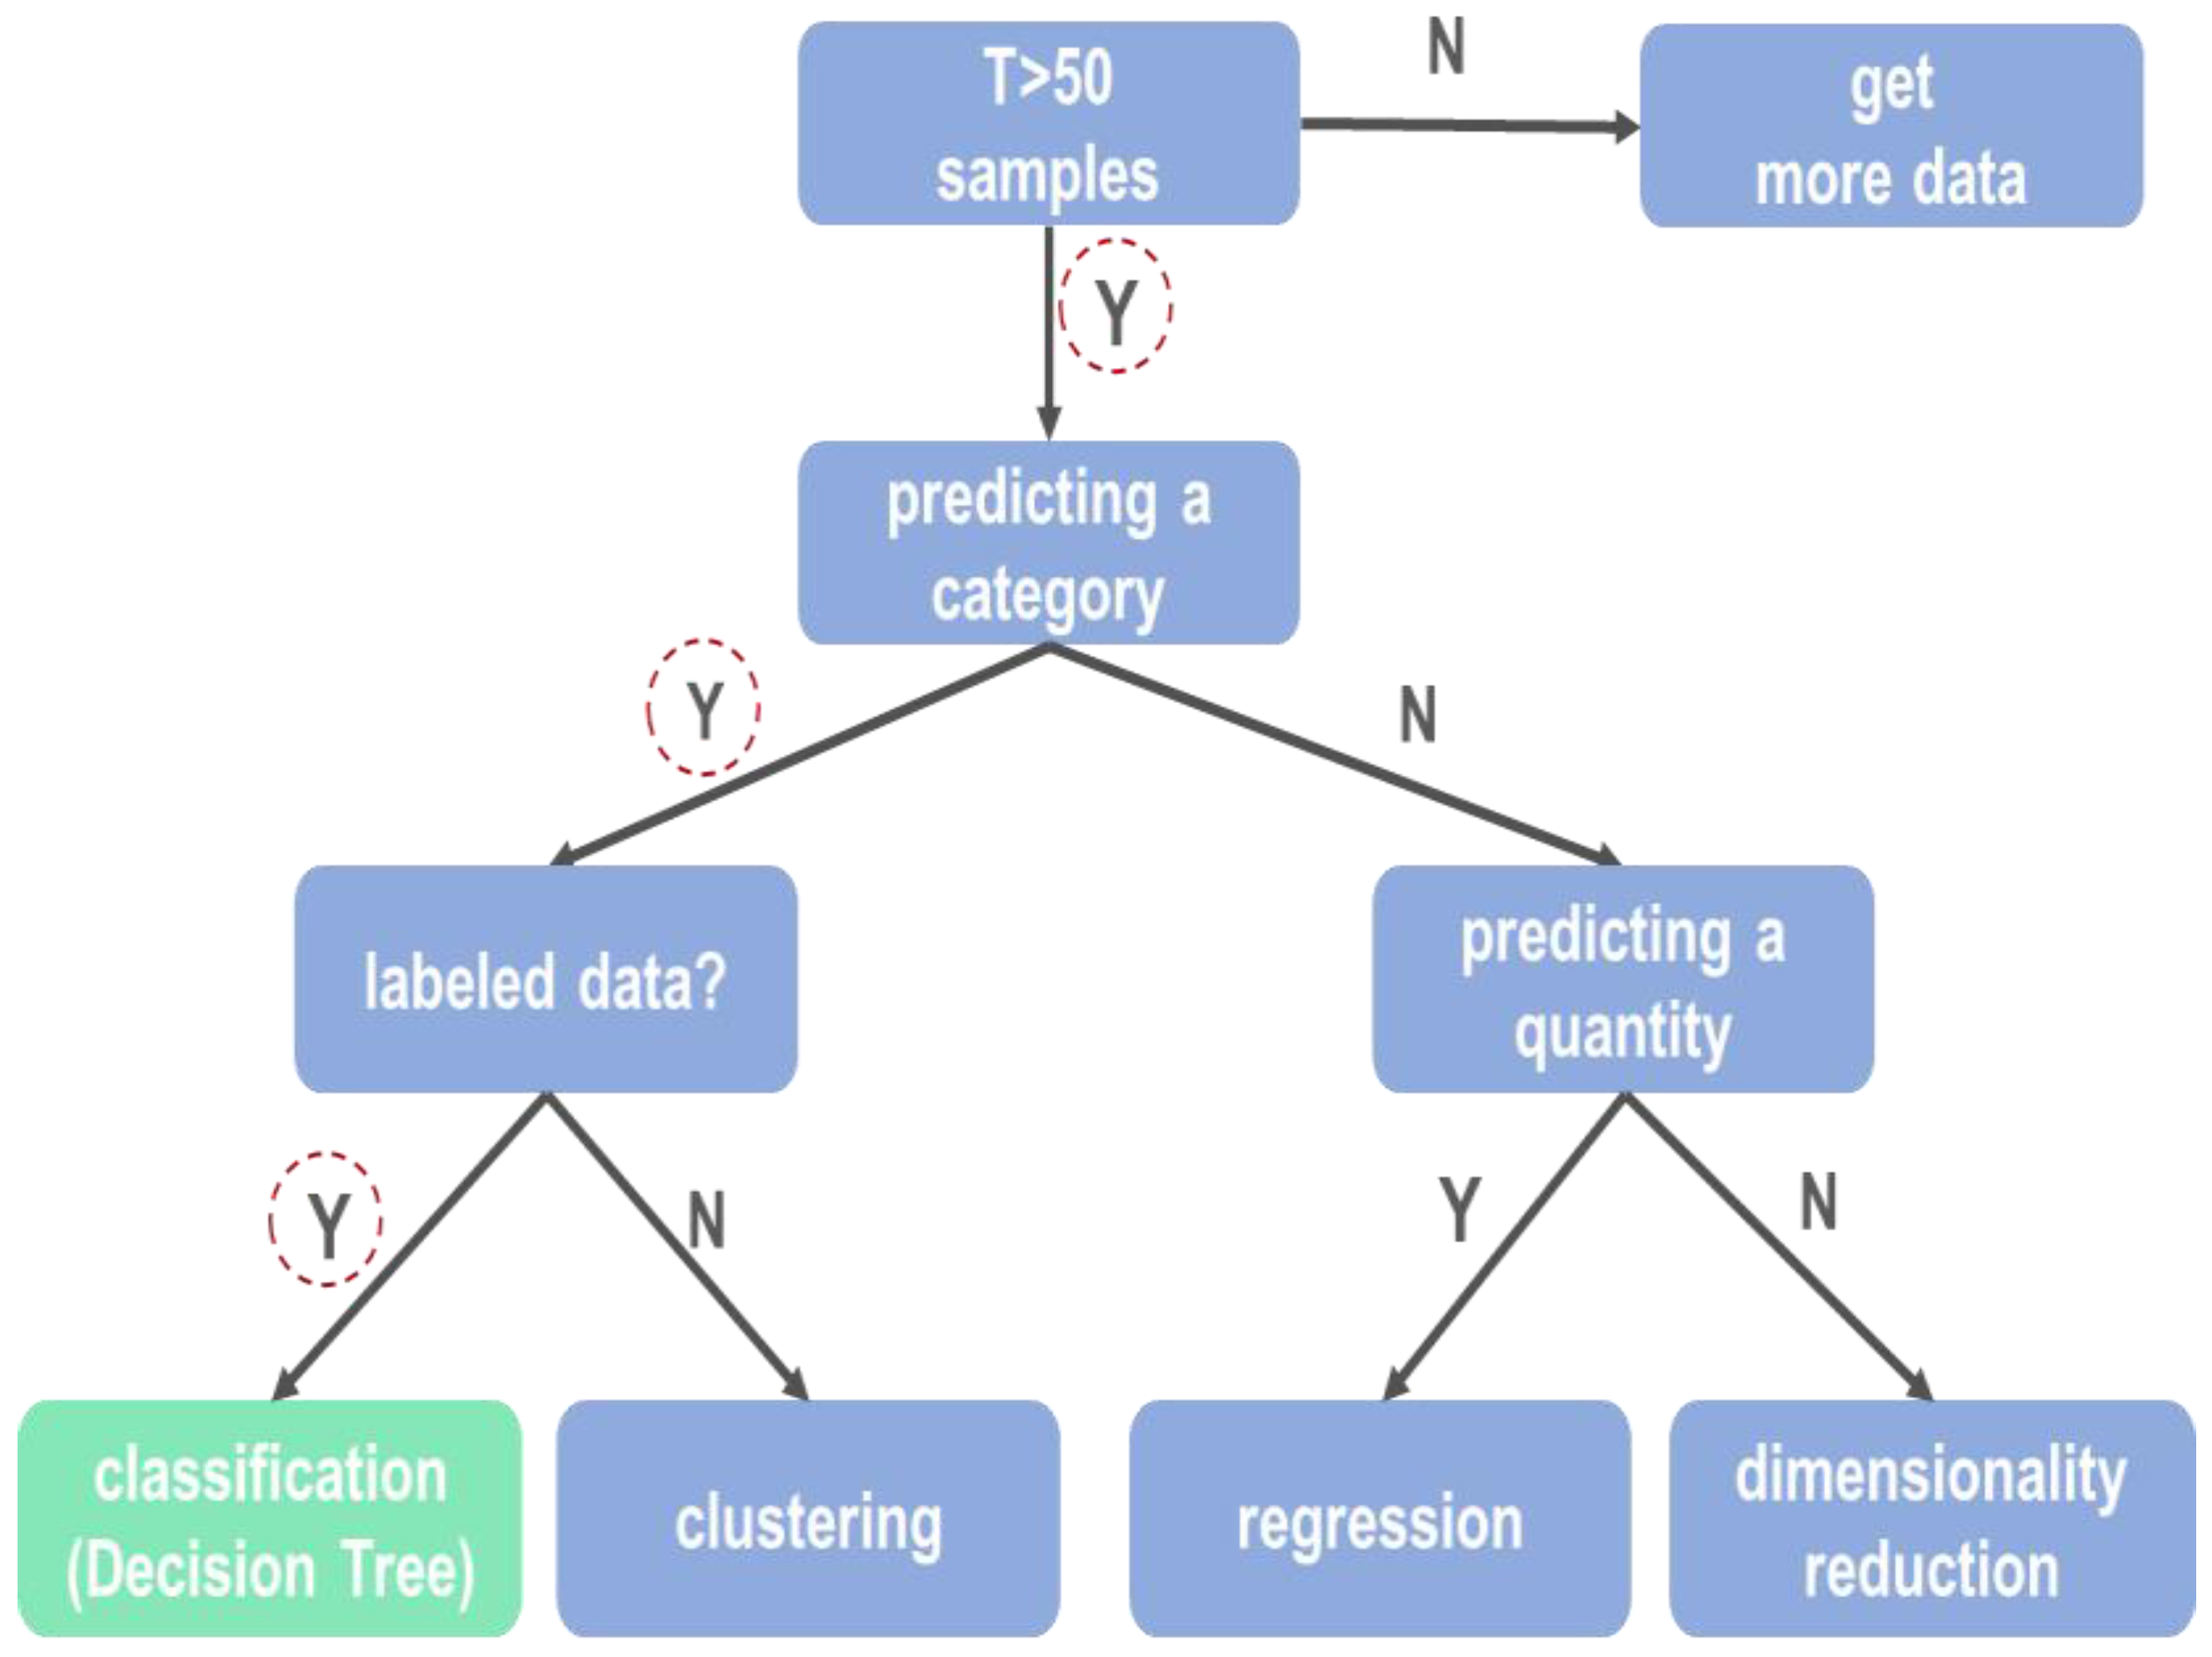
2.1.1. AI Machine Learning
2.1.2. Closed Network Asset Fingerprinting
2.1.3. Closed Network Manual Whitelisting
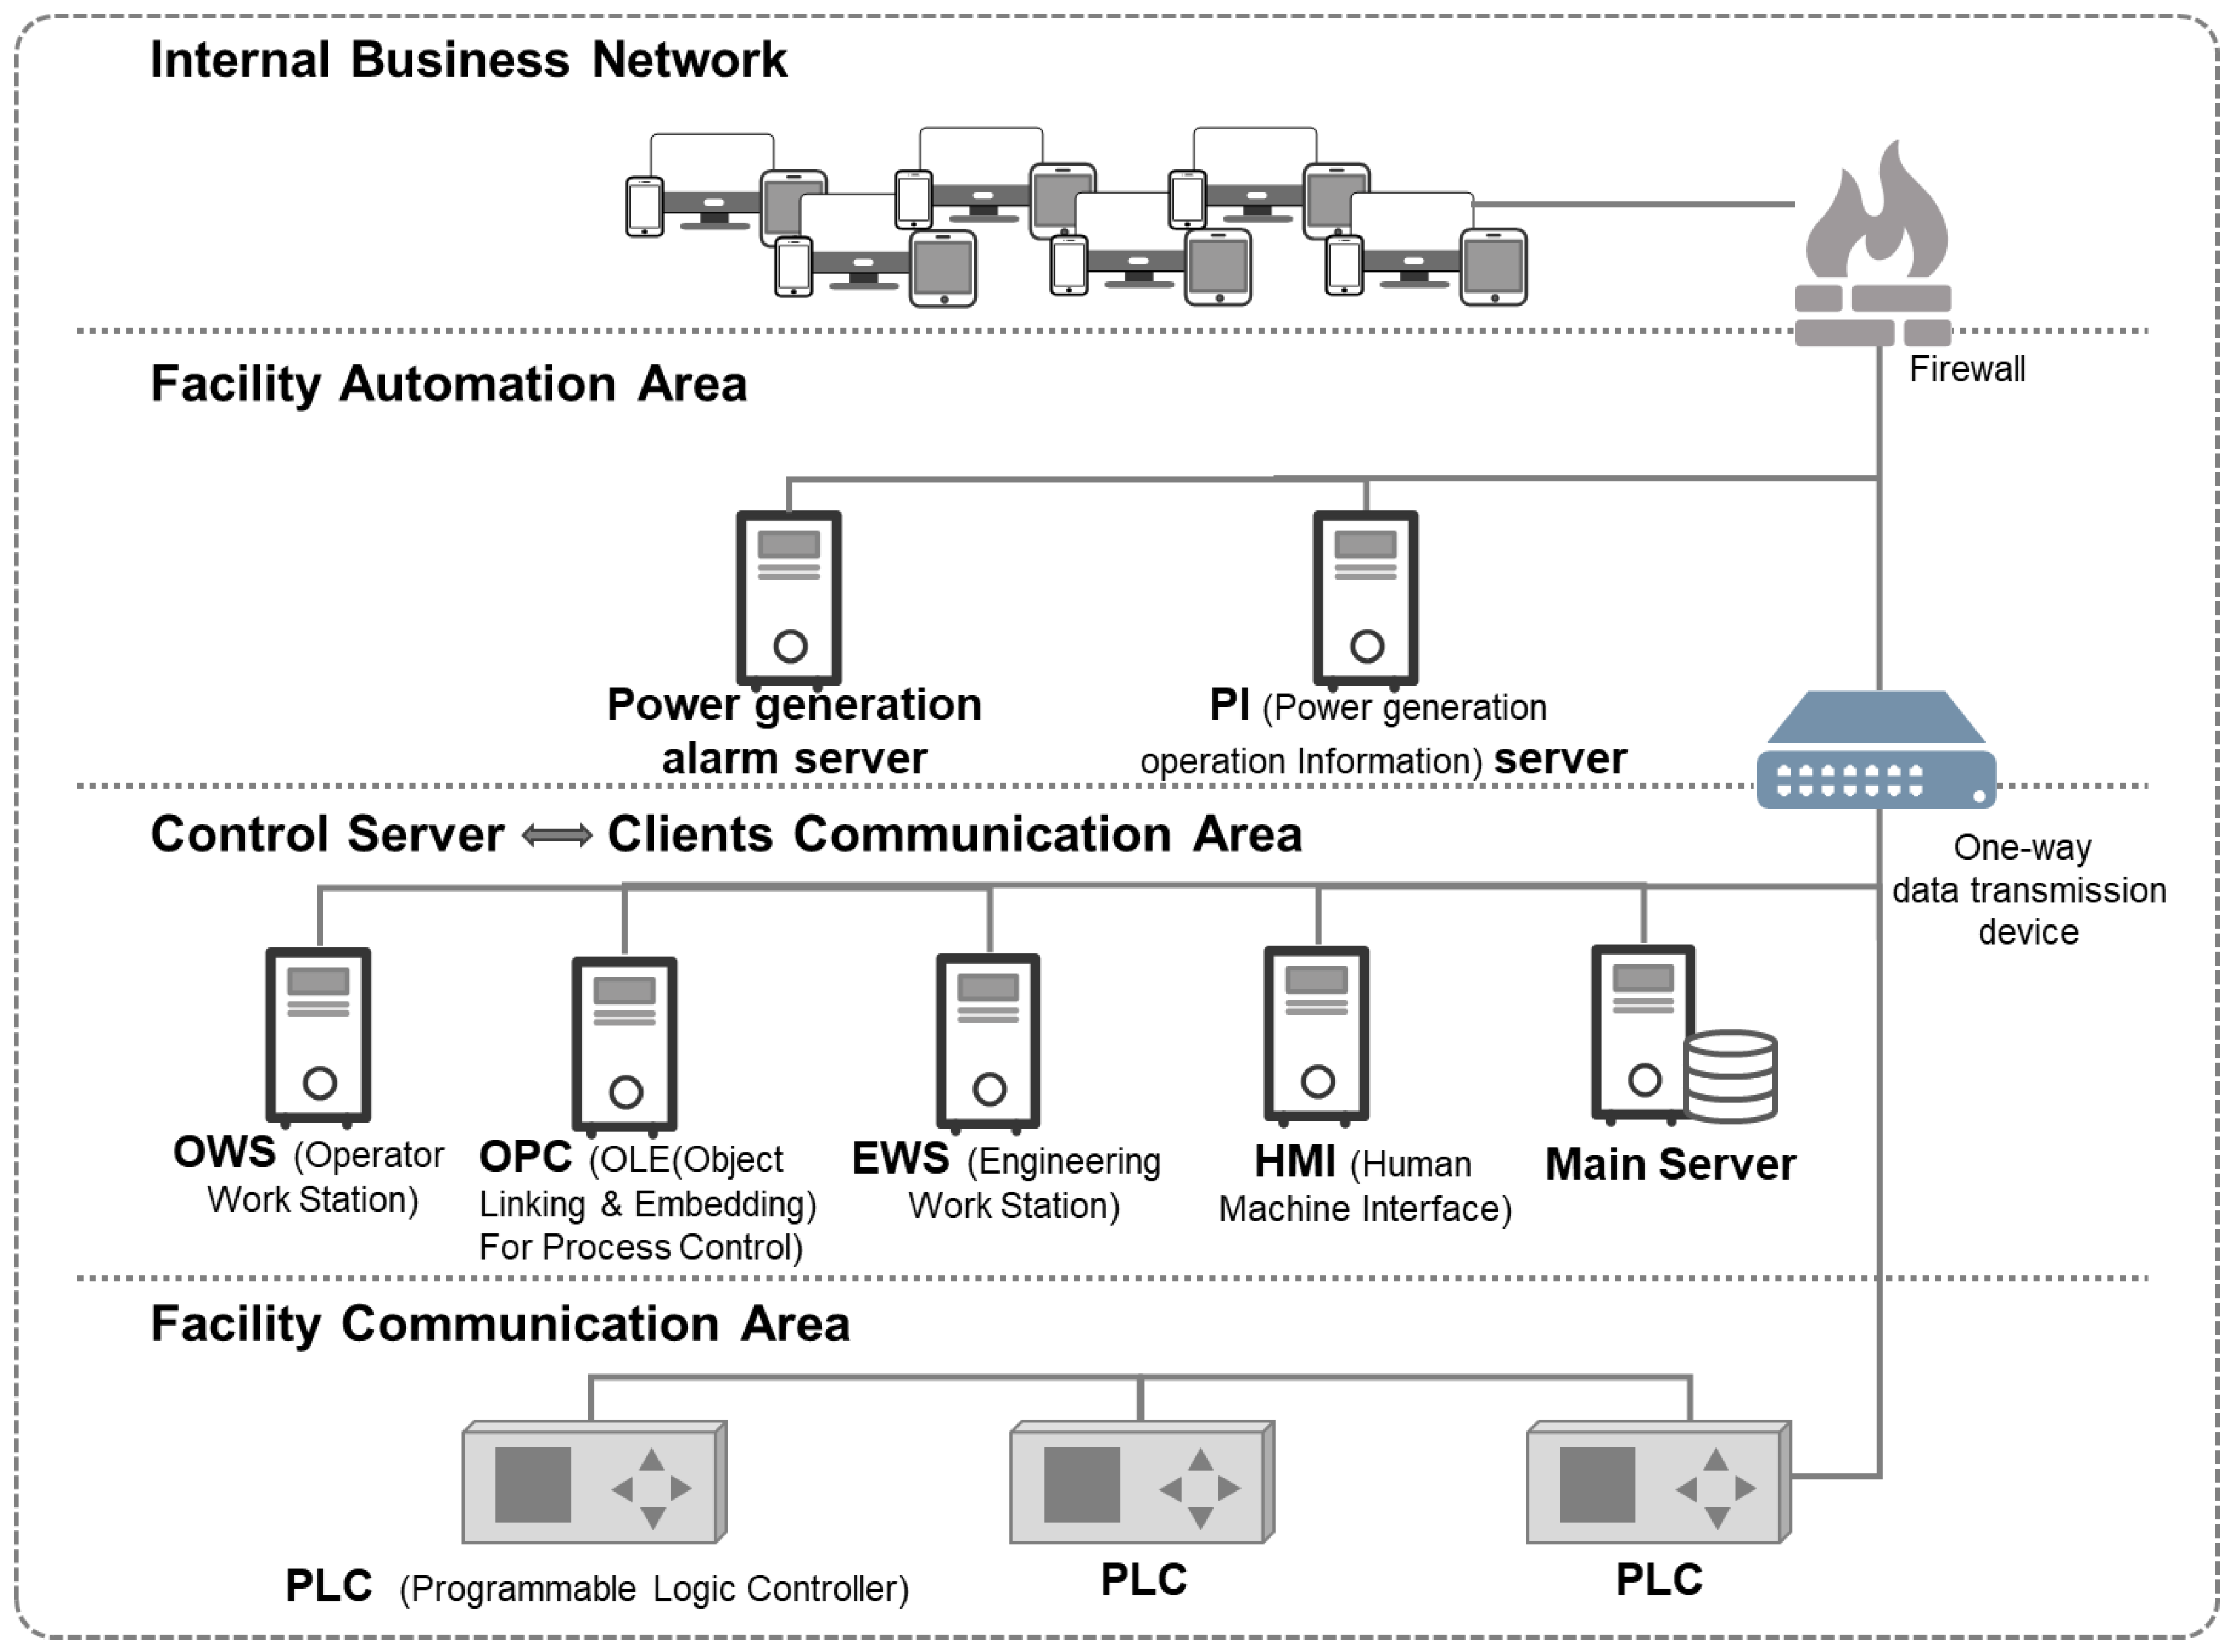
2.1.4. Anomaly Detection in an Industrial Control System
2.2. Proposal
2.2.1. Anomaly Detection Model Patterns
2.2.2. Anomaly Pattern Extraction Relation Algebra
| G: Group | F: Function | S: SOURCE_PORT |
| D: DESTINATION_PORT | P: IP_PROTOCOL | T: IN_BYTES/IN_PKTS (Packets) |
| FR: FLOW_RAW_DATA | SB: COUNT(SRC_PORT) | TB: COUNT(IN_BYTES/IN_PKTS) |
| G: Group | F: Function | S: SOURCE_PORT |
| D: DESTINATION_PORT | P: IP_PROTOCOL | T: IN_BYTES/IN_PKTS |
| FR: FLOW_RAW_DATA | SB: COUNT(SRC_PORT) | ST: SRC_PORT |
| DT: DST_PORT |
| G: Group | F: Function | W: FIRST_SWITCHED |
| A: SOURCE_ADDRESS | R: DESTINATION_ADDRESS | S: SOURCE_PORT |
| D: DESTINATION_PORT | P: IP_PROTOCOL | B: IN_BYTES |
| K: IN_PACKETS | T: IN_BYTES/IN_PACKETS | FR: FLOW_RAW_DATA |
| ST: SRC_PORT | DT: DST_PORT | G: ROUND((IN_BYTES/IN_PKTS), 2) |
2.2.3. Anomaly Pattern Data Extraction Process
2.2.4. Abnormal Sign Judgement Rate
2.2.5. Comparison of the Proposed Models
3. Results
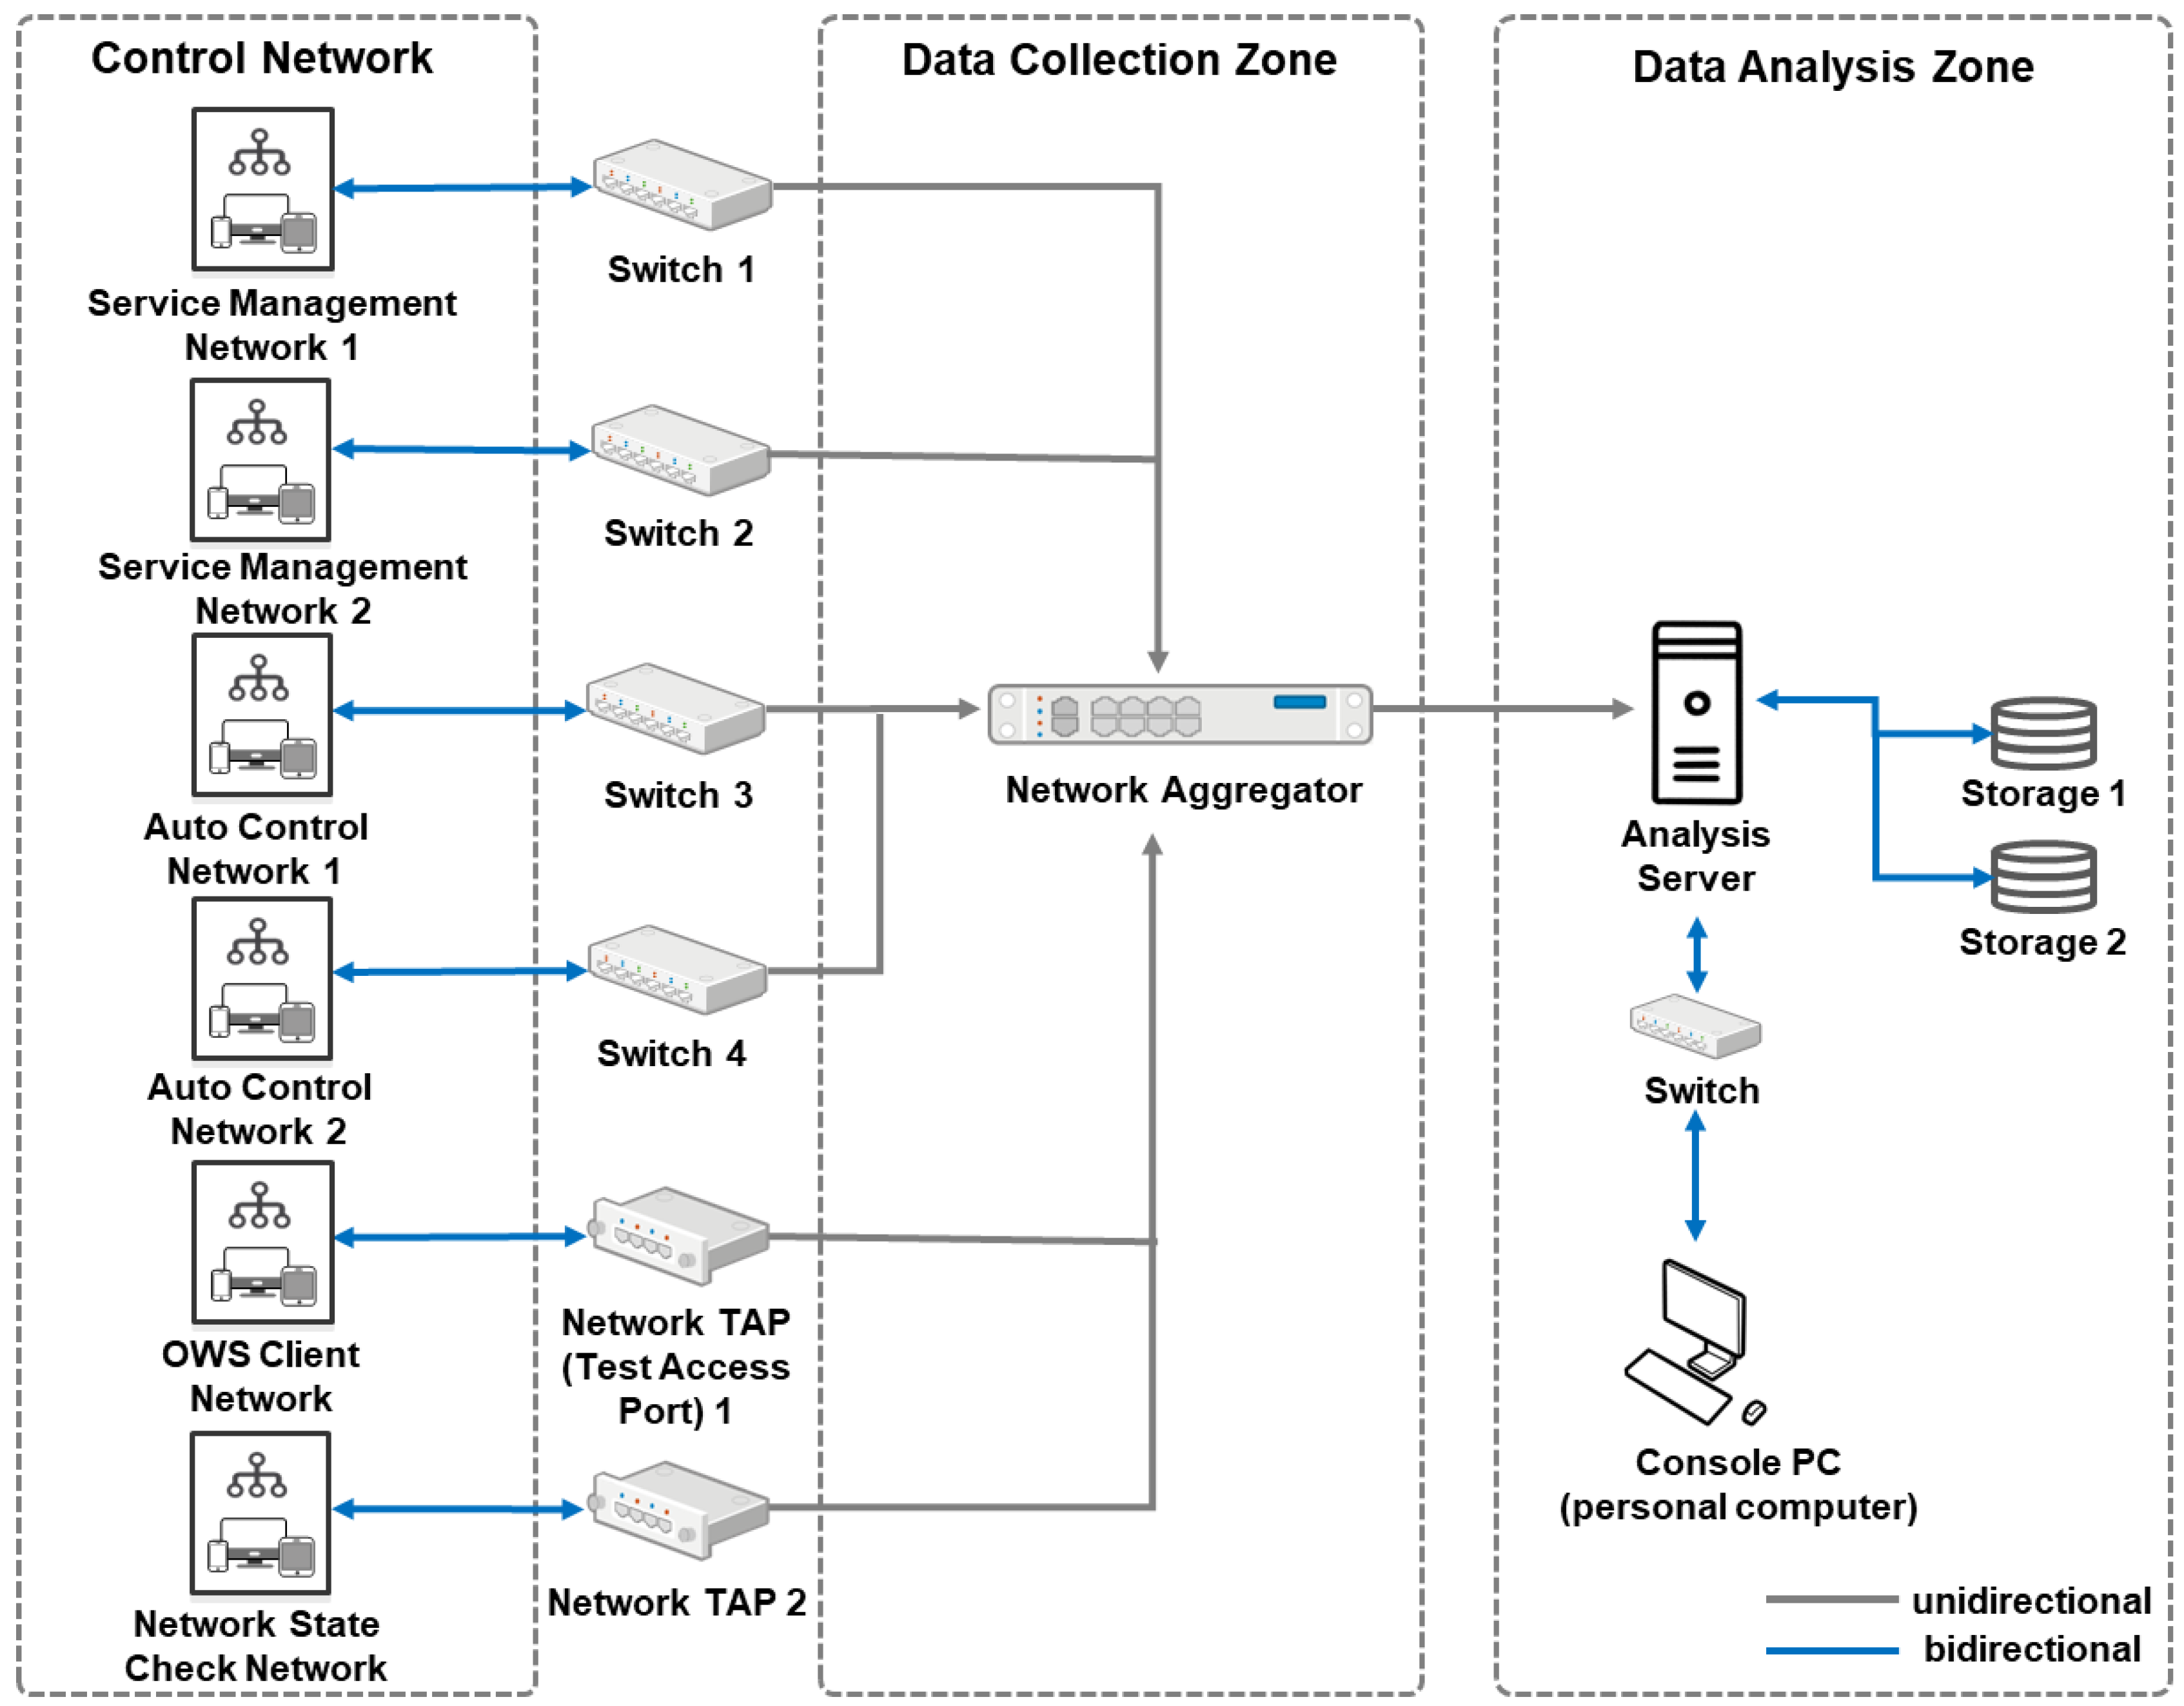
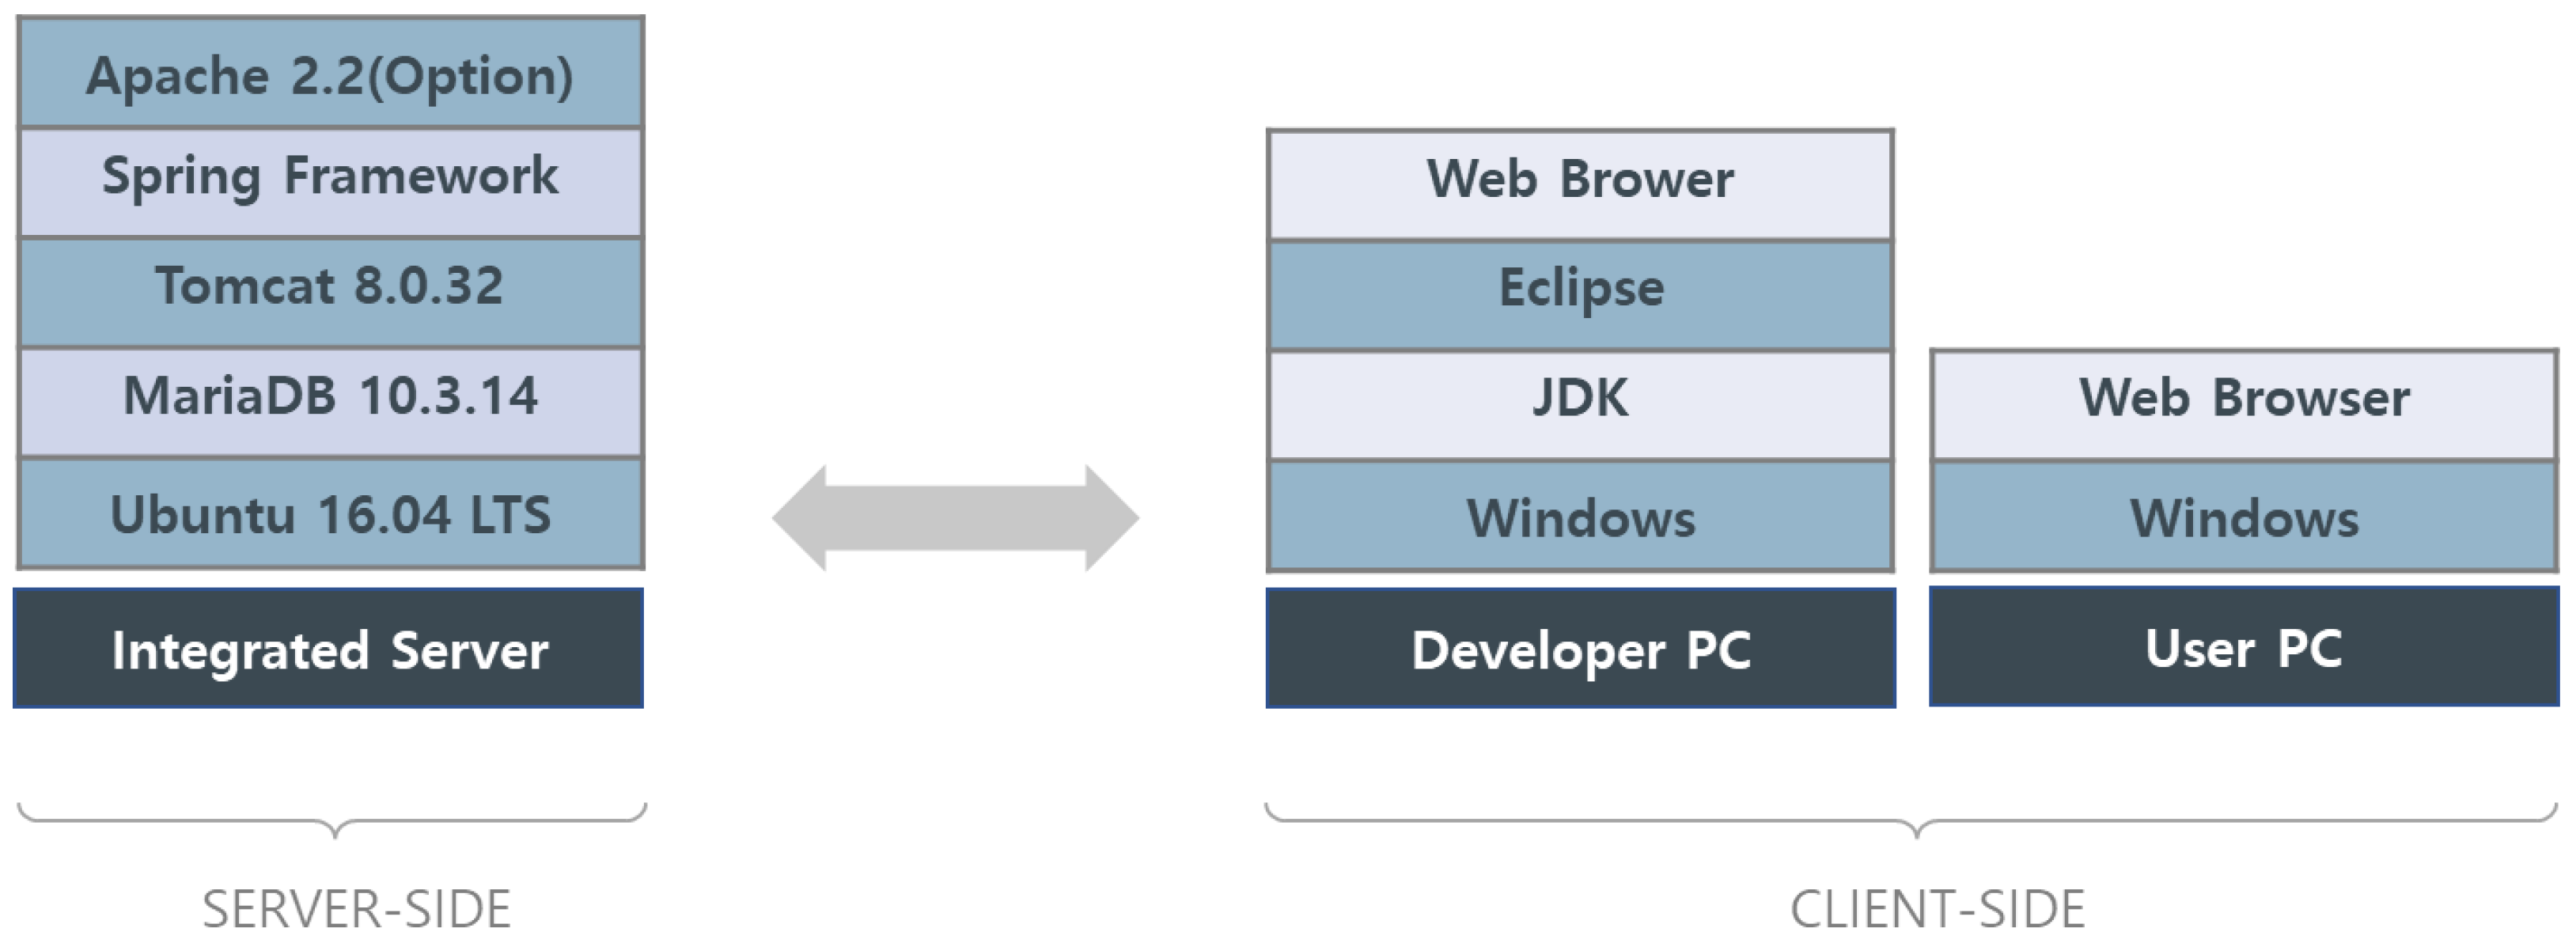
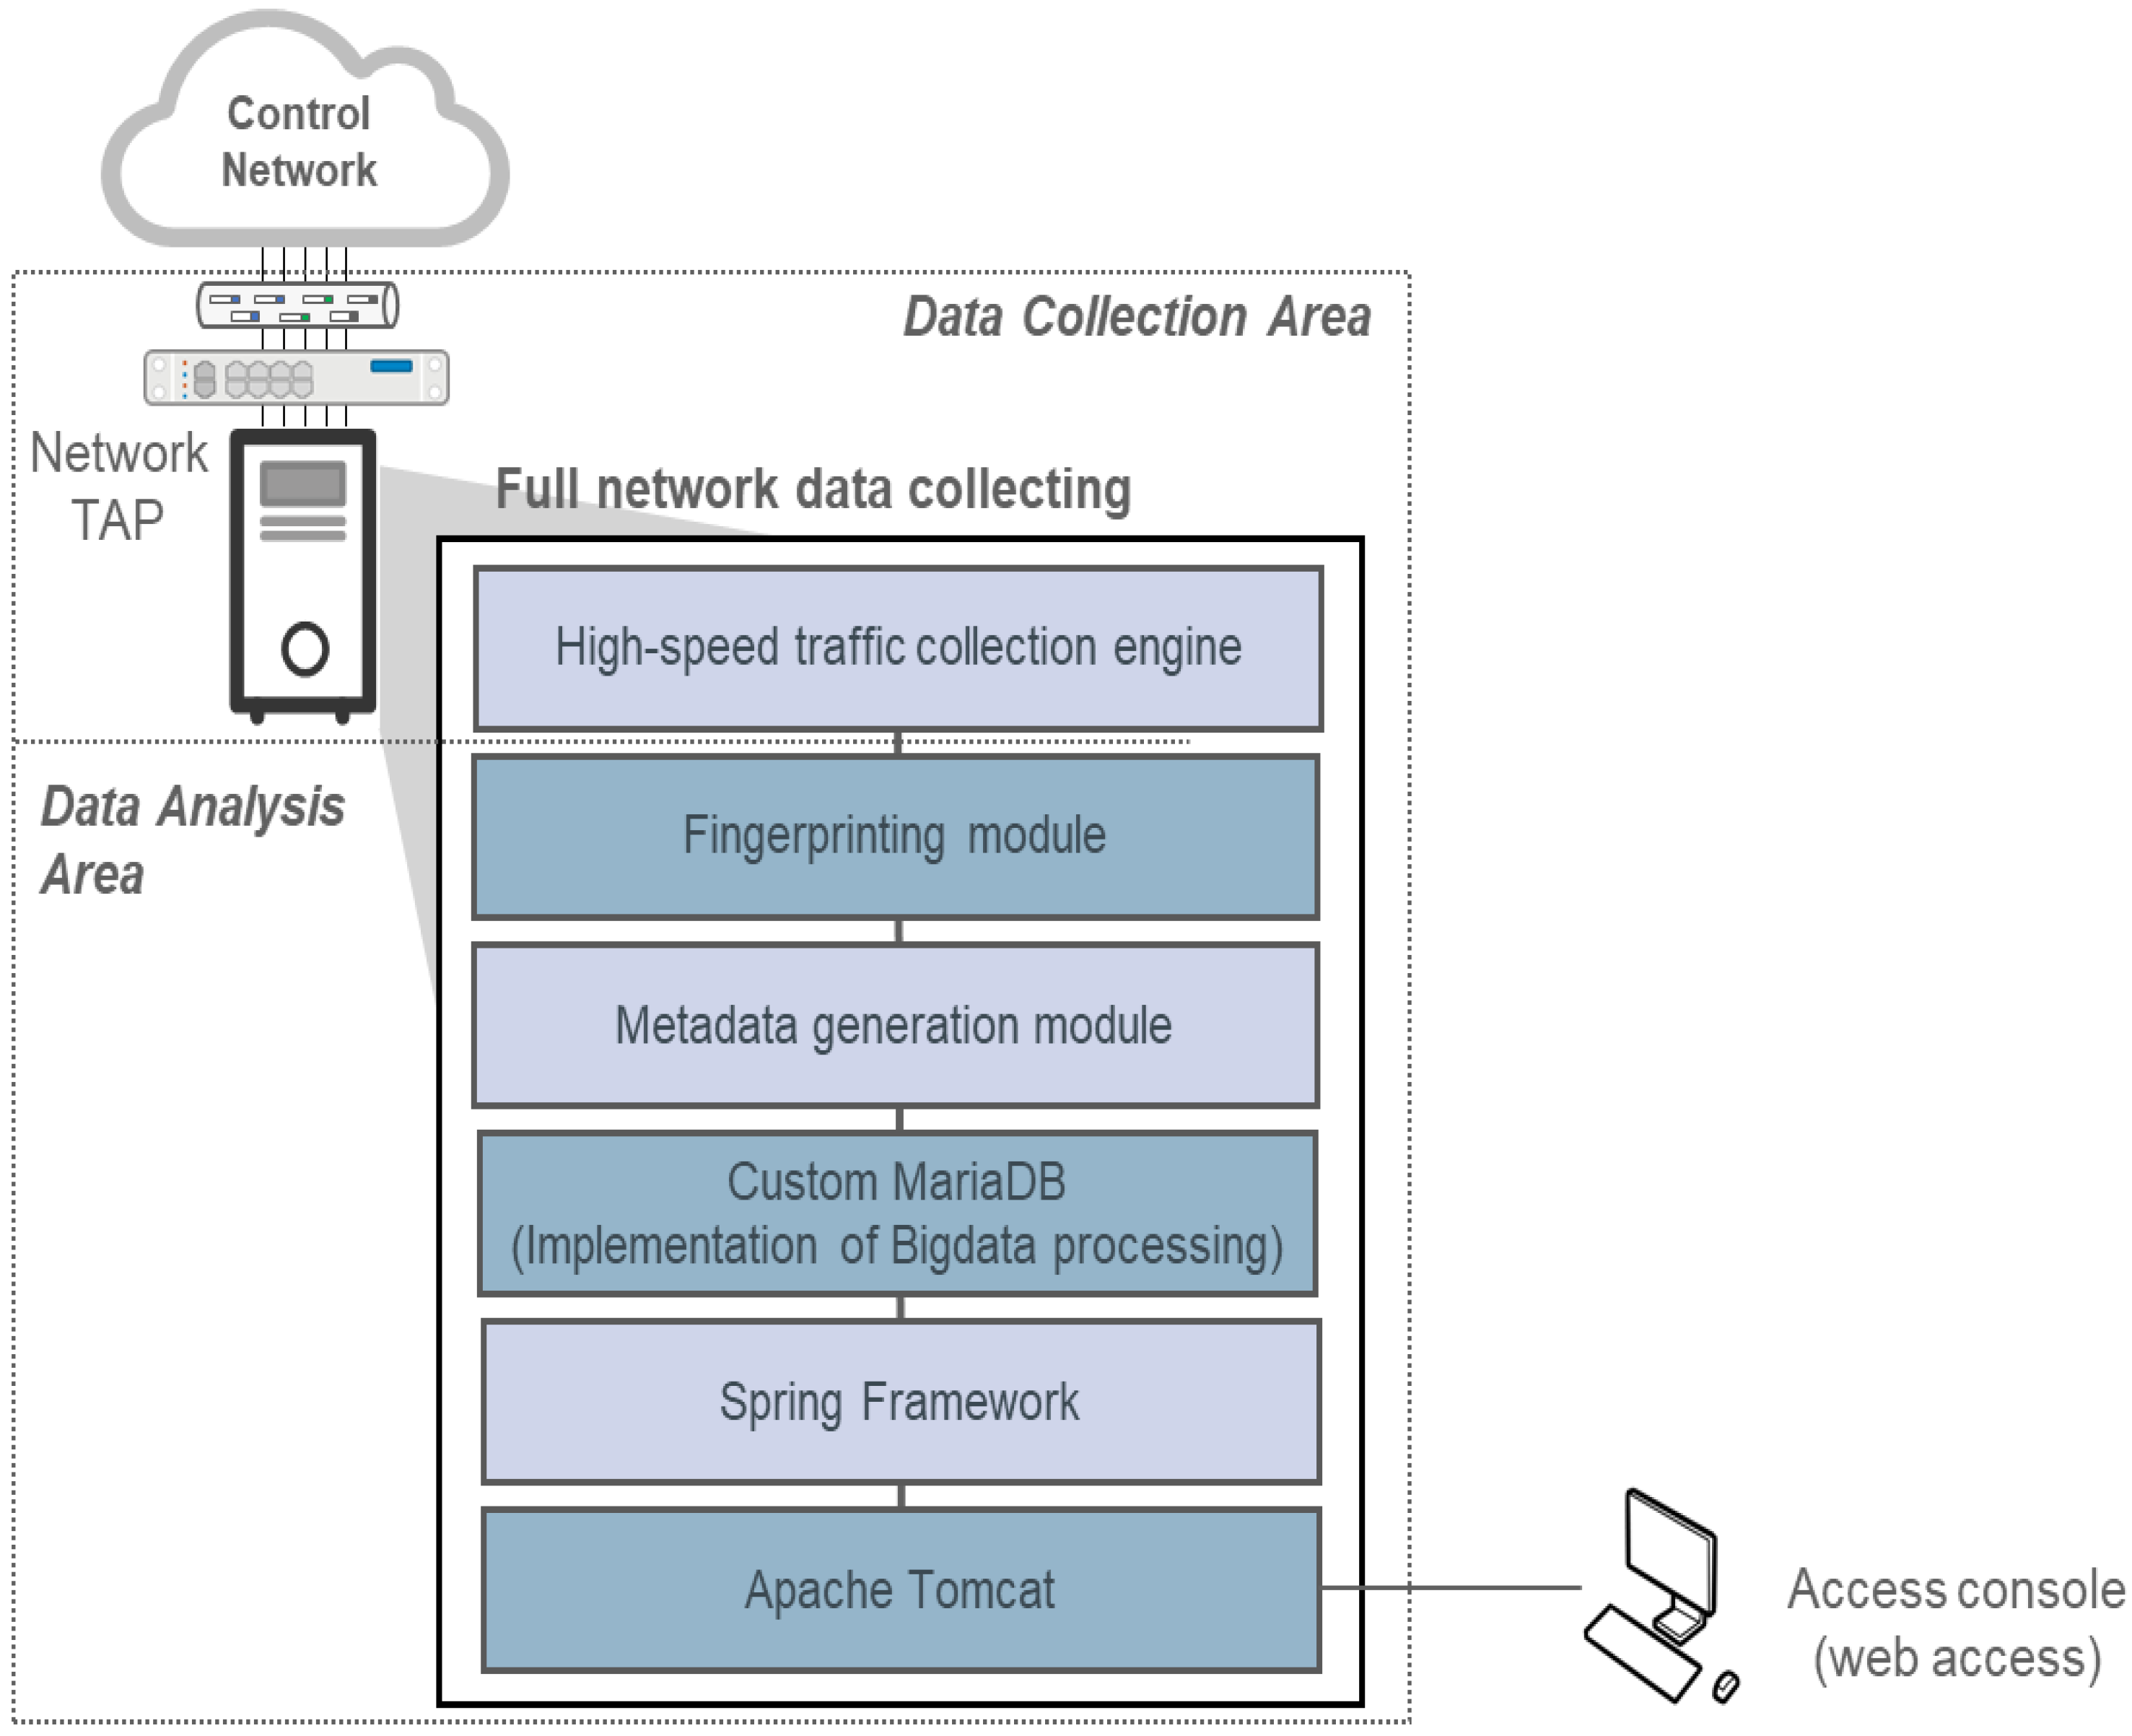
3.1. Test Environment Configuration
3.2. Test Verification
3.2.1. Generator Engine Performance Verification
3.2.2. Analysis of the Feature Verification Results
3.2.3. Analysis of the Verification Results of the Proposed Model
4. Discussion
5. Conclusions
Author Contributions
Funding
Institutional Review Board Statement
Informed Consent Statement
Data Availability Statement
Conflicts of Interest
References
- Mohamad, H.; Mokhlis, H.; Bakar, A.H.A.; Ping, H.W. A review on islanding operation and control for distribution network connected with small hydro power plant. Renew. Sustain. Energy Rev. 2011, 15, 3952–3962. [Google Scholar] [CrossRef]
- Mahmood, A.N.; Leckie, C.; Hu, J.; Tari, Z.; Atiquzzaman, M. Network traffic analysis and SCADA security. In Handbook of Information and Communication Security, 1st ed.; Stavroulakis, P., Stamp, M., Eds.; Springer: Berlin, Germany, 2010; Volume 1, pp. 383–405. [Google Scholar]
- Lippmann, R.; Fried, D.; Piwowarski, K.; Streilein, W. Passive operating system identification from TCP/IP packet headers. In Proceedings of the Workshop on Data Mining for Computer Security, Melbourne, FL, USA, 19–22 November 2003; pp. 40–49. [Google Scholar]
- Shim, K.S.; Goo, Y.H.; Lee, S.H.; Sija, B.D.; Kim, M.S. Automatic payload signature update system for classification of recent network applications. J. Korean Inst. Commun. Inf. Sci. 2017, 42, 98–107. [Google Scholar] [CrossRef] [Green Version]
- Goo, Y.H.; Choi, S.O.; Lee, S.K.; Kim, S.M.; Kim, M.S. Tracking the source of cascading cyber attack traffic using network traffic analysis. Korean Inst. Commun. Inf. Sci. 2016, 41, 1771–1779. [Google Scholar]
- Narayan, J.; Shukla, S.K.; Clancy, T.C. A survey of automatic protocol reverse engineering tools. ACM Comput. Surv. 2015, 48, 1–26. [Google Scholar] [CrossRef]
- Borisov, N.; Brumley, D.; Wang, H.J.; Dunagan, J.; Joshi, P.; Guo, C. Generic application-level protocol analyzer and its language. In Proceedings of the NDSS Symposium 2007: The Network and Security Conference, San Diego, CA, USA, 28 February–2 March 2007; pp. 1–13. [Google Scholar]
- Caselli, M.; Hadžiosmanović, D.; Zambon, E.; Kargl, F. On the feasibility of device fingerprinting in industrial control systems. In Proceedings of the 8th International Workshop on Critical Information Infrastructures Security, Amsterdam, The Netherlands, 16–18 September 2013; pp. 155–166. [Google Scholar]
- Winston, P.H. Artificial intelligence, 3rd ed.; Addison-Wesley Longman Publishing Co., Inc.: Boston, MA, USA, 1992; pp. 1–737. [Google Scholar]
- Matsuda, W.; Fujimoto, M.; Aoyama, T.; Mitsunaga, T. Cyber security risk assessment on industry 4.0 using ICS testbed with AI and Cloud. In Proceedings of the 2019 IEEE Conference on Application, Information and Network Security (AINS), Pulau Pinang, Malaysia, 19–21 November 2019; pp. 54–59. [Google Scholar]
- Yılmaz, E.N.; Sayan, H.H.; Üstünsoy, F.; Gönen, S.; Sindiren, E.; Karacayılmaz, G. ICS Cyber attack analysis and a new diagnosis approach. In Proceedings of the ICAIAME 2019: The International Conference on Artificial Intelligence and Applied Mathematics in Engineering, Manavgat, Antalya, Turkey, 20–22 April 2019; pp. 127–141. [Google Scholar]
- Li, J.H. Cyber security meets artificial intelligence: A survey. Front. Inf. Technol. Electron. Eng. 2018, 19, 1462–1474. [Google Scholar] [CrossRef]
- Veiga, A.P. Applications of artificial intelligence to network security. arXiv 2018, arXiv:1803.09992. [Google Scholar]
- Frank, J. Artificial intelligence and intrusion detection: Current and future directions. In Proceedings of the 17th National Computer Security Conference, Baltimore, MD, USA, 11–14 October 1994; pp. 1–12. [Google Scholar]
- Keller, J.M.; Gray, M.R.; Givens, J.A. A fuzzy k-nearest neighbor algorithm. IEEE Trans. Syst. Man Cybern. 1985, SMC-15, 580–585. [Google Scholar] [CrossRef]
- Pavlidis, P.; Wapinski, I.; Noble, W.S. Support vector machine classification on the web. Bioinformatics 2004, 20, 586–587. [Google Scholar] [CrossRef] [Green Version]
- Safavian, S.R.; Landgrebe, D. A survey of decision tree classifier methodology. IEEE Trans. Syst. Man Cybern. 1991, 21, 660–674. [Google Scholar] [CrossRef] [Green Version]
- Pal, M. Random forest classifier for remote sensing classification. Int. J. Remote Sens. 2005, 26, 217–222. [Google Scholar] [CrossRef]
- Schonlau, M.; Zou, R.Y. The random forest algorithm for statistical learning. Stata J. 2020, 20, 3–29. [Google Scholar] [CrossRef]
- Weichenthal, S.; Van Ryswyk, K.; Goldstein, A.; Bagg, S.; Shekkarizfard, M.; Hatzopoulou, M. A land use regression model for ambient ultrafine particles in Montreal, Canada: A comparison of linear regression and a machine learning approach. Environ. Res. 2016, 146, 65–72. [Google Scholar] [CrossRef] [Green Version]
- Maulud, D.H.; Abdulazeez, A.M. A review on linear regression comprehensive in machine learning. J. Appl. Sci. Technol. Trends 2020, 1, 140–147. [Google Scholar] [CrossRef]
- Böhning, D. Multinomial logistic regression algorithm. Ann. Inst. Stat. Math. 1992, 44, 197–200. [Google Scholar] [CrossRef]
- Xu, R.; Wunsch, D. Survey of clustering algorithms. IEEE Trans. Neural Netw. 2005, 16, 645–678. [Google Scholar] [CrossRef] [Green Version]
- Hohman, F.; Wongsuphasawat, K.; Kery, M.B.; Patel, K. Understanding and visualizing data iteration in machine learning. In Proceedings of the 2020 CHI Conference on Human Factors in Computing Systems, Honolulu, HI, USA, 25–30 April 2020; pp. 1–13. [Google Scholar]
- Weinberger, K.Q.; Saul, L.K. An introduction to nonlinear dimensionality reduction by maximum variance unfolding. In Proceedings of the Twenty-First National Conference on Artificial Intelligence and the Eighteenth Innovative Applications of Artificial Intelligence Conference, Boston, MA, USA, 16–20 July 2006; pp. 1683–1686. [Google Scholar]
- Thabtah, F.; Cowling, P.; Peng, Y. MCAR: Multi-class classification based on association rule. In Proceedings of the 3rd ACS/IEEE International Conference on Computer Systems and Applications, Cairo, Egypt, 6 January 2005; pp. 33–39. [Google Scholar]
- Yoon, S.; Kim, K.J. Deep Q networks for visual fighting game AI. In Proceedings of the 2017 IEEE Conference on Computational Intelligence and Games (CIG), New York, NY, USA, 22–25 August 2017; pp. 306–308. [Google Scholar]
- Chen, T.; Niu, W.; Xiang, Y.; Bai, X.; Liu, J.; Han, Z.; Li, G. Gradient band-based adversarial training for generalized attack immunity of A3C path finding. arXiv 2018, arXiv:1807.06752. [Google Scholar]
- Scikit-Learn (Choosing the Right Estimator). Available online: https://scikit-learn.org/stable/tutorial/machine_learning_map/index.html (accessed on 2 February 2023).
- Auffret, P. SinFP, unification of active and passive operating system fingerprinting. J. Comput. Virol. 2010, 6, 197–205. [Google Scholar] [CrossRef]
- Beverly, R. A robust classifier for passive TCP/IP fingerprinting. In Proceedings of the Passive and Active Network Measurement: 5th International Workshop, PAM 2004, Juan-Les-Pins, France, 19–20 April 2004; pp. 158–167. [Google Scholar]
- Conti, G.; Abdullah, K. Passive visual fingerprinting of network attack tool. In Proceedings of the VizSEC/DMSEC ’04: 2004 ACM Workshop on Visualization and Data Mining for Computer Security, Washington, DC, USA, 29 October 2004; pp. 45–54. [Google Scholar]
- Laštovička, M.; Filakovskỷ, D. Passive OS fingerprinting prototype demonstration. In Proceedings of the NOMS 2018—2018 IEEE/IFIP Network Operations and Management Symposium, Taipei, Taiwan, 23–27 April 2018; pp. 1–2. [Google Scholar]
- Barbosa, R.R.R.; Sadre, R.; Pras, A. Flow whitelisting in SCADA networks. Int. J. Crit. Infrastruct. Prot. 2013, 6, 150–158. [Google Scholar] [CrossRef] [Green Version]
- Mansfield-Devine, S. The promise of whitelisting. Netw. Secur. 2009, 2009, 4–6. [Google Scholar] [CrossRef]
- Erickson, D.; Casado, M.; McKeown, N. The Effectiveness of Whitelisting: A User-Study. In Proceedings of the CEAS 2008: The Fifth Conference on Email and Anti-Spam, Mountain View, CA, USA, 21–22 August 2008; pp. 1–10. [Google Scholar]
- Pareek, H.; Romana, S.; Eswari, P.R.L. Application whitelisting: Approaches and challenges. Int. J. Comput. Sci. Eng. Inf. Technol. 2012, 2, 13–18. [Google Scholar] [CrossRef]
- Perales Gómez, Á.L.; Fernández Maimó, L.; Huertas Celdrán, A.; García Clemente, F.J. Madics: A methodology for anomaly detection in industrial control systems. Symmetry 2020, 12, 1583. [Google Scholar] [CrossRef]
- Mokhtari, S.; Abbaspour, A.; Yen, K.K.; Sargolzaei, A. A machine learning approach for anomaly detection in industrial control systems based on measurement data. Electronics 2021, 10, 407. [Google Scholar] [CrossRef]
- Abdelaty, M.; Doriguzzi-Corin, R.; Siracusa, D. DAICS: A deep learning solution for anomaly detection in industrial control systems. IEEE Trans. Emerg. Top. Comput. 2021, 10, 1117–1129. [Google Scholar] [CrossRef]
- Wang, C.; Wang, B.; Liu, H.; Qu, H. Anomaly detection for industrial control system based on autoencoder neural network. Wirel. Commun. Mob. Comput. 2020, 2020, 8897926. [Google Scholar] [CrossRef]
- Cao, Y.; Zhang, L.; Zhao, X.; Jin, K.; Chen, Z. An Intrusion Detection Method for Industrial Control System Based on Machine Learning. Information 2022, 13, 322. [Google Scholar] [CrossRef]
- Sommer, R.; Paxson, V. Outside the closed world: On using machine learning for network intrusion detection. In Proceedings of the 2010 IEEE Symposium on Security and Privacy, NW Washington, DC, USA, 16–19 May 2010; pp. 305–316. [Google Scholar]
- Townsend, J.T. Theoretical analysis of an alphabetic confusion matrix. Percept. Psychophys. 1971, 9, 40–50. [Google Scholar] [CrossRef]
- Visa, S.; Ramsay, B.; Ralescu, A.L.; Van Der Knaap, E. Confusion matrix-based feature selection. In Proceedings of the MAICS 2011: 22nd Midwest Artificial Intelligence and Cognitive Science Conference, Cincinnati, OH, USA, 16–17 April 2011; pp. 120–127. [Google Scholar]


| Types | Description | |
|---|---|---|
| Supervised Learning | Classification | |
|
| |
| ||
| Regression | ||
| ||
| Unsupervised Learning |
|
|
|
| |
| Reinforcement Learning |
| |
| ||
| Normal (Actual Negative) | Abnormal (Actual Positive) | |
|---|---|---|
| Normal (Predicted Negative) | True Negative (TN) | False Negative (FN) |
| Abnormal (Predicted Positive) | False Positive (FP) | True Positive (TP) |
| Criteria | Equation | Description |
|---|---|---|
| Accuracy | Ratio of correct predictions (both true positives and true negatives) among all predictions | |
| Precision | Ratio of true positives (anomalies properly detected) among all samples predicted as positive | |
| Sensitivity | Ratio of actual positives, which are actually anomalies, predicted as positives | |
| Fall-out | Ratio of negative samples (non-anomalies) that are incorrectly classified as positive | |
| F1 Score | As an index combining precision and sensitivity, it is a value for how accurately the normal is identified and has a relatively high value when it is not biased to either side |
| Item Name | Proposed Model | Darktrace |
|---|---|---|
| Data Collection Unit | Bytes, Sessions | Sessions |
| Detection Technique | Network anomaly detection, illegal asset detection | Rule-based anomaly detection |
| Traffic Analysis | Detailed analysis using packet and session data | Session data only |
| Asset Detection | Unregistered, new, changed assets | New assets only |
| Asset Management | Asset registration/modification/change | Automatic registration only |
| Abnormal traffic analysis | Identification of anomalies using traffic thresholds for each asset and analysis of abnormal traffic using ML techniques for collected traffic | Specific rule-based detection of collected traffic using ML (unsupervised) method |
| Classification | Version |
|---|---|
| OS (Operation System) | Ubuntu 16.04 LTS |
| DB | MariaDB 10.3.14 |
| WAS (Web Application Server) | Tomcat 8.0.32 |
| JDK | Java 1.8.211 |
| WEB | Apache 2.4.39 |
| C Compiler | GCC 5.4.0 |
| Development Tool | Spring Framework 4.3 |
| Type | Requirements |
|---|---|
| CPU (Central Processing Unit) | 2.2 GHZ (Gigahertz) |
| Core | 10core |
| Memory | 64 GB (Gigabyte) |
| NIC (Network Interface Card) | 1 Giga NIC 4port |
| SSD (Solid State Drive) | 512 GB |
| HDD (Hard Disk Drive) | 10 TB |
| Port | Default | Description | Direction |
|---|---|---|---|
| Console | TCP 8443 | Web UI (User Interface) access port | Inbound browser → server |
| FTP Client | TCP 22 | SFTP (Secure File Transfer Protocol) | Inbound/Outbound |
| Console | TCP 80 | SSL (Secure Socket Layer) encrypted communication uses port 443 | Inbound |
| Agent Download | TCP 88 | Agent downloads support port for compatibility with IE (Internet Explorer) 8 | Inbound Browser → Server |
| Syslog | UDP 514 | Syslog | Outbound |
| SNMP | 162 | SNMP (Simple Network Management Protocol) | Outbound |
| Function | URL (Uniform Resource Locator) |
|---|---|
| Web console access | HTTPS (Hyper Text Transfer Protocol over Secure Socket Layer)://<<server name or IP address>>:8443 |
| Seq | Test Item | Test Goal |
|---|---|---|
| 1 | Fingerprinting success rate | Measurement of OS information extraction success rate (%) from the fingerprinting of the packets |
| 2 | Metadata creation success rate | Measurement of the metadata creation success rate (%) |
| 3 | Metadata storage speed | Check the speed of saving the PCAP (Packet Capture) file with the metadata stored as a JSON (JavaScript Object Notation) file |
| 4 | Metadata retrieval speed | Check the metadata retrieval speed |
| Item | 1 | 2 | 3 | 4 | 5 |
|---|---|---|---|---|---|
| Processed Packets | 1,004,099 | 1,004,105 | 1,004,097 | 1,004,099 | 1,004,100 |
| Processed TCP Packets | 964,819 | 964,819 | 964,819 | 964,819 | 964,819 |
| Captured SYN TCP Packets | 27,761 | 27,761 | 27,761 | 27,761 | 27,761 |
| Duped packets | 2030 | 2030 | 2030 | 2030 | 2030 |
| Normal Packets | 27,761 | 27,761 | 27,761 | 27,761 | 27,761 |
| Processed SYB TCP Packets | 27,761 | 27,761 | 27,761 | 27,761 | 27,761 |
| Processed SYN_ACK TCP Packets | 25,844 | 25,844 | 25,844 | 25,844 | 25,844 |
| Fingerprinted Packets | 53,605 | 53,605 | 53,605 | 53,605 | 53,605 |
| Processed UDP Packets | 35,571 | 35,571 | 35,571 | 35,571 | 35,571 |
| Elapsed Time | 15.641558 | 22.225767 | 12.28054 | 15.896778 | 16.937732 |
| Packet Process Speed (packets/s) | 64,194.30698 | 45,177.51839 | 81,763.26262 | 63,163.67994 | 59,281.84575 |
| Fingerprinting Speed (packets/s) | 3427.088191 | 2411.840269 | 4365.03641 | 3372.066961 | 3164.827548 |
| Item | 1 | 2 | 3 | 4 | 5 |
|---|---|---|---|---|---|
| Processed Packets | 100,4094 | 1,004,094 | 1,004,093 | 1,004,093 | 1,004,096 |
| Processed TCP Packets | 964,819 | 964,819 | 964,819 | 964,819 | 964,819 |
| Captured syn TCP Packets | 27,761 | 27,761 | 27,761 | 27,761 | 27,761 |
| Duped Packets | 2030 | 2030 | 2030 | 2030 | 2030 |
| Normal Packets | 27,761 | 27,761 | 27,761 | 27,761 | 27,761 |
| Processed SYN TCP Packets | 27,761 | 27,761 | 27,761 | 27,761 | 27,761 |
| Processed SYN_ ACK TCP Packets | 25,844 | 25,844 | 25,844 | 25,844 | 25,844 |
| Fingerprinted Packets | 53,605 | 53,605 | 53,605 | 53,605 | 53,605 |
| Processed UDP Packets | 35,571 | 35,571 | 35,571 | 35,571 | 35,571 |
| Generated Flows | 636 | 636 | 636 | 636 | 636 |
| Elapsed Time | 10.316506 | 11.188549 | 10.172895 | 9.555932 | 12.131023 |
| Packet Process Speed (packets/s) | 97,328.88441 | 89,743.00147 | 98,702.78314 | 105,075.3616 | 82,770.92337 |
| Flow Generating Speed (flows/c) | 61.64878 | 56.84383 | 62.519079 | 66.555518 | 52.427564 |
| Fingerprinting Speed (packets/s) | 5196.042252 | 4791.058998 | 8269.395056 | 5609.604647 | 4418.835796 |
| Item | 1 | 2 | 3 | 4 | 5 |
|---|---|---|---|---|---|
| Processed Packets | 1,000,000 | 1,000,000 | 1,000,000 | 1,000,000 | 1,000,000 |
| Processed TCP Packets | 121,248 | 121,248 | 121,248 | 121,248 | 121,248 |
| Captured SYN TCP Packets | 4576 | 4576 | 4576 | 4576 | 4576 |
| Duped Packets | 562 | 562 | 562 | 562 | 562 |
| Lost Packets | 0 | 0 | 0 | 0 | 0 |
| Normal Packets | 4576 | 4576 | 4576 | 4576 | 4576 |
| Processed SYN TCP Packets | 4576 | 4576 | 4576 | 4576 | 4576 |
| Processed SYN _ ACK TCP Packets | 2693 | 2693 | 2693 | 2693 | 2693 |
| Fingerprinted Packets | 7269 | 7269 | 7269 | 7269 | 7269 |
| Processed UDP Packets | 842,217 | 842,217 | 842,217 | 842,217 | 842,217 |
| Generated Flows | 30,670 | 30,670 | 30,670 | 30,670 | 30,670 |
| Elapsed Time | 1.428743 | 1.422007 | 1.403228 | 1.425827 | 1.421129 |
| Packet Process Speed (packets/s) | 699,916.043 | 703,231.3445 | 712,642.3966 | 701,347.1469 | 703,665.6886 |
| Flow Generating Speed (flows/s) | 21,466.42504 | 21,568.10534 | 21,856.7423 | 21,510.317 | 21,581.42667 |
| Fingerprinting Speed (packets/s) | 5087.689716 | 5111.788643 | 5180.197571 | 5098.092411 | 5114.945891 |
| Item | 1 | 2 | 3 | 4 | 5 |
|---|---|---|---|---|---|
| Source IP | 172.15.100.12 | 172.15.100.12 | 172.15.100.12 | 172.15.100.12 | 172.15.100.12 |
| Source Port | 2916 | 2916 | 2916 | 2916 | 2916 |
| Bytes | 11,541,934 | 11,541,934 | 11,541,934 | 11,541,934 | 11,541,934 |
| Data Count | 100 | 100 | 100 | 100 | 100 |
| Query ID | 1 | 1 | 1 | 1 | 1 |
| Duration | 0.00224869 | 0.00011751 | 0.00014457 | 0.00011805 | 0.00011718 |
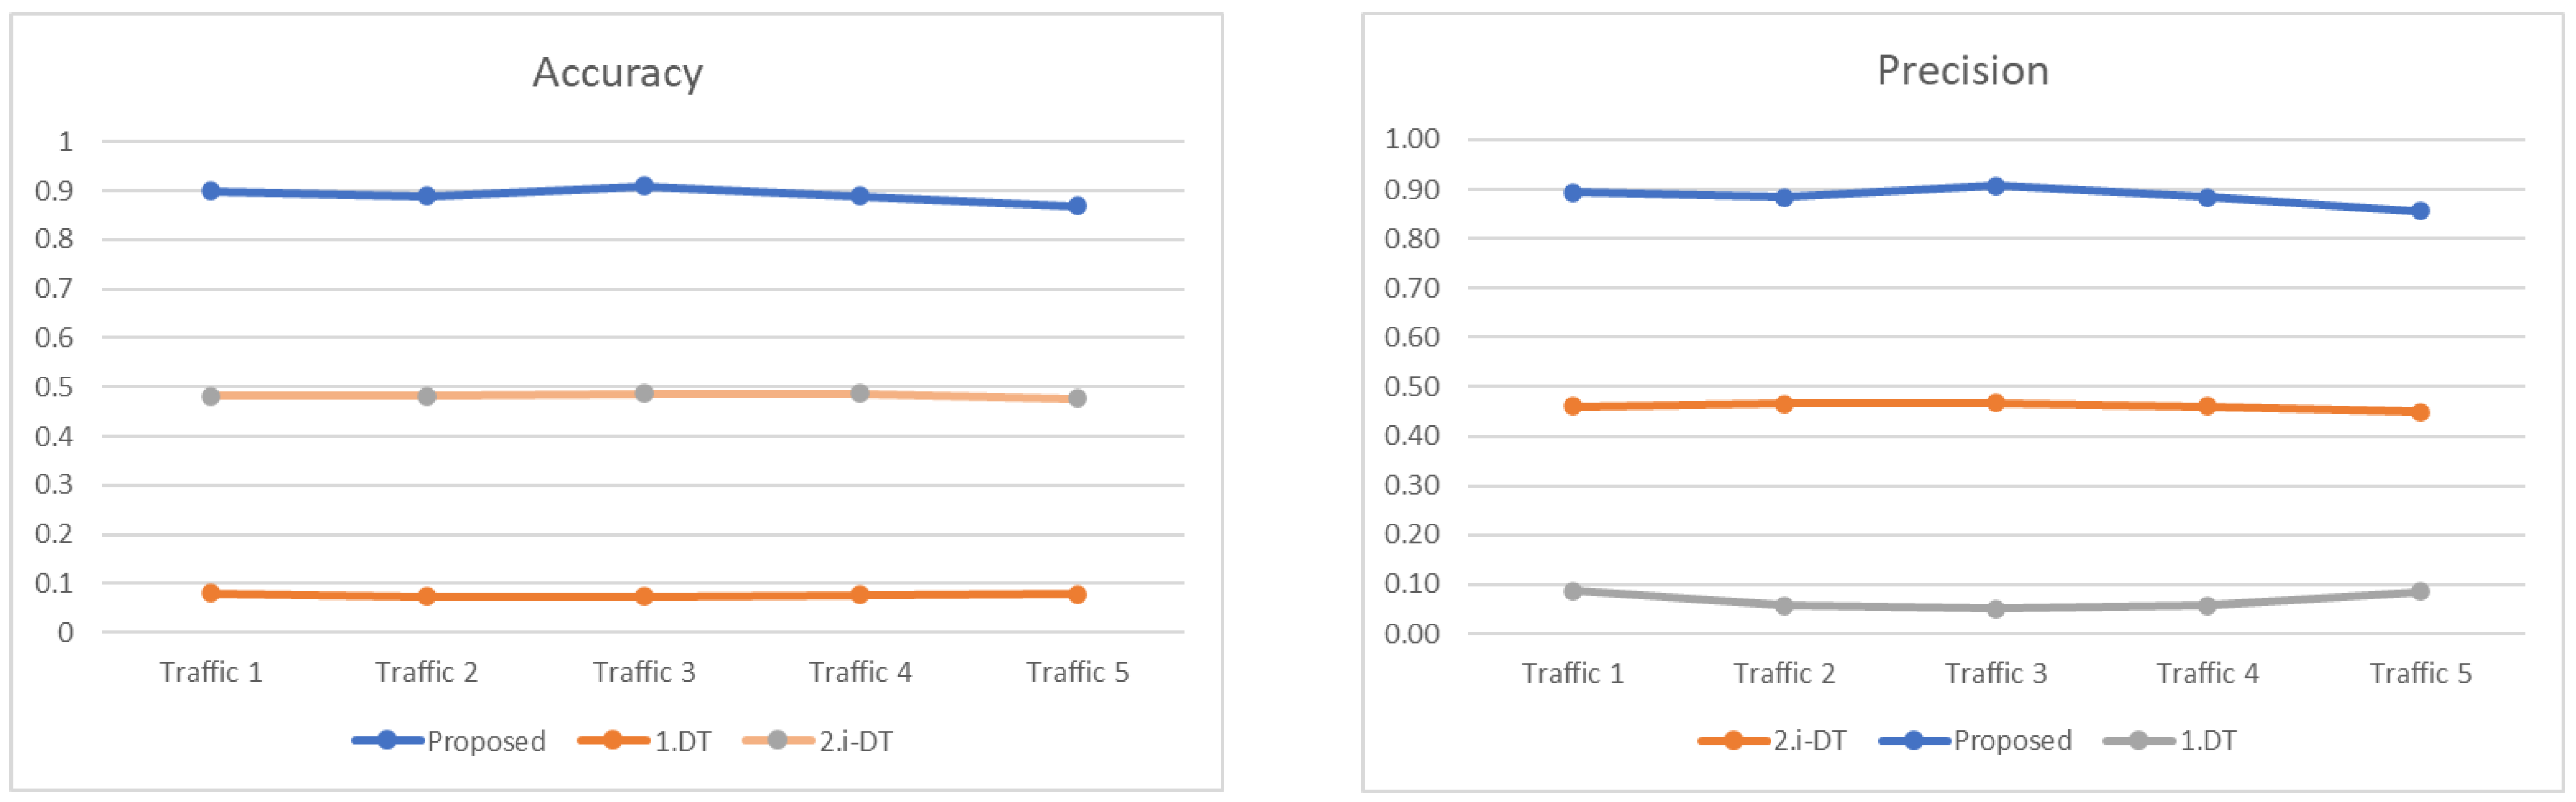
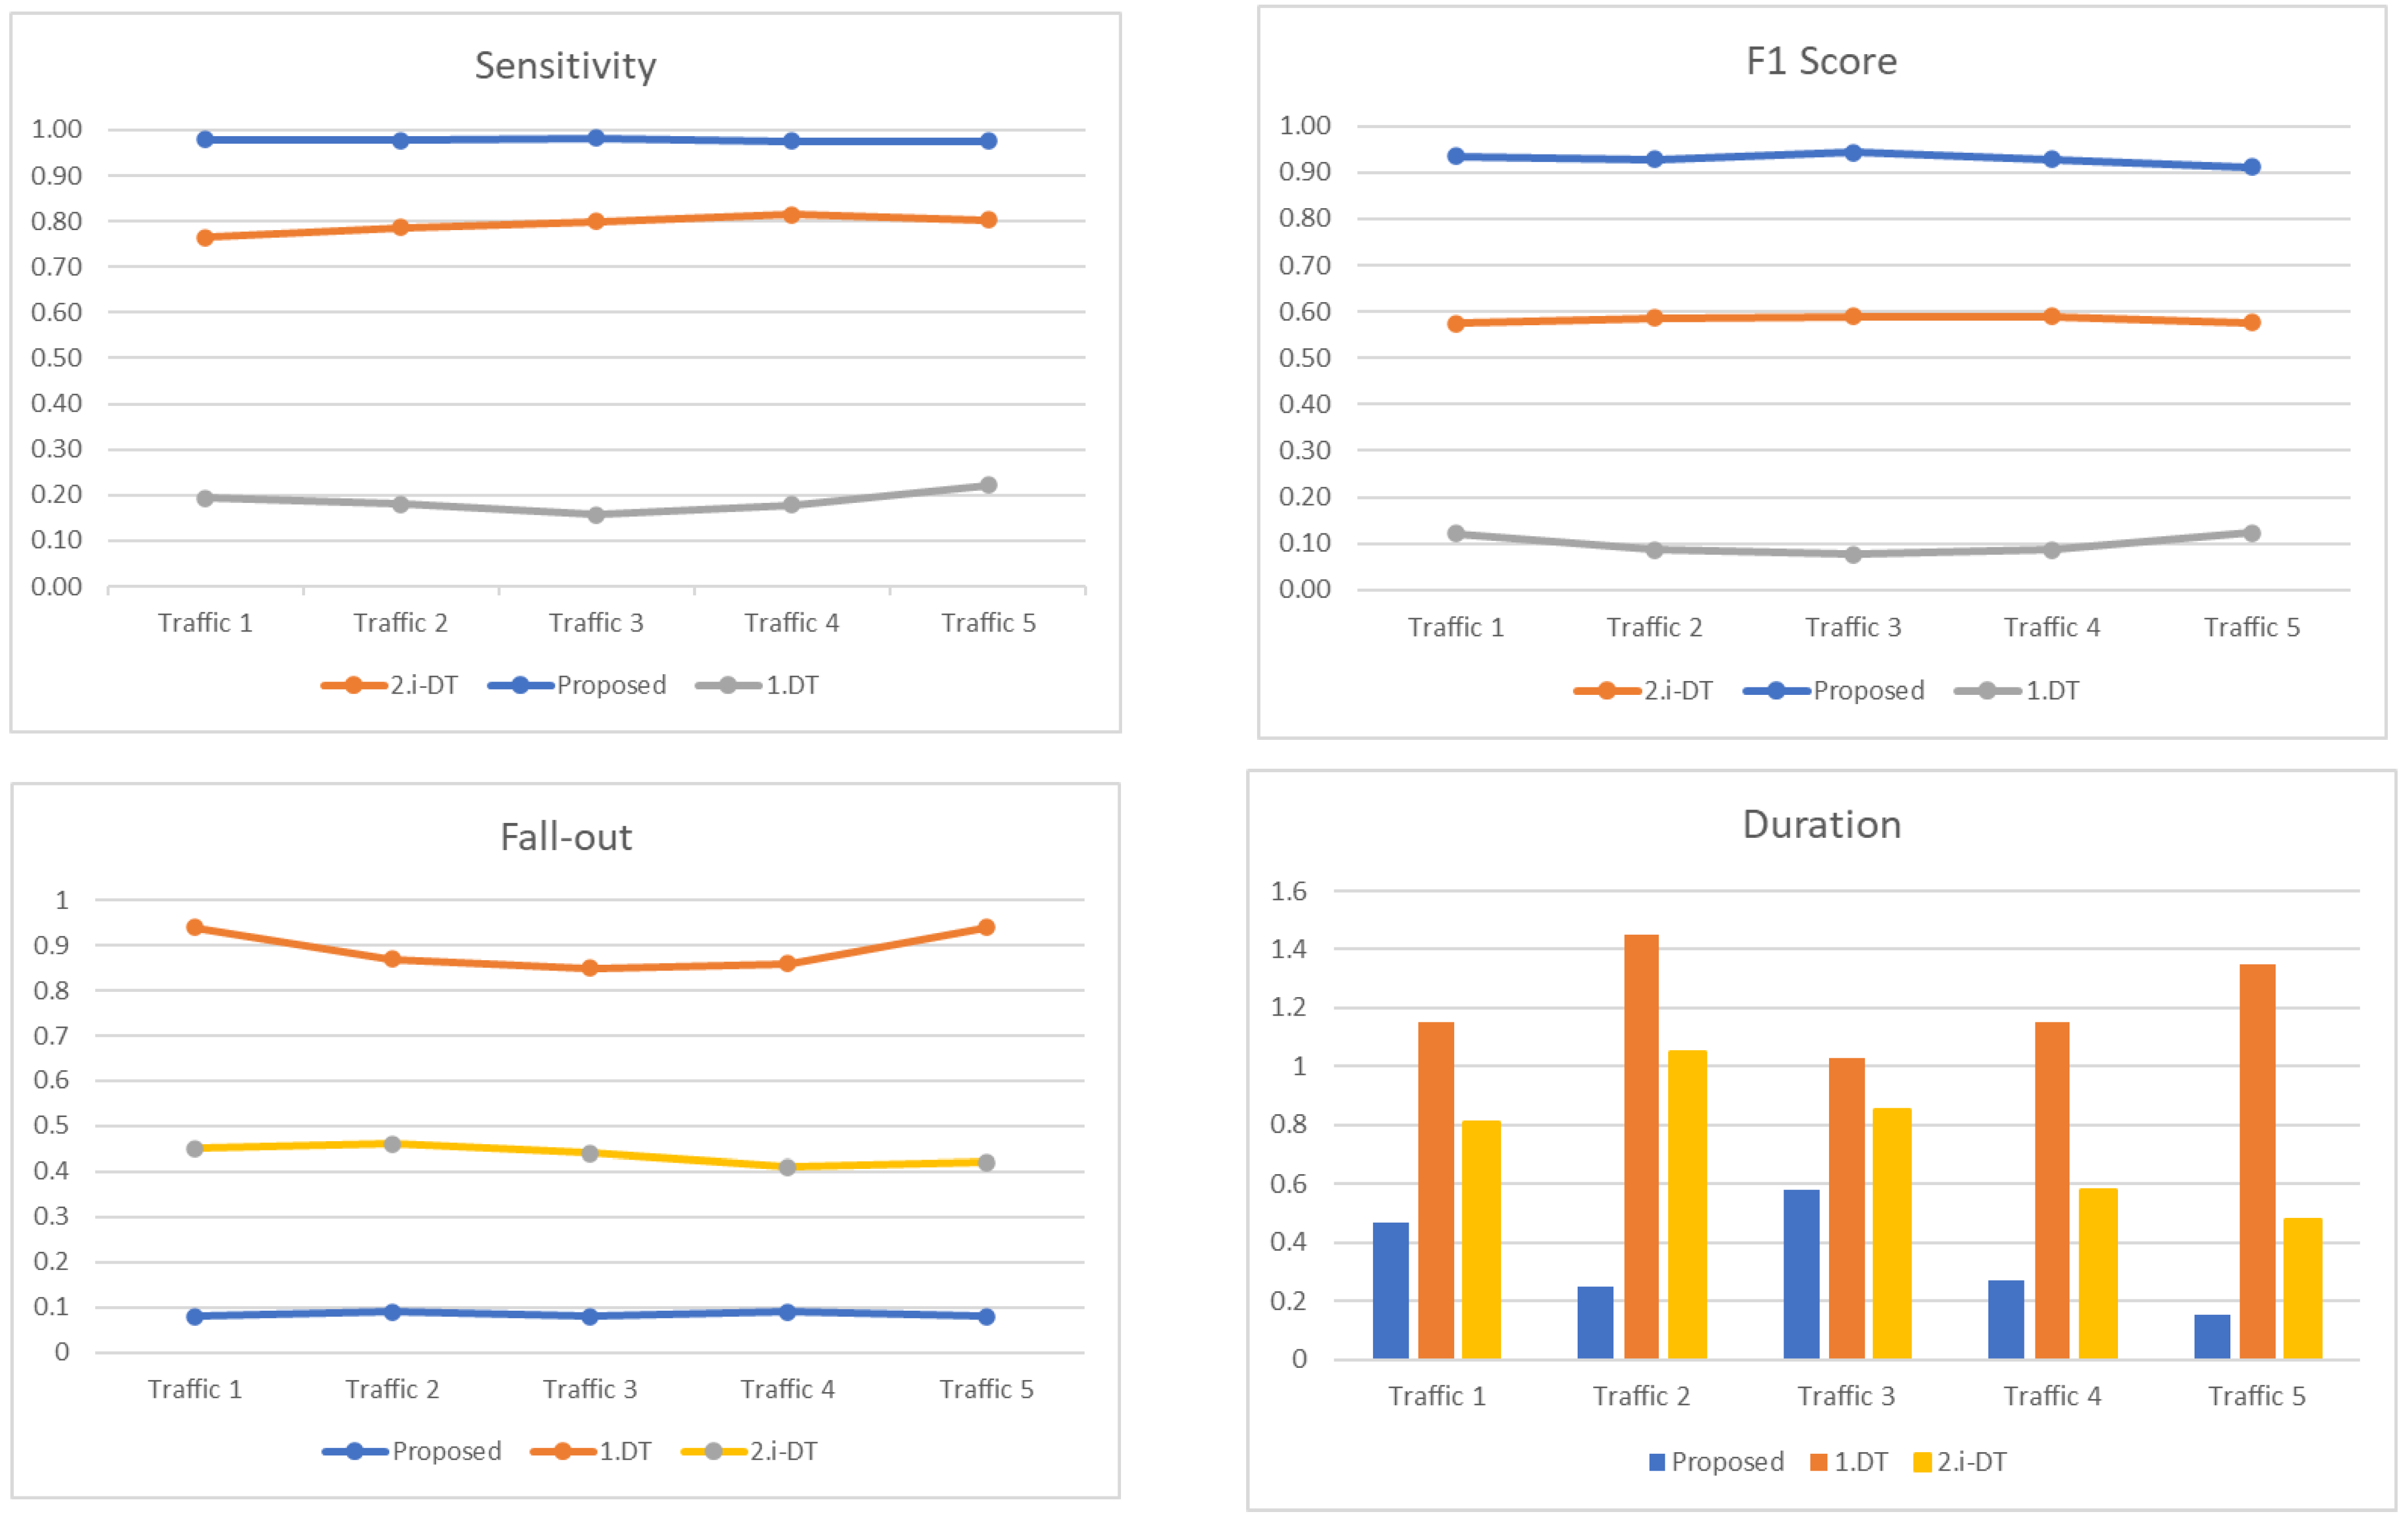
| Traffic | Flows | Techniques | Accuracy | Precision | Sensitivity | F1 Score | Fall-out | Duration |
|---|---|---|---|---|---|---|---|---|
| 1 | 21,596 | 1.DT | 0.08 | 0.088 | 0.193 | 0.121 | 0.94 | 1.15 s |
| 2.i-DT | 0.482 | 0.46 | 0.764 | 0.574 | 0.45 | 0.81 s | ||
| Proposed | 0.9 | 0.895 | 0.979 | 0.935 | 0.08 | 0.47 s | ||
| 2 | 21,592 | 1.DT | 0.073 | 0.057 | 0.181 | 0.086 | 0.87 | 1.45 s |
| 2.i-DT | 0.482 | 0.466 | 0.787 | 0.586 | 0.46 | 1.05 s | ||
| Proposed | 0.89 | 0.885 | 0.978 | 0.929 | 0.09 | 0.25 s | ||
| 3 | 21,594 | 1.DT | 0.074 | 0.05 | 0.157 | 0.076 | 0.85 | 1.03 s |
| 2.i-DT | 0.486 | 0.467 | 0.8 | 0.589 | 0.44 | 0.85 s | ||
| Proposed | 0.91 | 0.908 | 0.983 | 0.944 | 0.08 | 0.58 s | ||
| 4 | 21,592 | 1.DT | 0.077 | 0.057 | 0.178 | 0.087 | 0.86 | 1.15 s |
| 2.i-DT | 0.487 | 0.461 | 0.814 | 0.589 | 0.41 | 0.58 s | ||
| Proposed | 0.89 | 0.885 | 0.975 | 0.928 | 0.09 | 0.27 s | ||
| 5 | 21,593 | 1.DT | 0.079 | 0.085 | 0.221 | 0.123 | 0.94 | 1.35 s |
| 2.i-DT | 0.477 | 0.45 | 0.803 | 0.576 | 0.42 | 0.48 s | ||
| Proposed | 0.87 | 0.856 | 0.976 | 0.915 | 0.08 | 0.15 s |
Disclaimer/Publisher’s Note: The statements, opinions and data contained in all publications are solely those of the individual author(s) and contributor(s) and not of MDPI and/or the editor(s). MDPI and/or the editor(s) disclaim responsibility for any injury to people or property resulting from any ideas, methods, instructions or products referred to in the content. |
© 2023 by the authors. Licensee MDPI, Basel, Switzerland. This article is an open access article distributed under the terms and conditions of the Creative Commons Attribution (CC BY) license (https://creativecommons.org/licenses/by/4.0/).
Share and Cite
Lee, K.-M.; Cho, M.-Y.; Kim, J.-G.; Lee, K.-H. Anomaly Detection Method for Unknown Protocols in a Power Plant ICS Network with Decision Tree. Appl. Sci. 2023, 13, 4203. https://doi.org/10.3390/app13074203
Lee K-M, Cho M-Y, Kim J-G, Lee K-H. Anomaly Detection Method for Unknown Protocols in a Power Plant ICS Network with Decision Tree. Applied Sciences. 2023; 13(7):4203. https://doi.org/10.3390/app13074203
Chicago/Turabian StyleLee, Kyoung-Mun, Min-Yang Cho, Jung-Gu Kim, and Kyung-Ho Lee. 2023. "Anomaly Detection Method for Unknown Protocols in a Power Plant ICS Network with Decision Tree" Applied Sciences 13, no. 7: 4203. https://doi.org/10.3390/app13074203