1. Introduction
Vocal fry is a common voice quality in a healthy voice, but it can also be a sign of a voice disorder [
1,
2,
3,
4,
5]. In a healthy voice, vocal fry functions include sentence/phrase final marking, turn-taking in discourses, and social marking [
6,
7]. In some languages, like for example Jalapa Mazatec, creaky voice, which is similar to vocal fry, is even phonemic, which means that the presence or absence of creak may change the meaning of an utterance [
8]. As a sign of pathology, vocal fry is categorized as a subset of perceived roughness [
9], and it has also been observed to be an indicator of, for example, contact granuloma [
10] or muscle tension dysphonia [
11]. Thus, assessment of vocal fry with regard to potential pathology is relevant in the clinical care of disordered voices, particularly for the indication of treatment and the monitoring of treatment effects. This article focuses on investigating vocal fry from the viewpoints of voice production and perception, without attempting to distinguish pathological from healthy vocal fry.
The diverse definitions of vocal fry in the literature are a problem that impedes clinical and scientific communication. Vocal fry is defined either in terms of voice production or auditory perception, and a knowledge gap exists between these two levels of description.
Several examples of diverging characterizations exist:
On the level of voice production, Laver observed that the literature treated the terms fry and creak as synonyms [
6]. He also observed that fry was characterized by a low vocal fold vibration frequency down to 40 Hz, a small size of the vibrating portion of the vocal folds, a low transglottal airflow rate down to 1.25 cl/s, small subglottal air pressure, and slackness of the vocal folds. Large pulse-to-pulse frequency variation (i.e., frequency jitter, double or triple pulsing) and damping of the vocal folds by the ventricular folds resulting in prolonged closed phases were also observed, but not in all instances of vocal fry. Both creak and fry are also characterized in the literature by a constricted glottis [
12,
13]. In addition, vocal fry may be considered to be contrasted with falsetto, which has a high fundamental frequency Fo and a large open quotient Qo [
14,
15].
Keating et al. use the term creak to refer to several distinct voice types, one of which they term fry [
16]. They characterize so-called prototypical creak by low vibration frequency, strong jitter, and a constricted glottis. The latter is characterized by a small peak glottal opening, a long closed phase, and a low flow rate. According to Keating et al., fry shares all of its properties with prototypical creak, except for jitter, which is substantially smaller in fry. Keating et al. listed double and triple pulsing as another type of creak, as well as pressed voice (i.e., non-low pitched creak).
Gerrat and Kreiman observed that the literature used the term vocal fry for voices with low vibration frequencies involving large variations, or double pulsing irrespective of pitch [
17].
Imazumi and Gauffin distinguished between creak and fry based on the within-vowel position. They stated that creak is a type of fry and is observed in of the end of a vowel [
18].
With regard to auditory perception, vocal fry is reminiscent of a stick being run along a railing or the popping of corn, with temporal auditory segregation of individual acoustic pulses occurring [
13,
19,
20]. A stick that is run along a railing results in quasi-periodic pulses, while the pulses associated with popping corn are random. Pauses between glottal pulses, i.e., sufficiently long time intervals of glottal inactivity, were observed to be necessary to enable auditory segregation. In particular, a decay of 42–44 dB SPL between pulses was reported as the threshold above which temporal auditory segregation of individual pulses occurs [
21].
The current study defines vocal fry and the related parameters of voice production as follows. On the level of voice production, we focus on the definition of fry by Keating et al., that is, low vibration frequencies, low jitter, and constricted glottis. The voice production parameters that we consider are the vibration frequency
, the open quotient
, and the pulse skewness
. The most relevant parameter is the vibration frequency of the vocal folds. The average vibration frequencies that have been reported for vocal fry range from 20 Hz to 70 Hz with a mean of 50 Hz [
12]. The open quotient relates the duration of the open glottal phase to the duration of the cycle. One effect of glottis constriction is that the closed glottal phase is long in comparison with the open glottal phase, which results in a small open quotient:
Childers and Lee found an open quotient of 0.25 to 0.45 for fry compared with 0.65 to 0.7 for modal voice, and 0.9 to 1 for breathy voice and falsetto [
22]. Another effect of glottis constriction is that the vocal folds may close faster than they open. This causes an asymmetry of glottal area pulses, which is characterized by the pulse skewness:
According to Childers and Lee, voice types sorted by decreasing of pulse skewness are vocal fry, modal, falsetto, and breathy voices [
22]. In our study, we examine whether glottal pulse skewness has a measurable effect on perceived fry. In particular, increased skewness may be hypothesized to favor the perception of fry because it makes the voice source more transient.
On the level of auditory perception, we define vocal fry as the temporal segregation of individual glottal pulses, meaning that individual glottal pulses are perceived separately. In the past, vocal fry and creak were treated as binary; that is, they were either present or absent [
23,
24]. A possible reason is that perception is less sensitive to differences between items that are categorized together a priori [
25]. However, in our study we examine whether a graduation between vocal fry and modal voice exists because our informal preliminary perceptual observations suggested so. To capture such a hypothetical gradualness, we let listeners rate perceived impulsiveness using a 7-point Likert scale to indicate the extent to which individual glottal pulses segregate temporally. At one end of the scale, the individual glottal pulses cause distinct auditory events that a listener can count, while on the other end of the scale the individual pulses merge temporally, forming a continuous percept. We hypothesize that perceived impulsiveness is a proxy for binary fry, which may be more informative than the binary label since it involves a finer grid. Laver previously stated that at least three degrees of perceptual prominence of most phonatory settings may be distinguished, specifically, slight, moderate, and extreme degrees [
6]. This may also apply to vocal fry. Such distinctions may become more relevant for future linguistic studies in the long run, since one may hypothesize that speakers and listeners may decode and encode para-linguistic information in these graduations.
Pitch strength is the perceptual attribute that reflects how strong (distinct) as opposed to faint the pitch of a sound is perceived [
26]. Informal preliminary perceptual observations suggested that pitch strength varies when voice quality transits from modal voice to fry or vice versa. In particular, pitch strength appeared to be larger in modal voice than in fry. In this study, we test the contribution of pitch strength to perceived fry using a 7-point Likert scale. The term tonality is used as a synonym of the term pitch strength. A related term is pitch salience, which relates to the pitches elicited by individual components of a sound; the assessment of this factor is beyond the scope of this article [
27].
A topic that is currently underinvestigated concerns the internal auditory reference standards of vocal fry. What makes this topic important is that the variability of these standards results in inter- and intra-listener variability in detecting fry. We expect to find substantial differences in reference standards between individual listeners. We assume that these differences may be decreased by anchoring, and that they may be influenced by the short-term segmental context (i.e., the within-vowel co-occurrence of fry and modal voice). Understanding the relevance of anchoring may improve the reliability of perceptual voice assessment in the future. In particular, temporal variations of voice quality are observed in connected speech, which makes the study of the short-term segmental context relevant.
In this study, we first seek to bridge the knowledge gap that exists between the levels of voice production and perception. In particular, we aim to disentangle the effects of vibration frequency
, open quotient
, and pulse skewness
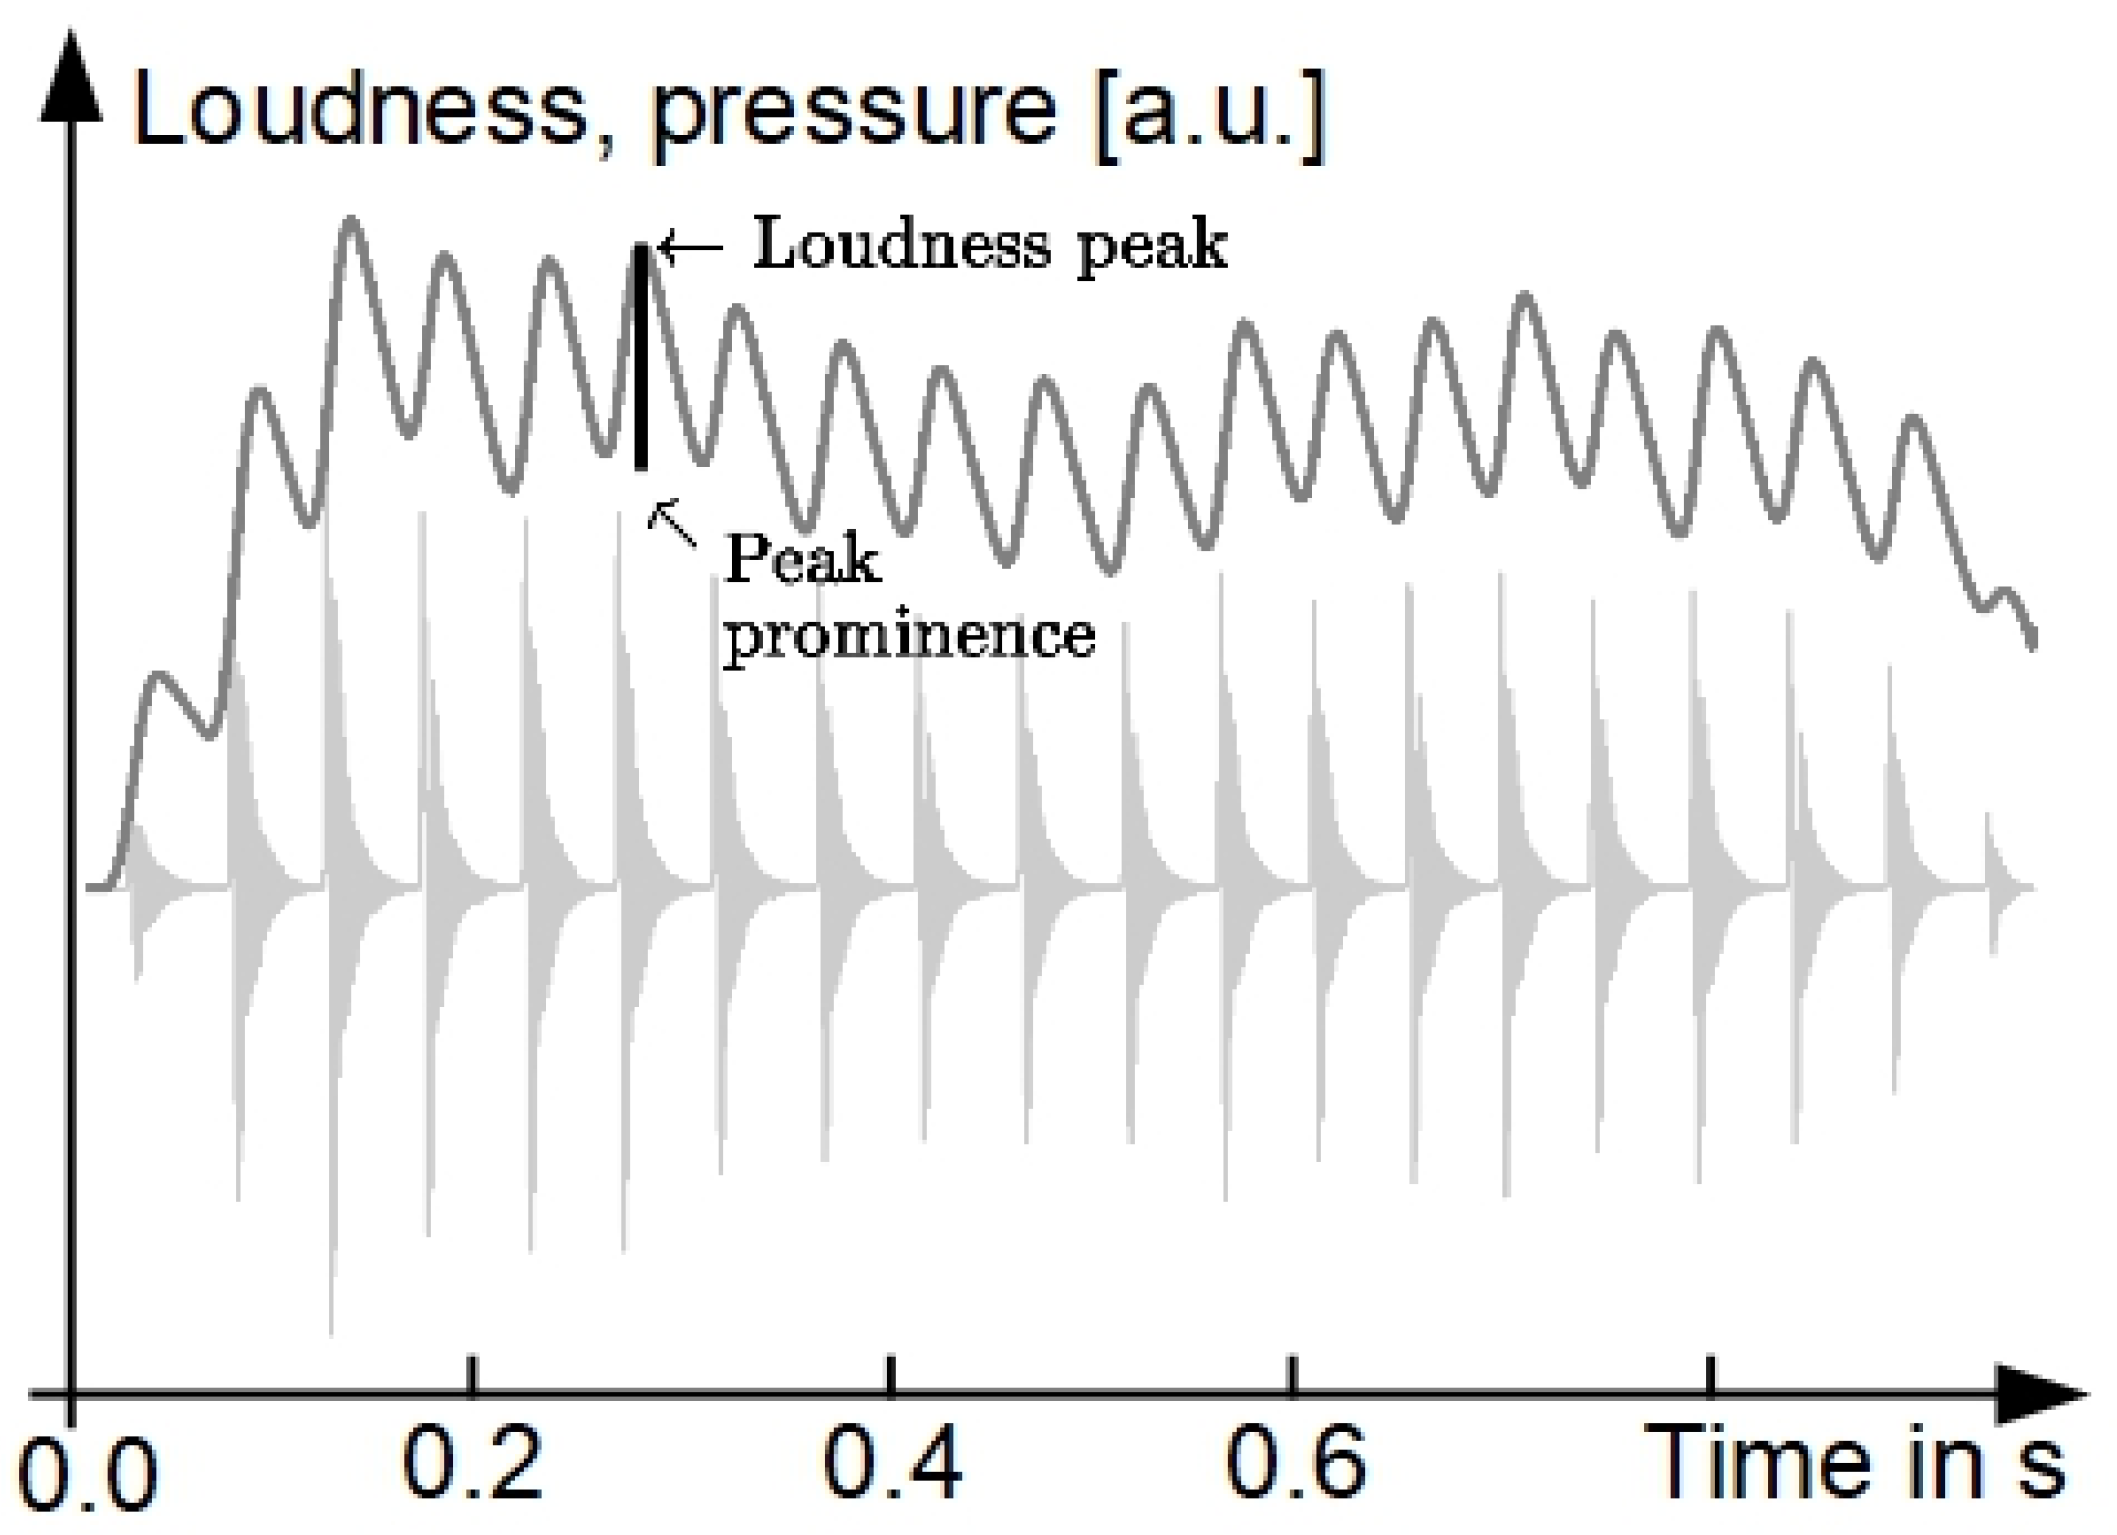
on perceived impulsiveness, tonality, and binary fry. We provide quantitative probabilistic models for the dependencies of auditory fry on these voice production parameters. Second, in order to address auditory perception, we apply Moore et al.’s loudness model with a view to predicting temporal auditory segregation of individual glottal pulses by analyzing the peak prominence in curves of loudness over time, which we term loudness peak prominence (LPP) [
28]. Third, we aim to investigate whether graduations of fry exist. In particular, we test whether perceived impulsiveness is a proxy for perceived binary fry and whether evidence of graduations of fry exists in LPP. Fourth, we monitor the perceived naturalness of synthetic stimuli to investigate whether (i) the synthesizer is capable of producing voice signals that sound similar to human-produced vocal fry signals, and (ii) the control parameters of the synthesizer must be confined so that the stimuli sound similar to human-produced voice. Fifth, we investigate if the internal reference standards listeners use for distinguishing fry from modal voice are influenced by the short-term context. Finally, we will find that it is necessary to discuss, whether these standards are fixed for each listener, and if the standards may be adjusted by anchoring.
Clinical long-term perspectives include the following. First, improving the understanding of the relations between voice production and perception lays the groundwork for improving clinical treatment for improving perceptual voice quality. Second, acquisition of knowledge of the properties of auditory reference standards of listeners is important for improving the current state of voice quality assessment. Finally, another clinical long-term perspective of this work may be the distinction between pathological and non-pathological fry.
The first experiment addresses the effect of vocal frequency , open quotient , and pulse skewness on the perception of vocal fry in vowels with temporally homogeneous voice quality. We use as test stimuli synthesized vowels for which the studied parameters are constant. Our hypotheses are that perceived impulsiveness and the probability of perceived binary fry increase and perceived tonality decreases with (i) decreasing , (ii) decreasing , and (iii) increasing .
In a second experiment, we test whether the short-term context affects the perception of fry. Vowels are used as stimuli with high-low-high changes in the frequency and the open quotient. We hypothesize that increasing the glottal parameter variation favors the perception of fry. That is, when the difference and the difference increase, the stimuli are more likely to be rated as vocal fry and as impulsive and less likely to be rated as tonal.
The remainder of the article is structured as follows. The synthesizer is introduced and the two listening experiments are outlined in
Section 2.
Section 3 presents the results.
Section 4 summarizes the study, and discusses the results and the limitations of the study. Finally,
Section 5 concludes the article.
2. Materials and Methods
2.1. Synthetic Stimuli
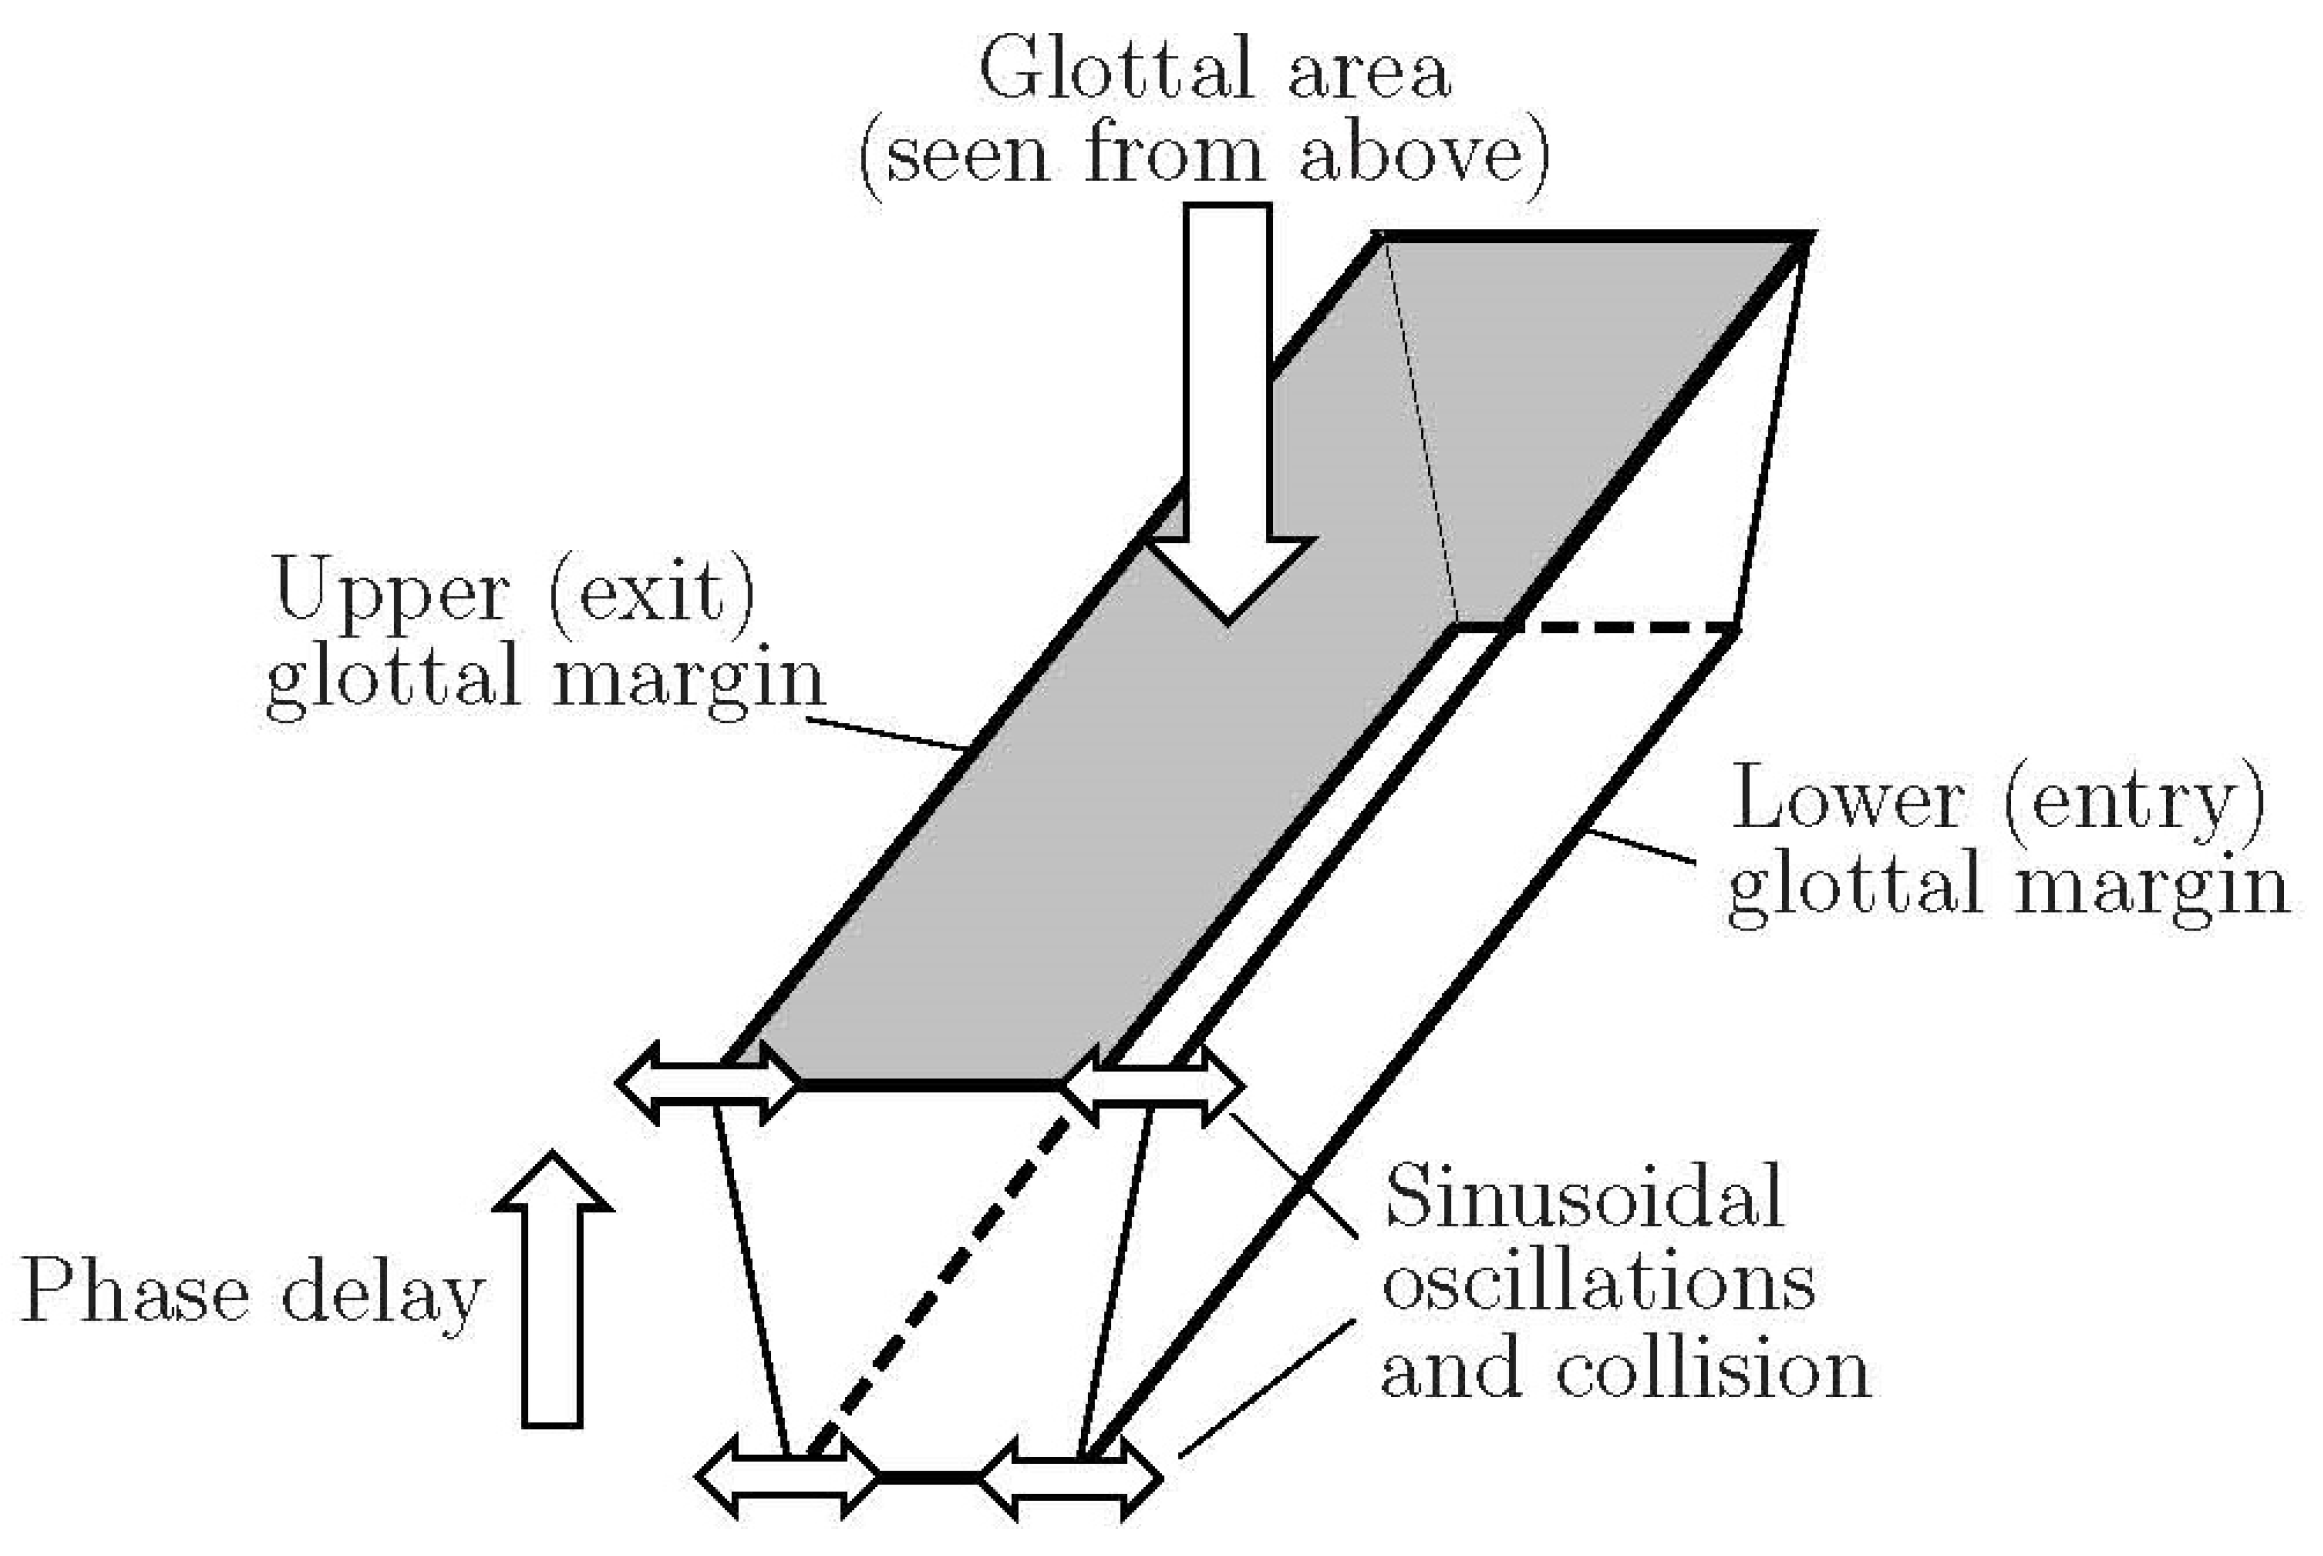
Synthesis has three stages. In stage I, the glottal area waveform is generated using a phase-delayed overlapping sinusoids (PDOS) model [
29].
Figure 1 shows the rectangular glottis with length
. The glottal entrance and exit amplitudes
are calculated with the max operator that sets the areas to zero when the vocal folds touch.
designates corresponding abduction amplitudes,
the vibration amplitudes,
the frequency of vibration, and
the phase delay between glottal entry and exit. The effective glottal area is obtained by the minimum operator for a three-dimensional to two-dimensional projection, that is,
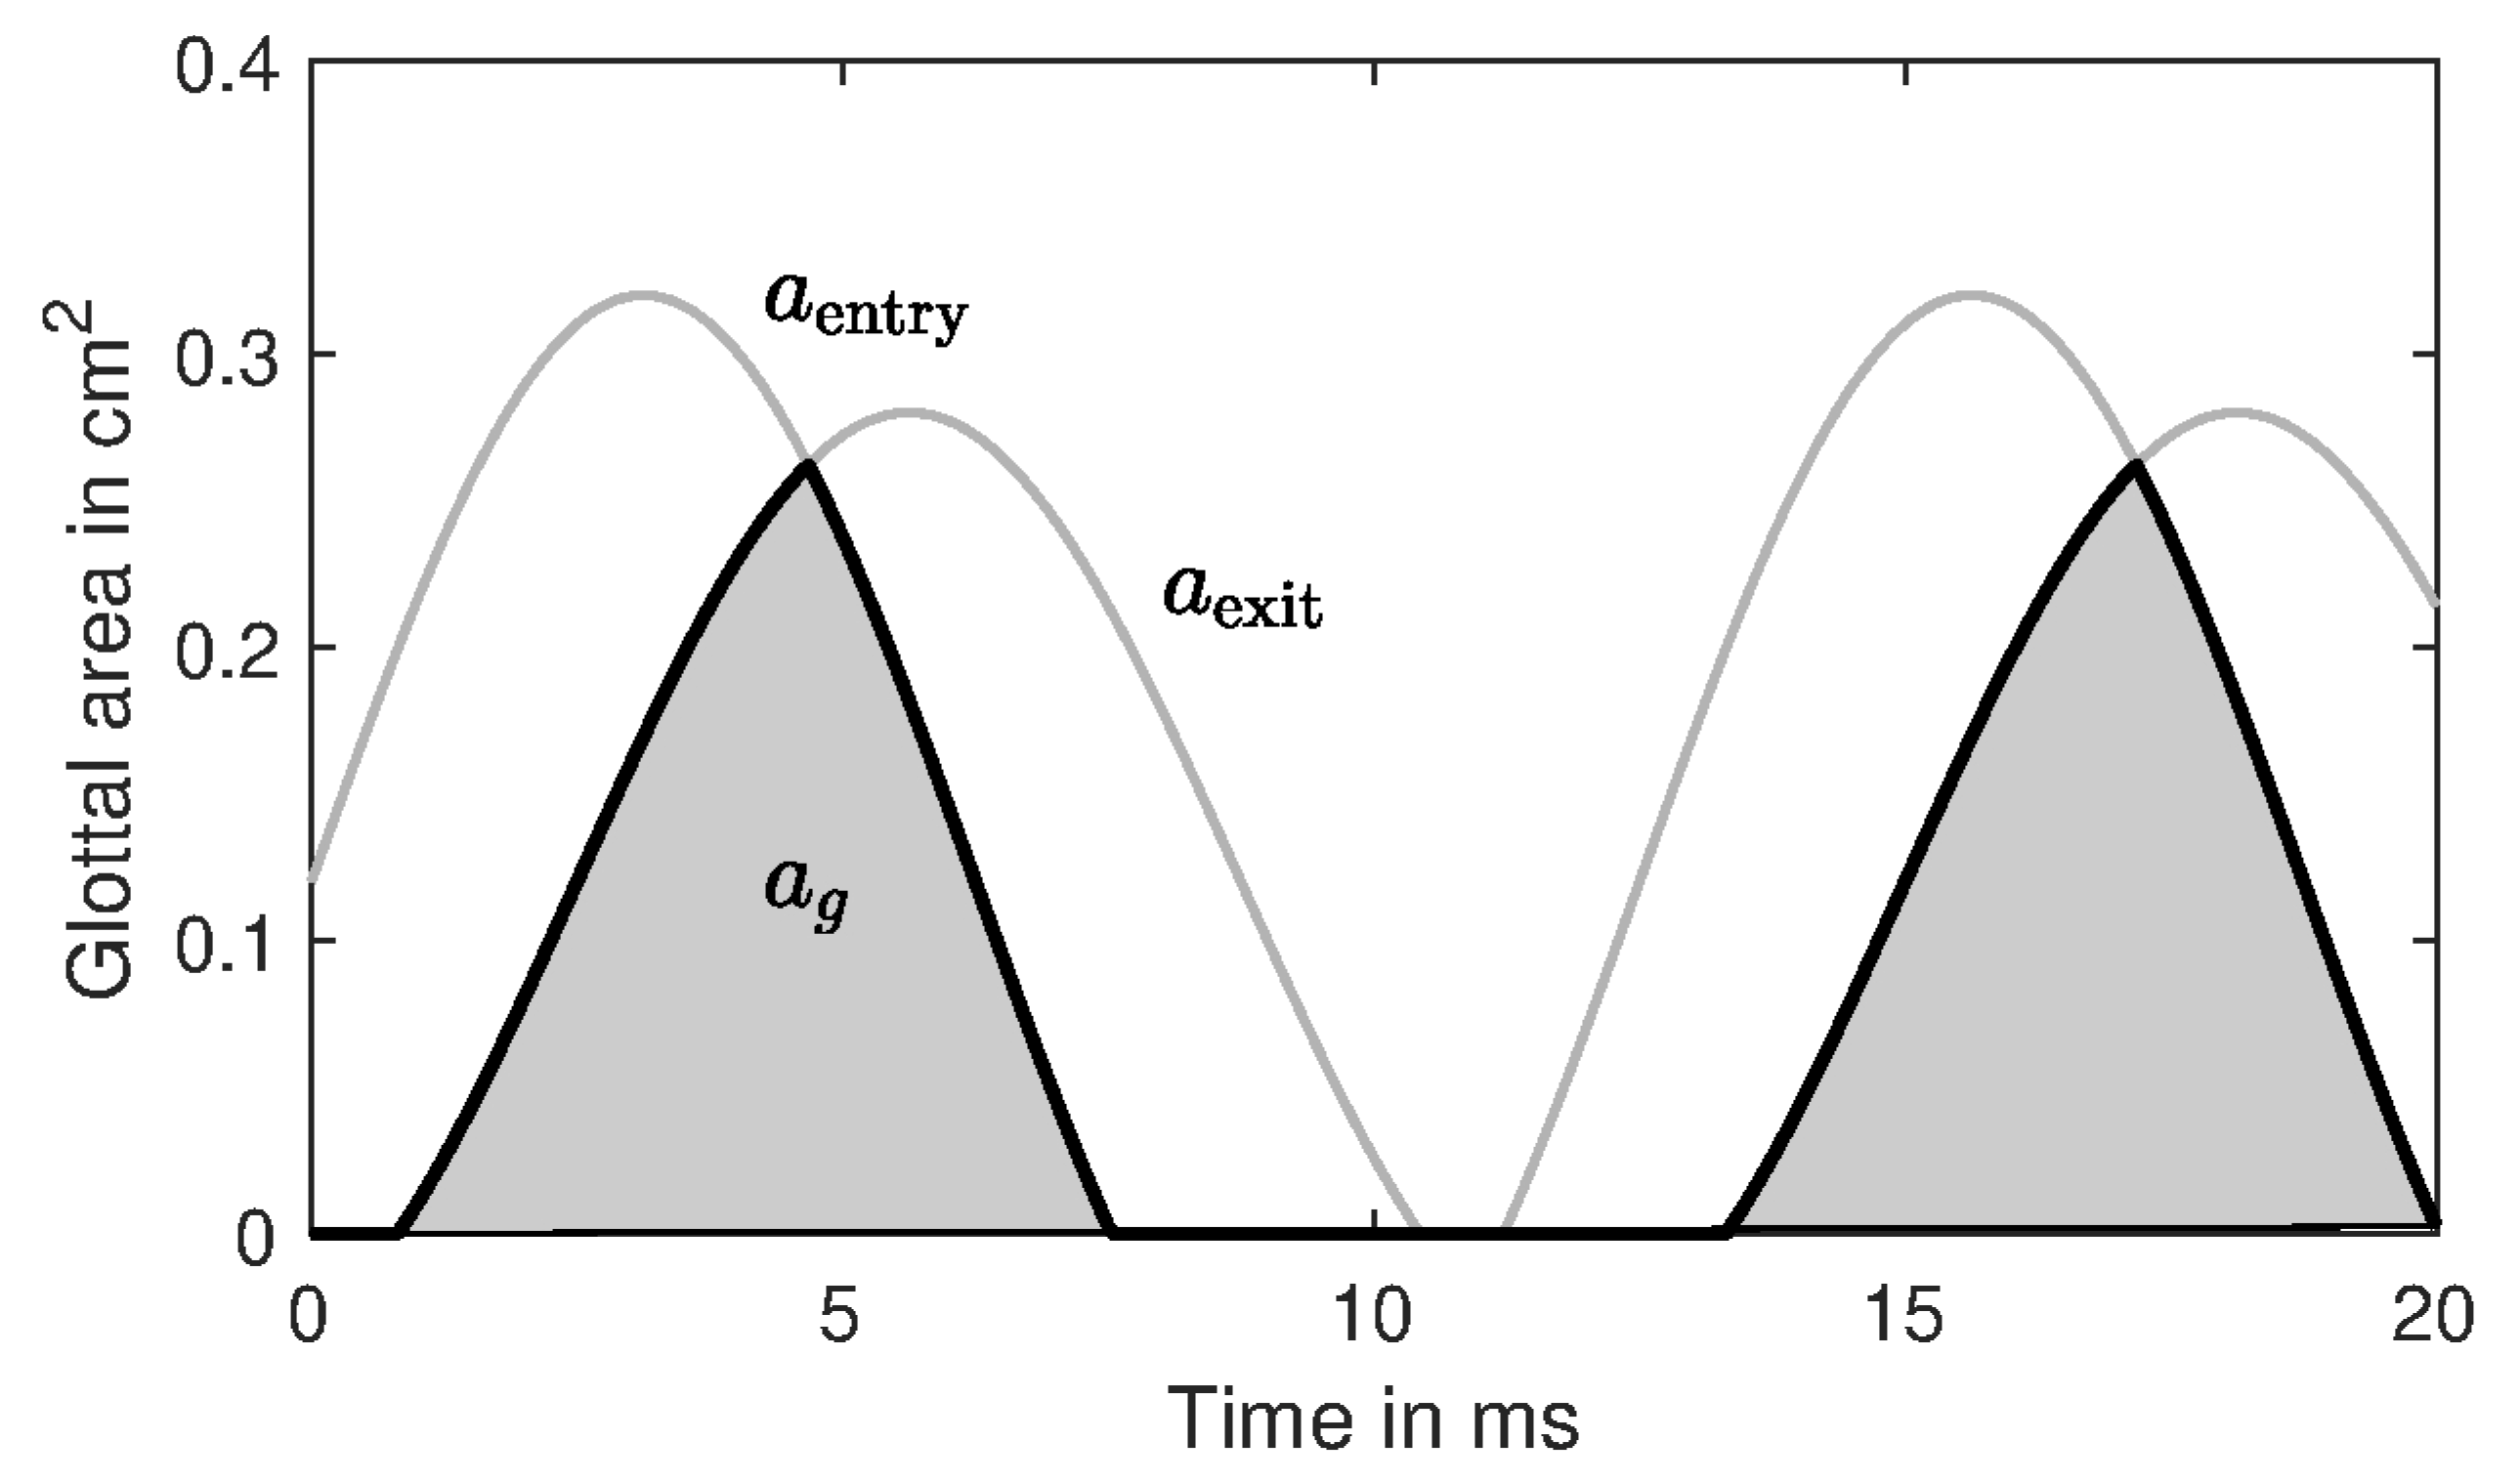
Figure 2 illustrates simulated glottal areas with the following parameter values:
mm,
mm,
mm,
mm,
Hz, and
.
While the frequency of vibration
and the open quotient
are controlled directly, the pulse skewness
of, the glottal area cannot be controlled in the same way. Pulse skewing is thus controlled via the quotient of the amplitudes of the lower (entry) and upper (exit) vibration of the glottal margins, that is,
The glottal area waveform shown in
Figure 2 was generated with an amplitude quotient
, resulting in a pulse skewness of
.
The glottal area waveform is slightly jittered to simulate the relative muscle tension fluctuations of the vocal folds.
Stage II involves the insertion of the glottal area waveform into the Rothenberg model [
29] to obtain the glottal flow rate based on a differential equation. One of the advantages of this model over alternatives is that the Rothenberg equation gives an explicit numerical solution even when the glottal area is zero. The model parameters are the lumped acoustic resistances and inductances of the vocal trachea, glottis, and vocal tract.
In stage III the glottal flow rate is filtered by a concatenation of 25 second-order filters that simulate the vocal tract resonances. Finally, a numerical derivative of the volume velocity simulates the radiation of the acoustic pressure at the lips. A temporal amplitude envelope is imposed that simulates an attack, decay, sustain, and release.
The used stimuli are available online [
30].
2.2. Listening Experiments
In total, 13 listeners (age ranging from 24 to 66 years, seven women and six men) participated. Twelve of the listeners (i.e., listeners 1 to 12) participated in Experiment 1, while eight of the listeners (i.e., listeners 3, 6, 7, 9–13) participated in Experiment 2. All were experienced in perceptual rating of voice quality. Five were speech therapists (listeners 1, 2, 6, 8, and 11), five were speech scientists (listeners 3, 7, 9, 10, and 12), and three were medical doctors (listeners 4, 5, and 13). That diversity made it possible to observe differences in behavior between individuals of diverse backgrounds; however, a formal comparison between professions was not possible because of the small number of listeners per profession. Most of the listeners are native German speakers, with the exception of two speech scientists who speak Luxembourgish and Telugu.
The task was to rate the tonality and impulsiveness of the stimuli and to evaluate the presence or absence of binary fry. To monitor the perceived naturalness of the synthetic sounds, listeners were asked to rate the naturalness of the stimuli.
A 7-point Likert scale was displayed on a graphical user interface (GUI) for each of the attributes: tonality, impulsiveness, and naturalness. The scales ranged from
(atonal, non-impulsive, artificial) to
(tonal, impulsive, natural). Additionally, listeners were asked to provide a yes/no reply regarding the perceived presence of fry. At the beginning of each experiment, eight (
) stimuli obtained using all combinations of the most extreme parameter values
,
, and
were presented to anchor and familiarize listeners with the range of voice qualities covered by the evaluation scales and to increase the expected reliability of the ratings [
31].
After anchoring, the main corpus was rated. Next, listeners rated stimuli chosen randomly from the main corpus a second time for testing intra-rater reliability. The stimuli within the three blocks (anchoring, main corpus, repetitions) were presented in a random order, which was the same for all listeners. The listeners were allowed to listen to each stimulus as often as they wished.
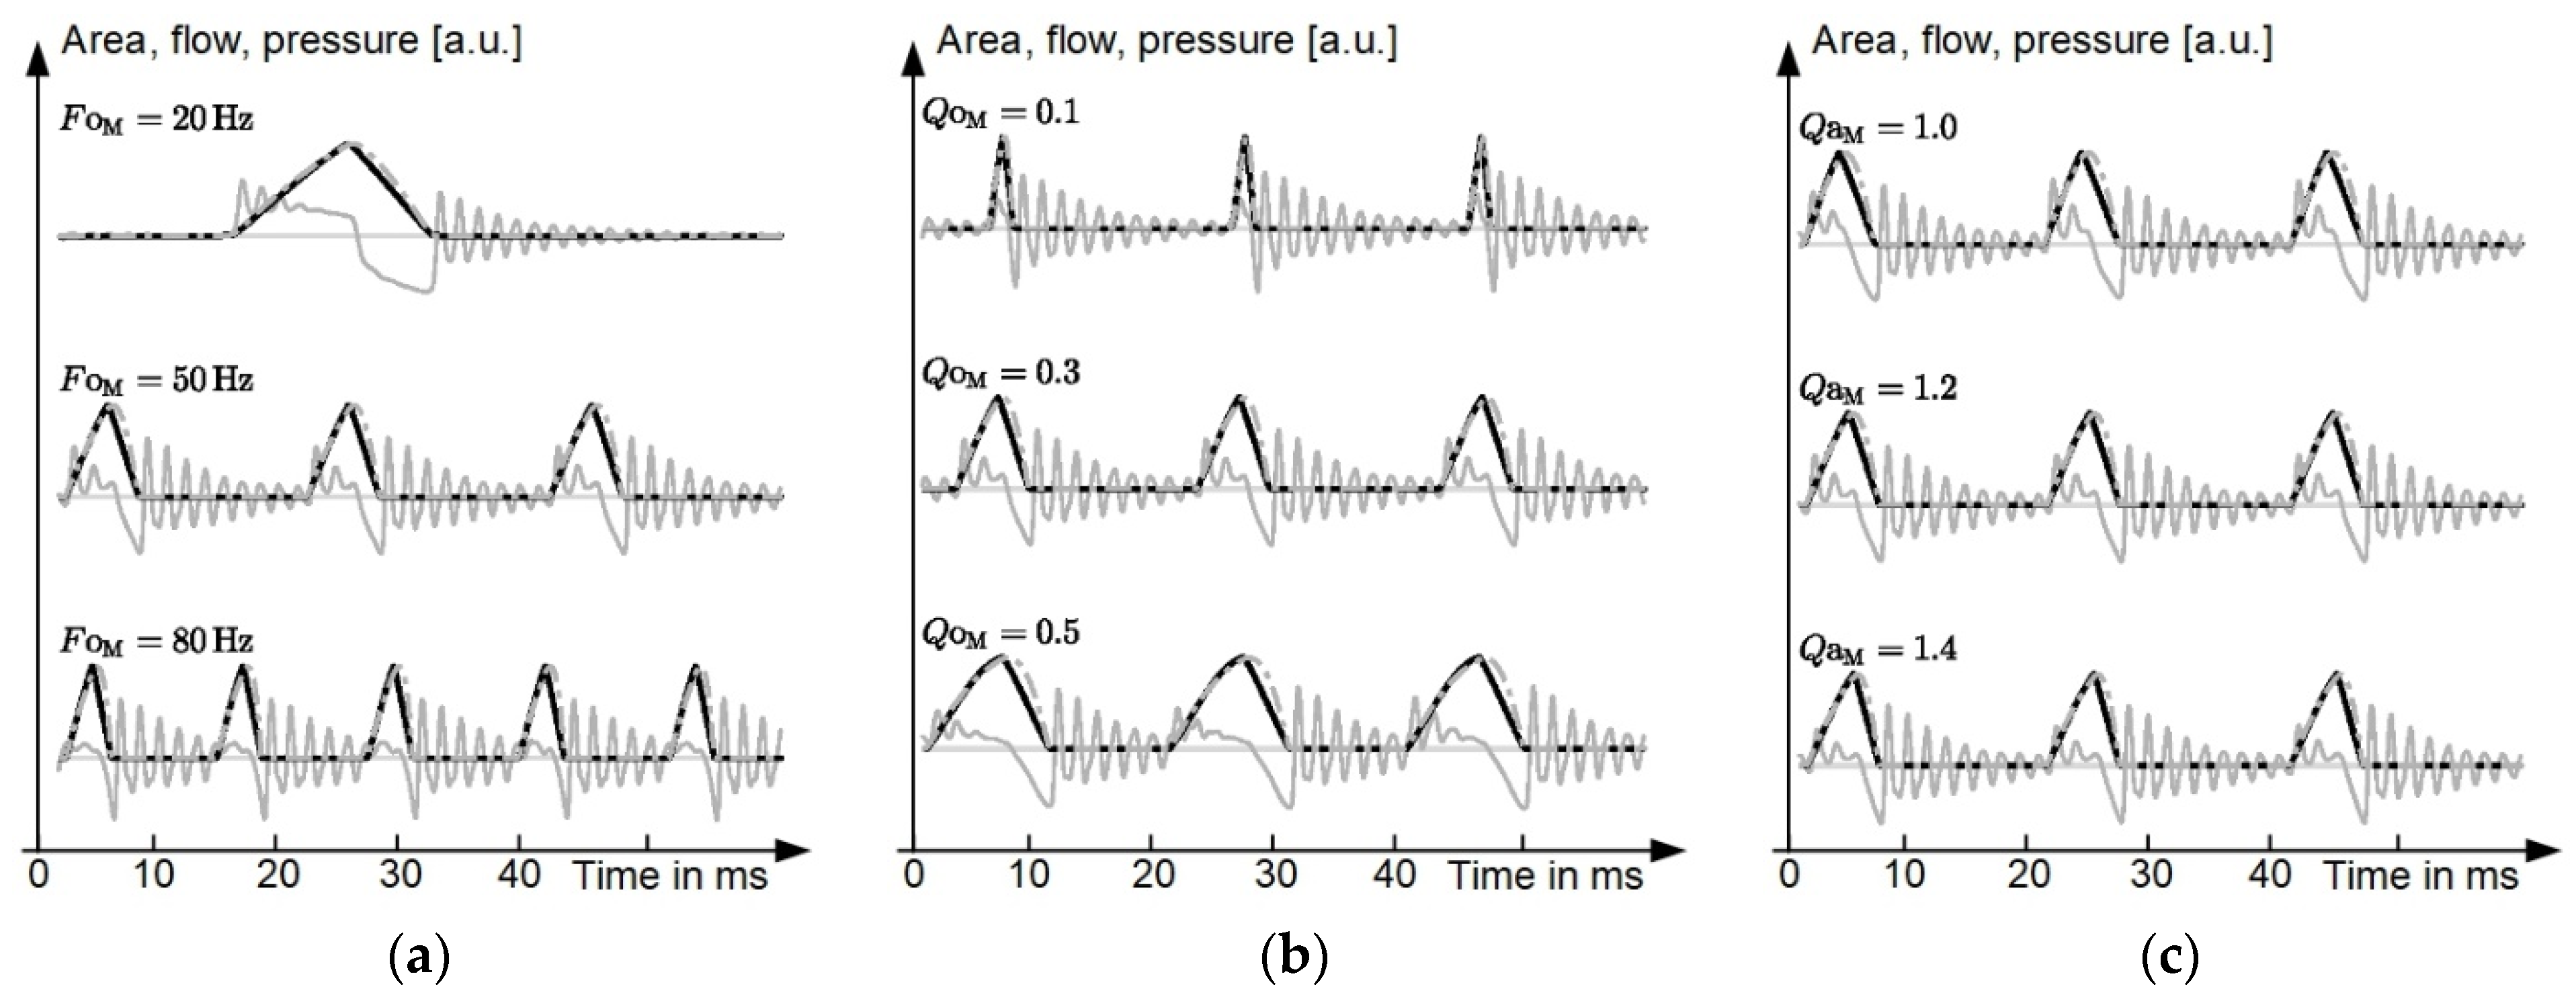
Figure 3 illustrates the effects of model parameters
,
, and
on the glottal area, the glottal flow rate, and the acoustic pressure at the lips. The vibration frequency and the open quotient are controlled directly by corresponding model parameters, that is,
and
. However, the skewness of glottal area pulses is controlled by the model parameters amplitude quotient and the open quotient:
. Thus, for evaluation with regard to skewness,
is extracted from glottal area waveforms according to Equation (2) obtained via linear regression
with
.
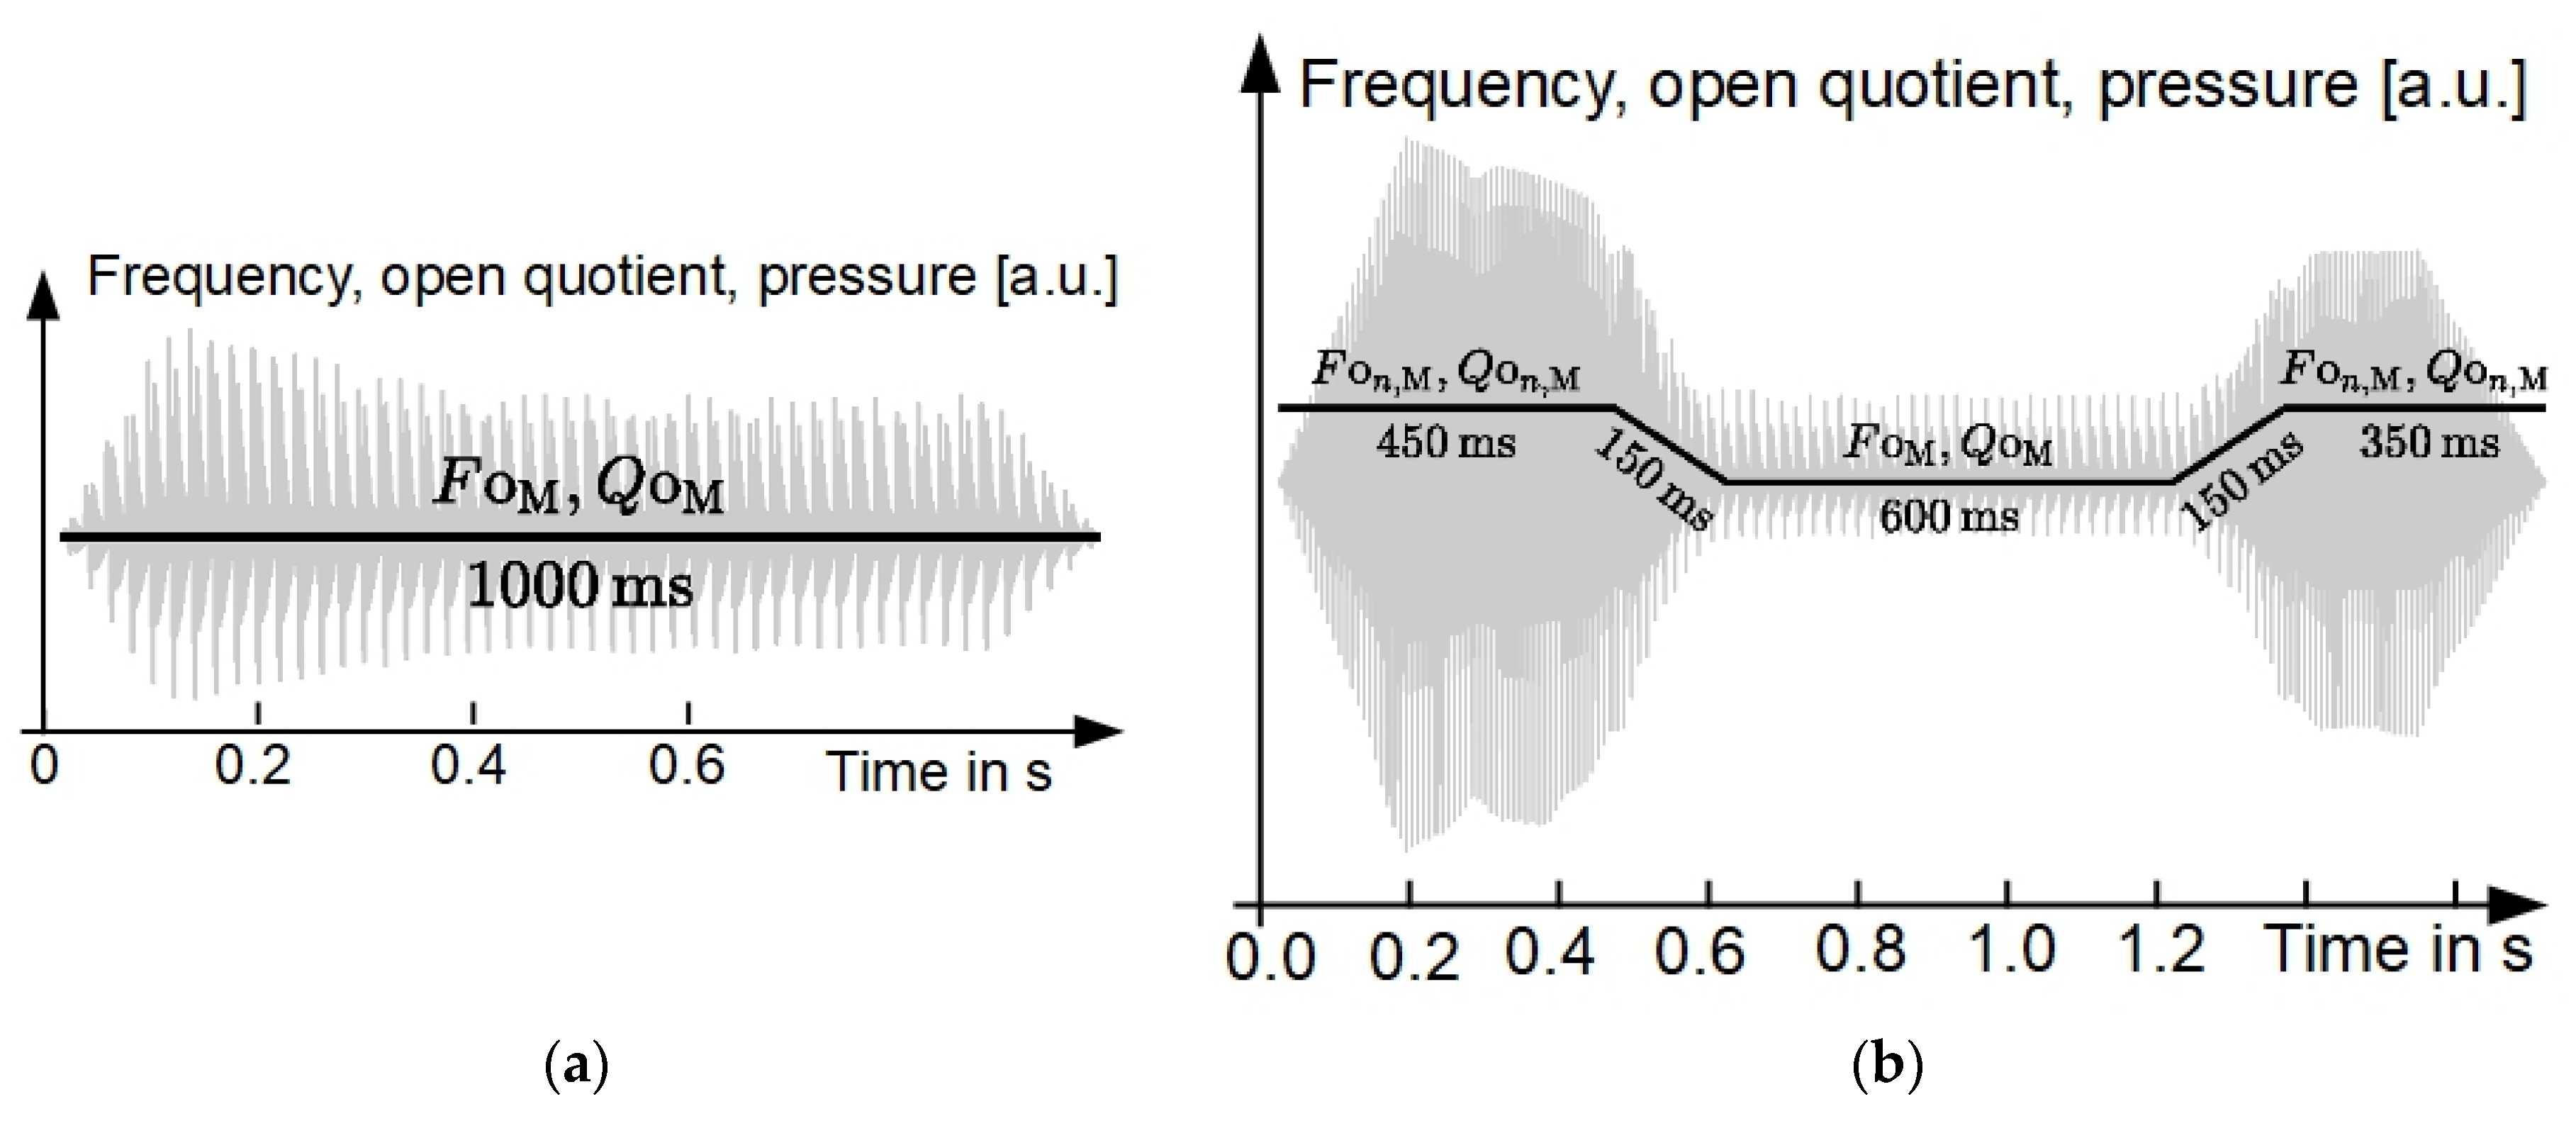
Figure 4 compares examples of acoustic pressure waveforms of the stimuli and illustrates changes in glottal parameters for the two experiments.
Both experiments were carried out on a personal computer. The pre-rendered stimuli were played back via a Lexicon Omega external sound card and AKG K271 headphones. Listeners individually adjusted the playback level to a comfortable level. Both experiments lasted about 30–40 min per listener, and listeners were allowed to take breaks at any time.
Regarding the choice of the headphones and its frequency range, as well as the spectral components contained in the stimuli, the following is noted. According to the headphones’ manufacturer, its lower frequency limit is 16 Hz. However, the headphone’s frequency response is not linear down to 16 Hz, but a roll-off is observed. Nevertheless, the headphones were considered suitable for the reported experiments for the following reasons. In particular, although the experiment dealt with stimuli with very low fundamental frequencies
, the stimuli’s lowest spectral components were less relevant than components with higher frequencies. Reasons are found in the levels of hearing physiology and voice production. First, as a result of hearing physiology, the stimuli did not contain much, if any, audible spectral components below 30 Hz, since the absolute hearing thresholds are approximately 60, 80, and 100 dB re 20 µPA at 30, 20, and 10 Hz, respectively [
32], while the overall playback level was comfortable. In addition, the relevance of the lowest spectral components is further reduced because the relative levels of the lowest components are generally smaller in vocal fry than in other voice types. In particular, e.g., an increased harmonic richness factor (HRF) was reported for vocal fry in the past [
22]. A low H1–H2 was also reported [
16].
2.2.1. Experiment 1
In Experiment 1, one-second-long synthesized vowels with homogeneous voice quality were used as stimuli. Three of the main vocal fold control parameters used in the PDOS model (indicated with subscript ) were varied as follows:
Frequency Hz
Open quotient
Amplitude quotient
Thus, the main corpus consisted of 7 () × 5 ( × 5 () = 175 stimuli. Thirty stimuli were presented a second time at the end of Experiment 1.
2.2.2. Experiment 2
In Experiment 2, the voice quality in synthesized vowels was evolving via glottal parameters and . Each stimulus had a length of 1.7 s, so that the length of the middle segment was long enough for auditory judgement. Starting with modal phonation mode using and , the two glottal parameters were continuously varied after 450 ms to and with a short transition of 150 ms. At 1.2 s, the parameters were increased back again to their initial values and using another 150 ms transition, and were then kept constant until the end of the stimulus.
The listeners participating in Experiment 2 were asked to ignore the short-term context (i.e., the initial and final segments of the stimulus) and to rate only the mid-vowel segment. As in Experiment 1, listeners rated the mid-vowel segment with regard to perceived tonality, impulsiveness, and naturalness and also judged the presence or absence of binary fry.
The 80 stimuli of the main corpus used in Experiment 2 combined different values of parameters & and . The amplitude quotient was kept constant. The 80 random fundamental frequencies of the context segments (i.e., the initial and final segments of stimuli) were uniformly distributed in the interval Hz. The corresponding 80 random values of the mid-vowel segment were normally distributed in the interval Hz (mean 65 Hz, standard deviation 20 Hz). Similarly, 80 random open quotients were uniformly distributed in the interval for the context segments and normally distributed in the interval (mean 0.3, standard deviation 0.08) for the mid-vowel segment.
To test the intra-rater reliability, 15 stimuli randomly chosen from the main corpus were rated a second time after presentation of the main corpus.
2.3. Loudness Peak Prominence (LPP)
We propose a psychoacoustic feature that reflects the degree of temporal auditory segregation of individual glottal pulses. We obtain the LPP using an established model of time-varying loudness [
28]. The rationale is that a substantial decay of perceptual loudness between subsequent glottal pulses enables temporal segregation. The extraction of the LPP is described as follows. The loudness curve over time is calculated from the signal via linear outer and middle ear filters, followed by inner ear filtering and loudness calculation. The headphones transfer function is modeled together with the outer ear using data measured with a dummy head as described in [
33]. Inner ear filtering involves a non-linear auditory filter bank predicting the excitation level of cochlear neurons as a function of time and frequency. The loudness is obtained from neural excitation levels by summation over frequencies, followed by level compression, and temporal smearing. For temporal smearing, a simple difference equation yields short-term loudness owing to selected rise and fall time constants, which are 21.7 and 49.5 ms, respectively.
For the purpose of illustrating the relationship between the acoustic waveform and the LPP,
Figure 5 shows at the bottom the acoustic waveform of an example stimulus of Experiment 1 together with its modeled loudness curve over time (top). The LPP of a stimulus is given by the median loudness difference between local maxima and minima in the temporal pattern of the short-term loudness.
3. Results
This section reports the results of the two listening experiments. Listener reliability and predictions of binary fry, tonality, impulsiveness, and naturalness by means of all-listener and listener-specific regression analyses are presented, as well as receiver operating characteristic (ROC) analyses.
First, inter- and intra-listener reliability are assessed by means of Cronbach’s
[
34] and Pearson’s correlation coefficient
, respectively. High overall values of
are found, except for naturalness reported in Experiment 2 (fry: 0.93 and 0.90, impulsiveness: 0.97 and 0.96, tonality: 0.97 and 0.94, naturalness: 0.93 and 0.83 for Experiments 1 and 2, respectively). Note that
is affected by the number of items in the test [
35], and that the larger number of listeners in Experiment 1 resulted in a higher
than in Experiment 2. Regarding intra-listener reliability, mean correlation coefficients
and 0.64, except for naturalness, where
and 0.51.
3.1. Perceived Binary Fry Predicted from Glottal Parameters
The probability of perceived binary fry is modeled by logistic regression for each experiment separately.
Table 1 lists z-normalized coefficient estimates and corresponding p-values of the all-listeners binomial logistic regression model. For Experiment 1, both frequency
and open quotient
are significant. The probability of perceiving binary fry increases with a decreasing
and a decreasing
. However, the coefficient values for
and
suggest that the influence of
is small compared with that of
. In addition, the area under the ROC curve (AUC, not shown) obtained with
as a single predictor is 0.907, and it increases only slightly to 0.91 if
is included as a second predictor.
Table 2 lists z-normalized coefficient estimates and corresponding p-values for listener-specific binomial logistic regression models predicting the probability of perceived fry from glottal parameters. While the frequency
significantly affects the probability of perceived fry for the majority of listeners with equal effect directions, the open quotient
is significant only for 3 of 12 listeners participating in Experiment 1, when the Bonferroni–Holm correction is used [
36]. Moreover, effect directions of the three listeners do not agree. In particular for Listener 8, the perception of fry increases with increasing
.
As in Experiment 1, perceived binary fry also increases with decreasing
and decreasing
in Experiment 2 (cf.
Table 1). A listener-specific binomial logistic regression analysis reveals that all eight listeners appear to be sensitive to
, and only two listeners are sensitive to
(cf.
Table 2). An AUC of 0.877 is found using
as the predictor with a cutoff threshold estimate at 70.6 Hz. Similar to Experiment 1, the AUC (0.896) increases only slightly if
is included as an additional predictor. Regarding the effects of the short-term context, the influence of
and
was not found to be significant. However,
misses significance only marginally (
p = 0.062). Its effect direction matches our hypothesis; that is, larger frequency differences favor the perception of fry.
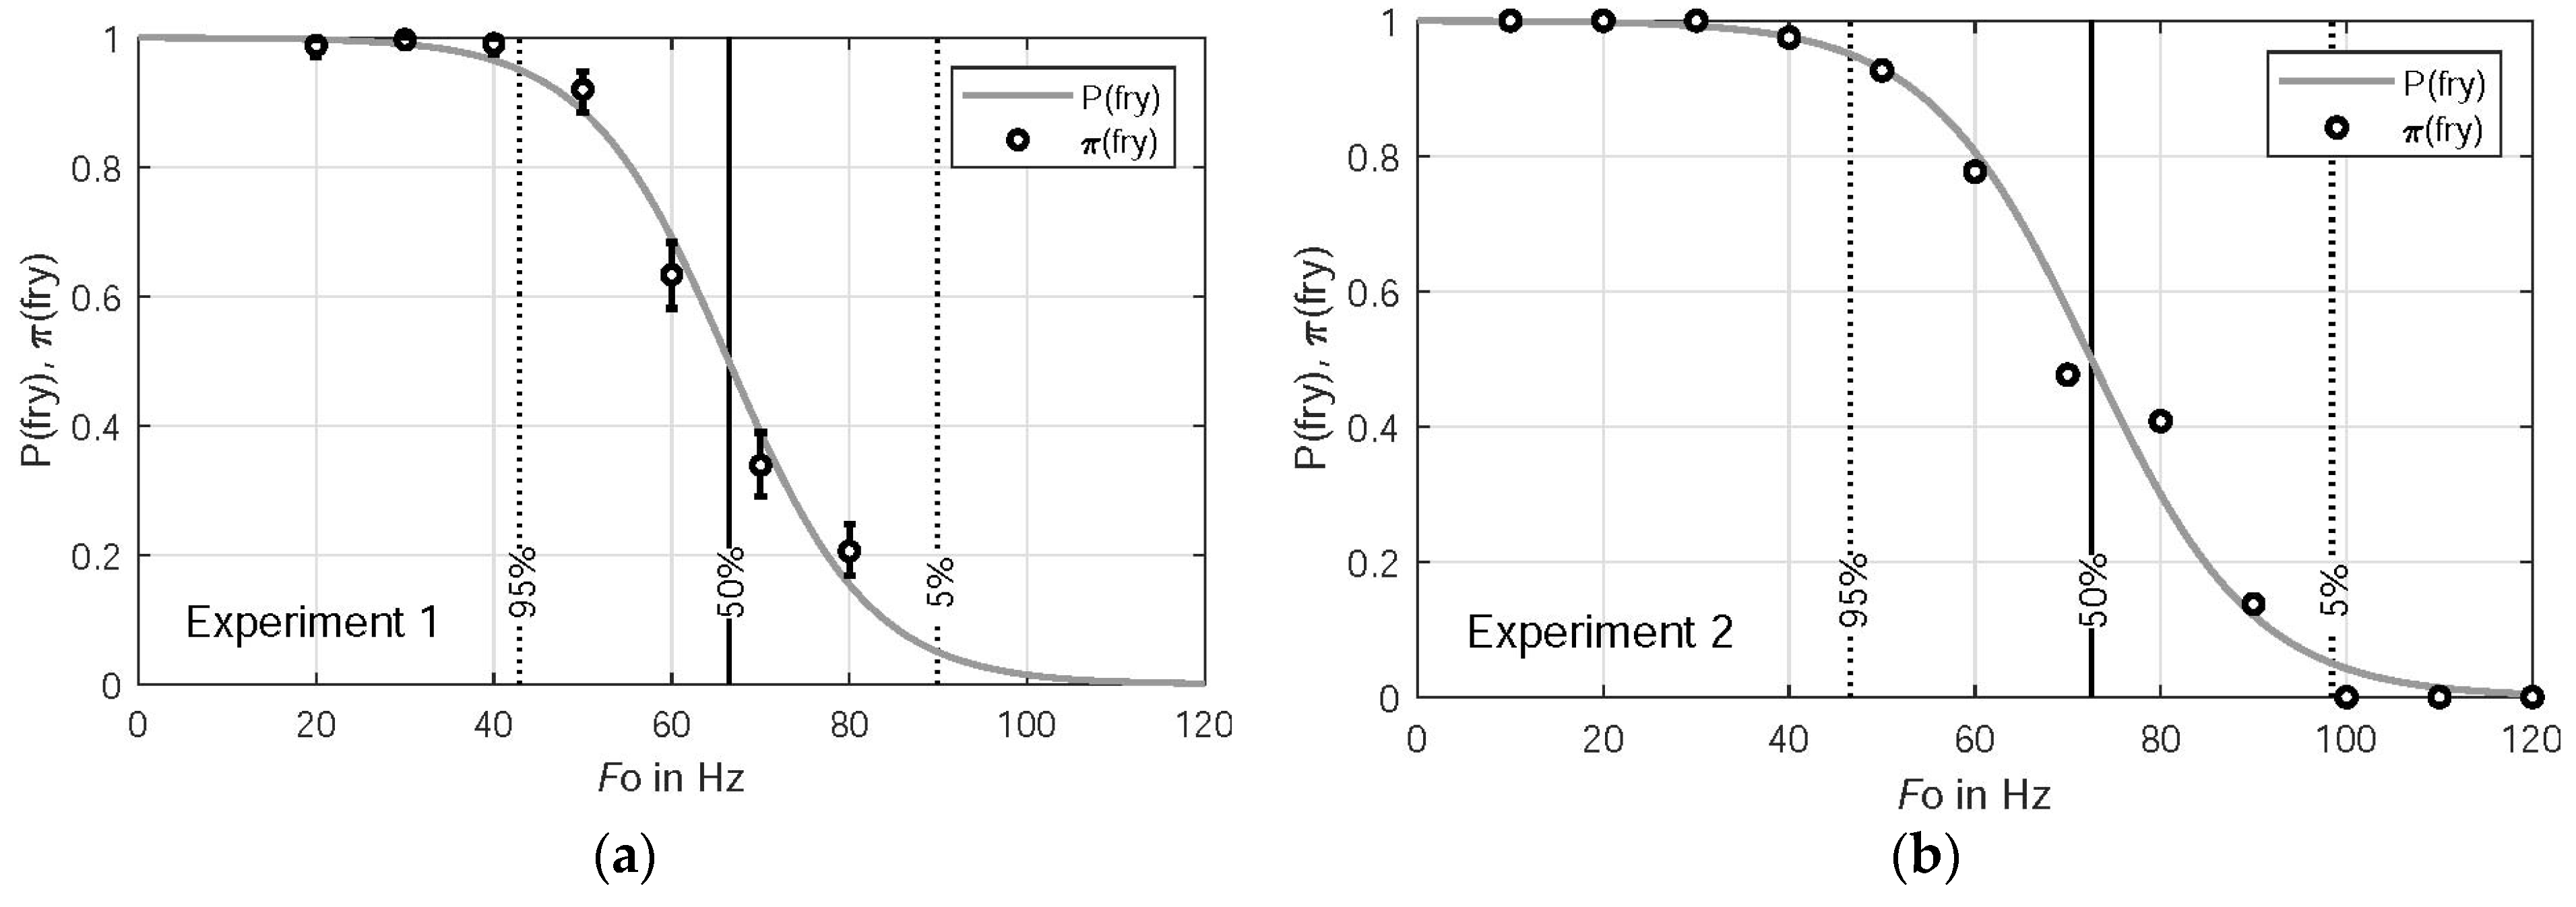
Figure 6 shows for Experiments 1 and 2 proportion
and probability
for a stimulus being labeled as fry as a function of
.
is predicted by binomial logistic regression. Thresholds of
equal to 5%, 50%, and 95% are shown as vertical lines. The predicted 50% threshold of Experiment 2 at 72 Hz is higher than the corresponding threshold of Experiment 1 at 66 Hz. One possible explanation for this difference is that the anchoring varied between Experiments 1 and 2. In particular, a larger maximum
was used in Experiment 2 than in Experiment 1 (120 Hz vs. 80 Hz), for the purpose of more efficiently sampling the fry/non-fry transition. However, differences of 50% probability thresholds obtained by the seven listeners that participated in both experiments are marginally non-significant (
t-test,
p = 0.06, see also
Figure 7).
A listener-dependent analysis reveals that Listeners 4 and 5 of Experiment 1 labeled 99% and 98% of the stimuli as fry, respectively. All other listeners rated an average of only 64% of the stimuli as fry. Thus, Listeners 4 and 5 appear to have disregarded anchoring, and, therefore, they have been excluded from further statistical analysis.
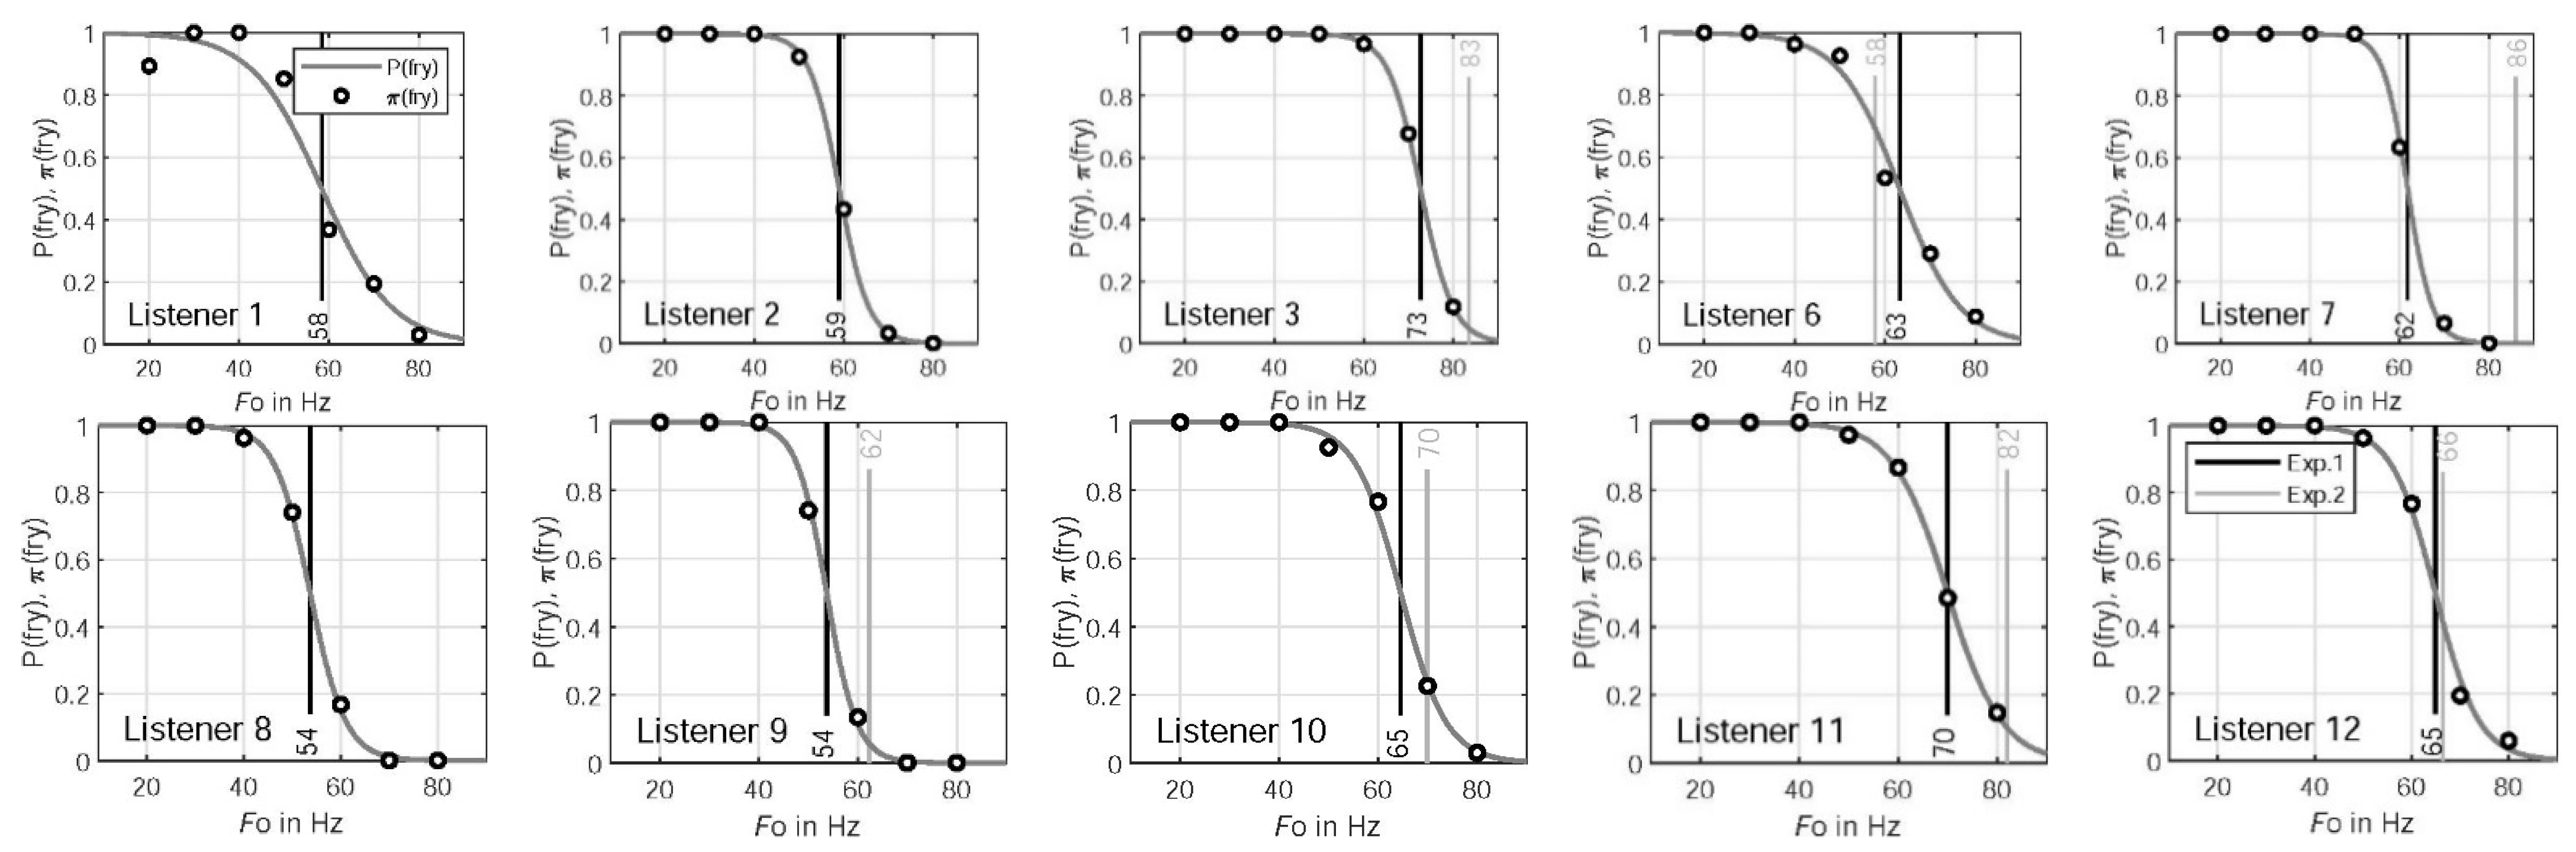
Figure 7 shows
and
as functions of
together with the
= 50% thresholds of Experiment 1 for individual listeners. Additionally, the 50% probability thresholds of Experiment 2 are shown for the seven listeners that participated in both experiments. The individual 50% thresholds do not differ substantially between Experiments 1 and 2, except for Listener 7.
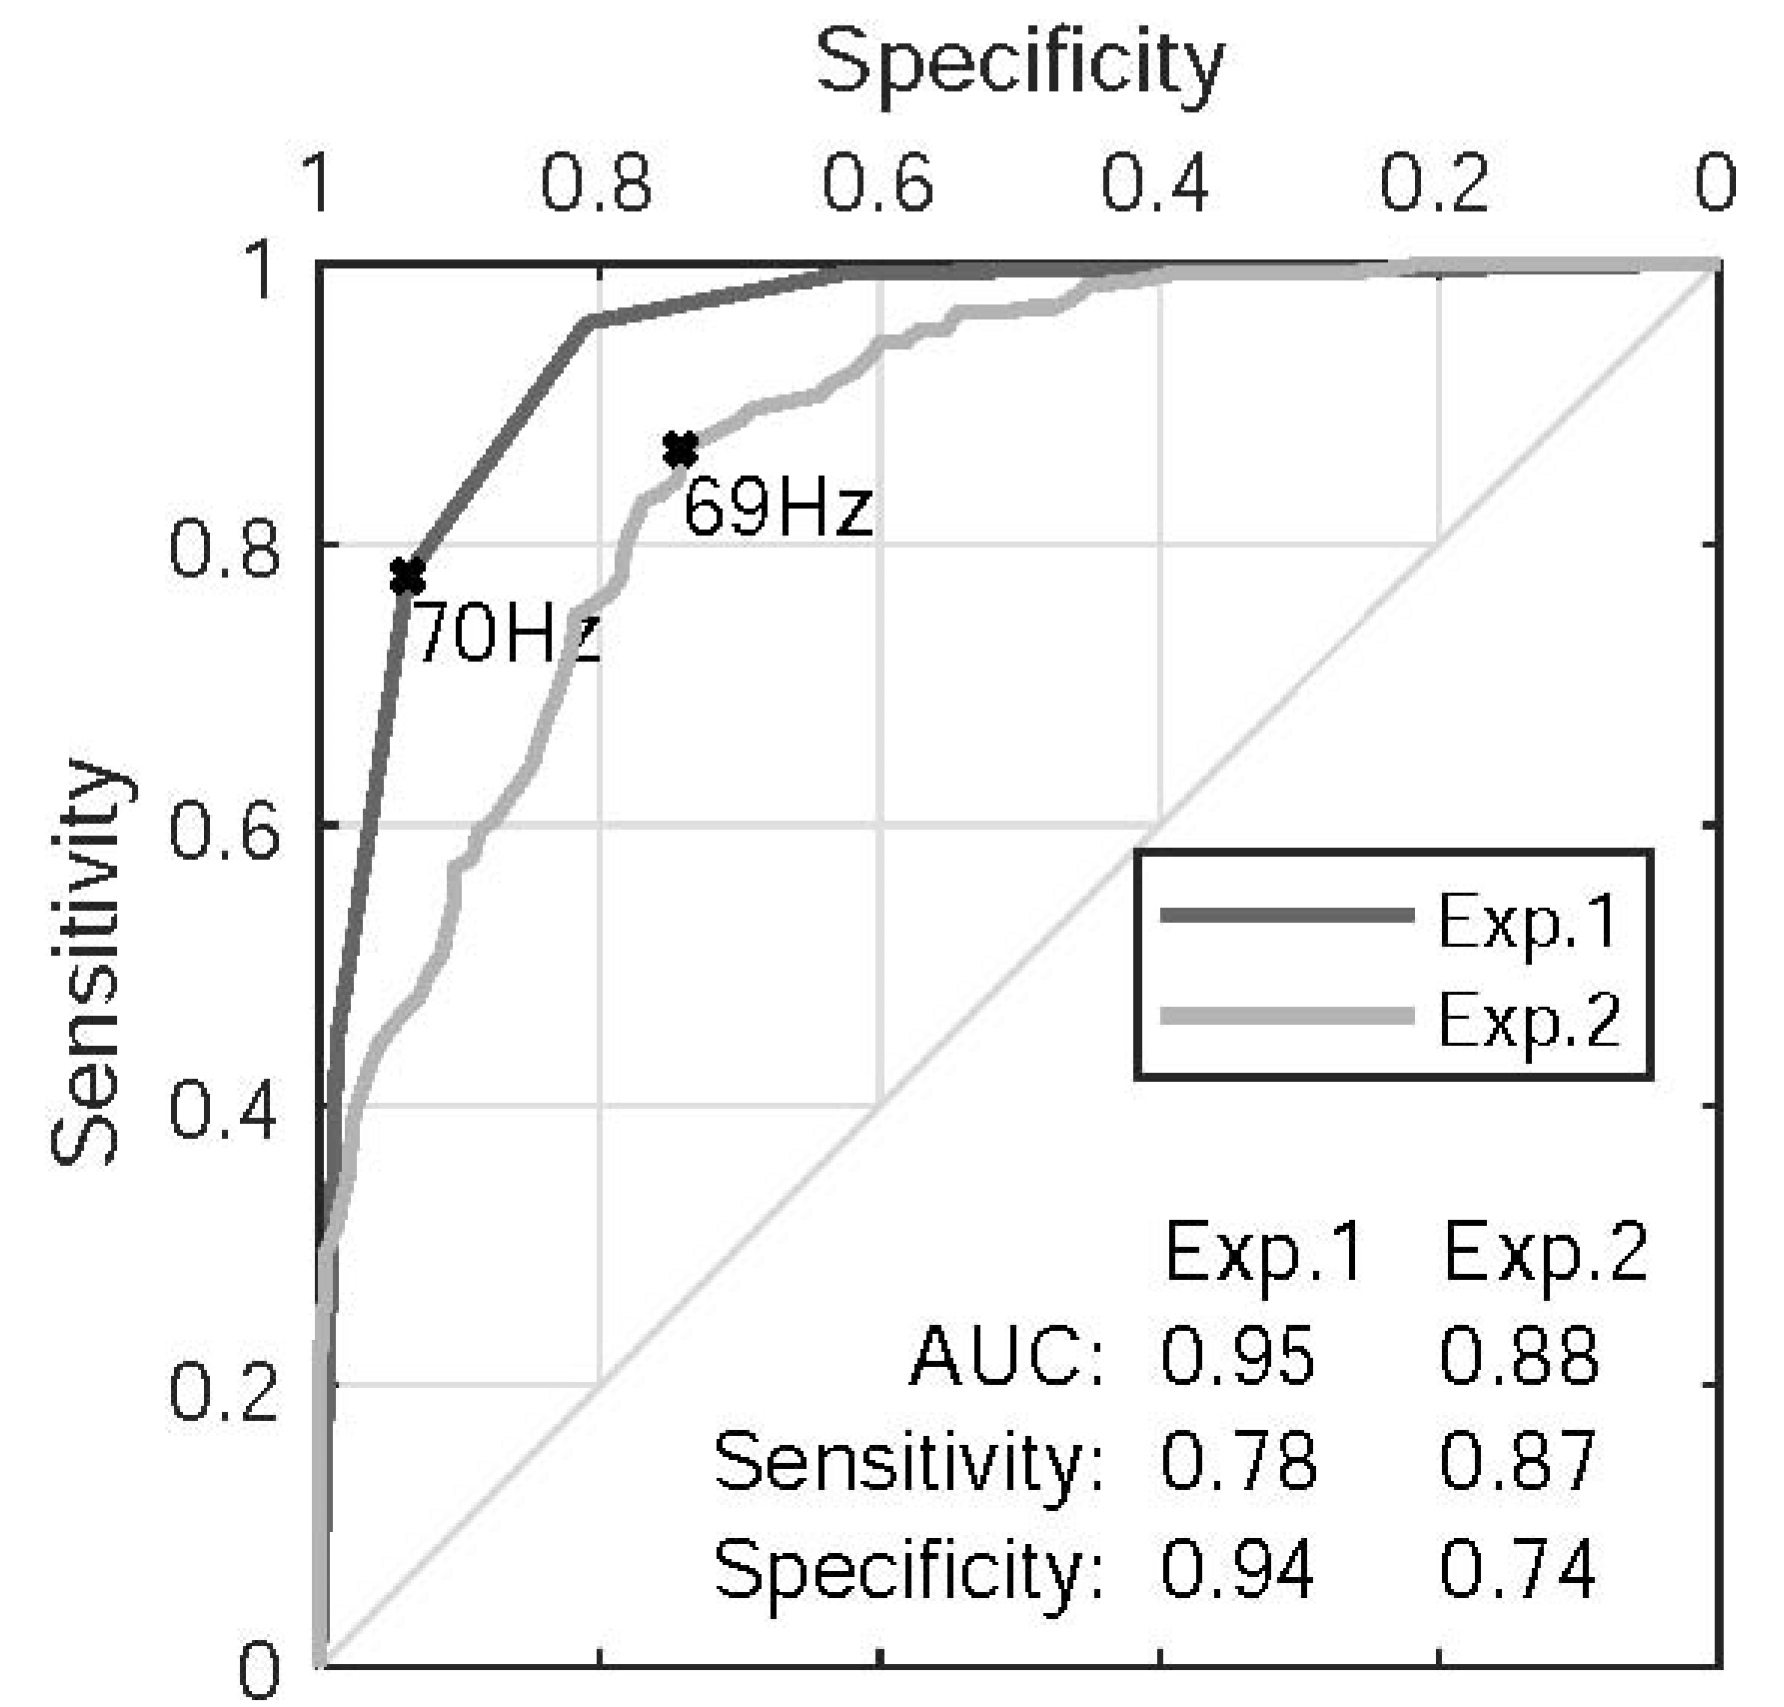
Figure 8 shows the ROC curves using
as the predictor. The model fitted to the data of Experiment 1 performs better than the model fitted to the data of Experiment 2. However, both models report similar cutoff thresholds in the vicinity of 70 Hz that approximately coincide with the 50% thresholds shown in
Figure 6.
3.2. Perceived Binary Fry Predicted from LPP
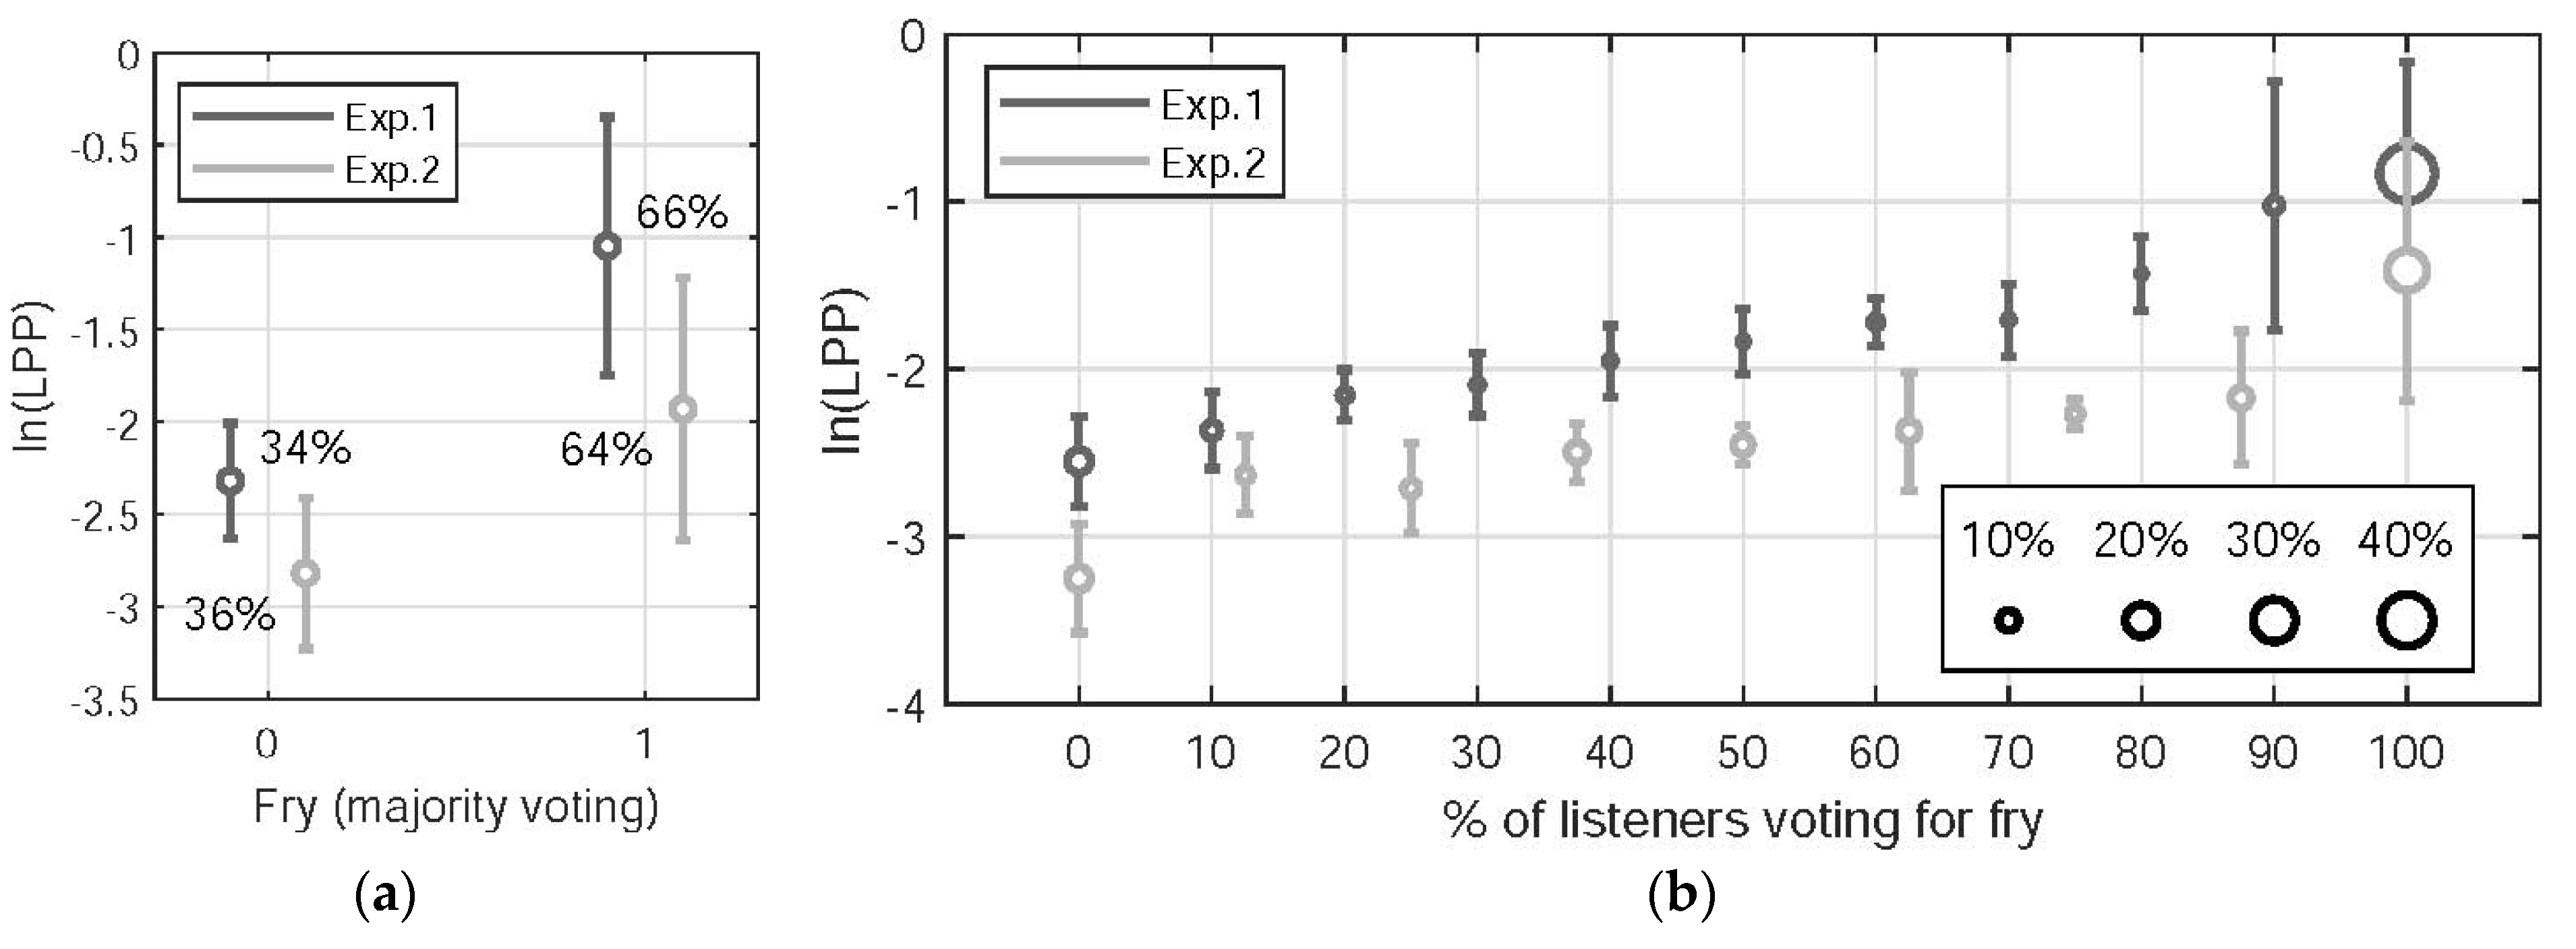
Figure 9 shows the natural logarithm of the LPP with respect to the binary fry label dichotomized via listeners’ majority voting (left panel) and to the percentage of listeners voting for fry (right panel). The left panel shows that LPP values are larger in fry, as expected. The right panel shows for both experiments that LPP values increase with the percentage of listeners voting for fry. The LPP averages (circles) increase strictly monotonically with the percentage of listeners voting for fry, with one exception (Experiment 2, second and third group from the left). The number of samples was approximately balanced across groups, with the exception that the 0% and 100% groups contained substantially more samples. The standard deviations of LPP are relatively small in the majority of the groups.
Figure 9 also shows that LPP values differ between Experiments 1 and 2 for comparable listener ratings. In particular, LPP values are larger in Experiment 1. A possible explanation is that the perception of binary fry is influenced by the anchoring being different in the two experiments. The maximum anchoring frequencies were 80 Hz and 120 Hz in Experiments 1 and 2, respectively. Because the listeners were asked to rate these extreme stimuli using the extremes of the scales, LPP values differ between Experiments 1 and 2 for comparable listener ratings.
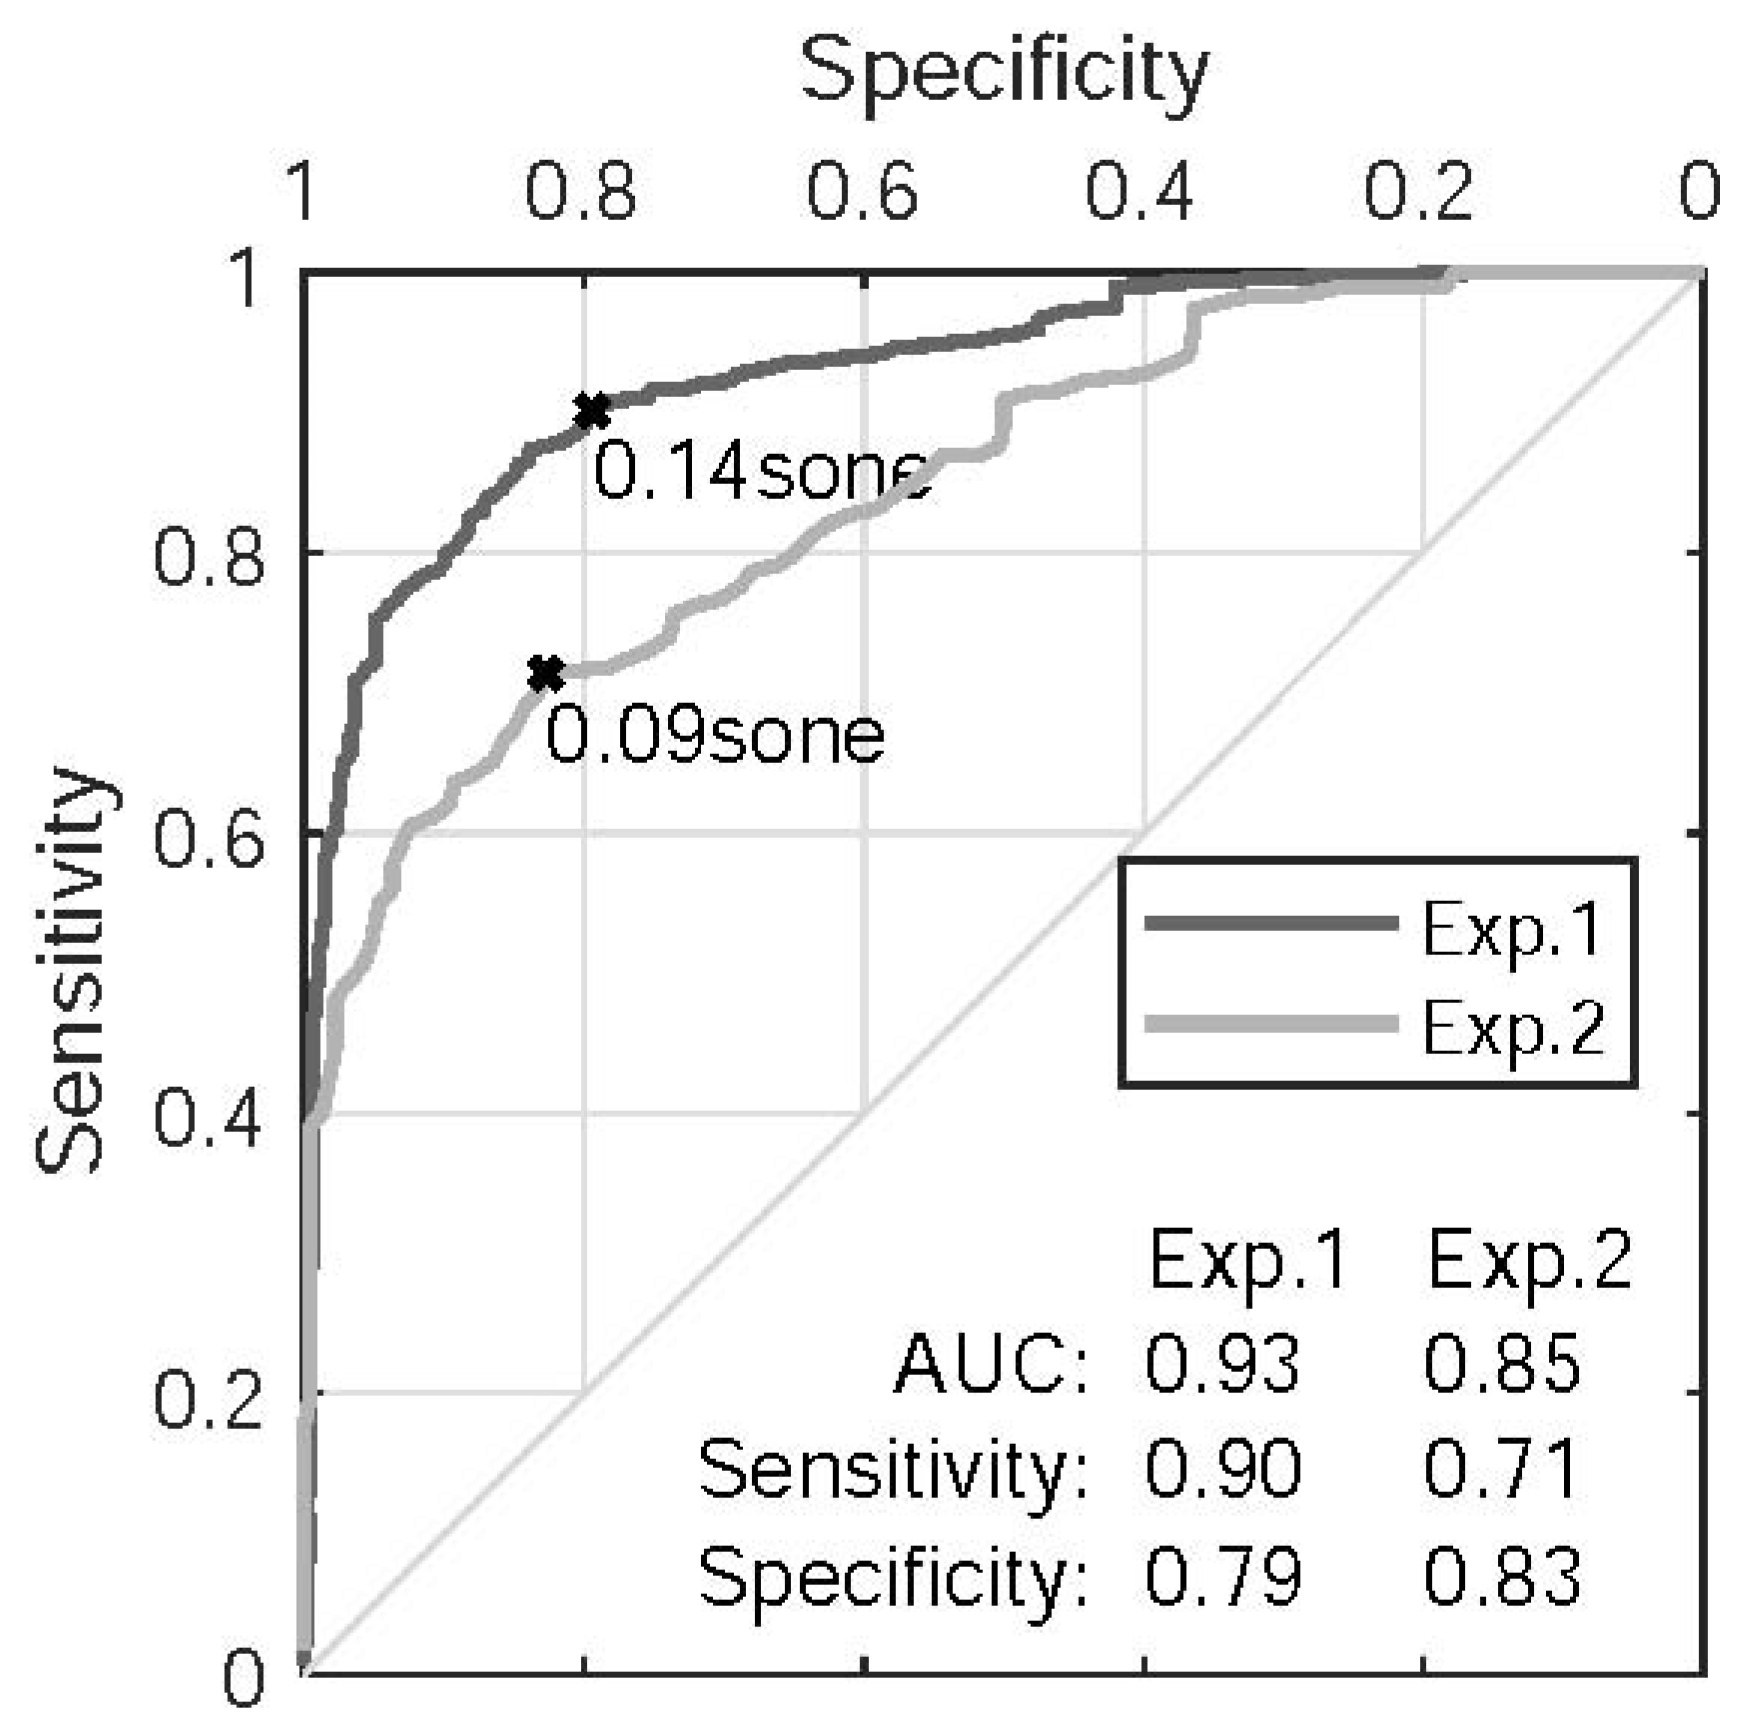
The ROC curves using LPP as the predictor are shown in
Figure 10. The optimal cutoff thresholds at 0.14 sone and 0.09 sone are applied to the majority votes shown in the left panel of
Figure 9 (ln(LPP) = −1.97 and −2.41, respectively) and yield a more sensitive model for Experiment 1 (true positive rate of 0.90) and a more specific model for Experiment 2 (negative rate of 0.83). Note that the reported results regarding LPP are relative only because no formal calibration of the sound pressure level of the headphones was carried out.
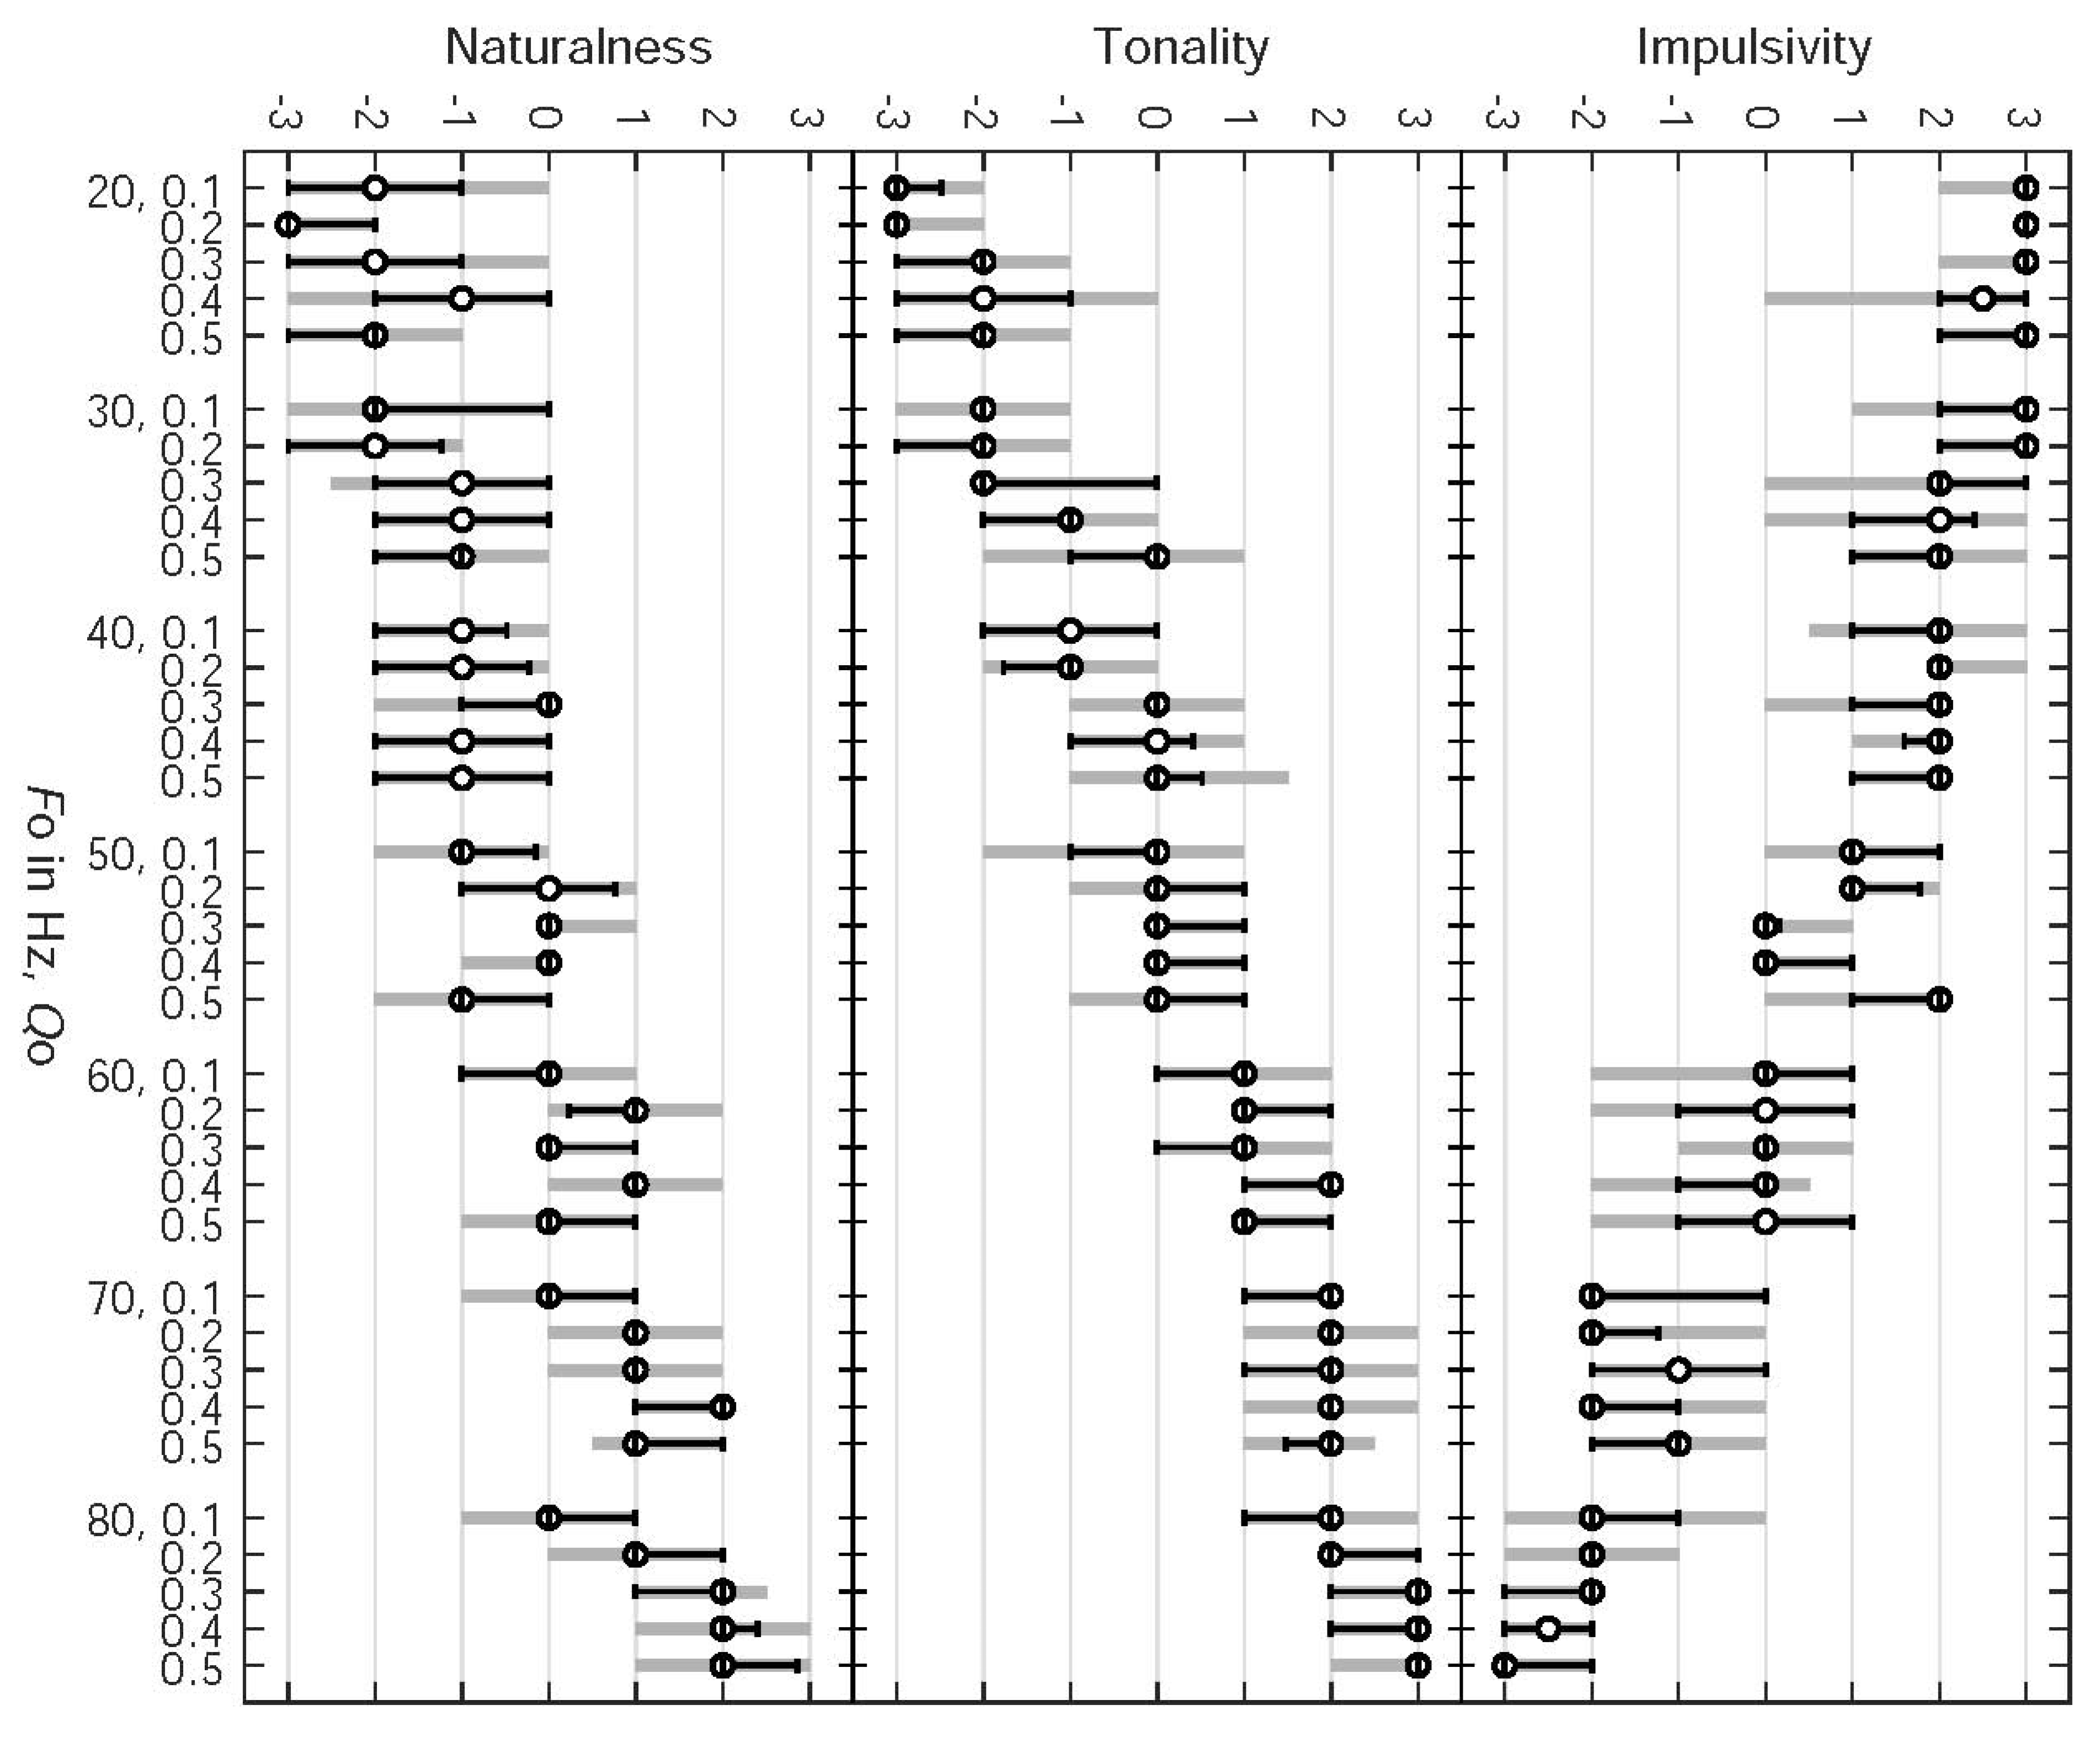
3.3. Impulsiveness, Tonality, and Naturalness Predicted from Glottal Parameters
Table 3 lists all-listener weights of the linear regression models regarding perceived impulsiveness, tonality, and naturalness as functions of
,
, and
(Experiment 1) and
,
,
, and
(Experiment 2). Parameters
,
, and
are shown to significantly affect perceived impulsiveness with equal effect directions as in binary fry (cf.
Table 1). The context parameter
, which was marginally non-significant when vocal fry was rated binarily (
p = 0.06), is significant here when the 7-point Likert scale is used to reflect impulsiveness.
Tonality ratings are shown to be inversely related to perceived impulsiveness. Parameters
,
, and
significantly affect perceived tonality in directions opposite to perceived impulsiveness. A decrease in
significantly decreases perceived tonality. The decrease in pitch strength with a decrease in
accords with previous findings for frequencies larger than 120 Hz [
26]. Here, we show that the inverse relation of
and pitch strength is also observed for
values below 120 Hz.
The tonality decreases with decreasing open quotient
, which agrees with a previous study [
26] in which sinusoids were reported to have a larger pitch strength than complex tones. Indeed, decreasing the open quotient increases the magnitude of the overtones, making the signal less sinusoidal. However, the effect of
is smaller than the effect of
.
Tonality and frequency difference are inversely related. This may be interpreted as the tonality ratings being biased owing to the listeners’ inability to ignore the short-term context.
For Experiment 1, the perceived naturalness of the stimuli significantly increases with frequency
and open quotient
. This may reflect the difficulty of synthesizing vocal fry that sounds convincingly natural. An indication is that none of the medians of the naturalness ratings reaches its maximum of +3 (see
Figure 11).
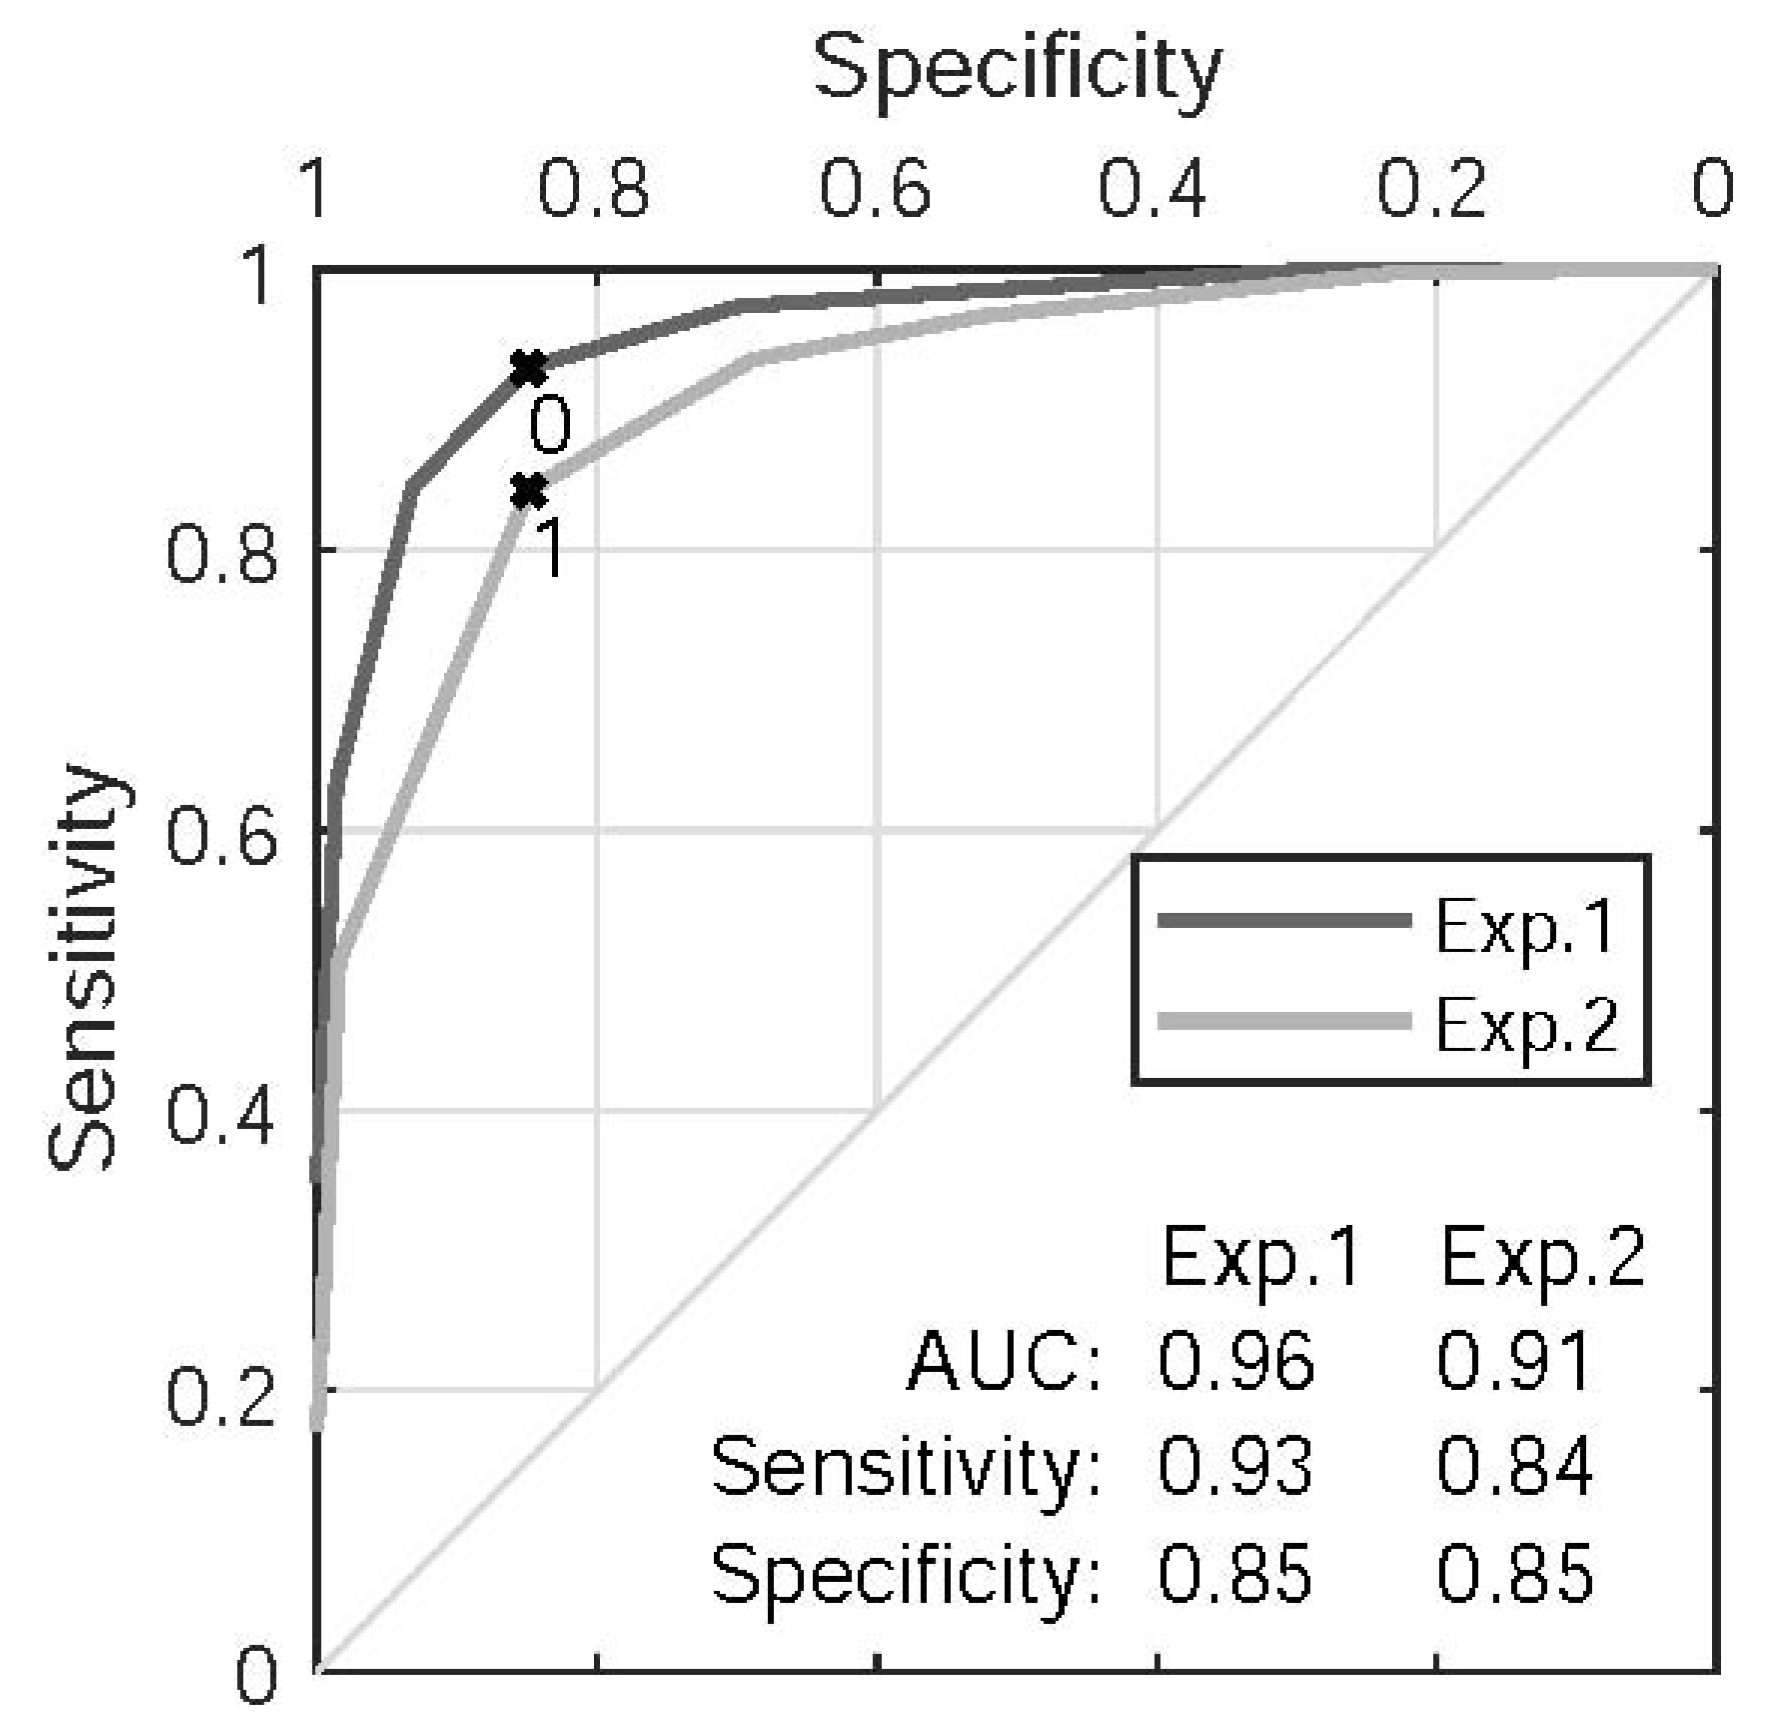
Figure 12 shows the ROC curves for the prediction of binary fry from perceived impulsiveness ratings. The purpose is to show that perceived impulsiveness is a proxy for perceived binary fry. The curves are similar for the two experiments, with large AUC values of 0.96 and 0.91 for Experiments 1 and 2, respectively. Thus, perceived impulsiveness may be interpreted as a proxy for perceived binary fry. The optimal cutoff threshold is 0 for Experiment 1, which is the center of the 7-point Likert scale. The model’s sensitivity (i.e., true positive rate) is smaller for Experiment 2, for which the optimal threshold is 1. Similarly to the ROCs that report the prediction of binary fry from
(
Figure 8), the AUC is larger for Experiment 1 than for Experiment 2. Finally, both AUC values increased when the impulsiveness ratings of individual listeners were replaced by majority votes (AUC = 0.99 and AUC = 0.97 for Experiments 1 and 2, respectively).
4. Discussion
The perception of vocal fry with regular vocal fold oscillations was studied in two listening experiments in the current study.
The first experiment considered glottal frequency
, open quotient
, and glottal area pulse skewness
. The perception of vocal fry in synthesized vowels was shown to be mainly affected by the glottal frequency
. When
is below a listener-individual threshold ranging from 40 to 80 Hz, the phonation is classified as fry. This classification agrees with previously reported observations that associate fry with a low pitch [
12,
37]. The open quotient
also had an effect on fry perception. A smaller open quotient was a significant cue for fry for a minority of listeners, which agrees with past findings [
22]. No measurable effects on perceptual ratings were found for the pulse skewness
. This result agrees with previous findings [
22] that found
to be relevant to the perception of vocal effort rather than vocal fry.
The second experiment studied the influence of the short-term context (i.e., within-vowel context) on the perception of vocal fry. Different values were assigned to glottal parameters
and
before and after the fry mid-vowel segment. We tested whether the amount of variation of
and
affects listeners’ ratings of fry to determine whether listeners are susceptible to perceptual bias due to the short-term context. While the influence of
on binary fry labeling was marginally non-significant (see
Table 1), it had a small but significant effect on the more finely resolved ratings of perceived impulsiveness, tonality, and naturalness (see
Table 3).
In the context of prior work, we first found that perceived impulsiveness may indeed be understood as a proxy for perceived binary fry, suggesting that graduations between modal voice and fry exist. In particular, perceived binary fry was predicted with a small error by perceived impulsiveness. In addition, the agreement that we found between perceived impulsiveness and LPP is another indicator of the existence of graduations of fry. LPP is inspired by the fluctuation strength model presented previously [
26]. In particular, the fluctuation strength refers to the peak prominence of the temporal fluctuation of the masking threshold, whereas LPP refers to the peak prominence of the temporal fluctuation of the loudness. These concepts are similar, but we may argue that fluctuation of loudness is more relevant in our case, because the analyzed signal is not a masker. LPP is also related to the reported threshold of 42–44 dB SPL decay during time intervals between prominent glottal pulses [
21].
Second, we showed that tonality (i.e., pitch strength) increases with
. This was shown previously for signals with frequencies larger than or equal to 120 Hz [
31]. For signals with lower frequencies, a loss of the tonal quality was reported with decreasing
[
38]. The signal was reported to smoothly transit into a pulsating one when
is further decreased, with a transition occurring between 100 Hz and 50 Hz. A value of about 20 Hz was reported to be the lower limit of pitch perception. In addition, reducing the open quotient makes glottal area pulses shorter, which increases the magnitudes of high-frequency harmonics. This causes perceived pitch strength to decrease, possibly via the same mechanism that decreases the pitch strength of complex tones as opposed to pure tones [
26]. However, if the open quotient exceeds 0.7, which is typical for breathy phonation, this effect may be reversed, because breathiness was previously shown to be inversely correlated with pitch strength, most likely due to the increased level of aspiration noise [
39,
40].
Third, regarding naturalness, the predominant effect was a perceived increase in naturalness with vibration frequency, which suggests that the synthesis of vocal fry with frequencies down to 20 Hz remains a challenge. Most of the scientific attention on physical voice synthesis had gone in the past into the physical synthesis of voices with higher frequencies, which results in a lack of understanding synthesis of low-frequency voices. In addition, we had expected that the use of a small open quotient of approximately 0.1 to 0.3 would be necessary at frequencies from 20 Hz to 30 Hz to produce naturally sounding stimuli because the duration of the open phase at such frequencies is short compared with the cycle duration. This expectation was not confirmed, because we did not see such an effect in the naturalness ratings. We also saw that perceived naturalness increased slightly as the individual experiments progressed, which is interpreted as the listeners becoming familiar with the sounds of the stimuli.
Fourth, we observed that the use of a majority vote in place of individual listeners’ ratings yields a better agreement between ratings and LPP. For Experiment 1, the AUC increased to 0.98 using a threshold of 0.14 sone, and the AUC of Experiment 2 increased to 0.90 with a threshold of 0.07 sone when a majority vote was used. This observation may be interpreted in terms of the presence of noise in the responses of individual listeners, which is canceled out in majority voting. Therefore, binary fry labels obtained via majority voting as well as cutoff thresholding of the LPP may be closer to the actual truth than ratings of individual listeners. The same interpretation may be applied to the observation that the prediction of perceived binary fry from perceived impulsiveness improves if a majority vote is used instead of ratings of individual listeners.
Fifth, regarding the internal reference standards of the listeners, we found indications for the existence of fixed components of reference standards, as well as for effects of anchoring and for the influence of short-term context on listener ratings. Regarding fixed standards, we found that two listeners were not susceptible to anchoring. They were both medical doctors, which suggests a professional group effect. However, for a third medical doctor the 50% probability threshold of 74 Hz agrees with the all-listener mean threshold (see
Figure 6). Regarding anchoring, most of the listeners appeared to be susceptible. In particular, we found differences between the ratings obtained in Experiments 1 and 2, which we interpret as a result of differences in anchoring. Regarding effects of the short-term context, we found significant effects of
on 7-point Likert ratings of tonality, impulsiveness, and naturalness. The effect of
was marginally non-significant on perceived binary fry.
Finally, the heterogeneous backgrounds of the listeners has the drawback of generating small group sizes for individual professions. An advantage of diverse backgrounds, however, is that the inclusion of listeners with different professional backgrounds reflects the range of possible listener behaviors in the data. In addition, the language that we used for the labels in the GUI was English, which was the second language for all listeners. (The first languages were German, Luxembourgish, and Telugu). Listeners were familiarized with the English semantic descriptors in the GUI prior to the experiment in a short conversation with author PA.
The limitations of the study and suggestions for future research include the following. First, the low-frequency signals were labeled as less natural. The synthesizer is able to produce stimuli that are indistinguishable from human stimuli [
41], but no arbitrary setting of the synthesizer parameters is guaranteed to produce natural speech sounds. This highlights the difficulty of synthesizing vocal fry signals that sound convincingly human. For the future, we consider the possibility of synthesizing fry signals with neural network-based approaches (e.g., WaveNet, or WaveGlow [
42,
43]) and conducting Turing tests to assess the naturalness of their outputs. In addition, the use of recordings of human subjects is definitely relevant, but was beyond the scope of this study, mainly because the study design required that the parameters are controllable.
Second, playback of low frequencies may deserve additional validation. In particular, the low end of the frequency range of the used headphones is reported by the manufacturer to be 16 Hz, but considerable roll-off of the sinusoidal frequency response is observed for frequencies well above 16 Hz. This was incorporated in the calculation of the loudness peak prominences using a dummy head measurement setup as described in [
31], but what is pending is a quantitative validation that proves that the signal arriving at the ear drum in the listening test is representative for a face-to-face communicative setting.
Finally, the number of listeners belonging to the same professional group was small. We observed that the two listeners who appeared to not be susceptible to anchoring were two of the three medical doctors; however, formal comparisons are not possible given the small group size. Third, only synthetic stimuli mimicking regular fry in a male speaker uttering vowel [a] were used, meaning that the influence of irregularity and gender- as well as vowel-related variation of the formants may be underrepresented in the reported results. Thus, more diverse stimuli and additional listeners may be used in follow-up studies. Also, the observed relationship between LPP and perceived fry may not be generalizable to dysphonic non-fry voices.
5. Conclusions
What may be concluded is the following. First, the most influential acoustic feature of perceived binary fry and impulsiveness is the vocal frequency. The open quotient also plays a minor role. More precisely, smaller frequencies and smaller open quotients increase the probability of perceived binary fry and impulsiveness. No effect of the pulse skewness was measurable in the experiments. Second, perceivable graduations of fry exist. In particular, the results show that impulsiveness reported on a 7-point Likert scale is a proxy of perceived binary fry, and that the proposed psychoacoustic feature LPP agrees with perceived fry in a fine-grained way. Third, regarding listener-internal reference standards, fixed components appear to exist, in addition to components that may be varied by anchoring and a short-term (i.e., within-vowel) context. In particular, two listeners were not susceptible to anchoring, but adhered to their fixed internal reference standards. In addition, we found differences in threshold frequencies between Experiments 1 and 2, which we interpret as an effect of the anchoring varying between the two experiments. Finally, frequency differences in modal to fry to modal transits seem to bias fry ratings such that increasing differences increase the probability of fry ratings. The effect of vocal frequency contrast on perceived binary fry was marginally non-significant, but the effect was significant on impulsiveness. Fourth, the perceived naturalness of stimuli has been weaker in fry than in non-fry stimuli, reflecting the difficulty of synthesizing fry stimuli that sound human-produced.
Clinical long-term perspectives include the following. First, improving the understanding of the relations between voice production and perception lays the groundwork for improving clinical treatment to improve perceptual voice quality. Second, acquisition of knowledge on the properties of auditory reference standards of listeners is important for improving the current state of voice quality assessment. Finally, another clinical long-term perspective of this work may be the distinction between pathological and non-pathological fry.


