1. Introduction
In recent years, China has continued to increase the construction of smart cities, so the corresponding intelligent demand for monitoring systems is getting higher and higher, and vehicle re-identification has gained more attention. An essential application of vehicle re-identification is reconstructing the vehicle’s running trajectory. Vehicle re-identification technology can realize the correlation of the same vehicle under different monitoring equipment in continuous time. Vehicle trajectories constructed by vehicle re-identification technology combined with driver information can realize travel prediction and travel guidance of passengers, thereby helping intelligent cities. In addition, in public security criminal investigation systems, vehicle re-identification technology can be used in practical application scenarios such as vehicle tracking, lost vehicle detection, and vehicle license-plate verification. Since there are only minor cosmetic differences between identical models, these differences are mainly concentrated in local areas, such as window trims. Furthermore, depending on the camera’s position, the captured vehicle pictures have profound illumination and viewpoint changes, different resolutions, occlusion, and multi-scale problems, leading to different angles of the same vehicle or the same vehicle model. The similarity between different vehicles makes the researchers of vehicle re-identification tasks face significant challenges. Similar to other target detection and recognition problems [
1,
2], how to extract discriminative features is a direct factor that directly determines the re-identification results to accurately realize vehicle re-identification.
Before the deep learning method was widely used, it mainly relied on manual feature extraction, such as the color feature of the target, the texture feature, or the feature of the critical sensitive area. However, the features extracted by hand can only be used in a single hypothetical scene, which can no longer satisfy today’s technology development. In today’s vehicle re-identification models in complex scenarios, the current vehicle feature extraction methods mainly rely on deep learning methods by designing a specific network structure and using corresponding training tasks to guide the network to learn features for recognition.
Beneficial for the construction of large-scale vehicle datasets, such as the VeRi-776 [
1] dataset, VehicleID [
2] dataset, Toy Car Re-ID [
3] dataset, and VRIC [
4] dataset, research on the re-identification of the vehicle recognition model has also been proposed. Yan et al. [
5] modeled the vehicle image information to form a multi-granularity relationship and thus proposed a model based on a multi-task framework, a multi-granularity-based list sorting, and pairwise sorting method. The constraints of granularity sorting solve the problem of a precise vehicle search. Liu et al. [
6] used the Siamese network to calculate the similarity of license plates based on the dual constraints of spatiotemporal features and appearance features, which improved the accuracy of vehicle re-identification. Tang et al. [
7] used CNN (convolutional neural networks, CNN) to learn vehicle identity, color and type information. They obtained the vehicle’s perspective based on the method of vehicle pose estimation to obtain more robust vehicle feature information, thereby improving the algorithm’s performance. Meng et al. [
8] proposed the idea of dismantling the car body and matching it in blocks. With the help of a body analysis network, the author decomposes the body features into four regions: the front, the side, the rear, and the roof and obtains the feature vectors of the four respective regions. When matching, the same area of the two vehicles is matched and the common visual score of the area is obtained, and then the common visual score of the four areas is fused as the local feature distance of the two vehicles. Combining the local feature distance with the global feature distance with a certain weight is the feature distance of the two vehicles. This method has achieved good results, but it depends on the performance of the vehicle analysis network.
Since the re-identification task is to retrieve images across cameras, it is necessary to take into account the impact of viewpoint conversion. Zhou et al. [
9] proposed a vami model which can use the single-view feature of the query image to generate multi-view features of the same identity vehicle. Specifically, the author combines the adversarial training mechanism and the vehicle parsing classifier to propose a viewpoint-aware attention model for obtaining the attention map from the input image, and considering that the attention map is a single-view feature, the author reported a multi-view generative network based on this attention map that is designed to infer global features for different viewpoints. Zhu et al. [
10] proposed a quadruple direction pooling method. Specifically, in the first stage of the framework proposed by the author, the basic deep learning architecture is used to extract features, and then in the second stage, the feature map is pooled in four directions (horizontal, vertical, diagonal, anti-corner). The feature maps of the corresponding directions are obtained, and these direction feature maps are spatially normalized and connected together as the quadruple direction learning features for vehicle re-identification. Teng et al. [
11] proposed a multi-branch network for processing vehicle images from different viewpoints. With the help of a classifier, the input image is divided into three categories: front, side, and rear views, and the weighted weight on the corresponding branch is increased. When the image passes through the three branches in parallel, the features are weighted and fused.
Recognizable features include car window textures, placement of items in the car, etc., but these feature areas are small. Accurate mining of these features is a way to improve vehicle recognition. Zhao et al. [
12] proposed to use detection network to preprocess the regions where discriminative features may exist in the vehicle. In this paper, the author divides 21 detection areas and proposes a vehicle re-identification data set with 21 area labels for training the detection network. This is the first dataset labeled with so many fine-grained attributes through which the network is able to learn vehicle discriminative features useful for vehicle identification. In addition, the author used the single-stage detection method (SSD) as the baseline model for detection on the constructed data set and achieved good results after making modifications based on this.
The above methods are represented by vehicle re-identification, indicating that the features extracted by deep learning can adequately process the vehicle appearance information and angle information for the re-identification work to obtain good results. Even so, the above methods still have many problems. For example, under different conditions, the resolution of the vehicle pictures captured by the acquisition device is not enough when the weather is affected and the lighting conditions change. Obstacles are severely occluded, which seriously affects detection and recognition accuracy. Different vehicle angles captured by different acquisition devices cause the appearance of the same vehicle to be deformed. Different brands of the same types of vehicles having similar colors and different vehicles with similar models make it easy to match the vehicles incorrectly.
A new vehicle re-identification algorithm to solve the above problems is put forward in this paper. The key point of this method is that it integrates the attention mechanism. The salient features of the vehicle are extracted by using shallow layer and deep layer joint attention unit, named SDLAU, which is a joint attention unit composed of a global spatial attention module and a channel attention module. It can be applied to different convolutional layers without changing the original structure of standard CNN. At the same time, a joint local module is incorporated into the channel attention mechanism to obtain local vehicle features. This design allows the transfer learning method to be immediately applied to the proposed model. SDLAU seamlessly improves the performance of standard CNN architectures such as ResNet when solving the vehicle re-identification task.
2. Our Model Architecture
2.1. Re-ID Network Based on Attention Module
SDLAU can be applied to different layers of standard CNN architecture to extract salient information from different scales. Each SDLAU takes the feature map generated by the convolutional layer and the attention state generated by the previous SDLAU as input. Afterwards, the unit generates a new state for the next SDLAU. The mechanism is not only to extract authentication information from different layers but also to combine them. This process allows the model to recognize an object by evaluating discriminative features at different resolutions. The differences between different car models are quite subtle, and feature maps of different scales can provide different levels of information. Therefore, it is useful to collect features and combine sufficient discriminative features from multi-scale regions. Our Re-ID network based on attention module is shown in
Figure 1.
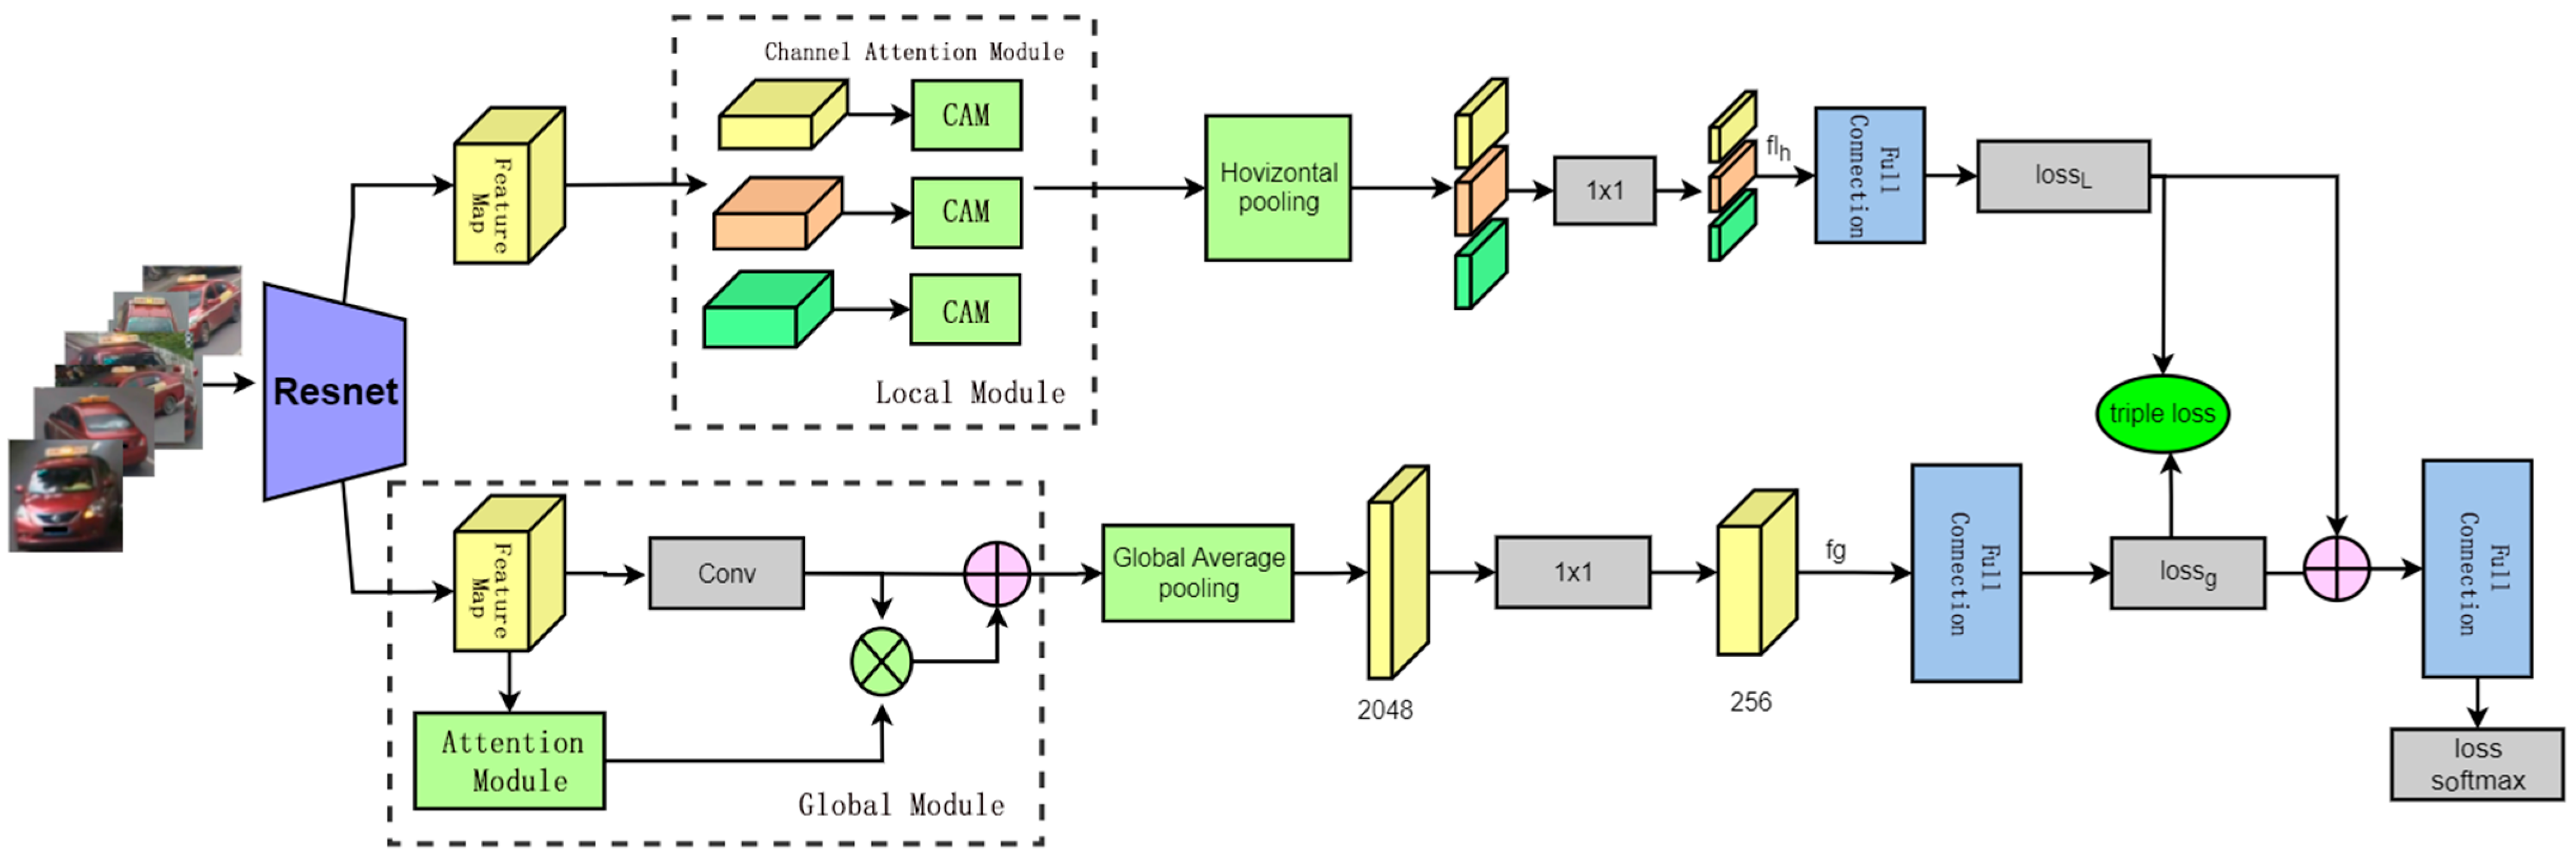
In order to extract more significant and discriminative vehicle features, more targeted vehicle global features are obtained by fusing the spatial attention mechanism and the channel attention mechanism. The network model in this paper is composed of a backbone network, an attention network, and a fully connected layer, which is shown in
Figure 1. The network architecture of re-identification is the global branch vehicle feature extraction model fused with attention mechanism. The backbone network adopts ResNet-50 to extract the basic network of image features. After preprocessing, the vehicle image is sent to the ResNet-50 network to extract the second-layer shallow features and the third-layer deep features of the vehicle. Then, the attention mechanism network is adopted respectively. It is fused with the second and third-layer vehicle features. Finally, the global features extracted by ResNet-50 are subjected to a weighted fusion operation, and the obtained global features of the vehicle are the features of the fusion attention mechanism. By combining the features extracted by the two-layer attention mechanism network, the more salient features of the vehicle are obtained by fusion. After that, the extracted features are input to the fully connected layer for ID classification and vehicle identification.
2.2. Vehicle Global Feature Extraction
Figure 2 shows the global branch vehicle feature extraction model fused with attention mechanism.
The global features mainly include color, texture, and shape features. Among them, the extraction of global features is handled by a separate branch, which is used to calculate the distance between target vehicles. The feature map obtained by the last layer of ResNet-50 is 7 × 7 × 2048, and a global pooling layer is used to convert the feature map obtained by the Conv5 layer in the model map into 1 × 1 × 2048 feature values. Then, 1 × 1 convolution is used to compress the feature channel of the globally pooled feature value to 512 dimensions, and the three-dimensional tensor is converted into a one-dimensional vector. In order to reduce the information redundancy and improve the nonlinearity of the network, a fully connected layer is introduced. The layer performs the classification calculation on the loss function.
The backbone network adopts the basic network of ResNet-50 to extract image features, and the vehicle pictures are sent to the ResNet-50 network after preprocessing to extract the second-layer shallow features and the third-layer deep features of the vehicle; after that, the attention mechanism network is fused with the vehicle features of the second layer and the third layer, and finally, weighted fusion with the global features is extracted by the normal ResNet-50 to obtain the vehicle global features of the fusion attention mechanism. By combining the features extracted by the two-layer attention mechanism network, the salient features of the vehicle are obtained by fusion, and then the extracted features are input to the FC layer for vehicle ID classification and recognition.
Figure 3 is an example of taking the feature extraction from a single image of a vehicle image. The image structure of the input model is (1, 3, 224, 224), the image size is 224 × 224, and there are three channels: red, green, and blue.
The input is a 224 × 224 image through this layer, and the extraction is 64 × 112 × 112 = 80,2816-dimensional features. This layer is generally called Conv1. Because this layer is too low-level and has dimensions that are too large, this layer is a rarely used feature. After the first layer and batch normalization, we use an activation function and a pooling layer with a step size of 2 to output a tensor in size of (1, 56, 56, 64), as shown in
Figure 4.
Then, the features are passed through four sub-networks (the principle is the same as above), which are called Conv2, Conv3, Conv4, and Convs5. The output size is also reduced layer by layer to 2048 × 7 × 7 = 100,352. The length and width are 1/32 of the original parameters, which is shown in
Figure 5.
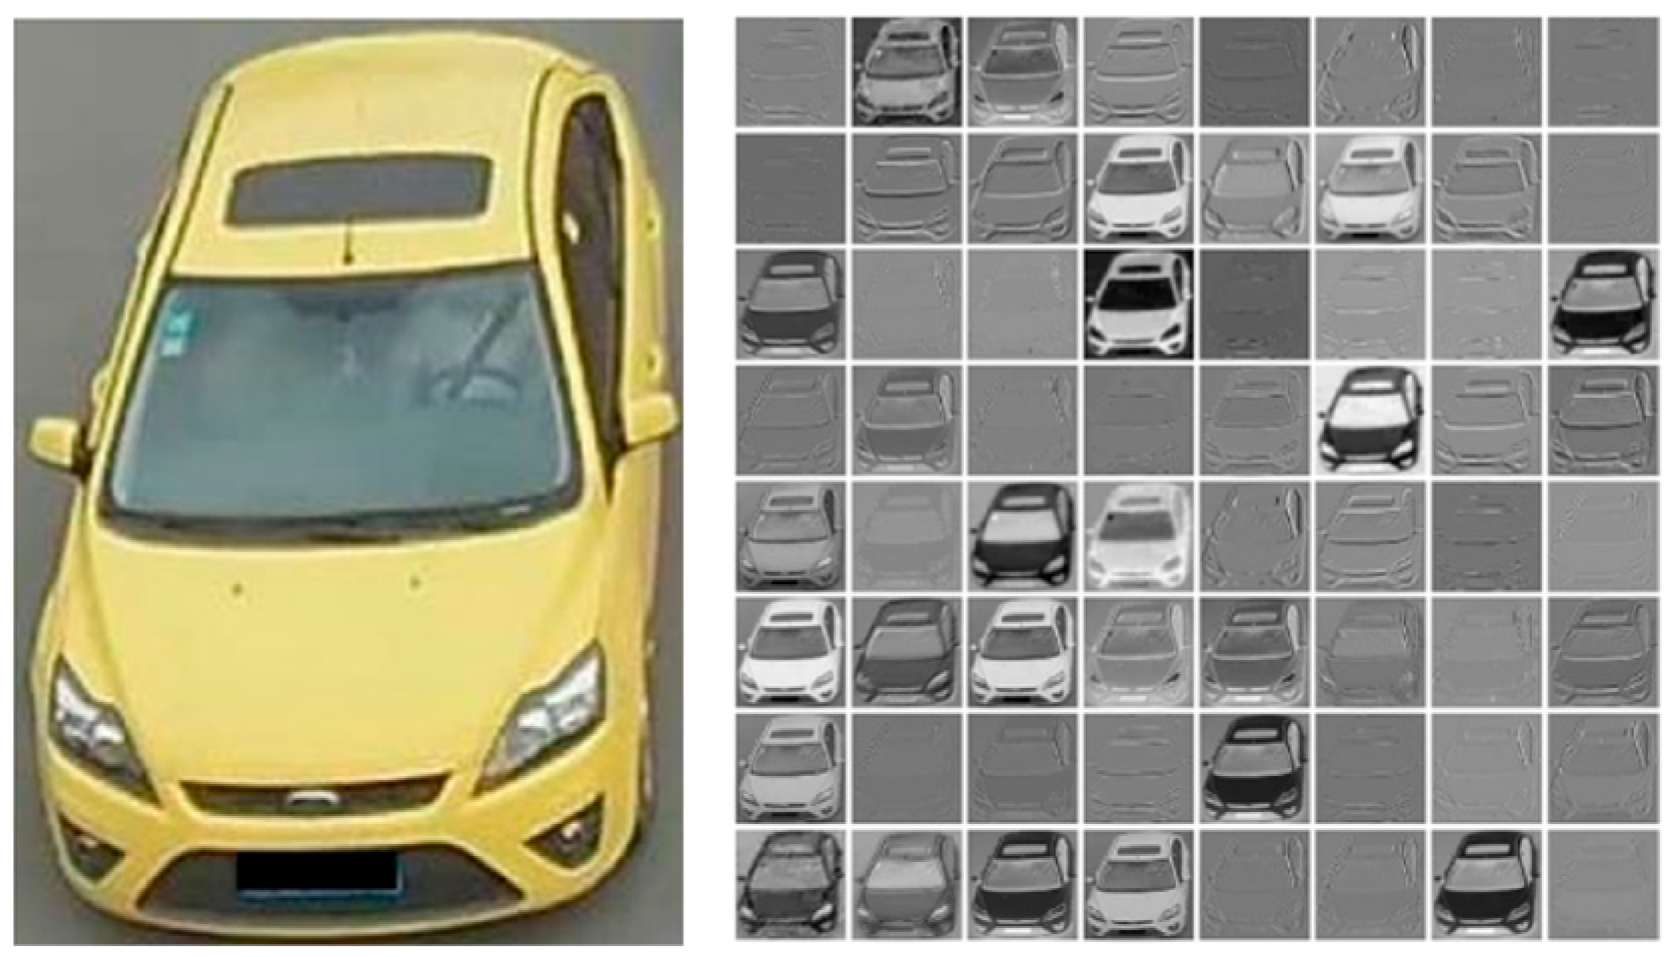
The first dimension is the number of images, the second is the number of channels, and the last two dimensions are the width and height of the picture, respectively. If data are taken from any channel, the image of that channel can be drawn directly. After the data flow to the last sub-network Conv5, the output is 2048 pictures of 7 × 7 size. To extract features that are not 2048-dimensional, a fully connected layer is added with an input of 2048 and an output of the target dimension.
2.3. Vehicle Global Feature Fusion with Attention Module
The attention goal of vehicle re-identification is to focus on vehicle-related features while removing irrelevant background. Inspired by successful ideas in the field of segmentation, this paper integrates two complementary attention mechanisms, that is, the channel attention module (CAM) and position attention module (PAM).
Depending on how the attention works, it can be divided into the spatial domain [
13], channel domain [
14], and hybrid domain [
15]. Spatial attention refers to the attention to different spatial locations of features. Channel attention refers to the attention of features learned by different channels. The attention mechanism of the mixed domain combines the regions that different attention mechanisms pay attention to and learns the weight matrix corresponding to different channels and different spatial locations. For features of size H × W × C, weight matrices of the same size are learned, i.e., corresponding weights are learned for each pixel of all channels.
Channel attention is different from spatial attention, so it can be combined to obtain more discriminative vehicle feature maps. First, the Max pooling and Average pooling operations aggregate the input feature channel information, and two feature maps with spatial information are output, which are
and
. Spatial-attention Ms is computed as Equation (1).
In the formula, sigmoid represents the activation function, and f7×7 represents the convolution operation 7 × 7.
The vehicle image is input into the global feature extraction network model fused with the spatial attention module, and the feature maps layer-2 (
= 256 × 96 × 96) and layer-3 (
= 512 × 48 × 48) generated by the ResNet-50 network are sent to the channel attention module and the spatial attention module, respectively. Then, the channel attention model is applied to
and
to obtain channel attention matrices
and
. The values in matrices
and
are weights; that is, the importance of the position of each region obtained after the image is input. In general, the higher the focus, the greater the position weight. The expression formula is shown in Formulas (2) and (3).
The size of the convolution kernel is 1 × 1, and conv represents the convolution operation, which can effectively reduce the dimension. After softmax normalization, each local area obtains a corresponding weight, indicating the importance of each area’s attention in the current scene. Then feature maps of
and
are multiplied with the corresponding elements of the attention map
M to obtain the feature maps
and
for
and
, as shown in Formulas (4) and (5).
Due to the vehicle’s complex background information, there may be some errors in the attention matrix and some interference noise, and some critical information in the original image may be lost. Therefore, it is necessary to add the input vehicle image and the previous feature image, as shown in Formulas (6) and (7).
and represent the new feature maps obtained by combining the two feature maps after processing. The new spatial attention matrix is obtained by mapping the features of the attention module of the fused channels to the spatial attention module used as input, thus obtaining a vehicle feature map that combines the attention of the channels with the global attention to obtain more distinguishable vehicle features.
2.4. Local Feature and Channel Attention Module Fusion
The vehicle feature map in the local feature branch is evenly divided into three parts horizontally. Then, these three parts are input into the channel attention mechanism module to obtain the local features of each part. It is well known that high-level convolutional channels have semantic dependencies and class selectivity in trained CNN classifiers. In the Vehicle Re-ID case, it is assumed that the high-level channels are also “grouped”, i.e., some channels share similar semantic context, such as the foreground is a vehicle, occlusion, or background, and the correlation between them becomes stronger. CAM [
16] is designed to group and aggregate these semantically similar channels.
Given an input feature map
A ∈
RC×H×W, where
C is the total number of channels, H×W is the feature map size, and the channel attention matrix
X is calculated as
X ∈
RC×C.
Here,
represents the influence of channel
i on channel
j. The final output feature map
E is calculated by Equation (9).
is a hyper-parameter that tunes the influence of CAM.
In the channel attention mechanism, each part undergoes the same operation. The obtained result is multiplied by the elements of the original feature image, and finally the two results are added to obtain a three-part channel-attention-weighted feature image.
2.5. Retinex Image Enhancement
Image enhancement technology is to restore the attributes of the image itself better. Preprocessing the image input to the model through image enhancement technology can improve the model’s performance. In this paper, the vehicle image of the input model is first preprocessed by the Retinex [
17] algorithm to preprocess the poor image.
Retinex theory introduces the useful property of derivatives; larger derivatives are usually due to changes in reflectivity, while smaller derivatives may come from smooth lighting. Taking advantage of this property, Retinex decomposition can be performed by classifying image gradients into reflection components R and illumination components L. Retinex achieves better performance than previous competing methods in decomposition, low-light image enhancement, and color correction. The Retinex model is a color perception simulation of the human visual system. The basic assumption of Retinex theory is that the original image
S is the product of the illumination image L and the reflectance image
R, which can be expressed in the following form. Its physical goal is to decompose the observed image
to its illuminance and reflectance components, which is shown in Formula (10).
The Retinex decomposition includes illumination L and reflectance estimation R. Accurate lighting estimates should not distort the structure while keeping the space smooth. At the same time, accurate reflectivity should reveal the details of the observed scene. The Retinex algorithm can accurately estimate the specific location of the noise in the data and remove the noise to restore the image better.
3. Experiments and Discussion
3.1. Experimental Dataset
This paper uses VeRi-776 and VehicleID datasets, two currently public large-scale datasets as research objects.
VeRi-776 contains 776 vehicle images, captured mainly by 20 cameras, with a total of more than 50,000 images, and the actual coverage area is 1.0 square kilometers. Vehicle-specific information, such as car model, camera location, and license plate, is provided, and its label information is rich. The training set contains 37,778 images of 576 vehicles, and the test set contains 9919 images belonging to 200 vehicles. For the vehicle re-identification task, 1678 probe vehicle images in the test set were randomly selected to search for other images in the test set.
VehicleID contains 222,628 images of 26,328 vehicles collected from atraffic monitoring system. The dataset has a training set and a test set. The training set contains 113,346 images belonging to 13,164 vehicles, and the test set contains 109,282 images captured from 13,164 vehicles.
3.2. Loss Function
The model in this paper combines classification learning [
14] and metric learning using the softmax loss function [
18] for classification learning and the triplet loss function for metric learning.
The classification learning loss function used in the experiments is the cross-entropy loss function, which has the advantage of learning more discriminative features for more vehicles. The formula is as follows:
where
represents the vehicle category output by the vehicle re-identification network,
N represents the number of vehicle categories,
represents the predicted probability, and
represents the true probability.
Metric learning uses the triplet loss function, which can better increase the ID of different vehicles during the model’s training process and reduce the ID distance of the same vehicle. The formula is as in Equation (12).
where
and
represent the positive and negative feature distances.
α is the margin that controls the difference between positive and negative paired distances. The final objective loss function is as follows.
where
and
are the weights corresponding to the cross-entropy loss function and the triple loss function, respectively.
3.3. Experimental Setup and Evaluation Index
The designed method is implemented using the deep learning framework Pytorch1.1.0-cuda10-py36. The hardware configuration used in the experiment is as follows. Inspur artificial intelligence development platform server GPU is 2080Ti (12 GB video memory), ResNet-50 is used as the backbone network, and the input image size is adjusted to 384 × 384. The parsing model was trained on the dataset for 80 epochs. The model optimizer chooses Adam, the data batch is 18, and the initial learning rate is 0.0001. It drops by 10% after the 20th epoch and then drops by 10% every 15 epochs. Data enhancement methods such as horizontal flipping and random erasure are still used.
The evaluation metrics use mean precision (mAP) and cumulative matching curves (CMC) to measure ReID performance. For each probe image b, the average precision is calculated as follows.
where
k defines the ranking in the list of retrieved vehicles,
n represents the number of retrieved vehicles, and
represents the number of ground truth retrievals by the detector.
represents the precision at the cutoff point
k, and
represents whether the
k-th recall image is correctly matched.
The mean precision is calculated as follows.
Here, represents the number of probe images.
Cumulative matching features use cumulative matching curves (CMC.) The CMC curve describes the expected value of positive samples in the first
k levels, and the CMC values for the first
k levels are calculated as follows.
where
is the
i-th rover,
is an indicator function, and
is equal to 1 when the positive sample is within the first
k ranks and equal to 0 otherwise.
3.4. Experimental Results and Analysis
3.4.1. Experimental Results and Analysis of VeRi-776 Dataset
In this section, a series of comparative experiments are conducted on the VeRi-776 dataset to verify the effectiveness of the algorithmic models proposed in this paper. Four models are tested for experimental comparison as:
- (1)
The base model without using the attention mechanism (ResNet-baseline);
- (2)
The ResNet-layer3 model using the attention mechanism fused in the deep layer-3 layer;
- (3)
The ResNet-layer2 model using the attention mechanism fused in the shallow layer-2 layer;
- (4)
ResNet-SDLAU model proposed in this paper.
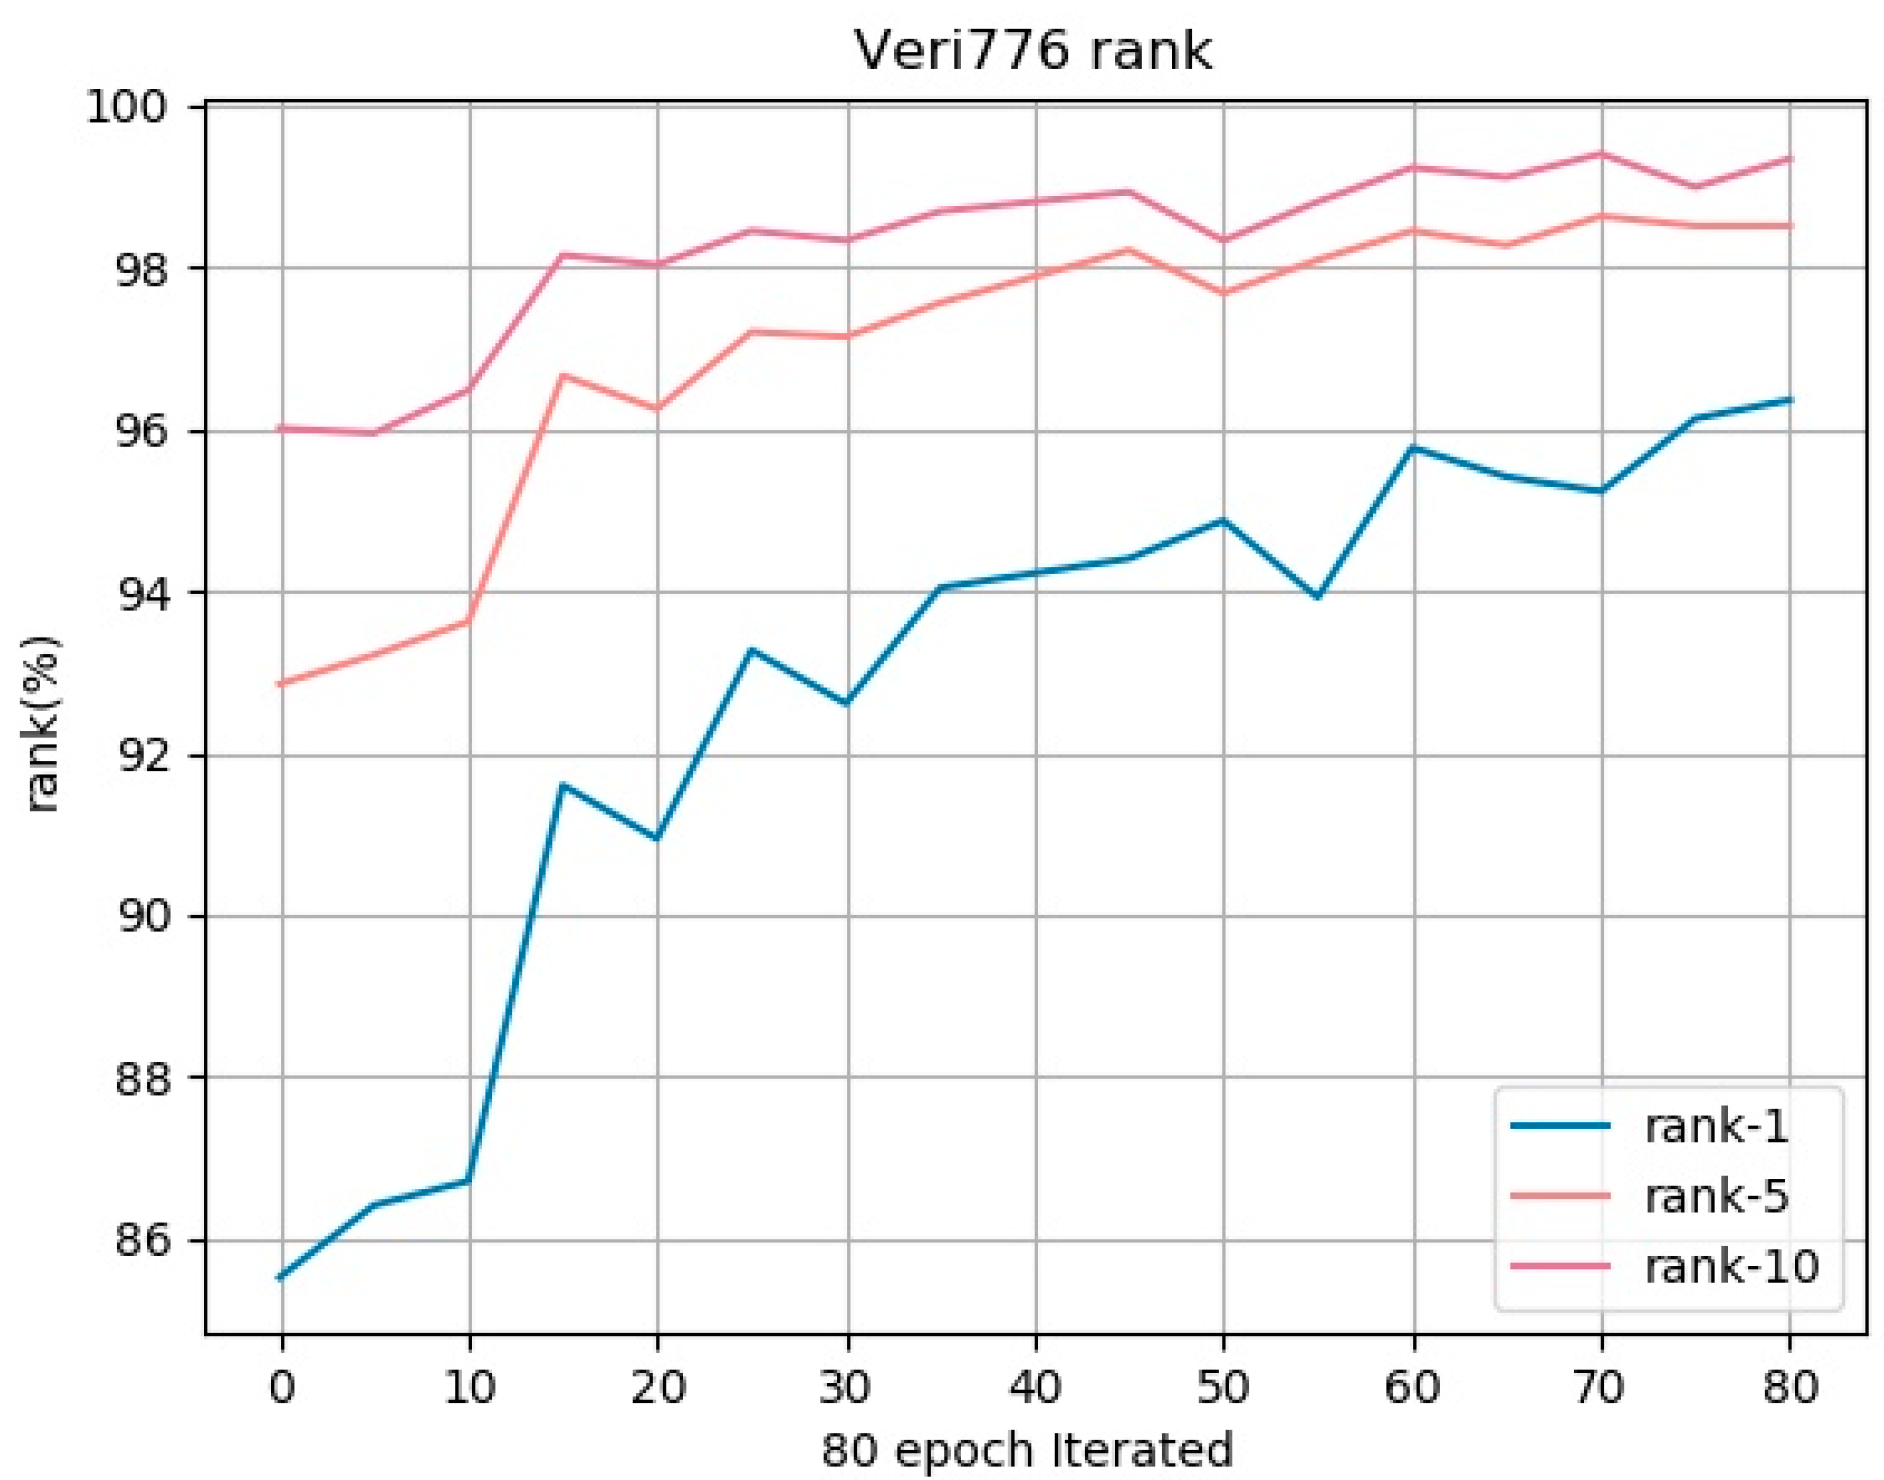
By analyzing the experimental results of the cumulative matching curve CMC, the average accurate precision mAP and the loss function loss curve of the training process of the VeRi-776 data set training process and the CMC curves Rank-1, Rank-5, and Rank-10 of the proposed method are shown in
Figure 6. It can be observed that with the deepening of network training iterations, the rank indicator has been increasing, which proves the effectiveness of the model.
The loss curve is shown in
Figure 7. After the model is established and the parameters are determined, the ResNet-SDLAU model can be trained. The figure below shows the monitoring of the model training process. It can be seen that the loss decreases during the training process. In the first 10 stages of training, the model loss value drops rapidly; from 10 to 60 epoch, the model gradually stabilizes. The effectiveness of the joint training of cross-entropy loss function and triplet loss function is proved.
The mAP curve of the model training process is shown in
Figure 8. The ResNet-SDLAU model in this paper is used to predict the target classification of each image in the test set, and the accuracy rate is used to measure the model performance. After every five epochs of training, the accuracy of the prediction results of every five epochs is recorded. Statistics show that the network trained in this chapter can predict the recognition of the same vehicle with high precision, so the comprehensive performance of this model is good.
The ablation experimental result is shown in
Table 1.
In
Table 1, Ret is the abbreviation of image enhancement technology (Retinex), Tri is the abbreviation of the triple loss function (Triple), and AuL means that the vehicle features of the layer, Layer, extracted directly in the ResNet-baseline, are added to the attention mechanism unit (attention unit); AuL3 and AuL2 indicate that the vehicle features of the third layer, Layer-3, and the second layer, Layer-2, extracted directly from the ResNet-baseline, are added to the attention unit ratio.
From
Table 1, it can be observed that the preprocessing technique and triple loss function can effectively improve the model’s performance. For example, these two training strategies can improve the mAP and Rank-1 of the ResNet baseline by 4.22% and 3.11%, respectively. When adding attention to the Layer-3 layer of ResNet, the mAP of our model improves from 69.60% (ResNet) to 71.32% (ResNet-AuL3). It can also be observed that combining the feature maps (Layer3) and (Layer2) of different layers extracted by ResNet can also improve the performance of the model. By further extracting feature maps, the model mAP is improved from 74.50% to 78.30% (SDLAU), which is a good improvement. After comparing with the model benchmark, the complex background information of the vehicle is preprocessed by image enhancement technology. Then, the cross-entropy and triplet loss functions are used to jointly train on the basic model Shallow layer-2 and deep (Deep layer-3). The final vehicle re-identification model (ResNet-SDLAU) obtained by integrating the attention mechanism has mAP, Rank-1, Rank-5, and Rank-10, which are improved by 8.7% and 11.24%, respectively, compared with the baseline model 7.32% and 5.71%. The results show that the vehicle re-identification model (ResNet-SDLAU) proposed in this paper can significantly improve the model’s performance. The text continues here (
Figure 2 and
Table 2).
We also compared the accuracy of the constructed vehicle re-identification model with the models that have had better performance in recent years, and the results are shown in
Table 2. According to the comparison results, the model proposed in this paper achieves higher mAP than most other models. Among them, the mAP obtained by Siamese+Path [
19], VAMI [
9], RAM [
20], OIFE [
21], AAVER [
22], VANet [
23], PAMTRI [
7], and PRN [
24] are 58.3%, 50.1%, 61.5%, 61.2%, 66.3%, 71.9%, and 74.3%, respectively, which are lower than the vehicle re-identification model (ResNet-SDLAU) proposed in this paper by 78.30%. Among them, Siamese+Path uses a single-angle feature map to generate vehicles with multiple angles, but it is significantly different from the actual features and the model’s average performance. RAM is a model with multiple branches that can extract more discriminative features of vehicles. However, the model data is prone to overfitting during model training. AAVER is a two-way adaptive attention model. One path is used to obtain the global characteristics of the vehicle, and the other is to obtain local characteristics by focusing on the key points with the largest amount of information. However, this method does not consider the vehicle’s attributes and other related information.
Table 2.
Experimental comparison results of VeRi-776 dataset.
Table 2.
Experimental comparison results of VeRi-776 dataset.
| Method | mAP | Rank-1 | Rank-5 |
|---|
| LOMO [25] | 9.7% | 23.8% | 39.1% |
| GoogLeNet [26] | 17.8% | 52.1% | 66.7% |
| FACT+Plate+STR [6] | 27.8% | 61.4% | 78.8% |
| Siamese+Path [19] | 58.3% | 83.5% | 90.0% |
| NuFACT [27] | 53.4% | 81.5% | 91.4% |
| SDC [28] | 53.5% | 83.5% | 92.6% |
| OIFE [21] | 48.0% | 65.9% | 87.7% |
| VAMI [9] | 50.1% | 77.0% | 90.8% |
| RAM [20] | 61.5% | 88.6% | 94.0% |
| AAVER [22] | 61.2% | 89.0% | 94.7% |
| VANet [23] | 66.3% | 89.8% | 95.9% |
| PAMTRI [7] | 71.9% | 92.8% | 97.8% |
| PRN [24] | 74.3% | 94.3% | 98.9% |
| StRDAN [29] | 76.1% | 94.7% | 98.3% |
| Our(SDLAU) | 78.3% | 96.3% | 98.5% |
The results show that the models (RAM, AAVER, VANet) using both global and local features achieve better results than those using only global features. PRN uses the detection network to locate the part area, and the mAP of this model is 74.3%. Our model implicitly localizes discriminative regions without using any partial annotations, achieving a mAP of 78.30%, which is the best, demonstrating the effectiveness of the performance of the fused attention model.
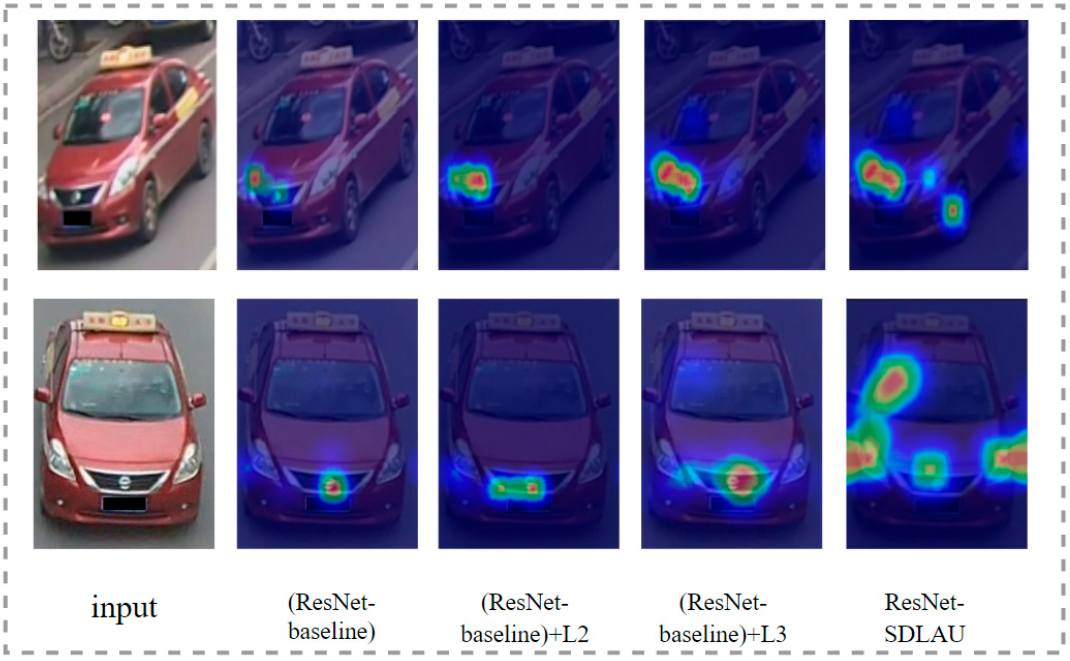
A set of attention visualizations were performed on the final output feature maps of Baseline (ResNet-baseline), Baseline (ResNet-baseline)+L2, Baseline (ResNet-baseline)+L3, and ResNet-SDLAU, as shown in
Figure 9. It can be noted that the feature maps of the baseline pay little attention. (ResNet-baseline) just pays less attention to some vehicle regions. As shown in columns 2 and 3, using (ResNet-baseline) +L2 and +L3, different attention mechanisms focus on some salient features instead of some useless areas. The attention of ResNet-SDLAU proposed in this paper can achieve a better balance because it focuses on the salient local parts of the vehicle, such as distinguishable local features such as logos, lights, windows, wheels, etc. This means that the proposed model is better suited to the nuanced features of the vehicle, and the feature embedding becomes more decorrelated and diverse depending on the mode of attention mechanism used.
Vehicle data matching analysis is as follows: 7 vehicle samples are randomly selected from VeRi-776, queried, and then sorted by similarity. The results are shown in
Figure 10.
The matching results of the vehicles on the VeRi-776 dataset can be observed in the figure. The first image represents the vehicle’s image to be queried, and the rest of the images are retrieved from the gallery and sorted by similarity score. Correct matches are marked with a green border. The first image in each original image is the query result, and the remaining 10 images are the top 10 retrieval results. It can be seen from the figure that the model proposed in this paper has a better recognition accuracy of the similarity between vehicle classes, the model can better pay attention to the local details of the vehicle and can accurately identify the vehicle image when it is occluded. The error rate is also relatively low.
3.4.2. Experimental Results and Analysis of VehicleID Dataset
For VehicleID dataset, three different scales will be used for testing, namely 800, 1600, and 2400, according to the protocol of the dataset. The VehicleID dataset is tested using mean precision (mAP) and cumulative matching feature (CMC) to measure the model’s performance obtained from the experiments, where higher values of mAP and CMC indicate re-identification of the same vehicle the higher accuracy. The results of the ablation experiments on the VehicleID dataset are shown in
Table 3.
From the table, it can be seen through step-by-step ablation experiments that the mAP and rank values obtained after applying the data augmentation technique (Ret) and ternary loss function (Tri), combined with shallow layer-2 features (Shallow layer-2) and deep layer-3 features (Deep layer-3) to the basic ResNet-Baseline depth network, are significantly higher. Ret is the abbreviation of data augmentation technique, Tri denotes the triadic loss function, and AuL3 and AuL2 denote the vehicle features extracted directly in ResNet-Baseline from Layer-3 and Layer-2 are added to the Attention unit. For the VehicleID dataset, the Small (800) dataset is used as an example to analyze the experiment. Through the base network ResNet-Baseline by image preprocessing data enhancement technique, the joint training of cross-entropy loss function and triadic loss function has a certain improvement in the accuracy of vehicle re-identification. mAP for the base network ResNet-baseline is improved from 71.99% to 74.01%, and Rank-1, Rank-5, and Rank-10 are improved by 3.36%, 1.98%, and 0.75%, respectively, compared with the baseline model, and the experimental results of adding the attention mechanism ResNet-Baseline are also better improved. The final vehicle re-recognition obtained by fusing the attention mechanism on the shallow layer (Shallow layer-2) and deep layer (Deep layer-3) of the base model (ResNet-SDLAU) improves mAP, Rank-1, Rank-5, and Rank-10 by 10.88%, 7.36%, 2.44%, and 1.75%, respectively, compared with the baseline model. The results show that the vehicle re-identification model (ResNet-SDLAU) proposed in this paper can significantly improve the performance of the model.
Table 4 shows the comparison results of three test datasets of different sizes. It can be observed that the data augmentation technique and triple loss function, combined with shallow features (Shallow layer-2), deep features (Deep layer-3), and attention mechanism network, are applied to the basic ResNet-Baseline deep network. The model accuracy has significantly improved in the vehicle re-identification model ResNet-SDLAU. This is because some key vehicle regions are further learned by adding the attention mechanism method. The comparison results with the current Re-ID methods on the VehicleID dataset are shown in the table.
Table 4 shows the performance comparison between ResNet-SDLAU and the most current methods on the vehicle re-identification dataset. The comparative analysis of the experimental results shows that the model proposed in this paper consistently achieves very high recognition rates of Rank-1 and Rank-5 on the three test sets. The results show that ResNet-SDLAU outperforms most methods in recent years on the VehicleID dataset, demonstrating the model’s effectiveness.
The vehicle data matching analysis is shown in
Figure 11, which is an example of ten vehicle re-identification results (Rank-1 to Rank10) on the VehicleID dataset. For each probe, green boxes indicate correct matches, and red boxes indicate false matches.
The matching results on VehicleID dataset can be observed from the figure, where the first image represents the vehicle image to be queried, and the rest of the images are retrieved from the gallery and sorted by similarity score. The correct matches are marked with green borders. The first image in each original image is the query result, and the remaining 10 images are the first 10 retrieved results. It can be seen that the model proposed in this chapter has a higher accuracy on the VehicleID dataset, it can identify vehicle nuances and correctly match vehicle images with high inter-class similarity, and the correctly matched rankings are relatively high.


