

Effect of Asymmetric Feathering Angle on the Aerodynamic Performance of a Flyable Bionic Flapping-Wing Rotor
Abstract
:1. Introduction
2. Structure Design and Numerical Method
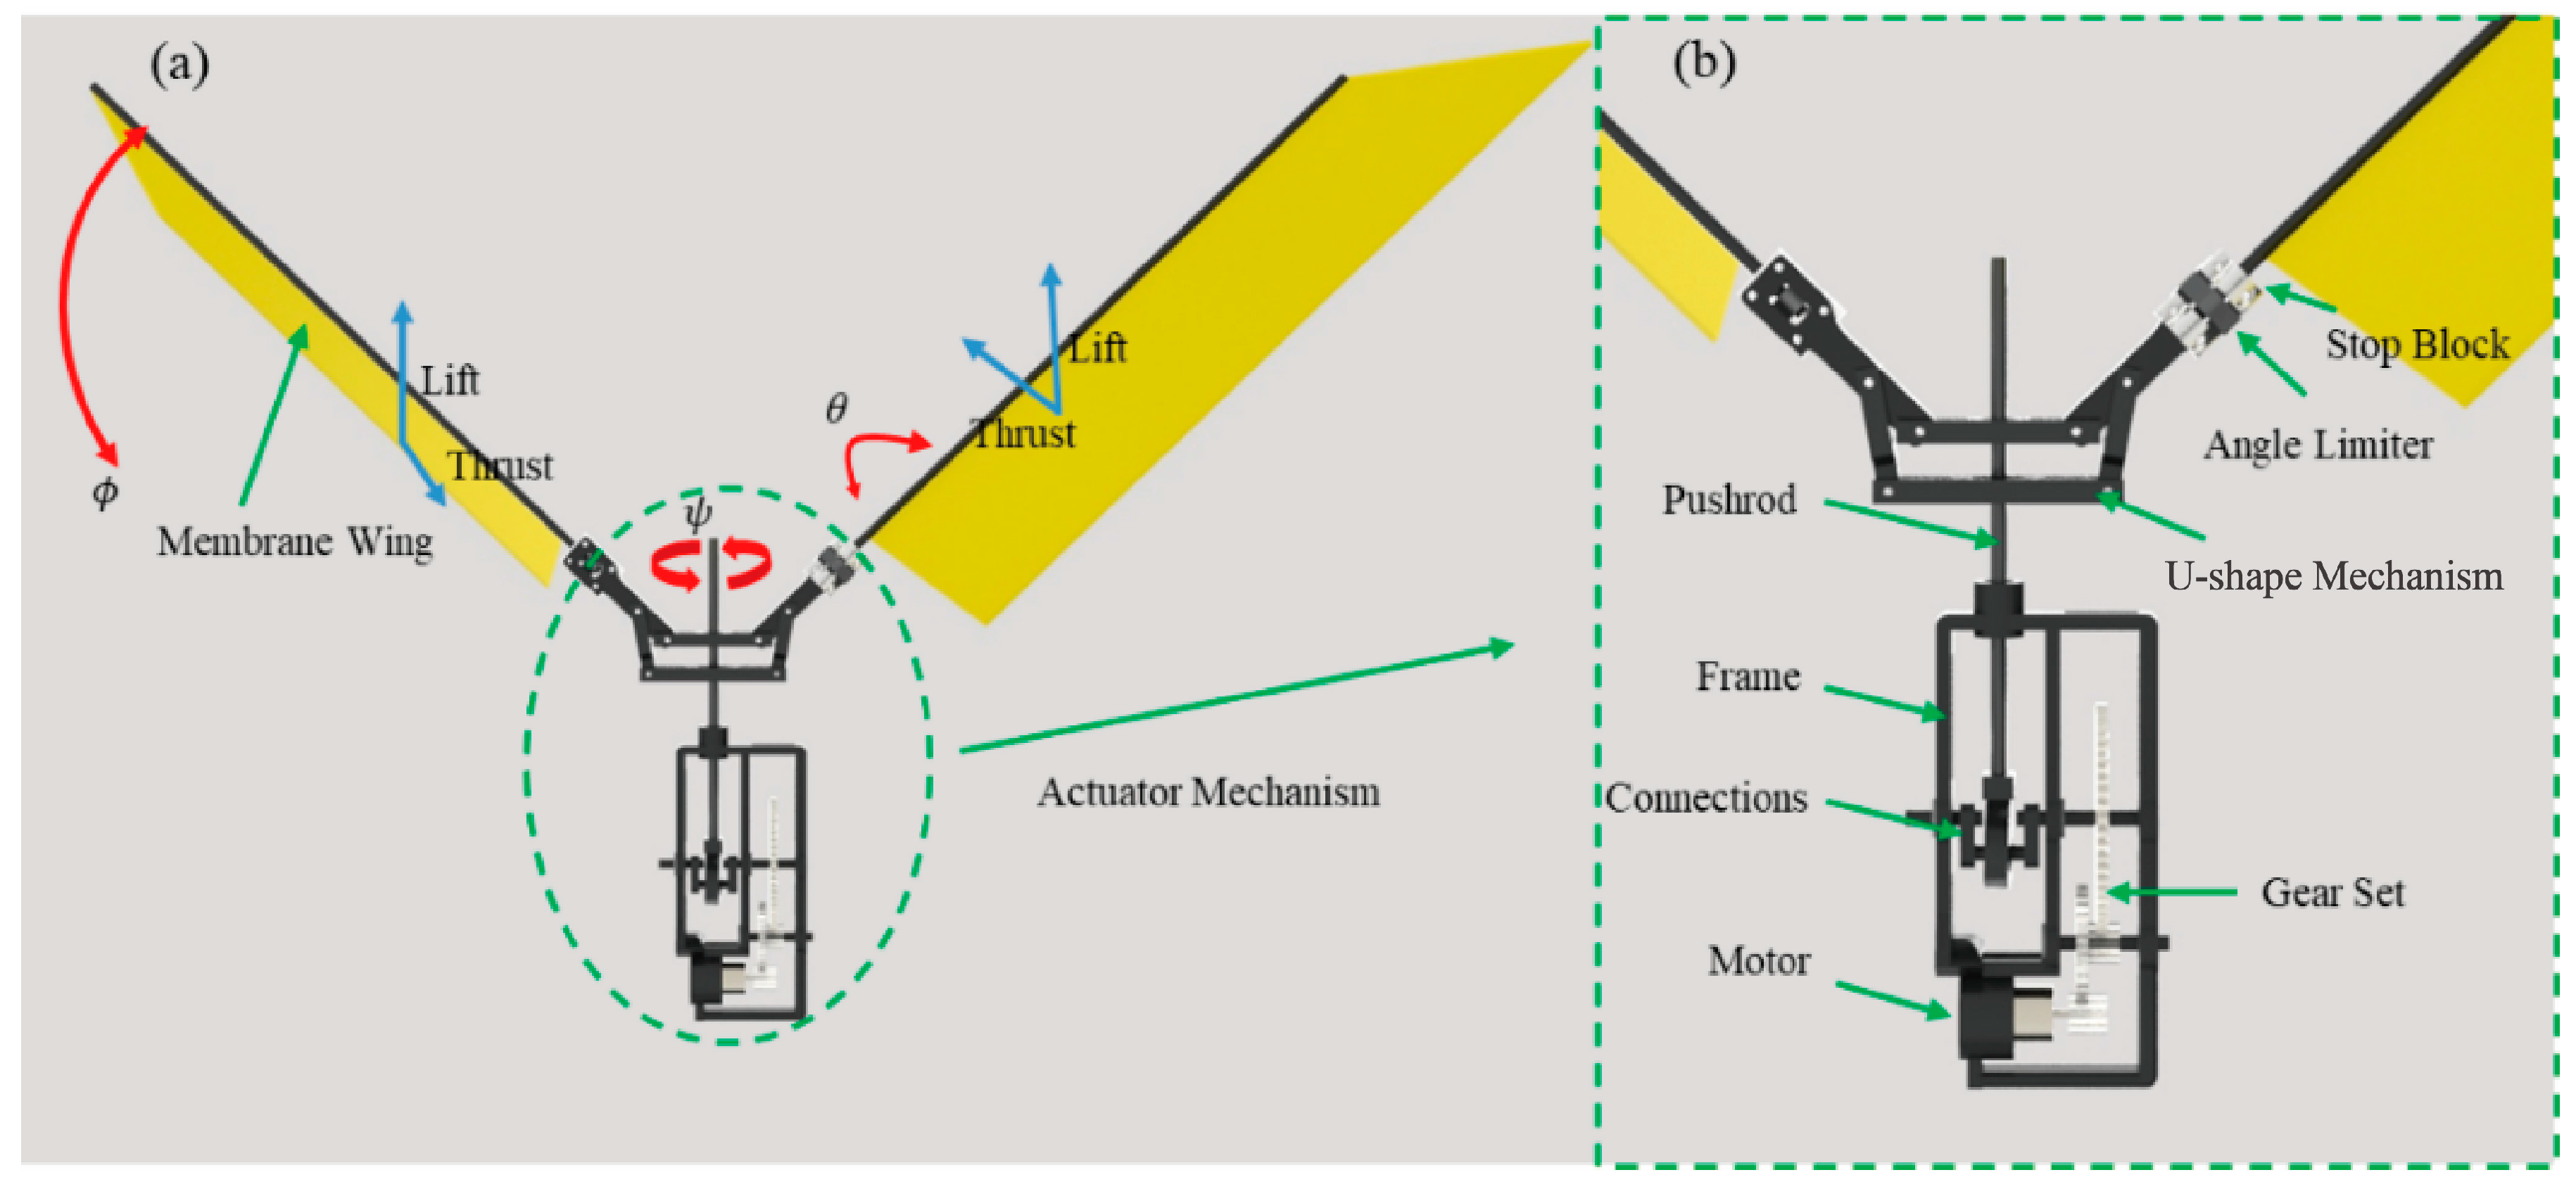
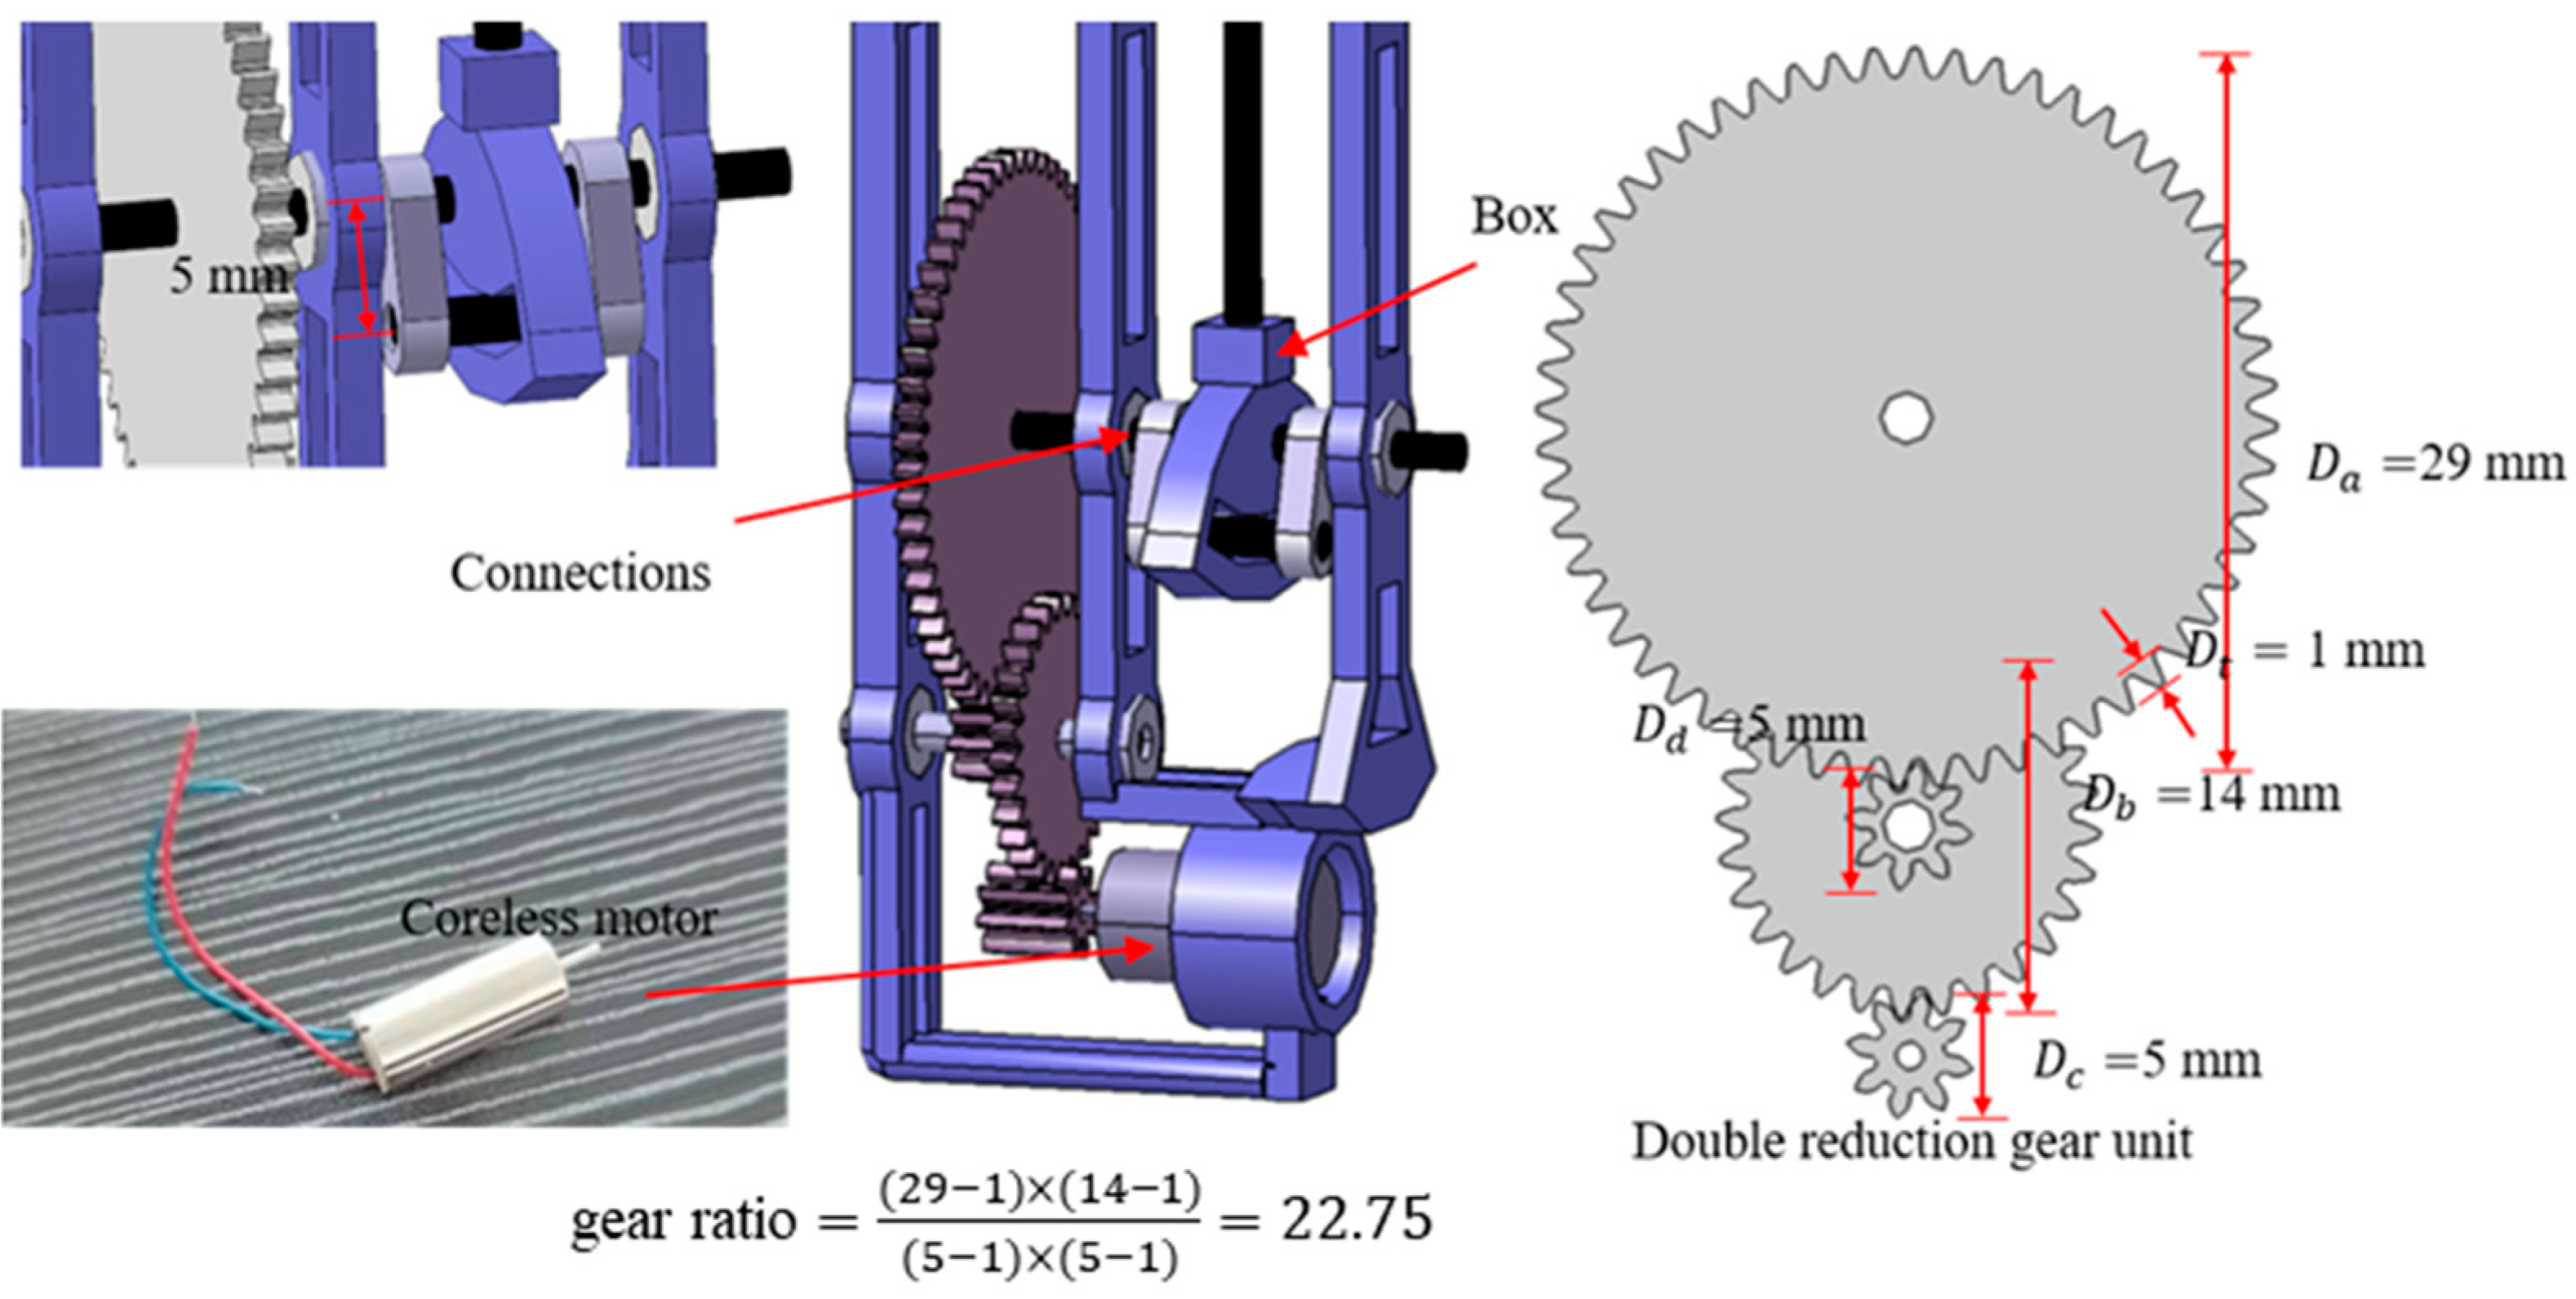
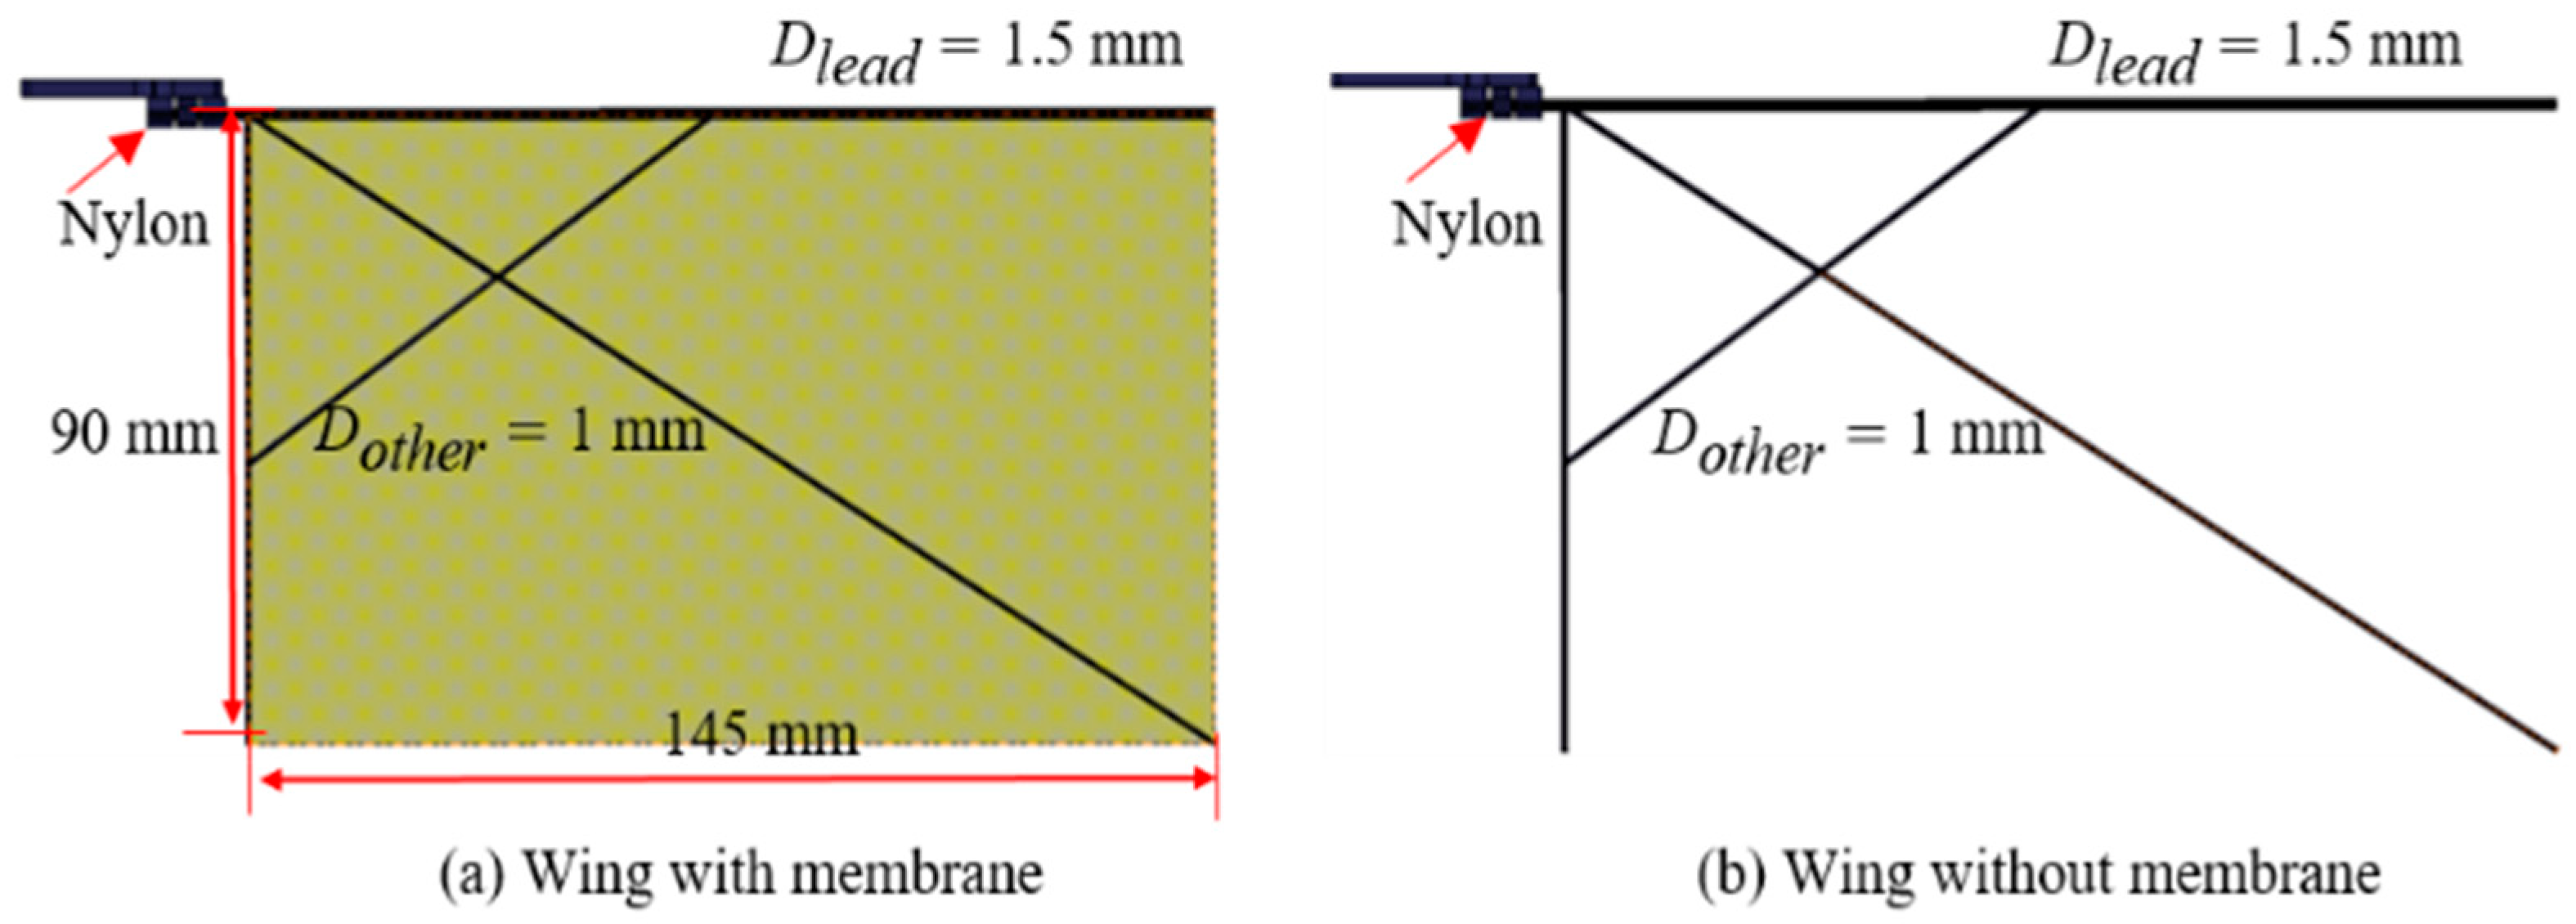
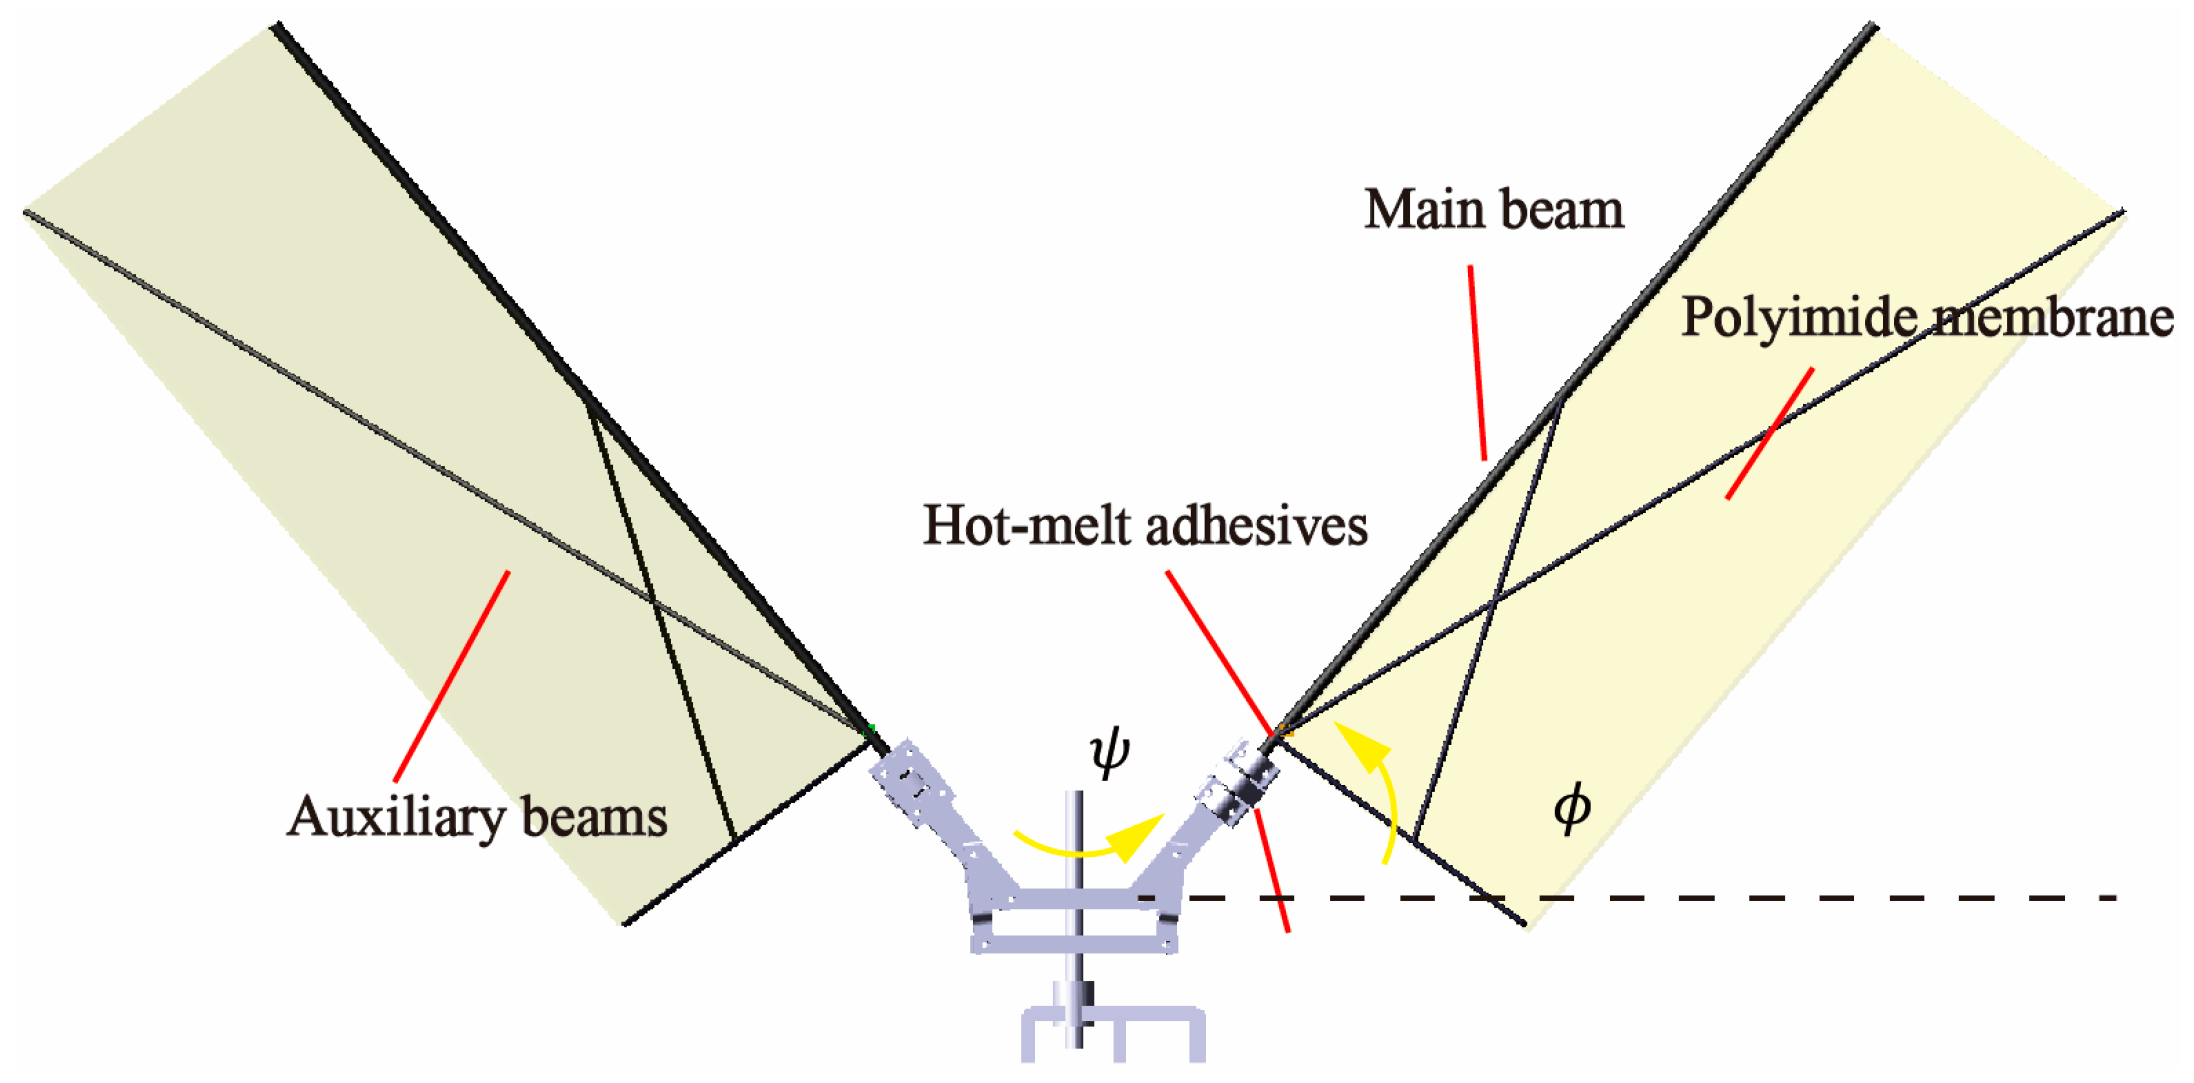
2.1. Structure of the FWR Model
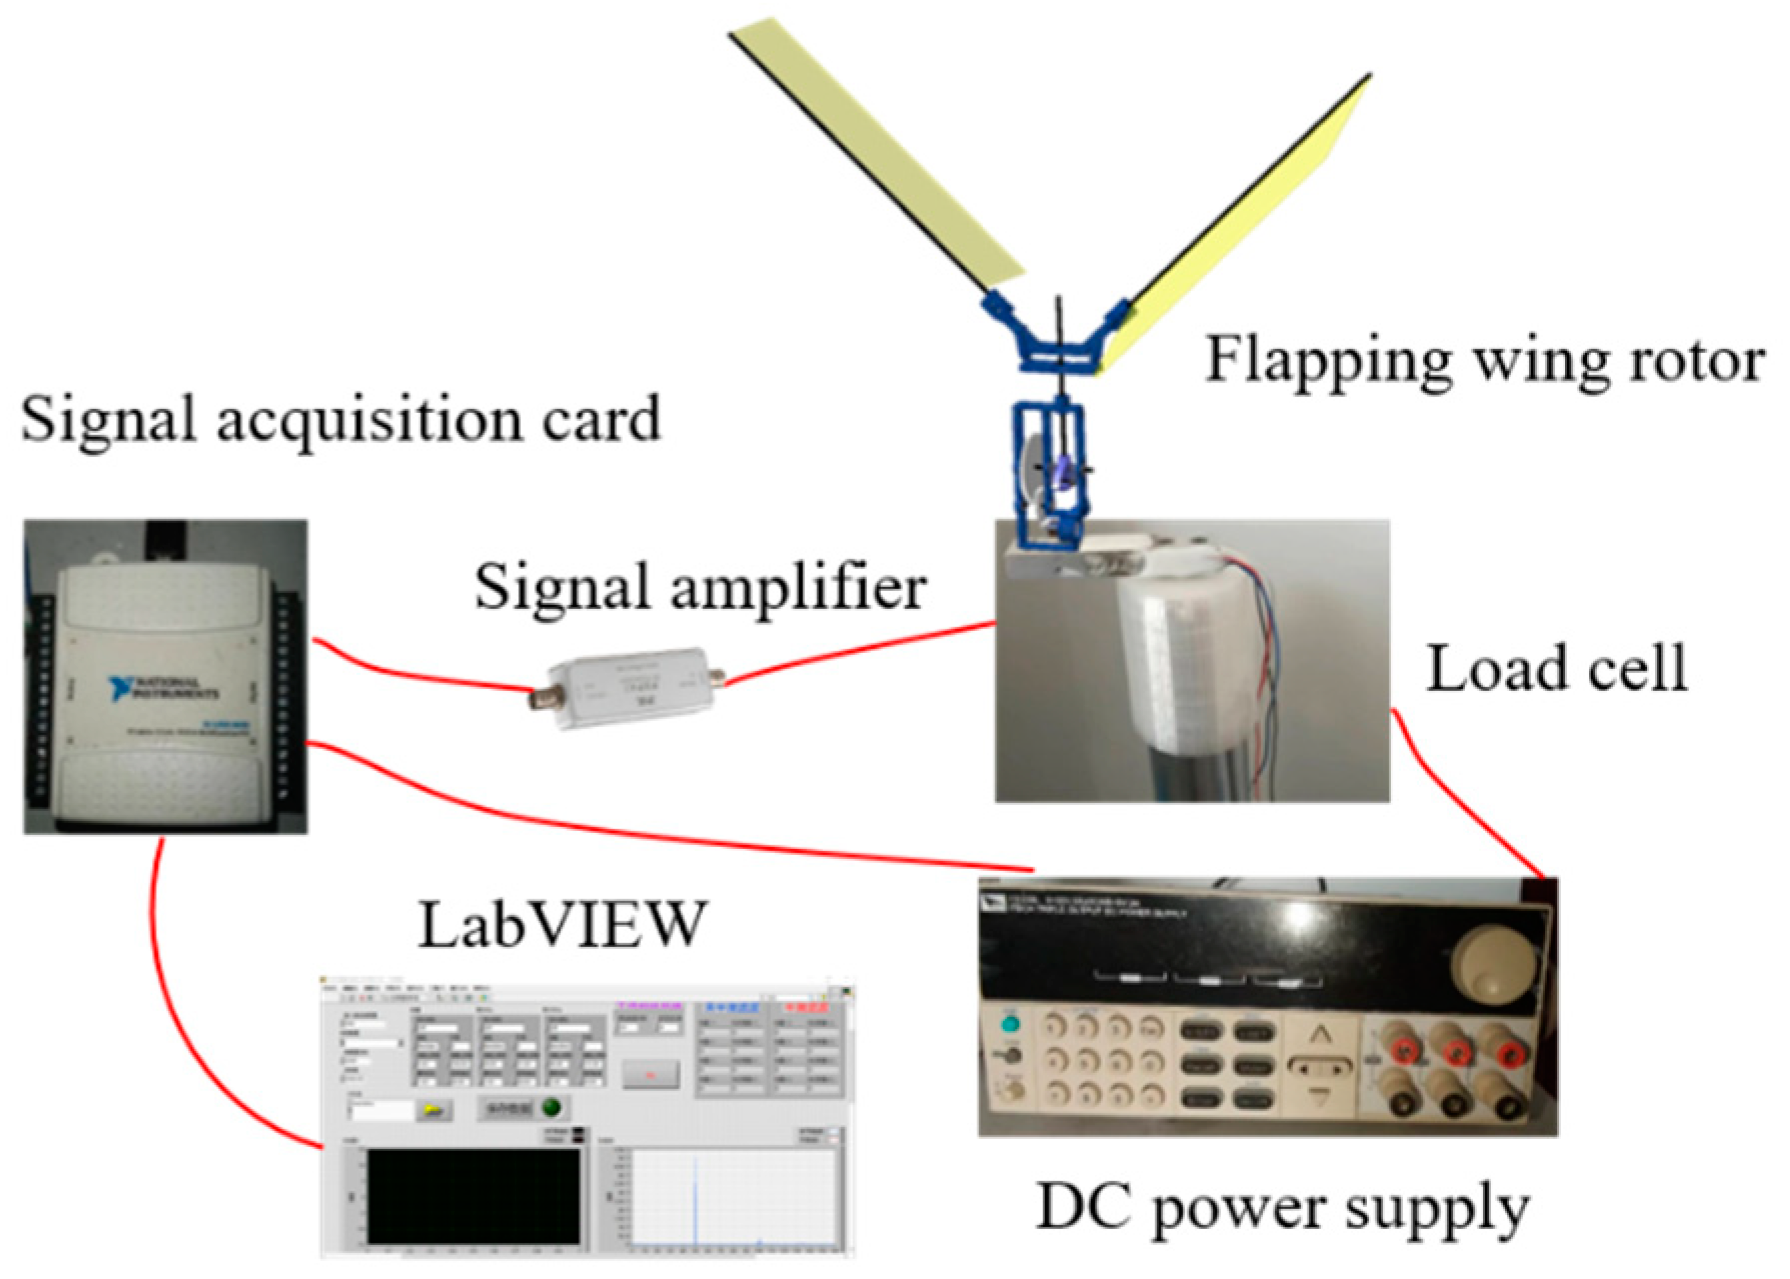
2.2. The Setup of Experiment
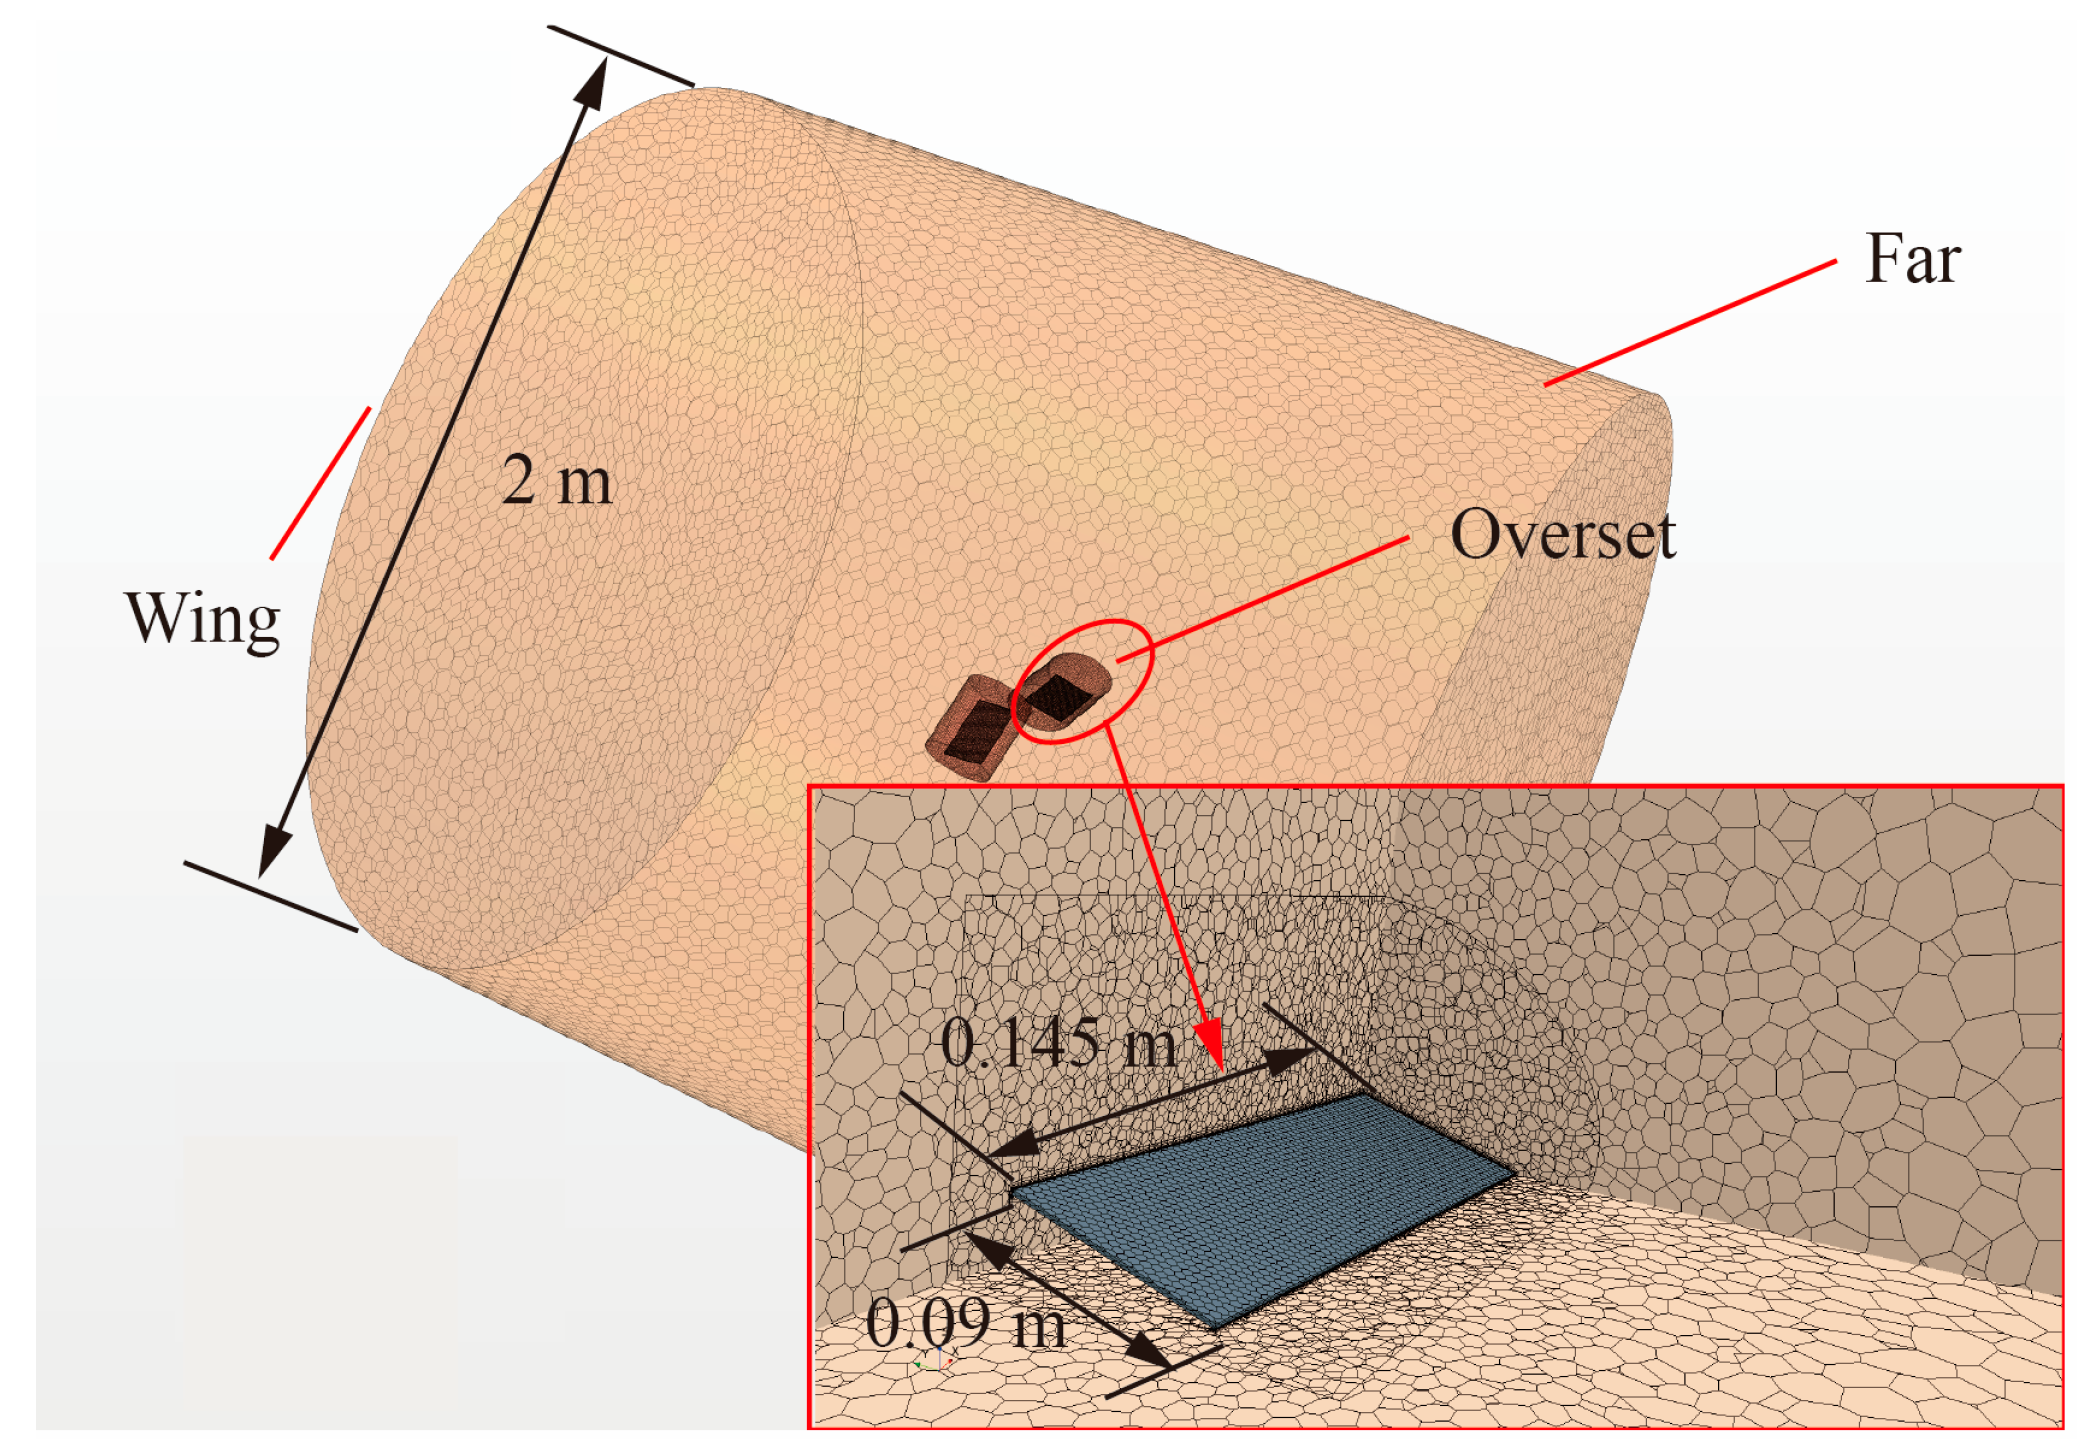
2.3. Numerical Model
3. Experiment Results and Discussion
3.1. Measuring Cases
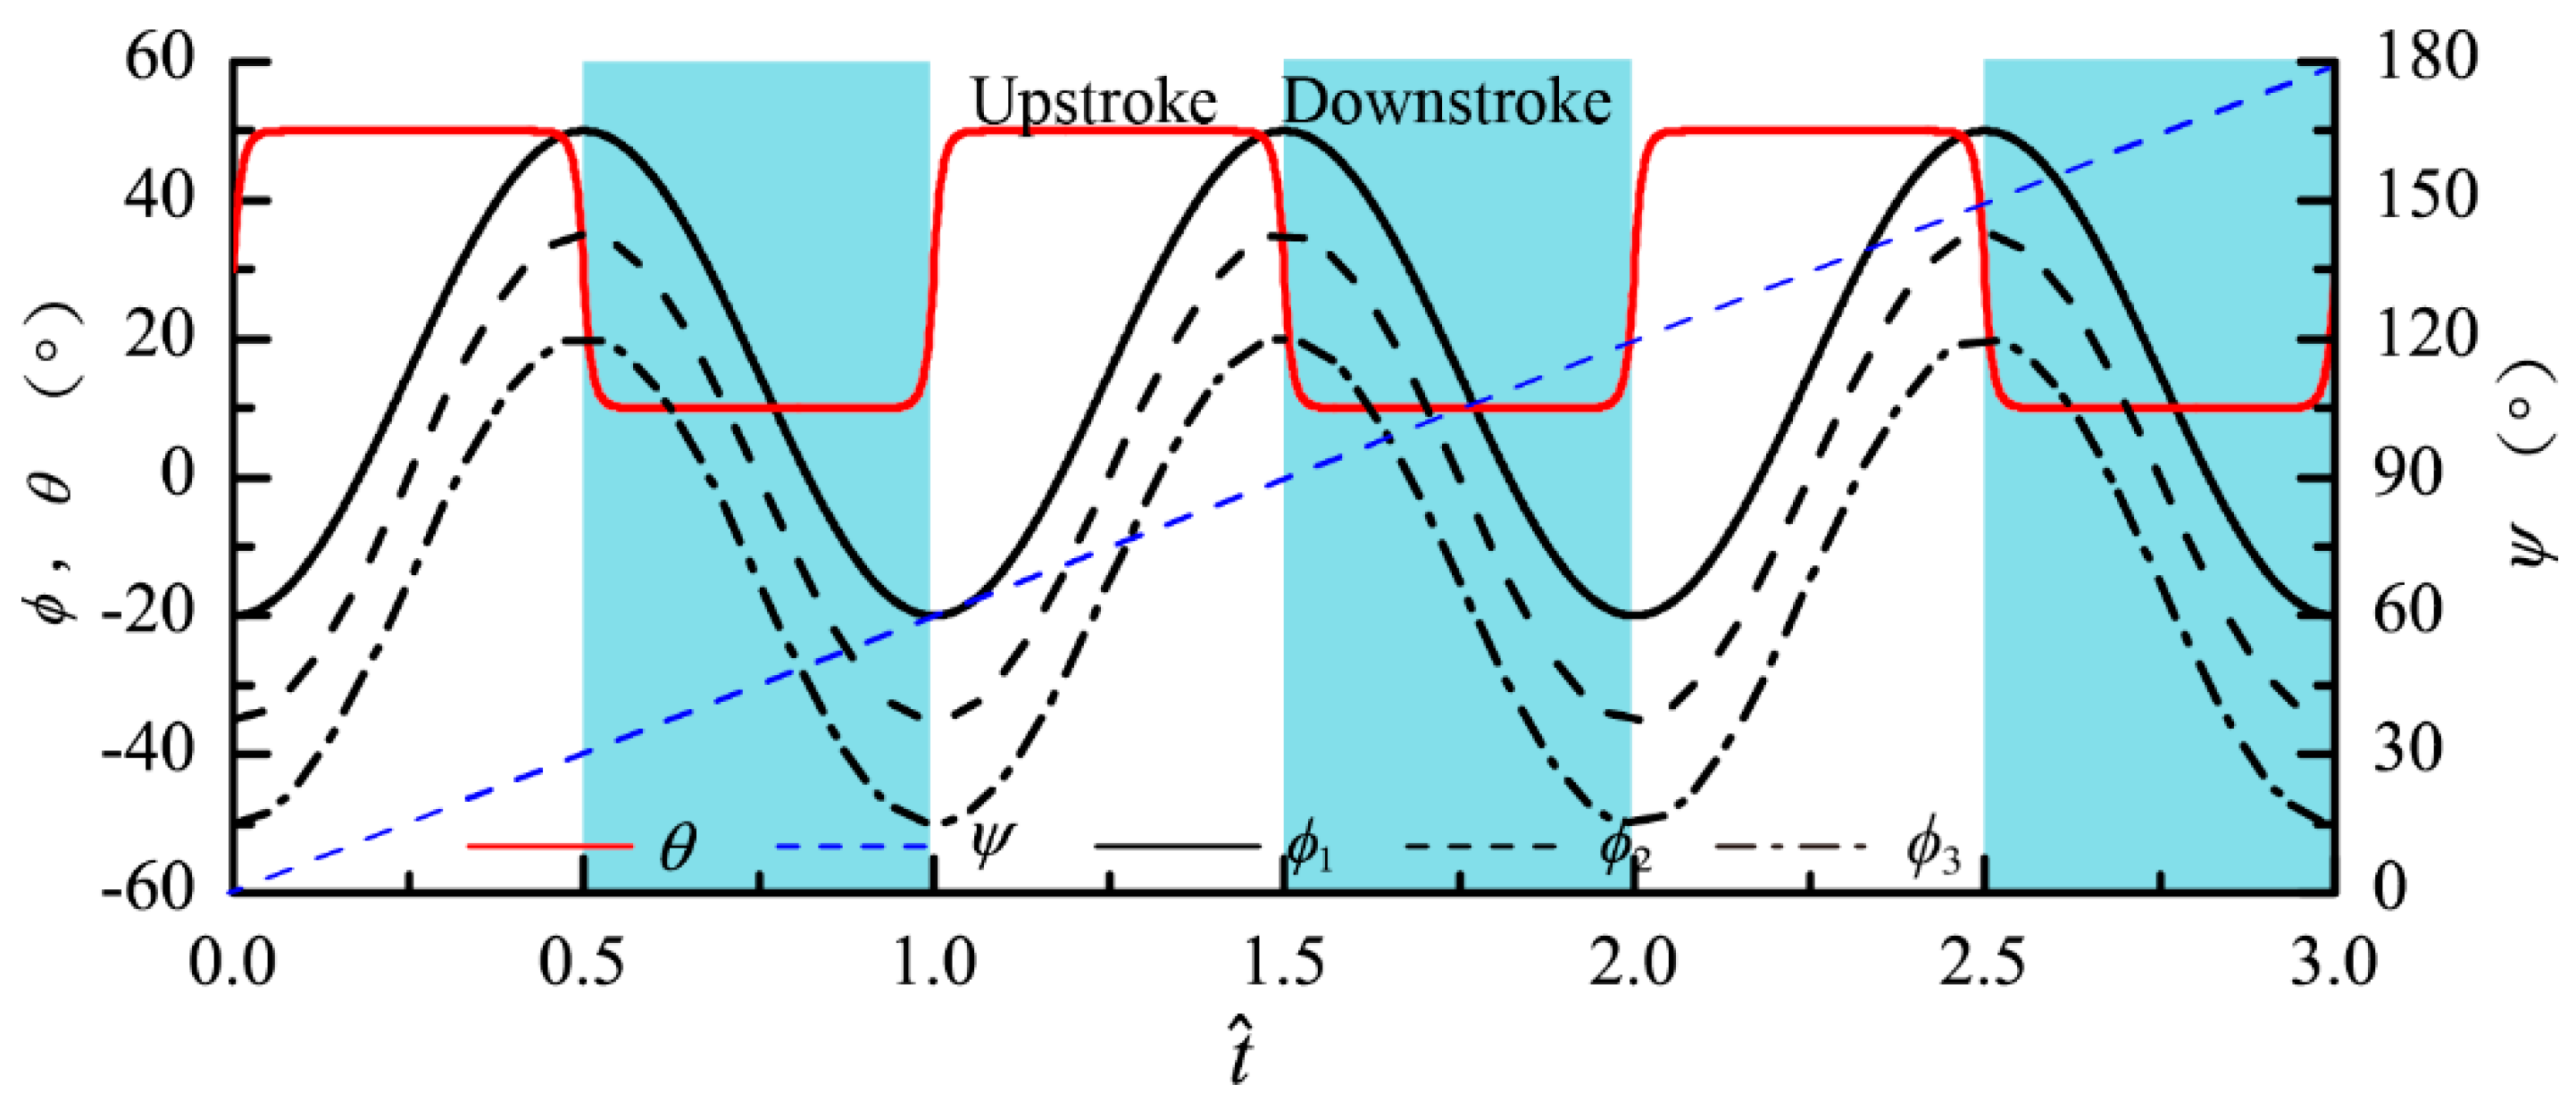
3.2. The Effect of Asymmetric Stroke Angles on the Motion and Efficiency of the Flapping-Wing Rotor
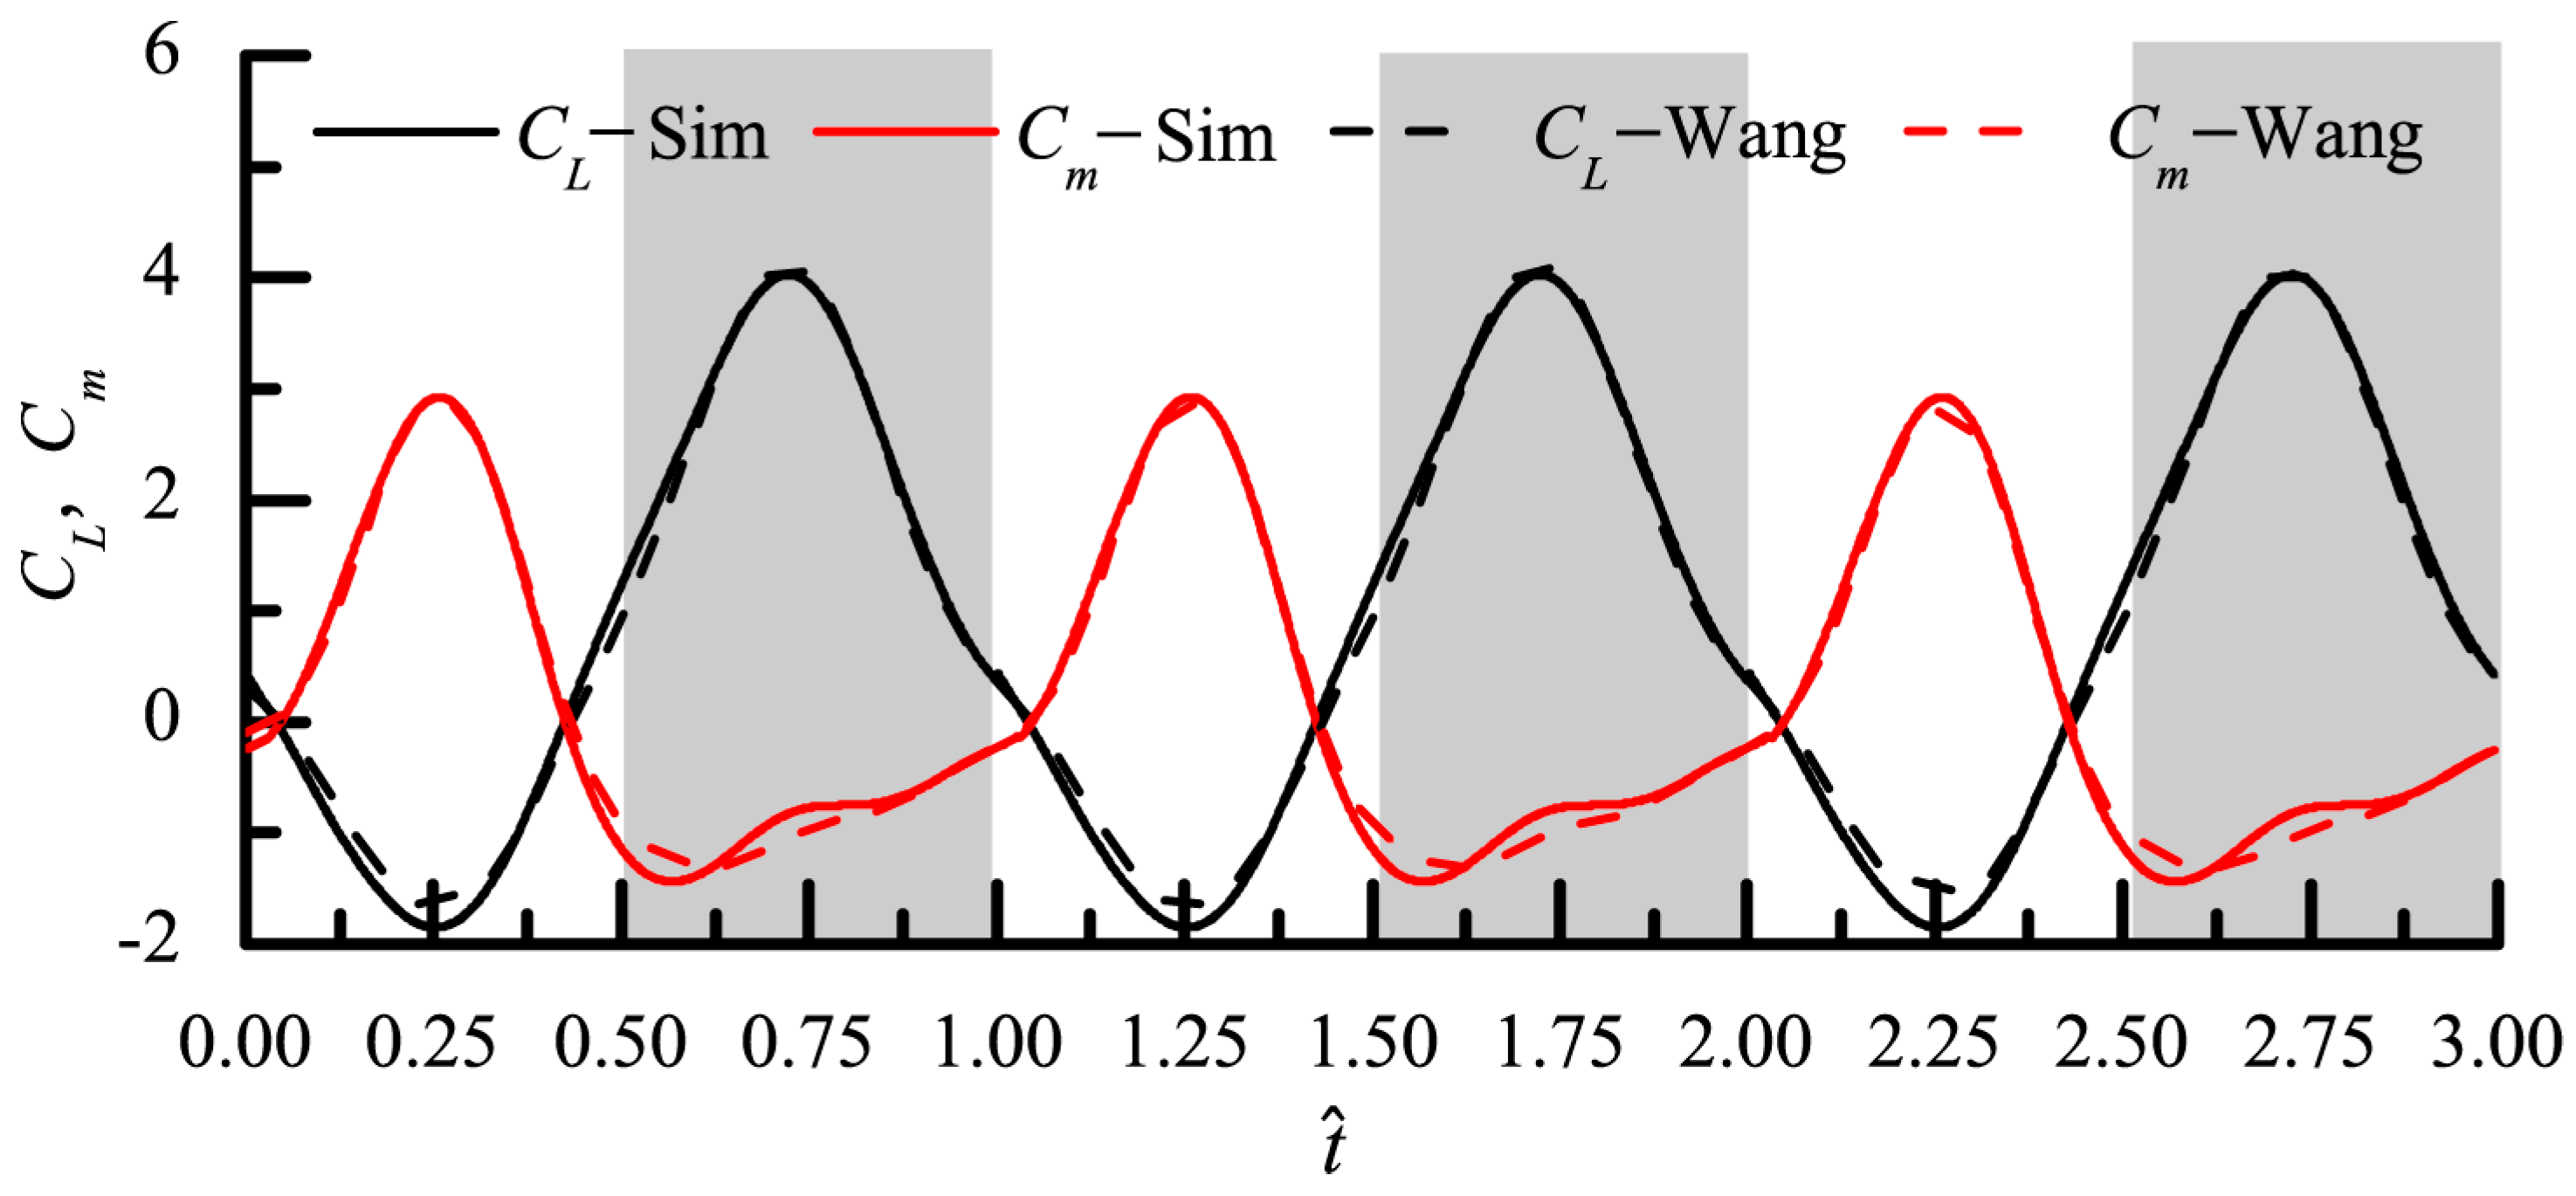
3.3. Experimental and CFD Simulation Comparison
3.4. The Effect of Asymmetric Stroke Angles on the Average Lift Generation
4. Conclusions
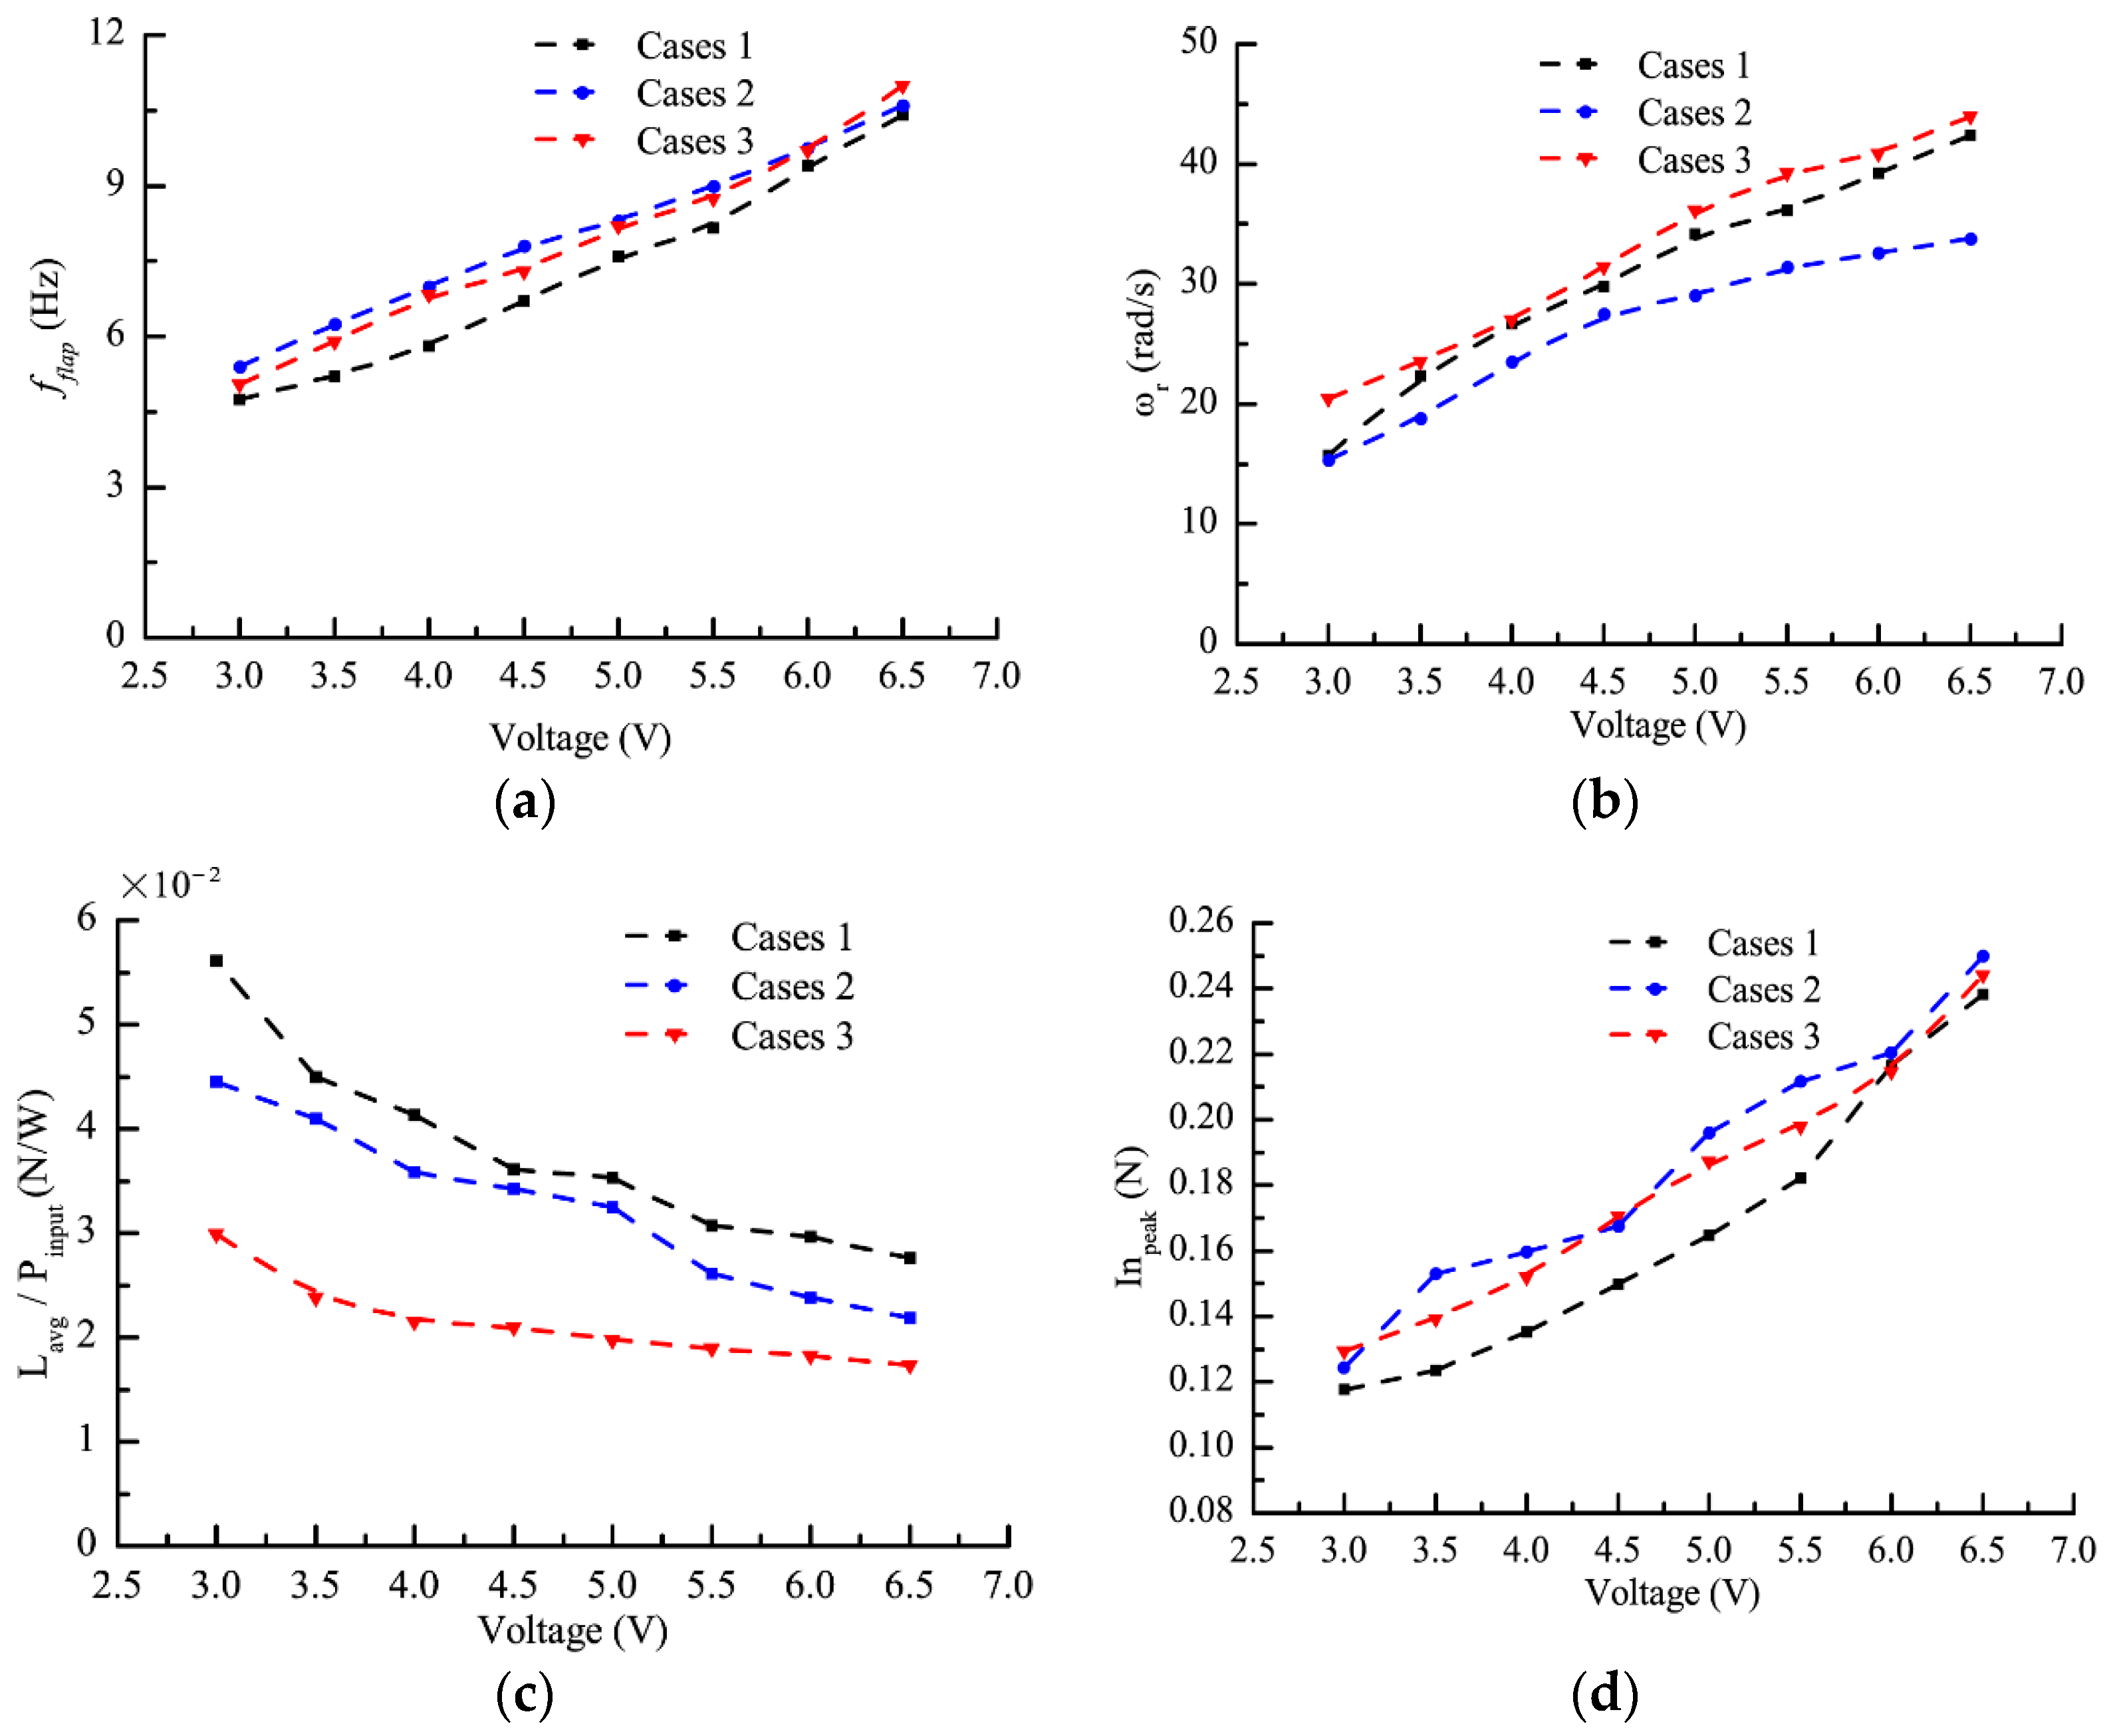
- Compared with the cases in Cases 2 (), the cases in Cases 1 () or Cases 3() share a relatively higher rotary speed given the same input voltage. The rotary speed for Case 3-8 (7 rev/s) are 1.3 times larger than that for Case 2-8 (5.375 rev/s).
- The positive average stroke angle in Cases 1 leads to the largest lift-to-power ratio (about 1.25 times those in Cases 2 and about 1.6 times those in Cases 3). The negative average stroke angle cases tend to generate the smallest lift-to-power ratio despite the negative average stroke angle facilitating the generation of a higher rotary speed.
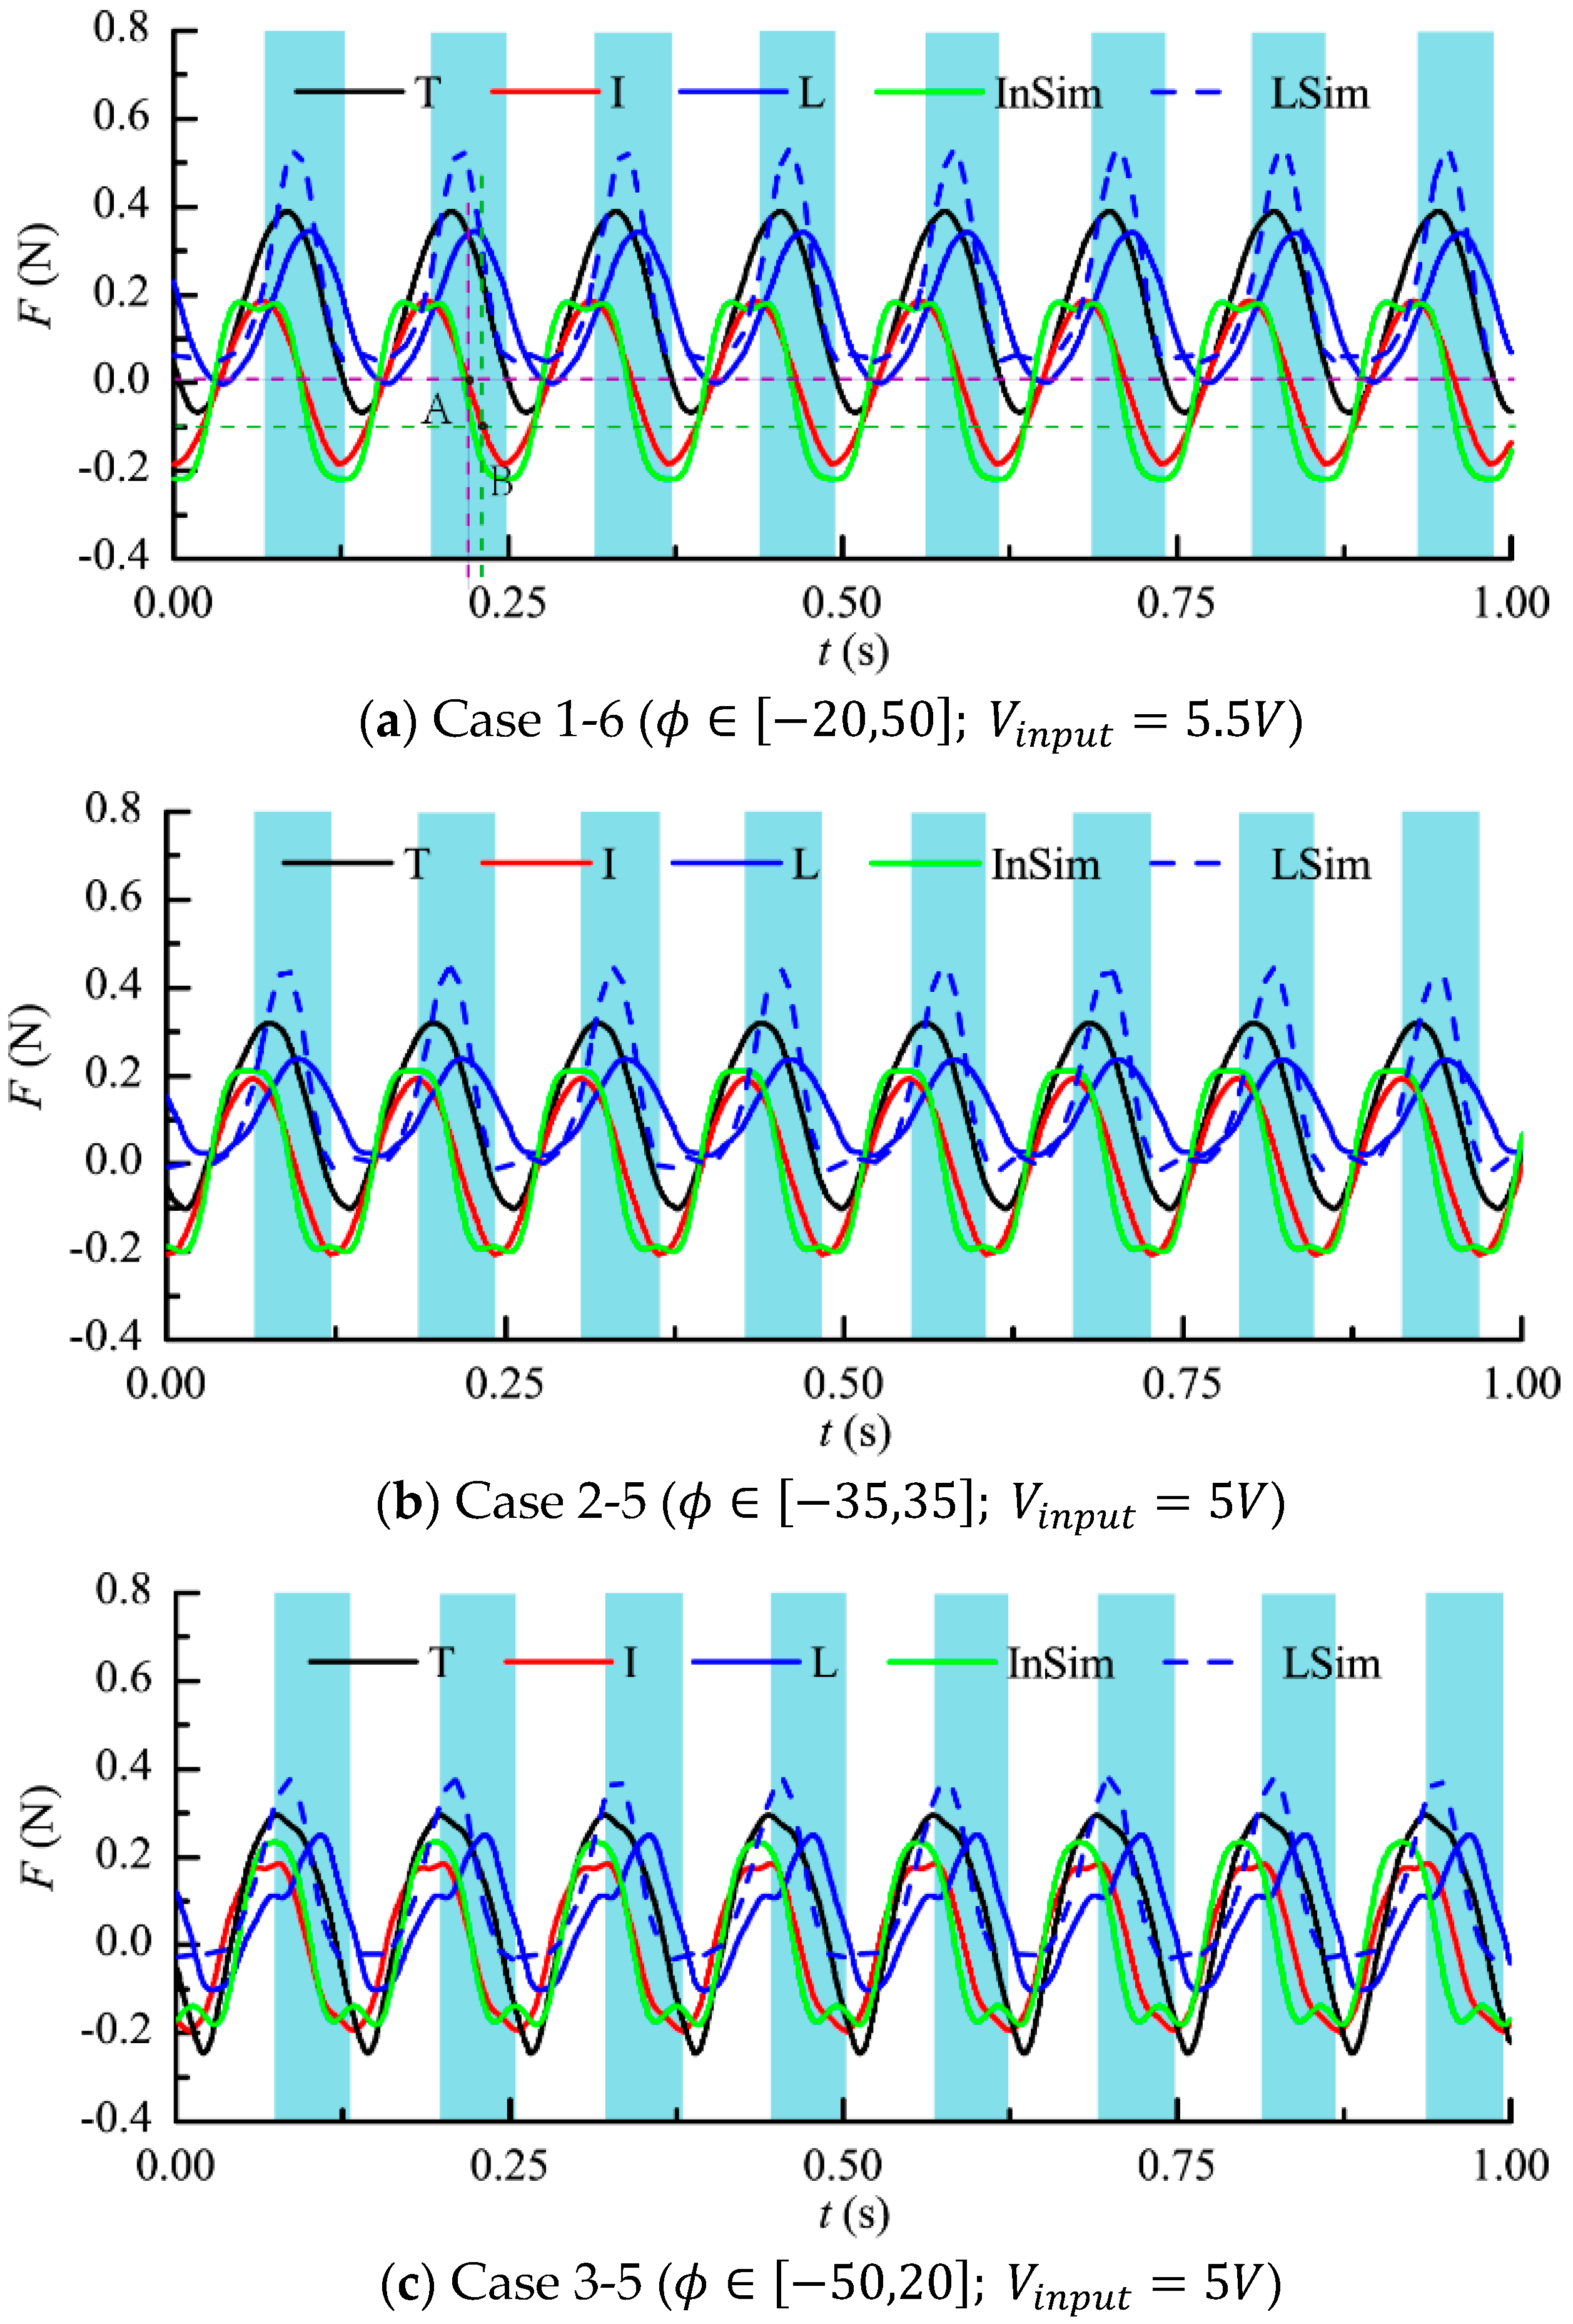
- Through the time history curves of the lift in Case 1-6, Case 2-5, and Case 3-5, it is found that under the same flapping frequency, the peak inertial forces under different average stroke angles are similar with each other. Moreover, despite there being an apparent negative lift during the upstroke in Case 3-5 (negative average stroke angle), the instantaneous lift in Case 1-6 and Case 2-5 is positive or nearly zero.
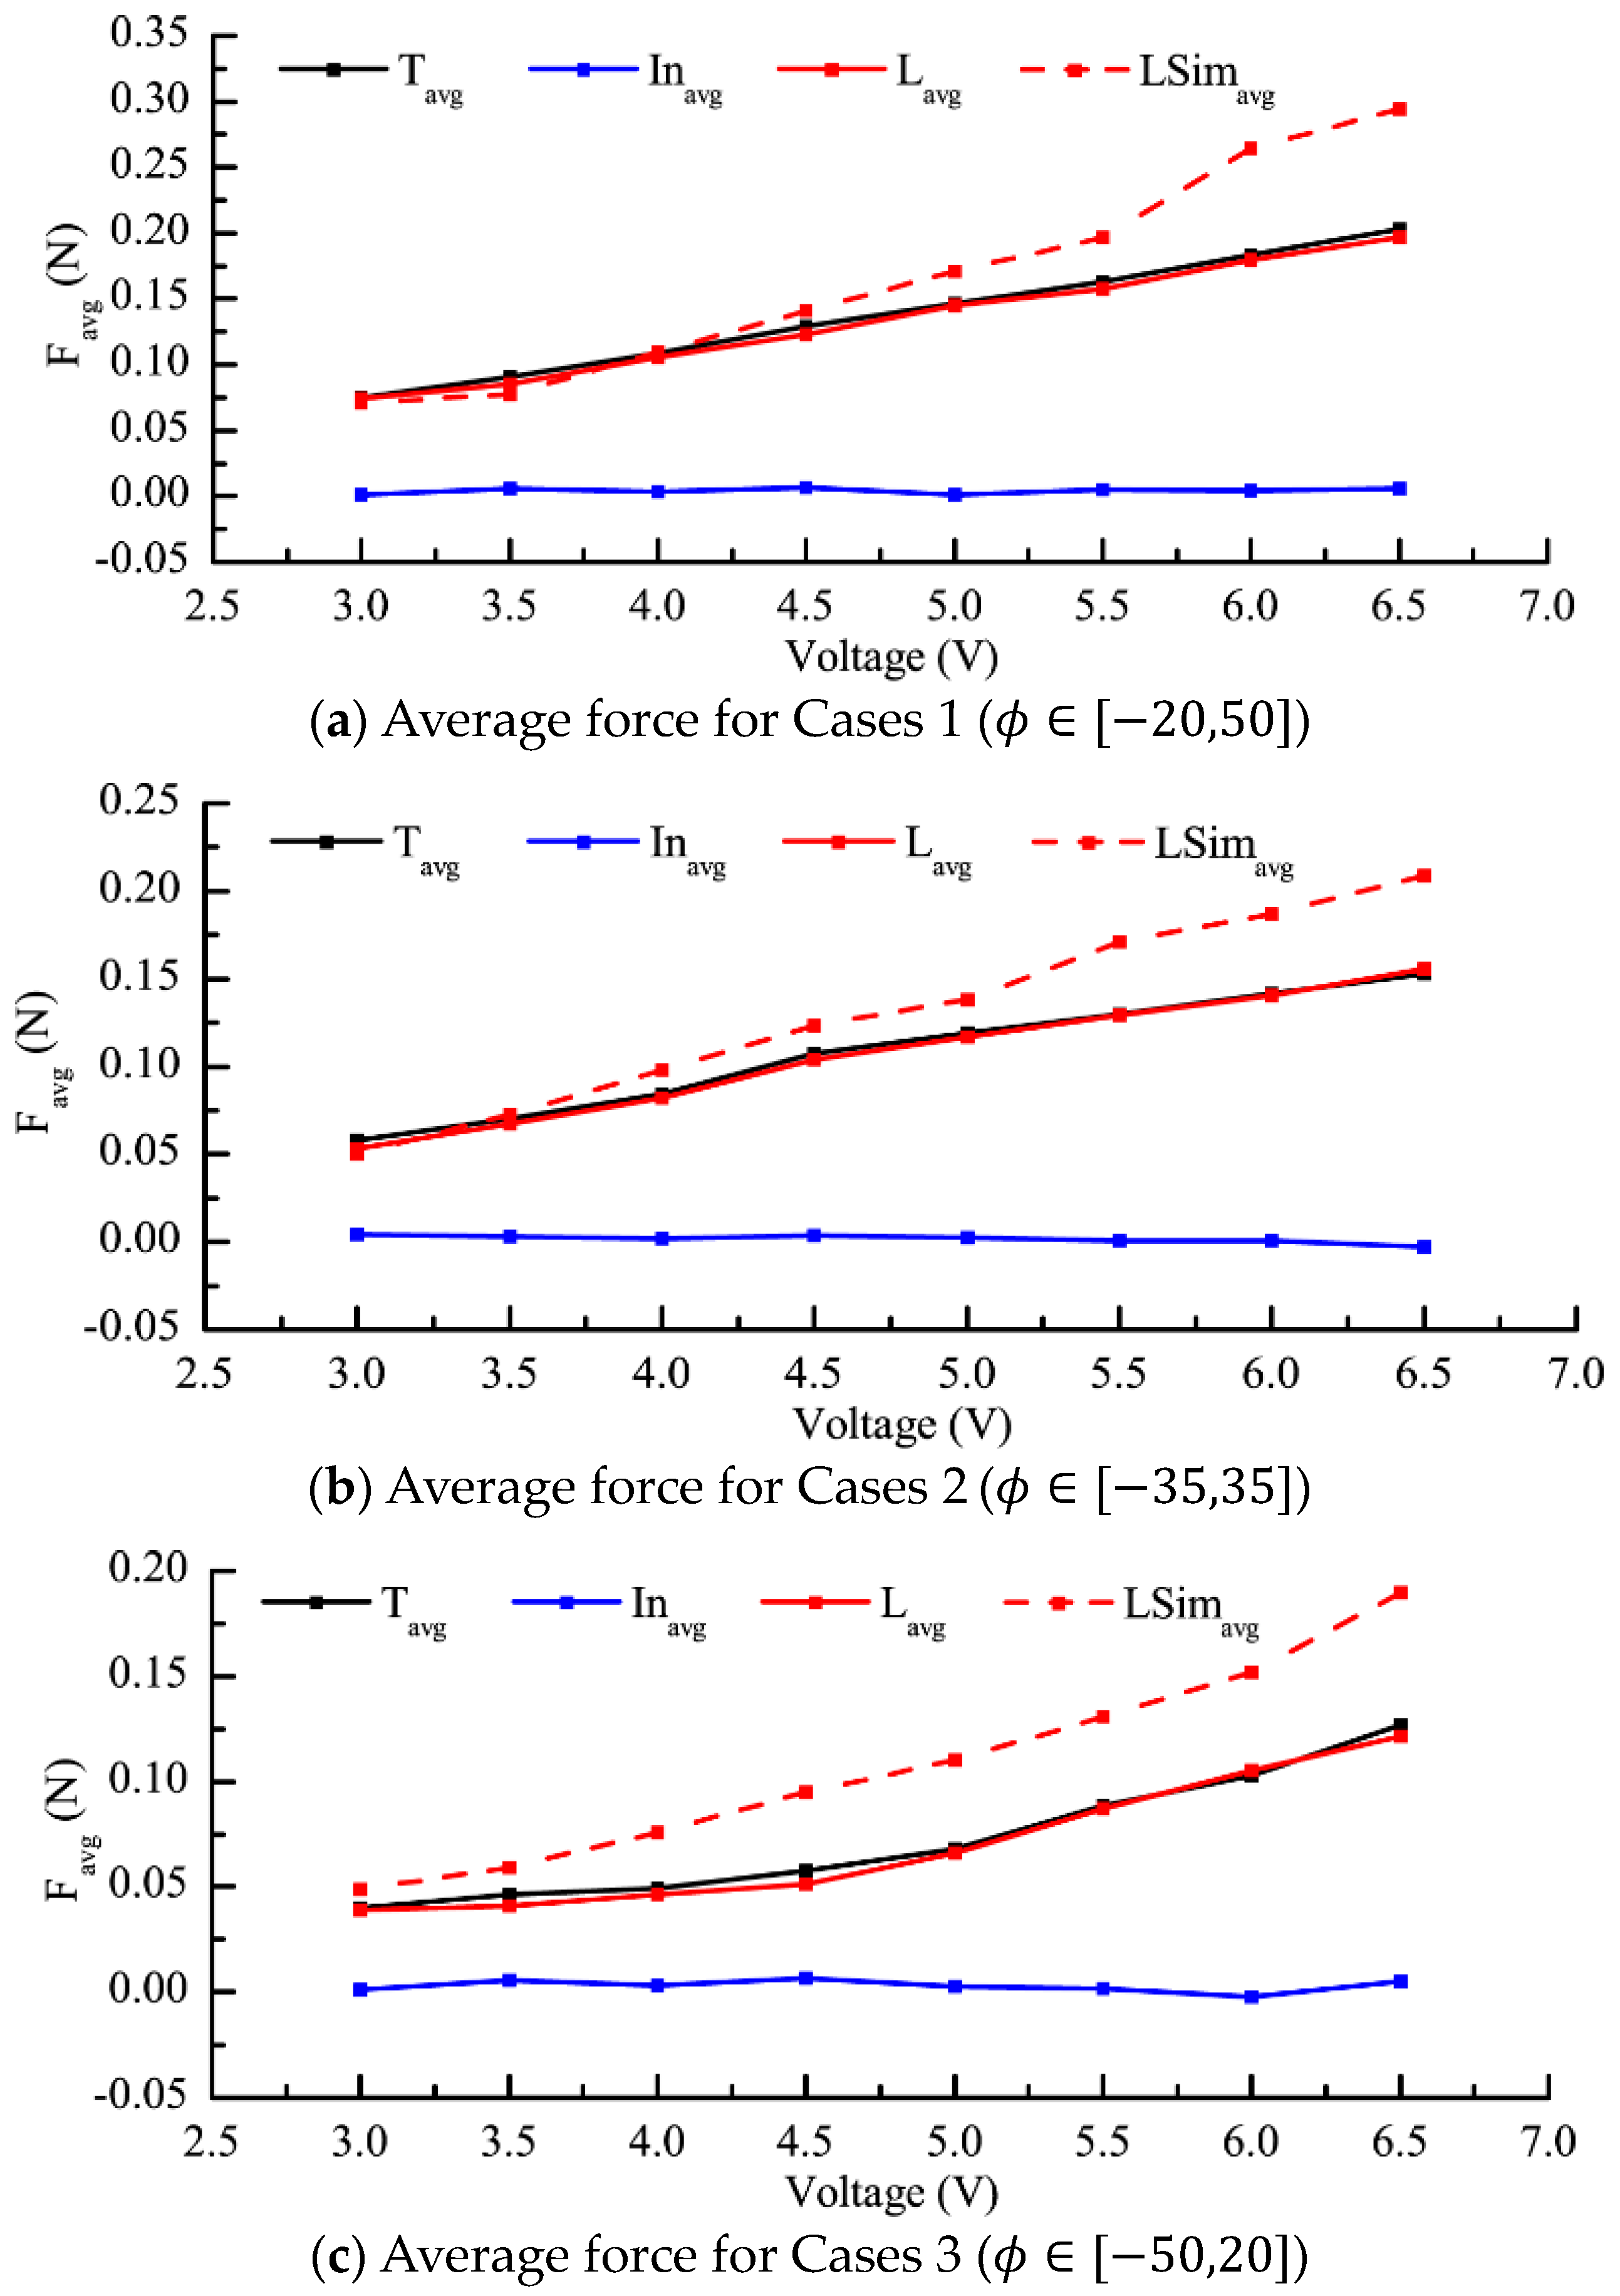
- Whatever the input voltage is, the average lifts in Cases 1 () are about 1.25 times those in Cases 2 () and about 1.5 times those in Cases 3 ().
- Among all the cases in this paper, the highest lift-to-weight ratio reaches 1.07, which means the flapping-wing rotor can realize vertical take-off.
Author Contributions
Funding
Institutional Review Board Statement
Informed Consent Statement
Data Availability Statement
Conflicts of Interest
References
- Roberts, L.J.; Bruck, H.A.; Gupta, S.K. Modeling of dive maneuvers in flapping wing unmanned aerial vehicles. In Proceedings of the 2015 IEEE International Symposium on Safety, Security, and Rescue Robotics (SSRR), West Lafayette, IN, USA, 18–20 October 2015. [Google Scholar]
- Djojodihardjo, H.; Afiq, K.; Rahim, A. Two-dimensional CFD Simulation for visualization of flapping wing ornithopter studies. ARPN J. Eng. Appl. Sci. 2015, 10, 10018–10026. [Google Scholar]
- Jadhav, S.S.; Lua, K.B.; Tay, W.B. Effect of Clap-and-Fling Mechanism on Force Generation in Flapping Wing Micro Aerial Vehicles. Bioinspir. Biomim. 2019, 14, 036006. [Google Scholar] [CrossRef]
- Chen, L.; Zhang, Y.; Chen, Z.; Xu, J.; Wu, J. Topology optimization in lightweight design of a 3D-printed flapping-wing micro aerial vehicle. Chin. J. Aeronaut. 2020, 33, 3206–3219. [Google Scholar] [CrossRef]
- Tu, Z.; Fei, F.; Deng, X. Bio-Inspired Rapid Escape and Tight Body Flip on an At-Scale Flapping Wing Hummingbird Robot Via. IEEE Trans. Robot. 2021, 37, 1742–1751. [Google Scholar] [CrossRef]
- Tu, Z.; Fei, F.; Liu, L.; Zhou, Y.; Deng, X. Flying With Damaged Wings: The Effect on Flight Capacity and Bio-Inspired Coping Strategies of a Flapping Wing Robot. IEEE Robot. Autom. Lett. 2021, 6, 2114–2121. [Google Scholar] [CrossRef]
- Zufferey, R.; Tormo-barbero, J.; Guzmán, M.M.; Maldonado, F.J.; Sanchez-laulhe, E.; Grau, P.; Pérez, M.; Acosta, J.Á.; Ollero, A. Design of the High-Payload Flapping Wing Robot E-Flap. IEEE Robot. Autom. Lett. 2021, 6, 3097–3104. [Google Scholar] [CrossRef]
- Lua, K.B.; Lu, H.; Zhang, X.H.; Lim, T.T.; Yeo, K.S. Aerodynamics of two-dimensional flapping wings in tandem configuration. Phys. Fluids 2016, 28, 121901. [Google Scholar] [CrossRef]
- Wu, P.; Stanford, B.K.; Sällström, E.; Ukeiley, L.; Ifju, P.G. Structural dynamics and aerodynamics measurements of biologically inspired flexible flapping wings. Bioinspir. Biomim. 2011, 6, 016009. [Google Scholar] [CrossRef] [PubMed]
- Liang, B.; Sun, M. Nonlinear flight dynamics and stability of hovering model insects. J. R. Soc. Interface 2013, 10, 1–11. [Google Scholar] [CrossRef] [Green Version]
- Wu, J.; Sun, M. Control for going from hovering to small speed flight of a model insect. Acta Mech. Sin. 2009, 25, 295–302. [Google Scholar] [CrossRef]
- Systems, O.; Rongfa, M.N.; Pantuphag, T.; Srigrarom, S.; Swallow, B.; Reynolds, L. Analysis of Kinematics of Flapping Wing UAV Using OptiTrack Systems. Aerospace 2016, 3, 23. [Google Scholar]
- Zhu, J.Y.; Proceedings, C.Y.Z.; Engineers, M.; Engineering, A.; Version, O. Aerodynamic performance of a two-dimensional flapping wing in asymmetric stroke. Proc. IMechE Part G J. Aerosp. Eng. 2014, 228, 641–651. [Google Scholar] [CrossRef]
- Li, D.; Guo, S.; Matteo, N.D.; Yang, D. Design, Experiment and Aerodynamic Calculation of a Flapping Wing Rotor Micro Aerial Vehicle. In Proceedings of the 52nd AIAA/ASME/ASCE/AHS/ASC Structures, Structural Dynamics and Materials Conference, Denver, CO, USA, 4–7 April 2011; pp. 1–9. [Google Scholar]
- Guo, S.; Li, D.; Wu, J. Theoretical and experimental study of a piezoelectric flapping wing rotor for micro aerial vehicle. Aerosp. Sci. Technol. 2012, 23, 429–438. [Google Scholar] [CrossRef]
- Zhou, C.; Wu, J.; Guo, S.; Li, D. Experimental study on the lift generated by a flapping rotary wing applied in a micro air vehicle. Proc. IMechE Part G J. Aerosp. Eng. 2014, 228, 2083–2093. [Google Scholar] [CrossRef]
- Li, H.; Guo, S. Aerodynamic efficiency of a bioinspired flapping wing rotor at low Reynolds number. R. Soc. Open Sci. 2018, 5, 1–15. [Google Scholar] [CrossRef] [Green Version]
- Dong, X.; Li, D.; Xiang, J.; Wang, Z. Design and experimental study of a new flapping wing rotor micro aerial vehicle. Chin. J. Aeronaut. 2020, 33, 3092–3099. [Google Scholar] [CrossRef]
- Lok, M.; Helbling, E.F.; Zhang, X.; Wood, R.; Brooks, D.; Wei, G.Y. A Low Mass Power Electronics Unit to Drive Piezoelectric Actuators for Flying Microrobots. IEEE Trans. Power Electron. 2018, 33, 3180–3191. [Google Scholar] [CrossRef]
- Percin, M.; Van Oudheusden, B.; Remes, B. Flow structures around a flapping-wing micro air vehicle performing a clap-&-peel motion. AIAA J. 2017, 55, 1251–1264. [Google Scholar]
- Ji, B.; Zhu, Q.; Guo, S.; Yang, F.; Li, Y.; Zhu, Z.; Chen, S.; Song, R.; Li, Y. Design and experiment of a bionic flapping wing mechanism with flapping-twist-swing motion based on a single rotation. AIP Adv. 2020, 10, 065018. [Google Scholar] [CrossRef]
- Zhao, L.; Huang, Q.; Deng, X.; Sane, S.P.; Zhao, L.; Huang, Q.; Deng, X. Aerodynamic effects of flexibility in flapping wings. J. R. Soc. Interface 2010, 7, 485–497. [Google Scholar] [CrossRef] [Green Version]
- Wu, J.; Wang, D.; Zhang, Y. Aerodynamic Analysis of a Flapping Rotary Wing at a Low Reynolds Number. AIAA J. 2015, 53, 2951–2966. [Google Scholar] [CrossRef]
- Wang, D.; Zhang, Y.; Wu, J.; Zhang, Y. Aerodynamics on Flapping Rotary Wing in Low Reynolds Number. In Proceedings of the 2013 International Powered Lift Conference, Los Angeles, CA, USA, 12–14 August 2013; pp. 1–14. [Google Scholar]
- Chen, S.; Wang, L.; Guo, S.; Zhao, C.; Tong, M. A bio-inspired flappingwing rotor of variant frequency driven by ultrasonic motor. Appl. Sci. 2020, 10, 412. [Google Scholar]
- Granlund, K.O.; Ol, M.V.; Bernal, L.P. Unsteady pitching flat plates. J. Fluid Mech. 2013, 733, R5. [Google Scholar] [CrossRef]
- Ramesh, K.; Gopalarathnam, A.; Edwards, J.R.; Ol, M.V.; Granlund, K. An unsteady airfoil theory applied to pitching motions validated against experiment and computation. Theor. Comput. Fluid Dyn. 2013, 27, 843–864. [Google Scholar] [CrossRef]
- Liu, L.; Li, H.; Ang, H.; Xiao, T. Numerical investigation of flexible flapping wings using computational fluid dynamics/computational structural dynamics method. Proc. Inst. Mech. Eng. Part G J. Aerosp. Eng. 2018, 232, 85–95. [Google Scholar] [CrossRef] [Green Version]
- Chen, S.; Wang, L.; He, Y.; Tong, M.; Pan, Y.; Ji, B.; Guo, S. Aerodynamic performance of a flyable flapping wing rotor with passive pitching angle variation. IEEE Trans. Ind. Electron. 2022, 69, 9176–9184. [Google Scholar] [CrossRef]


| Component Name | Weight (g) | Quantity |
|---|---|---|
| Frame | 2.8 | 1 |
| Box | 0.5 | 1 |
| Motor | 5.5 | 1 |
| Gear set | 1.6 | 1 |
| Bearings | 0.25 | 5 |
| Pushrod | 0.2 | 1 |
| Connections | 0.25 | 2 |
| U-shape, echanism | 2.95 | 1 |
| Wing assembly | 1.7 | 2 |
| Total weight | 18.7 | 15 |
| Cases 1 | Cases 2 | Cases 3 | ||||||
|---|---|---|---|---|---|---|---|---|
| 1-1 | −20°–50° | 3 | 2-1 | −35°–35° | 3 | 3-1 | −50°–20° | 3 |
| 1-2 | −20°–50° | 3.5 | 2-2 | −35°–35° | 3.5 | 3-2 | −50°–20° | 3.5 |
| 1-3 | −20°–50° | 4 | 2-3 | −35°–35° | 4 | 3-3 | −50°–20° | 4 |
| 1-4 | −20°–50° | 4.5 | 2-4 | −35°–35° | 4.5 | 3-4 | −50°–20° | 4.5 |
| 1-5 | −20°–50° | 5 | 2-5 | −35°–35° | 5 | 3-5 | −50°–20° | 5 |
| 1-6 | −20°–50° | 5.5 | 2-6 | −35°–35° | 5.5 | 3-6 | −50°–20° | 5.5 |
| 1-7 | −20°–50° | 6 | 2-7 | −35°–35° | 6 | 3-7 | −50°–20° | 6 |
| 1-8 | −20°–50° | 6.5 | 2-8 | −35°–35° | 6.5 | 3-8 | −50°–20° | 6.5 |
Disclaimer/Publisher’s Note: The statements, opinions and data contained in all publications are solely those of the individual author(s) and contributor(s) and not of MDPI and/or the editor(s). MDPI and/or the editor(s) disclaim responsibility for any injury to people or property resulting from any ideas, methods, instructions or products referred to in the content. |
© 2023 by the authors. Licensee MDPI, Basel, Switzerland. This article is an open access article distributed under the terms and conditions of the Creative Commons Attribution (CC BY) license (https://creativecommons.org/licenses/by/4.0/).
Share and Cite
Chen, S.; Wang, L.; Guo, S.; Tong, M.; He, Y.; Hu, J. Effect of Asymmetric Feathering Angle on the Aerodynamic Performance of a Flyable Bionic Flapping-Wing Rotor. Appl. Sci. 2023, 13, 3884. https://doi.org/10.3390/app13063884
Chen S, Wang L, Guo S, Tong M, He Y, Hu J. Effect of Asymmetric Feathering Angle on the Aerodynamic Performance of a Flyable Bionic Flapping-Wing Rotor. Applied Sciences. 2023; 13(6):3884. https://doi.org/10.3390/app13063884
Chicago/Turabian StyleChen, Si, Le Wang, Shijun Guo, Mingbo Tong, Yuanyuan He, and Jie Hu. 2023. "Effect of Asymmetric Feathering Angle on the Aerodynamic Performance of a Flyable Bionic Flapping-Wing Rotor" Applied Sciences 13, no. 6: 3884. https://doi.org/10.3390/app13063884