
Deep Learning-Based Radiomics for Prognostic Stratification of Low-Grade Gliomas Using a Multiple-Gene Signature

Abstract
:1. Introduction
2. Materials and Methods
2.1. Patient Cohort
2.2. Image Preprocessing and Segmentation
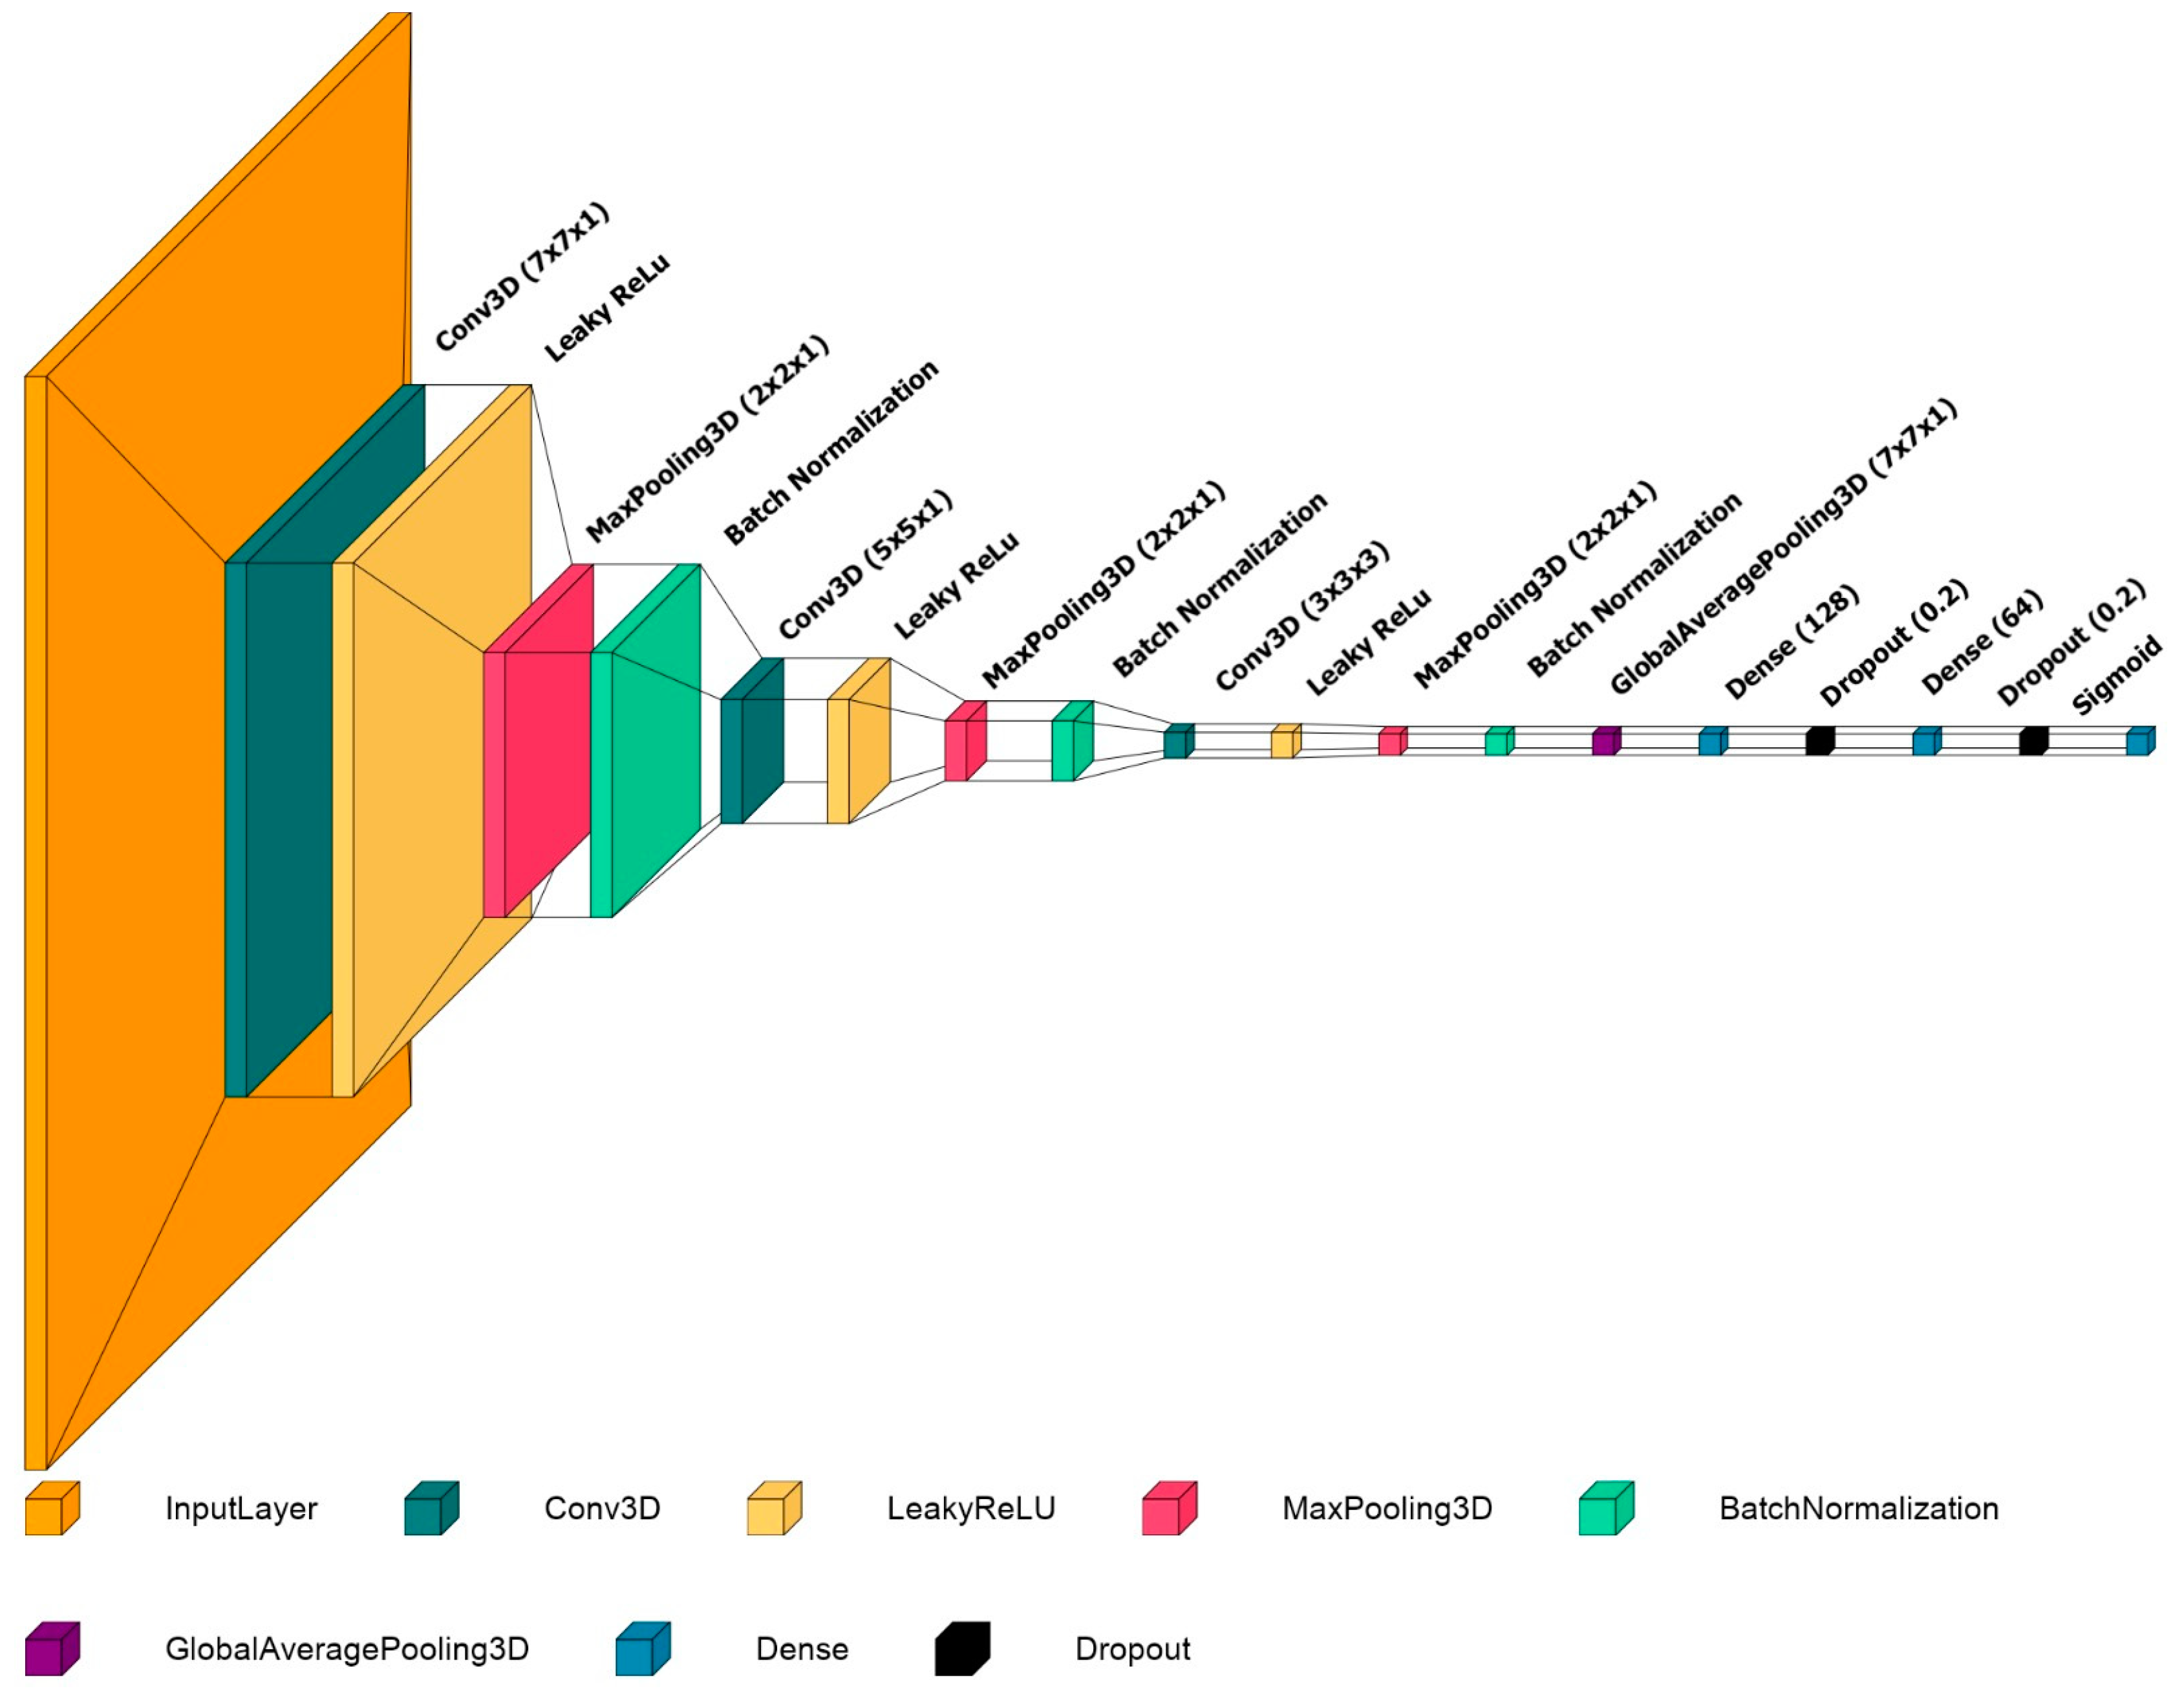
2.3. Convolutional Neural Network and Model Implementation
2.4. Model Evaluation
2.5. Statistical Analysis
2.6. Source Code
3. Results
3.1. Patient Characteristics
3.2. Model Performance
4. Discussion
5. Conclusions
Author Contributions
Funding
Institutional Review Board Statement
Informed Consent Statement
Data Availability Statement
Conflicts of Interest
References
- Brat, D.J.; Verhaak, R.G.W.; Aldape, K.D.; Yung, W.K.A.; Salama, S.R.; Cooper, L.A.D.; Rheinbay, E.; Miller, C.R.; Vitucci, M.; et al.; Cancer Genome Atlas Research Network Comprehensive, Integrative Genomic Analysis of Diffuse Lower-Grade Gliomas. N. Engl. J. Med. 2015, 372, 2481–2498. [Google Scholar] [CrossRef] [Green Version]
- Olar, A.; Sulman, E.P. Molecular Markers in Low-Grade Glioma-Toward Tumor Reclassification. Semin. Radiat. Oncol. 2015, 25, 155–163. [Google Scholar] [CrossRef] [Green Version]
- Van den Bent, M.J. Interobserver Variation of the Histopathological Diagnosis in Clinical Trials on Glioma: A Clinician’s Perspective. Acta Neuropathol. 2010, 120, 297–304. [Google Scholar] [CrossRef] [PubMed] [Green Version]
- Van den Bent, M.J.; Brandes, A.A.; Taphoorn, M.J.B.; Kros, J.M.; Kouwenhoven, M.C.M.; Delattre, J.-Y.; Bernsen, H.J.J.A.; Frenay, M.; Tijssen, C.C.; Grisold, W.; et al. Adjuvant Procarbazine, Lomustine, and Vincristine Chemotherapy in Newly Diagnosed Anaplastic Oligodendroglioma: Long-Term Follow-up of EORTC Brain Tumor Group Study 26951. J. Clin. Oncol. 2013, 31, 344–350. [Google Scholar] [CrossRef] [PubMed]
- Louis, D.N.; Perry, A.; Reifenberger, G.; Von Deimling, A.; Figarella-Branger, D.; Cavenee, W.K.; Ohgaki, H.; Wiestler, O.D.; Kleihues, P.; Ellison, D.W. The 2016 World Health Organization Classification of Tumors of the Central Nervous System: A summary. Acta Neuropathol. 2016, 131, 803–820. [Google Scholar] [CrossRef] [Green Version]
- Appin, C.L.; Brat, D.J. Molecular Genetics of Gliomas. Cancer J. 2014, 20, 66–72. [Google Scholar] [CrossRef]
- Louis, D.N.; Perry, A.; Wesseling, P.; Brat, D.J.; Cree, I.A.; Figarella-Branger, D.; Hawkins, C.; Ng, H.K.; Pfister, S.M.; Reifenberger, G.; et al. The 2021 WHO Classification of Tumors of the Central Nervous System: A summary. Neuro. Oncol. 2021, 23, 1231–1251. [Google Scholar] [CrossRef] [PubMed]
- Batsios, G.; Viswanath, P.; Subramani, E.; Najac, C.; Gillespie, A.M.; Santos, R.D.; Molloy, A.R.; Pieper, R.O.; Ronen, S.M. PI3K/MTOR Inhibition of IDH1 Mutant Glioma Leads to Reduced 2HG Production That Is Associated with Increased Survival. Sci. Rep. 2019, 9, 10521. [Google Scholar] [CrossRef] [Green Version]
- Zhang, G.-H.; Zhong, Q.-Y.; Gou, X.-X.; Fan, E.-X.; Shuai, Y.; Wu, M.-N.; Yue, G.-J. Seven Genes for the Prognostic Prediction in Patients with Glioma. Clin. Transl. Oncol. 2019, 21, 1327–1335. [Google Scholar] [CrossRef] [PubMed]
- Ren, Y.; Zhang, X.; Rui, W.; Pang, H.; Qiu, T.; Wang, J.; Xie, Q.; Jin, T.; Zhang, H.; Chen, H.; et al. Noninvasive Prediction of IDH1 Mutation and ATRX Expression Loss in Low-Grade Gliomas Using Multiparametric MR Radiomic Features. J. Magn. Reason. Imaging 2019, 49, 808–817. [Google Scholar] [CrossRef]
- Chan, A.K.-Y.; Yao, Y.; Zhang, Z.; Chung, N.Y.-F.; Liu, J.S.-M.; Li, K.K.-W.; Shi, Z.; Chan, D.T.-M.; Poon, W.S.; Zhou, L.; et al. TERT Promoter Mutations Contribute to Subset Prognostication of Lower-Grade Gliomas. Mod. Pathol. 2015, 28, 177–186. [Google Scholar] [CrossRef] [PubMed] [Green Version]
- Xiao, K.; Liu, Q.; Peng, G.; Su, J.; Qin, C.-Y.; Wang, X.-Y. Identification and Validation of a Three-Gene Signature as a Candidate Prognostic Biomarker for Lower Grade Glioma. PeerJ 2020, 8, e8312. [Google Scholar] [CrossRef] [PubMed]
- Zeng, W.-J.; Yang, Y.-L.; Liu, Z.-Z.; Wen, Z.-P.; Chen, Y.-H.; Hu, X.-L.; Cheng, Q.; Xiao, J.; Zhao, J.; Chen, X.-P. Integrative Analysis of DNA Methylation and Gene Expression Identify a Three-Gene Signature for Predicting Prognosis in Lower-Grade Gliomas. Cell. Physiol. Biochem. 2018, 47, 428–439. [Google Scholar] [CrossRef] [PubMed]
- Zhang, C.; Yu, R.; Li, Z.; Song, H.; Zang, D.; Deng, M.; Fan, Y.; Liu, Y.; Zhang, Y.; Qu, X. Comprehensive Analysis of Genes Based on Chr1p/19q Co-Deletion Reveals a Robust 4-Gene Prognostic Signature for Lower Grade Glioma. Cancer Manag. Res. 2019, 11, 4971–4984. [Google Scholar] [CrossRef] [Green Version]
- Patel, A.P.; Tirosh, I.; Trombetta, J.J.; Shalek, A.K.; Gillespie, S.M.; Wakimoto, H.; Cahill, D.P.; Nahed, B.V.; Curry, W.T.; Martuza, R.L.; et al. Single-Cell RNA-Seq Highlights Intratumoral Heterogeneity in Primary Glioblastoma. Science 2014, 344, 1396–1401. [Google Scholar] [CrossRef] [Green Version]
- Sottoriva, A.; Spiteri, I.; Piccirillo, S.G.M.; Touloumis, A.; Collins, V.P.; Marioni, J.C.; Curtis, C.; Watts, C.; Tavaré, S. Intratumor Heterogeneity in Human Glioblastoma Reflects Cancer Evolutionary Dynamics. Proc. Natl. Acad. Sci. USA 2013, 110, 4009–4014. [Google Scholar] [CrossRef] [Green Version]
- Kuo, M.D.; Jamshidi, N. Behind the Numbers: Decoding Molecular Phenotypes with Radiogenomics--Guiding Principles and Technical Considerations. Radiology 2014, 270, 320–325. [Google Scholar] [CrossRef]
- Mazurowski, M.A. Radiogenomics: What It Is and Why It Is Important. J. Am. Coll. Radiol. 2015, 12, 862–866. [Google Scholar] [CrossRef]
- Gillies, R.J.; Kinahan, P.E.; Hricak, H. Radiomics: Images Are More than Pictures, They Are Data. Radiology 2016, 278, 563–577. [Google Scholar] [CrossRef] [Green Version]
- Van Timmeren, J.E.; Cester, D.; Tanadini-Lang, S.; Alkadhi, H.; Baessler, B. Radiomics in Medical Imaging—“How-to” Guide and Critical Reflection. Insights. Imaging. 2020, 11, 91. [Google Scholar] [CrossRef]
- Jian, A.; Jang, K.; Manuguerra, M.; Liu, S.; Magnussen, J.; Di Ieva, A. Machine Learning for the Prediction of Molecular Markers in Glioma on Magnetic Resonance Imaging: A Systematic Review and Meta-Analysis. Neurosurgery 2021, 89, 31–44. [Google Scholar] [CrossRef] [PubMed]
- LeCun, Y.; Bengio, Y.; Hinton, G. Deep Learning. Nature 2015, 521, 436–444. [Google Scholar] [CrossRef] [PubMed]
- Charron, O.; Lallement, A.; Jarnet, D.; Noblet, V.; Clavier, J.-B.; Meyer, P. Automatic Detection and Segmentation of Brain Metastases on Multimodal MR Images with a Deep Convolutional Neural Network. Comput. Biol. Med. 2018, 95, 43–54. [Google Scholar] [CrossRef] [PubMed]
- Rudie, J.D.; Weiss, D.A.; Saluja, R.; Rauschecker, A.M.; Wang, J.; Sugrue, L.; Bakas, S.; Colby, J.B. Multi-Disease Segmentation of Gliomas and White Matter Hyperintensities in the BraTS Data Using a 3D Convolutional Neural Network. Front Comput. Neurosci. 2019, 13, 84. [Google Scholar] [CrossRef] [PubMed] [Green Version]
- Buda, M.; AlBadawy, E.A.; Saha, A.; Mazurowski, M.A. Deep Radiogenomics of Lower-Grade Gliomas: Convolutional Neural Networks Predict Tumor Genomic Subtypes Using MR Images. Radiol. Artif. Intell. 2020, 2, e180050. [Google Scholar] [CrossRef]
- Cluceru, J.; Interian, Y.; Phillips, J.J.; Molinaro, A.M.; Luks, T.L.; Alcaide-Leon, P.; Olson, M.P.; Nair, D.; LaFontaine, M.; Shai, A.; et al. Improving the Noninvasive Classification of Glioma Genetic Subtype with Deep Learning and Diffusion-Weighted Imaging. Neuro. Oncol. 2021, 24, noab238. [Google Scholar] [CrossRef]
- Fu, J.; Singhrao, K.; Zhong, X.; Gao, Y.; Qi, S.X.; Yang, Y.; Ruan, D.; Lewis, J.H. An Automatic Deep Learning-Based Workflow for Glioblastoma Survival Prediction Using Preoperative Multimodal MR Images: A Feasibility Study. Adv. Radiat. Oncol. 2021, 6, 100746. [Google Scholar] [CrossRef]
- Han, W.; Qin, L.; Bay, C.; Chen, X.; Yu, K.-H.; Miskin, N.; Li, A.; Xu, X.; Young, G. Deep Transfer Learning and Radiomics Feature Prediction of Survival of Patients with High-Grade Gliomas. AJNR Am. J. Neuroradiol. 2020, 41, 40–48. [Google Scholar] [CrossRef] [Green Version]
- Pedano, N.; Flanders, A.E.; Scarpace, L.; Mikkelsen, T.; Eschbacher, J.M.; Hermes, B.; Sisneros, V.; Barnholtz-Sloan, J.; Ostrom, Q. The Cancer Genome Atlas Low Grade Glioma Collection (TCGA-LGG) (Version 3) [Data set]. Cancer Imaging Archive 2016. [Google Scholar] [CrossRef]
- Clark, K.; Vendt, B.; Smith, K.; Freymann, J.; Kirby, J.; Koppel, P.; Moore, S.; Phillips, S.; Maffitt, D.; Pringle, M.; et al. The Cancer Imaging Archive (TCIA): Maintaining and Operating a Public Information Repository. J. Digit. Imaging. 2013, 26, 1045–1057. [Google Scholar] [CrossRef] [Green Version]
- Li, X.; Morgan, P.S.; Ashburner, J.; Smith, J.; Rorden, C. The First Step for Neuroimaging Data Analysis: DICOM to NIfTI Conversion. J. Neurosci. Methods 2016, 264, 47–56. [Google Scholar] [CrossRef]
- Tustison, N.J.; Avants, B.B.; Cook, P.A.; Zheng, Y.; Egan, A.; Yushkevich, P.A.; Gee, J.C. N4ITK: Improved N3 Bias Correction. IEEE Trans. Med. Imaging. 2010, 29, 1310–1320. [Google Scholar] [CrossRef] [Green Version]
- Smith, S.M. Fast Robust Automated Brain Extraction. Hum. Brain Mapp. 2002, 17, 143–155. [Google Scholar] [CrossRef]
- Jenkinson, M.; Bannister, P.; Brady, M.; Smith, S. Improved Optimization for the Robust and Accurate Linear Registration and Motion Correction of Brain Images. NeuroImage 2002, 17, 825–841. [Google Scholar] [CrossRef]
- Shinohara, R.T.; Sweeney, E.M.; Goldsmith, J.; Shiee, N.; Mateen, F.J.; Calabresi, P.A.; Jarso, S.; Pham, D.L.; Reich, D.S.; Crainiceanu, C.M. Statistical Normalization Techniques for Magnetic Resonance Imaging. NeuroImage Clinical. 2014, 6, 9–19. [Google Scholar] [CrossRef] [Green Version]
- Zhou, H.; Vallières, M.; Bai, H.X.; Su, C.; Tang, H.; Oldridge, D.; Zhang, Z.; Xiao, B.; Liao, W.; Tao, Y.; et al. MRI Features Predict Survival and Molecular Markers in Diffuse Lower-Grade Gliomas. Neuro. Oncol. 2017, 19, 862–870. [Google Scholar] [CrossRef] [PubMed]
- Ioffe, S.; Szegedy, C. Batch Normalization: Accelerating Deep Network Training by Reducing Internal Covariate Shift. arXiv 2015, arXiv:1502.03167. [Google Scholar]
- Lin, M.; Chen, Q.; Yan, S. Network In Network. arXiv 2013, arXiv:1312.4400. [Google Scholar] [CrossRef]
- Kingma, D.P.; Ba, J. Adam: A Method for Stochastic Optimization. arXiv 2014, arXiv:1412.6980. [Google Scholar] [CrossRef]
- R Core Team. R: A Language and Environment for Statistical Computing; R Foundation for Statistical Computing: Vienna, Austria, 2018. [Google Scholar]
- RStudio Team RStudio. Integrated Development for R. RStudio, PBC, Boston, MA; PBC: Boston, MA, USA, 2020. [Google Scholar]
- Zhang, Q.; Liu, W.; Luo, S.-B.; Xie, F.-C.; Liu, X.-J.; Xu, R.-A.; Chen, L.; Su, Z. Development of a Prognostic Five-Gene Signature for Diffuse Lower-Grade Glioma Patients. Front. Neurol. 2021, 12, 633390. [Google Scholar] [CrossRef]
- Liu, W.; Zou, J.; Ren, R.; Liu, J.; Zhang, G.; Wang, M. A Novel 10-Gene Signature Predicts Poor Prognosis in Low Grade Glioma. Technol. Cancer Res. Treat. 2021, 20, 153303382199208. [Google Scholar] [CrossRef] [PubMed]
- Zhang, M.; Wang, X.; Chen, X.; Zhang, Q.; Hong, J. Novel Immune-Related Gene Signature for Risk Stratification and Prognosis of Survival in Lower-Grade Glioma. Front. Genet. 2020, 11, 363. [Google Scholar] [CrossRef] [Green Version]
- Manikis, G.C.; Ioannidis, G.S.; Siakallis, L.; Nikiforaki, K.; Iv, M.; Vozlic, D.; Surlan-Popovic, K.; Wintermark, M.; Bisdas, S.; Marias, K. Multicenter DSC–MRI-Based Radiomics Predict IDH Mutation in Gliomas. Cancers 2021, 13, 3965. [Google Scholar] [CrossRef] [PubMed]
- Kickingereder, P.; Sahm, F.; Radbruch, A.; Wick, W.; Heiland, S.; von Deimling, A.; Bendszus, M.; Wiestler, B. IDH Mutation Status Is Associated with a Distinct Hypoxia/Angiogenesis Transcriptome Signature Which Is Non-Invasively Predictable with RCBV Imaging in Human Glioma. Sci. Rep. 2015, 5, 16238. [Google Scholar] [CrossRef] [PubMed] [Green Version]


| Variables | Training Set (n = 61) | Test Set (n = 20) | p Value | High Risk (n = 54) | Low Risk (n = 27) | p Value |
|---|---|---|---|---|---|---|
| Age at diagnosis | 45.2 (14.4) | 47.6 (11.6) | 0.454 | 44.6 (13.1) | 48.2 (14.8) | 0.291 |
| Gender | 0.649 | 1.000 | ||||
| Male | 31 (50.8%) | 12 (60%) | 29 (53.7%) | 14 (51.9%) | ||
| Female | 30 (49.2%) | 8 (40%) | 25 (47.3%) | 13 (48.1%) | ||
| Histologic Diagnosis | 0.789 | 0.000 | ||||
| Astrocytoma | 18 (29.5%) | 6 (30%) | 8 (14.8%) | 16 (59.3%) | ||
| Oligoastrocytoma | 17 (27.9%) | 7 (35%) | 17 (31.5%) | 7 (25.9%) | ||
| Oligodendroglioma | 26 (42.6%) | 7 (35%) | 29 (53.8%) | 4 (14.8%) | ||
| Grade | 0.854 | 0.002 | ||||
| II | 24 (39.3%) | 9 (45%) | 29 (53.7%) | 4 (14.8%) | ||
| III | 37 (60.7%) | 11 (55%) | 25 (47.3%) | 23 (85.2%) | ||
| Risk Status | 1.000 | |||||
| High | 41 (67.2%) | 13 (65%) | - | - | ||
| Low | 20 (32.8%) | 7 (35%) | - | - | ||
| Gene expression | ||||||
| WEE1 | 7.8 (1.3) | 7.9 (1) | 0.5254 | 7.3 (0.9) | 9.0 (1) | 0.000 |
| CRTAC1 | 9.9 (9.3–10.7) | 9.7 (8.7–10.4) | 0.7425 | 10.3 (9.5–10.9) | 8.4 (7.5–9.4) | 0.000 |
| SEMA4G | 8.3 (8–8.7) | 8.2 (8–8.5) | 0.7633 | 8.5 (8.2–8.7) | 7.8 (7.0–8.2) | 0.000 |
| Training Set | Test Set | |||||||||
|---|---|---|---|---|---|---|---|---|---|---|
| Accuracy | AUC | Sensitivity | Specificity | Precision | Accuracy | AUC | Sensitivity | Specificity | Precision | |
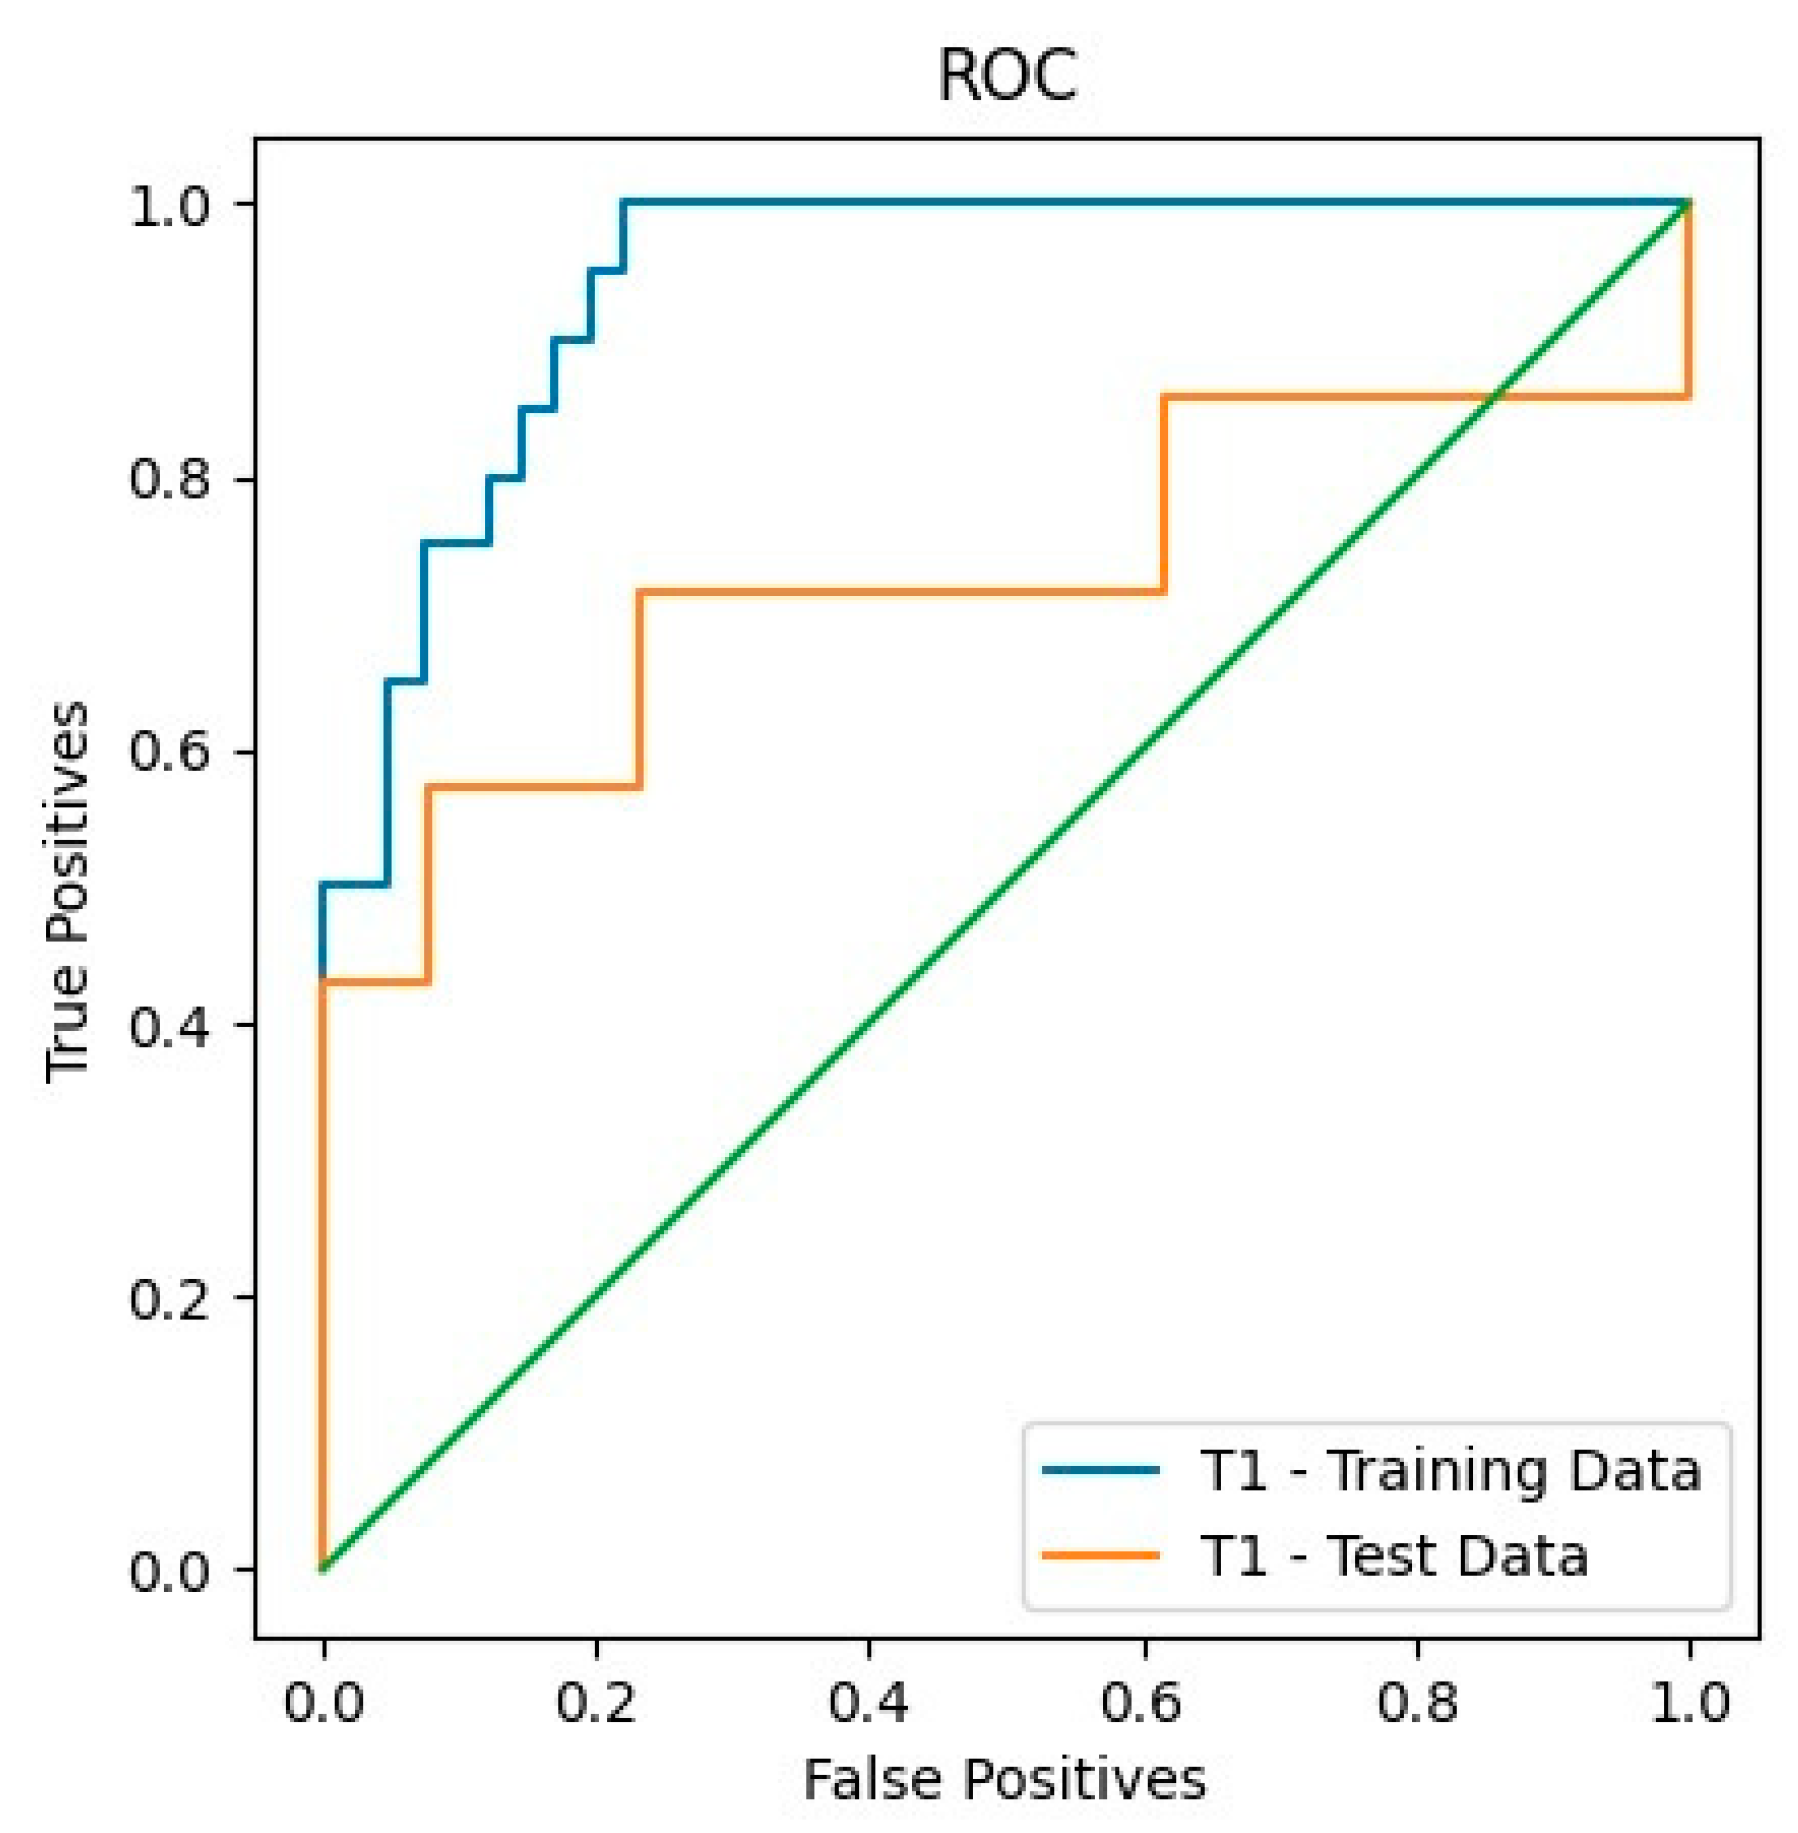
| T1 | 0.85 | 0.94 | 0.65 | 0.95 | 0.86 | 0.8 | 0.73 | 0.57 | 0.92 | 0.8 |
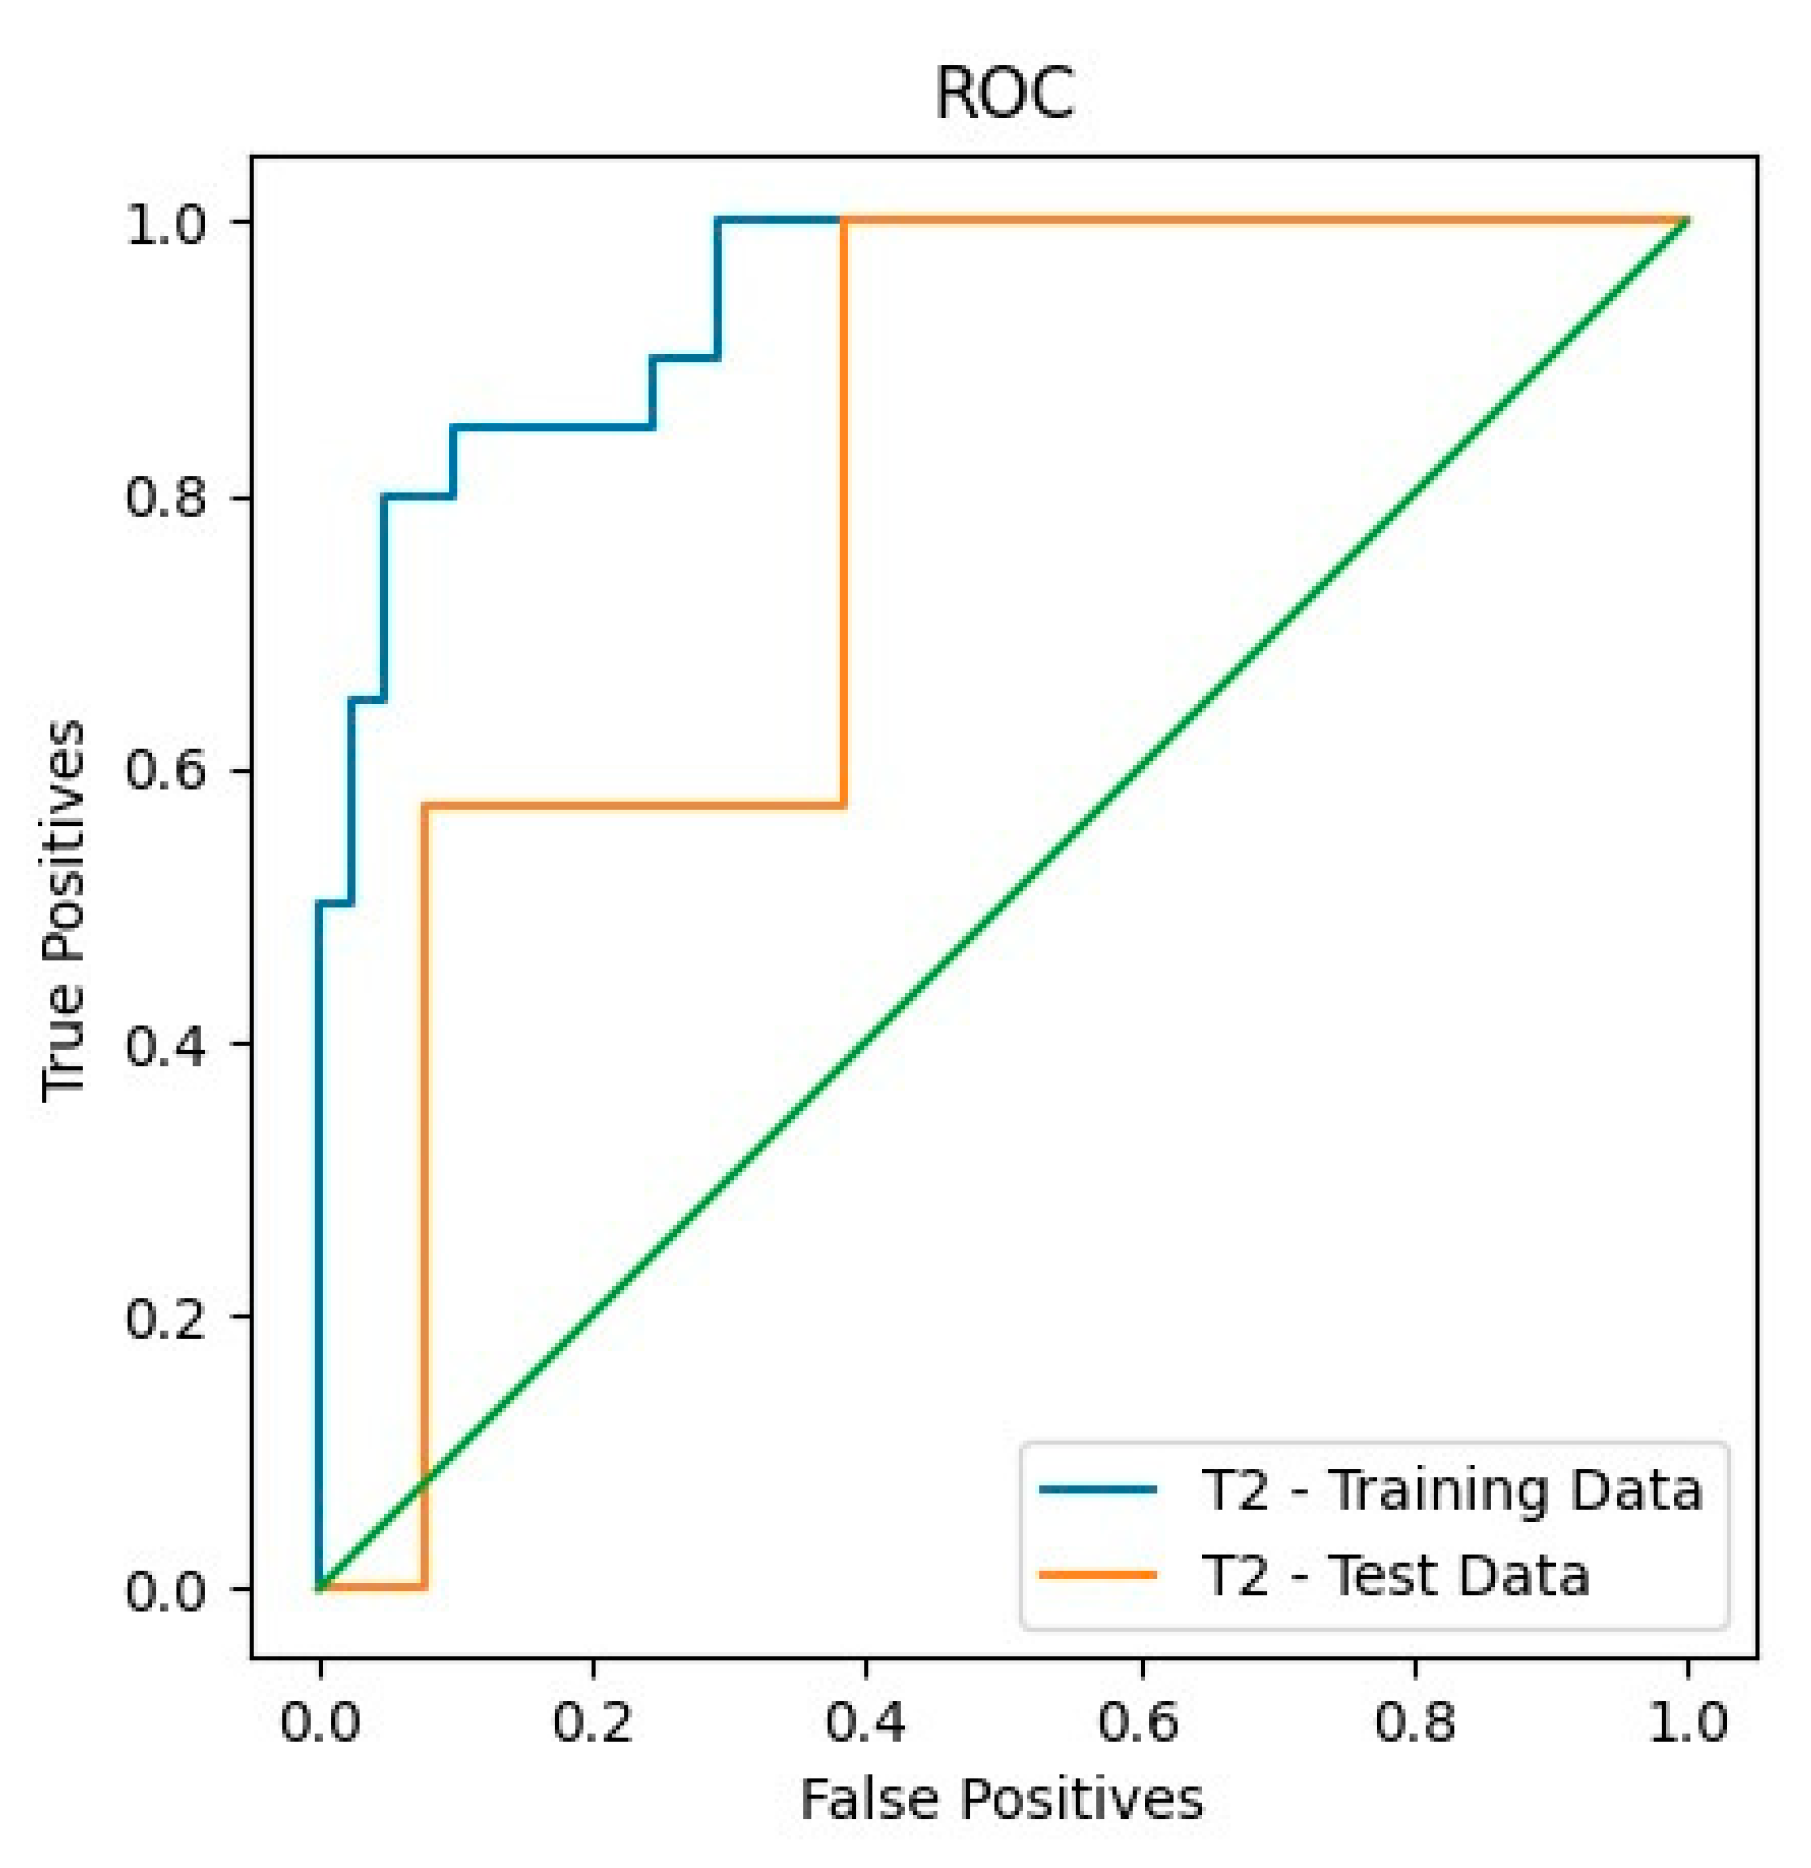
| T2 | 0.79 | 0.94 | 1 | 0.73 | 0.68 | 0.75 | 0.79 | 1 | 0.62 | 0.58 |
Disclaimer/Publisher’s Note: The statements, opinions and data contained in all publications are solely those of the individual author(s) and contributor(s) and not of MDPI and/or the editor(s). MDPI and/or the editor(s) disclaim responsibility for any injury to people or property resulting from any ideas, methods, instructions or products referred to in the content. |
© 2023 by the authors. Licensee MDPI, Basel, Switzerland. This article is an open access article distributed under the terms and conditions of the Creative Commons Attribution (CC BY) license (https://creativecommons.org/licenses/by/4.0/).
Share and Cite
Karabacak, M.; Ozkara, B.B.; Senparlak, K.; Bisdas, S. Deep Learning-Based Radiomics for Prognostic Stratification of Low-Grade Gliomas Using a Multiple-Gene Signature. Appl. Sci. 2023, 13, 3873. https://doi.org/10.3390/app13063873
Karabacak M, Ozkara BB, Senparlak K, Bisdas S. Deep Learning-Based Radiomics for Prognostic Stratification of Low-Grade Gliomas Using a Multiple-Gene Signature. Applied Sciences. 2023; 13(6):3873. https://doi.org/10.3390/app13063873
Chicago/Turabian StyleKarabacak, Mert, Burak B. Ozkara, Kaan Senparlak, and Sotirios Bisdas. 2023. "Deep Learning-Based Radiomics for Prognostic Stratification of Low-Grade Gliomas Using a Multiple-Gene Signature" Applied Sciences 13, no. 6: 3873. https://doi.org/10.3390/app13063873