Article

Sand Rubber Mixtures under Oedometric Loading: Sand-like vs. Rubber-like Behavior

1
Université Gustave Eiffel, MAST, GPEM, F-44344 Bouguenais, France
2
Department of Civil Engineering, University of Bristol, Bristol BS8 1TR, UK
*
Author to whom correspondence should be addressed.
Appl. Sci. 2023, 13(6), 3867; https://doi.org/10.3390/app13063867
Submission received: 24 February 2023 / Revised: 14 March 2023 / Accepted: 15 March 2023 / Published: 17 March 2023
(This article belongs to the Special Issue Mechanical Properties and Engineering Applications of Special Soils)

Abstract

:
Each year, the number of scrap tires disposed of in huge piles across the world continuously increases. Consequently, new recycling solutions for these materials have to be proposed. Among them, one possibility consists of shredding tires and mixing the obtained tire chips with sand, which can be used as alternative soils in various geotechnical applications, such as backfilling for retaining structures, slope and highway embankment stabilization, road constructions, soil erosion prevention, and seismic isolation of foundations. Such types of mixtures are highly heterogeneous due to the important difference in elasticity and deformability between the two constituents, which leads to complex mechanical behavior. In this article, the one-dimensional loading/unloading behavior of sand-rubber mixtures is investigated by laboratory strain-controlled experiments performed for different packing densities, particle sizes, rubber contents, and sand/rubber size ratios. After a global analysis of the increase of the packing deformation with the rubber fraction and the stress level, a novel criterion to classify the behavior of the mixture as sand-like or rubber-like was proposed, based on the concavity of the void ratio—log of vertical stress curve. The concavity increased with the stress level and the rubber fraction, up to the limits where the saturation of the voids due to their filling with rubber induces a rubber-like behavior. A simplified phase diagram, limited to the range of this study, is proposed. The one-dimensional confined stiffness and the swelling behavior were also analyzed.

1. Introduction

Multistate and multiphase particulate materials may provide a high degree of flexibility in both the design and performance of engineering structures, including the potential for project cost efficiency. This is certainly true for civil engineering materials made from combinations of rigid, liquid, and soft deformable constituents. Soft rubber particles, resulting mainly from recycled waste tires, are used as a partial replacement for granular soils in a large variety of geotechnical applications, such as backfill of retaining walls [1], highway embankments [2,3,4], subgrade road construction [5,6], ground erosion control, and stabilization of slopes [7,8], as well as seismic foundation isolation [9,10,11,12]. While the reduced weight and improved damping properties of sand–rubber mixtures, resulting from the addition of rubber particles, provide a reduction of lateral earth pressures on the retaining walls [1,13] and increased capacity against seismic actions and soil liquefaction occurrence [14,15,16], the use of rubber as a secondary raw material complements the recovery rate of the scrap tires and reduces the pressure on the landfill disposal solutions.
The engineering properties of sand–rubber composite mixtures have been extensively studied over the past two–three decades in both laboratories and in situ setups, although the latter to a lesser extent. Segregation in the sand–rubber mixtures have been characterized in [17]. In the case of classical laboratory experiments, most of the research has mainly focused on the characterization of the compressibility either in one-dimension or in isotropic loading conditions [18,19,20,21,22,23], and the monotonic strain-stress-strength behavior of various combinations of soils, rubber types, and particle size dimensions [24,25,26,27,28,29]. Exploration of the small strain stiffness of sand–rubber composites has also been conducted [19,30,31,32,33,34]. The applicability of the critical state framework to sand–rubber mixtures has been reported in [35,36]. A simple model for predicting the isotropic compression behavior based on soft–rigid interactions at the particle scale has been developed in [37]. Particle-scale mechanisms that underlie the energy dissipation were observed in the sand–rubber mixtures under oedometer testing and have been previously reported [38]. An excellent summary of a range of experimental studies, including the physical characteristics of the mixture materials used as well as the testing conditions and main conclusions, can be found in [35,36]. While, as equally emphasized by the same authors, comparison between different studies remains challenging, the examination of published results shows that the response of the sand–rubber composite mixtures is mainly controlled by the volume fraction of the components and the characteristic geometrical contrasts of the rigid/soft particles through either the aspect ratio (length over width) of fiber-type rubber inclusions, which encourages additional fiber-soil type internal interaction mechanisms [22,26,39,40] or the rubber to sand particle size ratio, as shown by [19,30,41].
Based on a given set of these variables, the behavior of sand–rubber mixtures can vary from sand-like to rubber-like with a transitional state confinement stress-dependent. Large triaxial tests on sand–rubber mixtures and the behavior of mixtures as sand-like (for rubber contents < 34%) and rubber-like (rubber contents > 34%) have been reported in [42]. Further, Mashiri et al. [43] proposed three different behavioral zones, viz. sand-like (rubber contents < 18%), rubber-like (rubber contents > 35%), and sand-rubber-like (18% < rubber contents < 35%). Lee et al. [19] also investigated the small strain and large strain response of sand-rubber mixtures and reported rubber-like (for rubber contents > 60%) and sand-like behaviors (for rubber contents < 30%), whereas for rubber content equal to 40%, it was rubber-like (for low stress) and sand-like (for high stress). While the characterization of these behavioral zones is fundamental for the use of such composites in practical applications and the design of geotechnical systems, their identification is based on qualitative observations of the sand–rubber mixture response.
This article presents the results of strain-controlled one-dimensional loading/unloading experiments performed on sand–rubber mixtures. The influence of different packing densities, particle sizes, rubber contents, and sand/rubber size ratios was evaluated. The one-dimensional confined stiffness and the swelling behavior were more particularly studied. Based on these results, a novel criterion to classify the behavior of the mixture as sand-like or rubber-like is proposed and used to study how this behavior varies with the stress level and the rubber content, in the ranges used within these experiments.

2. Materials and Methods

2.1. Materials, Sample Fabrication, and Experimental Setup

The oedometer tests on the sand and sand–rubber mixtures were conducted on cylindrical, rigidly laterally confined samples of 74 mm diameter and 40 mm height. While Leighton Buzzard fraction A sand [44] and rubber particles obtained from the shredding of used lorry tires [17,37,45] were used as base materials, the sand–rubber mixtures contained specific sand and rubber fraction dimensions. Pretest sample preparation procedures, therefore, included sieving both sand and rubber particles and particle size separation into the following grading sizes: 0.6–0.8 mm ( D 50 = 0.7 mm), 1.25–1.6 mm ( D 50 = 1.4 mm), 1.6–2.0 mm ( D 50 = 1.8 mm), and 2.0–2.24 mm ( D 50 = 2.1 mm) for LB sand, and 1.25–1.6 mm ( D 50 = 1.4 mm) and 1.6–2.0 mm ( D 50 = 1.8 mm) for the rubber, where D 50 represents the mean grain size of the selected fraction.
All the samples were fabricated in two layers, which were 20 mm each in height, and followed the moist tamping procedure [45,46,47] (see Figure 1a). The required quantities of dry sand or sand and rubber for each sample layer were, first, manually mixed in a container together with 10% water (by dry weight of solids). Then, the mixture was gently placed in the rigid oedometer cylinder using a spoon and compacted by a rigid steel cylindrical tamper, which had a diameter half that of the sample’s diameter [48], until the required target sample void ratio was achieved. Following the completion of fabrication, the sample was placed on the testing configuration and saturated by flushing water through the porous stone cylinder base. Once the saturation was completed, a relatively light steel cylinder top cap was placed, the sample settlement was recorded, and the fabrication void ratio was updated.
The one-dimensional testing was conducted using a displacement-controlled electromechanical loading frame (refer to Figure 1b). The lower platen supporting the sample moves upwards with a constant speed set for all tests at 0.5 mm/min, while the sample top cap remains fixed and in contact with the loading ram, incorporating a linear variable differential transformer (LVDT) for vertical displacement measurements, and a 10 kN-load cell (with a linear response throughout the whole measurement range). The one-dimensional compression was stopped once the force approached the load cell limit capacity (corresponding to approximately 2.3 MPa of vertical stress) and the sample was, then, fully unloaded by reversing the lower platen movement at a similar speed. However, at the unloading point, the sample experienced some relaxation due to the backlash in the electromechanical loading system.

2.2. Experimental Program

Several rubber fractions (xr) were chosen for the tested sand–rubber mixtures: 0%, 10%, 20%, 25%, 30%, 40%, and 50%. The rubber fraction, xr, is defined as the ratio between the volume of rubber and the total volume of solids (rubber and sand). In the calculation of the rubber fraction, a solid density of 2.65 g/cm3 of sand and a solid density of 1.04 g/cm3 of rubber were used.
Packings with two target fabrication void ratios, 0.65 and 0.75, were produced with equal-sized rubber and sand particles with a mean grain size, D 50 , of 1.8 mm. Samples with a void ratio of 0.65 and made of equal-sized sand and rubber particles with a mean size D 50 of 1.4 mm were also tested. For two particular rubber fractions, i.e., 10% and 50%, tests were also performed on sand–rubber mixtures at a void ratio of 0.65 by choosing sand/rubber mean particle size ratios of 0.5 and 1.5. The rubber size used for these tests was a D 50 of 1.4 mm, while the size of the sand was either a D 50 of 0.7 mm or 2.1 mm.
It is to be noted that the maximum and minimum void ratios of the Leighton Buzzard fraction A sand were 0.83 and 0.55, respectively. These limits are of course different for the present packings, with close grading sizes and significant rubber content. However, no attempt was made to determine these void ratio limits.
Table 1 presents the characteristics of tested samples and the material constituents. The void ratio, eo, in Table 1 represents the void ratio at the beginning of the one-dimensional compression test. For a given sand–rubber mixture type, some deviation from the target value of the void ratio was recorded and while the gap increased with the rubber content, its extent is regarded as very limited. In the name of the tests, capital letters ‘S/R’ opposite to small caps letters ‘s/r’ designate samples with a higher sand and rubber particle size, 1.8 mm as opposed to 1.4 mm, while D or L refers to a dense sample condition (0.65 void ratio) or a loose sample condition (0.75 void ratio), respectively. The use of sR-D-10 refers to a dense sample (0.65 void ratio) with 10% rubber content and sand (s) particles smaller than the rubber (R) particles. Similarly, Sr-D-50 refers to a dense sample (0.65 void ratio) with 50% rubber content, yet with sand (S) particles larger than the rubber (r) particles.

3. Results and Discussion

3.1. General One-Dimensional Response

The vertical strain, ε v , and stress, σ v , during an oedometer test are represented in Figure 2 by a conventional semi-logarithmic scale for the different rubber fractions at the two initial densities, SR-D and SR-L tests. As expected, the magnitude of the packing deformation increases with the rubber fraction, while for a given rubber fraction, the deformation of the dense packing is smaller than that of the loose packing.
The evolutions of the maximum vertical strain ε m a x , obtained at the maximum applied vertical stress, σ m a x , of 2.3 MPa, and unrecovered vertical strain,  ε o , after complete unloading with the rubber fraction, xr, for SR-D, SR-L, and sr-D series tests, and Sr-D-10, Sr-D-50, sR-D-10, and sR-D-50 tests are given in Figure 3. As can be observed, independent of the rubber content, the effect of the particle size for the SR-D and sr-D tests in the measured maximum or unrecovered strain appears negligible (the non-null difference is smaller than 5% of the reference strain). The standard deviations of the strain range differences for the maximum and unrecovered vertical strain at each rubber fraction for these two series are around 0.7% and 0.4%, respectively. For both strain limits, the looser packing of SR-L tests induced, on average, 0.9% more vertical strain compared with the denser SR-D and sr-D samples.
Figure 3 also plots the corresponding values of the strain limits for tests on samples made by non-equal sand and rubber particle sizes. For the 10% rubber fractions, while the volume of sand is nine times bigger than the volume of rubber, the behavior is dominated by the sand phase and very close to the SR or sr cases. When xr = 50%, the volume of sand equals the volume of rubber, yet the number of sand particles is about eight times larger than the number of rubber particles when the sand/rubber mean size ratio is 0.5 (sR-D tests), while the number of rubber particles is three times bigger than the sand particles when the sand/rubber mean size ratio is 1.5 (Sr-D tests). As a consequence, the response is more compressible for the latter Sr-D case and less compressible for the former sR-D case, when compared with equal sand and rubber particle sizes tests. A similar observation for the effect of the smaller-sized rubber particles on the one-dimensional compression was also witnessed by [40]. The unrecovered strains follow the same trends, with lower and higher strains for sR and Sr cases.
The loading behavior in one-dimensional testing is generally represented by the evolution of the current void ratio, e , with the vertical stress in the log scale (log  σ v ). The current void ratio is related to the vertical strain, ε v , by the equation:
e = e 0 ε v ( 1 + e 0 )
where e 0 is the initial sample void ratio.
The one-dimensional loading behavior of the pure sand is mostly linear in the e—(log  σ v ) plane, slightly concave for large normal stresses (i.e., negative second derivative, see Figure 2). When rubber is added to the mixture, the stiffness progressively decreases, and the concavity becomes more pronounced as the behavior asymptotically converges to a normal compression line [22]. However, for high rubber fractions and at high vertical stresses (generally larger than 1000 kPa), one can observe a change of curvature in the void ratio—vertical stress semi-logarithmic plane—which becomes slightly convex, see for instance [22,38,41]. This is the effect of the saturation of the voids filled by the rubber grains and, thus, a clear sign of the influence of the rubber grains on the macroscopic behavior of the system. We, firstly, propose here to estimate the mean curvature of the e—(log  σ v ) curve between 1 and 2 MPa vertical stress. This property leads to a method that can be used to determine the behavior or the mixture: “sand-like” if the concavity increases with the rubber content and “rubber-like” if an increase in the rubber content induces decreasing concavity (suggesting, as mentioned above, that the pores are being saturated progressively).
Then, the sign of the following curvature evolution with the rubber fraction:
C ˜ ( σ v , x r ) = x r 2 e ( σ v , x r ) ( l o g σ v ) 2 = 3 e ( σ v , x r ) x r ( l o g σ v ) 2
indicates whether the mixture is sand (negative C ˜ ) or rubber type (positive C ˜ ) at the corresponding stress level. In the following, for practical reasons, the sign is determined by the mean of the curvature over a given vertical stress interval.
Figure 4 shows the evolution of the mean curvature between 1 and 2 MPa of vertical stress with the rubber fraction for the two densities of the mixture and for the two particle sizes. It can be observed that the concavity of the e—(log  σ v ) curve increased with the rubber fraction, up to about 25–30% of rubber, and then decreased. The transition point between sand and rubber-type behaviors seems fairly similar for the two densities and the two particle sizes.
Figure 5 presents the evolution of the mean curvature for five vertical stress intervals. For one rubber content, one point in the figure represents the mean curvature value for the SR-L, SR-D, and sr-D tests. This averaging is justified by the weak dependence of this curvature on the mixture type (see Figure 3). For vertical stresses higher than 600 kPa, the transition point seems to be fairly independent of the stress level. On the contrary, at vertical stresses lower than 600 kPa, the one-dimensional response of the mixture seems to be a sand-like type in all the tested ranges of rubber fractions. It is also interesting to observe that the curvature of the e—(log σ v ) curve became convex for a rubber fraction of 50%, a phenomenon that clearly reflects a behavior closer to pure rubber packing.
The overall information is schematically presented in the phase diagram (see Figure 6). The rubber-like behavior was observed for vertical stress levels higher than around 600 kPa and a rubber fraction higher than around 25%. In all other situations, up to a rubber fraction of 50%, the behavior (the sign of C ˜ ) reflected a sand-type mixture.

3.2. One-Dimensional Confined Stiffness

The one-dimensional compression of the sand–rubber mixtures is non-linear and irreversible. The incremental confined stiffness, M, is given by the following relation:
M = δ σ v / δ ε v
where δ σ v is the increment of vertical effective stress and δ ε v is the increment of vertical strain, which is, therefore, not constant during the one-dimensional loading. A power law has been suggested to describe the link between the one-dimensional incremental confined stiffness, M, and the vertical effective stress, σ v , [49]:
M = m σ r e f ( σ v σ r e f ) α
where σ r e f is a reference pressure, introduced for dimensional consistency, taken as 100 kPa, and m and α are material parametersf. The exponent α controls the way in which the incremental stiffness changes with the level of vertical stress. The m, material parameter, (known also as modulus number) is the magnitude of the confined stiffness at the reference pressure.
Thus, the confined stiffness was analyzed for vertical stresses ranging from 100 kPa to 500 kPa. This choice was made to avoid the influence of particle crushing, which may occur at higher levels of compression stresses [50]. Post-test particle size analysis showed considerable sand grain crushing.
The parameters m and α can be easily obtained by plotting M/ σ r e f versus the σ v / σ r e f ratio. Figure 7 reports the corresponding curves for the equally sized sand–rubber particles, SR-D and SR-L test series. The parameter α seems to be independent of the rubber fraction and slightly influenced by the initial void ratio, with averages of 0.69 for SR-D and 0.71 for SR-L. However, the observed difference of α -values between the two packing densities is not statistically relevant given the standard errors, 0.012 and 0.022 respectively. The sr-D test series having smaller particles (D50 = 1.4 mm) showed identical trends and similar α values. In all, the observed values of the power index α are close to the results of [30].
The values of the modulus number, m, with the rubber content for all SR-L, SR-D, and sr-D test series are presented in Figure 8. A power law decrease of the modulus number, m, with the rubber fraction is observed for both densities. The ratio between the m-values for loose and dense packings is relatively constant, around 75% (standard deviation of 7%), in the ranges of all rubber fractions.
The influence of the particle size ratio on α and m parameters is analyzed in Figure 9. It can be observed that α is not significantly affected by the particle size ratio. The slopes of the one-dimensional confined stiffness versus vertical stress for both sR-D and Sr-D tests are because of the SR-D for both the 10% and 50% rubber contents. However, the influence of the sand–rubber particle size ratio on the modulus number is non-negligible, when the rubber particles are bigger than the sand particles (sR-D-10 and sR-D-50 tests). At these rubber contents, the sR-D tests were also shown to be less compressible than all the other test series, which indicates that stronger sand-to-sand contact networks are dominating in these particular test mixtures. In [40], it was also observed that for mixtures with coarser rubber particles than sand, the behavior of the packings was stiffer, while for the rubber/sand size ratios smaller or equal to unity, the constrained modulus was only slightly increased.

3.3. Swelling Behavior

Typical one-dimensional loading-unloading responses for sand and sand-rubber mixtures are shown in Figure 2. A clear change from the almost rigid unloading for the pure sands to a much more recoverable strain response, rubber content dependent, is observed. The swelling curves for the sand–rubber mixtures have a distinct S-shape, which was also observed in [19,22,30,35,41]. While the effects of adding rubber could be assessed through the swelling index, Cs, the slope of the straight swelling line in void ratio—log ( σ v ) plane, given the high non-linearity of the swelling curves, the swelling index is expressed in an incremental form:
C s = δ e δ ( l o g σ v ) = ( 1 + e o ) δ ε v δ ( l o g σ v )
The evolution of the incremental swelling index with the vertical stress for the tests presented in Figure 2 is presented in Figure 10. With the exception of pure sand and the sand–rubber mixture with the lowest rubber content of 10%, all the curves reflect the S-shape variation of the swelling curve, with low Cs values at the unloading and the end of test stages, and a steady increase and decrease following the peak value. The value of the peak and the rate of the increase/decrease of the swelling index is highly dependent on the rubber content. The vertical stress value corresponding to the peak swelling index also appears to decrease with the reduction of the rubber content from 100 kPa to 30 kPa.

4. Conclusions

The mechanical response of the sand–rubber mixtures under one-dimensional loading was studied in this work. Different parameters, such as the initial void ratio, rubber fraction, and sand/rubber size ratio were varied in order to quantify their effect on the mechanical behavior of the mixtures. The different results obtained are presented, briefly, in the following:
  • The magnitude of the packing deformation increased as the rubber fraction increased. Further, for a given rubber fraction, the mixture with larger sand particles (Sr-D) was more compressible, while the mixture with smaller sand particles (sR-D) was less compressible than the mixture with equal-sized rubber and sand particles. This trend is in accordance with previous observations by [41]. One reason could be that a greater number of rubber (flexible) particles for the same rubber volume fraction increases the displacement/rotation of all particles, including rigid ones, thus, relaxing the particle jamming.
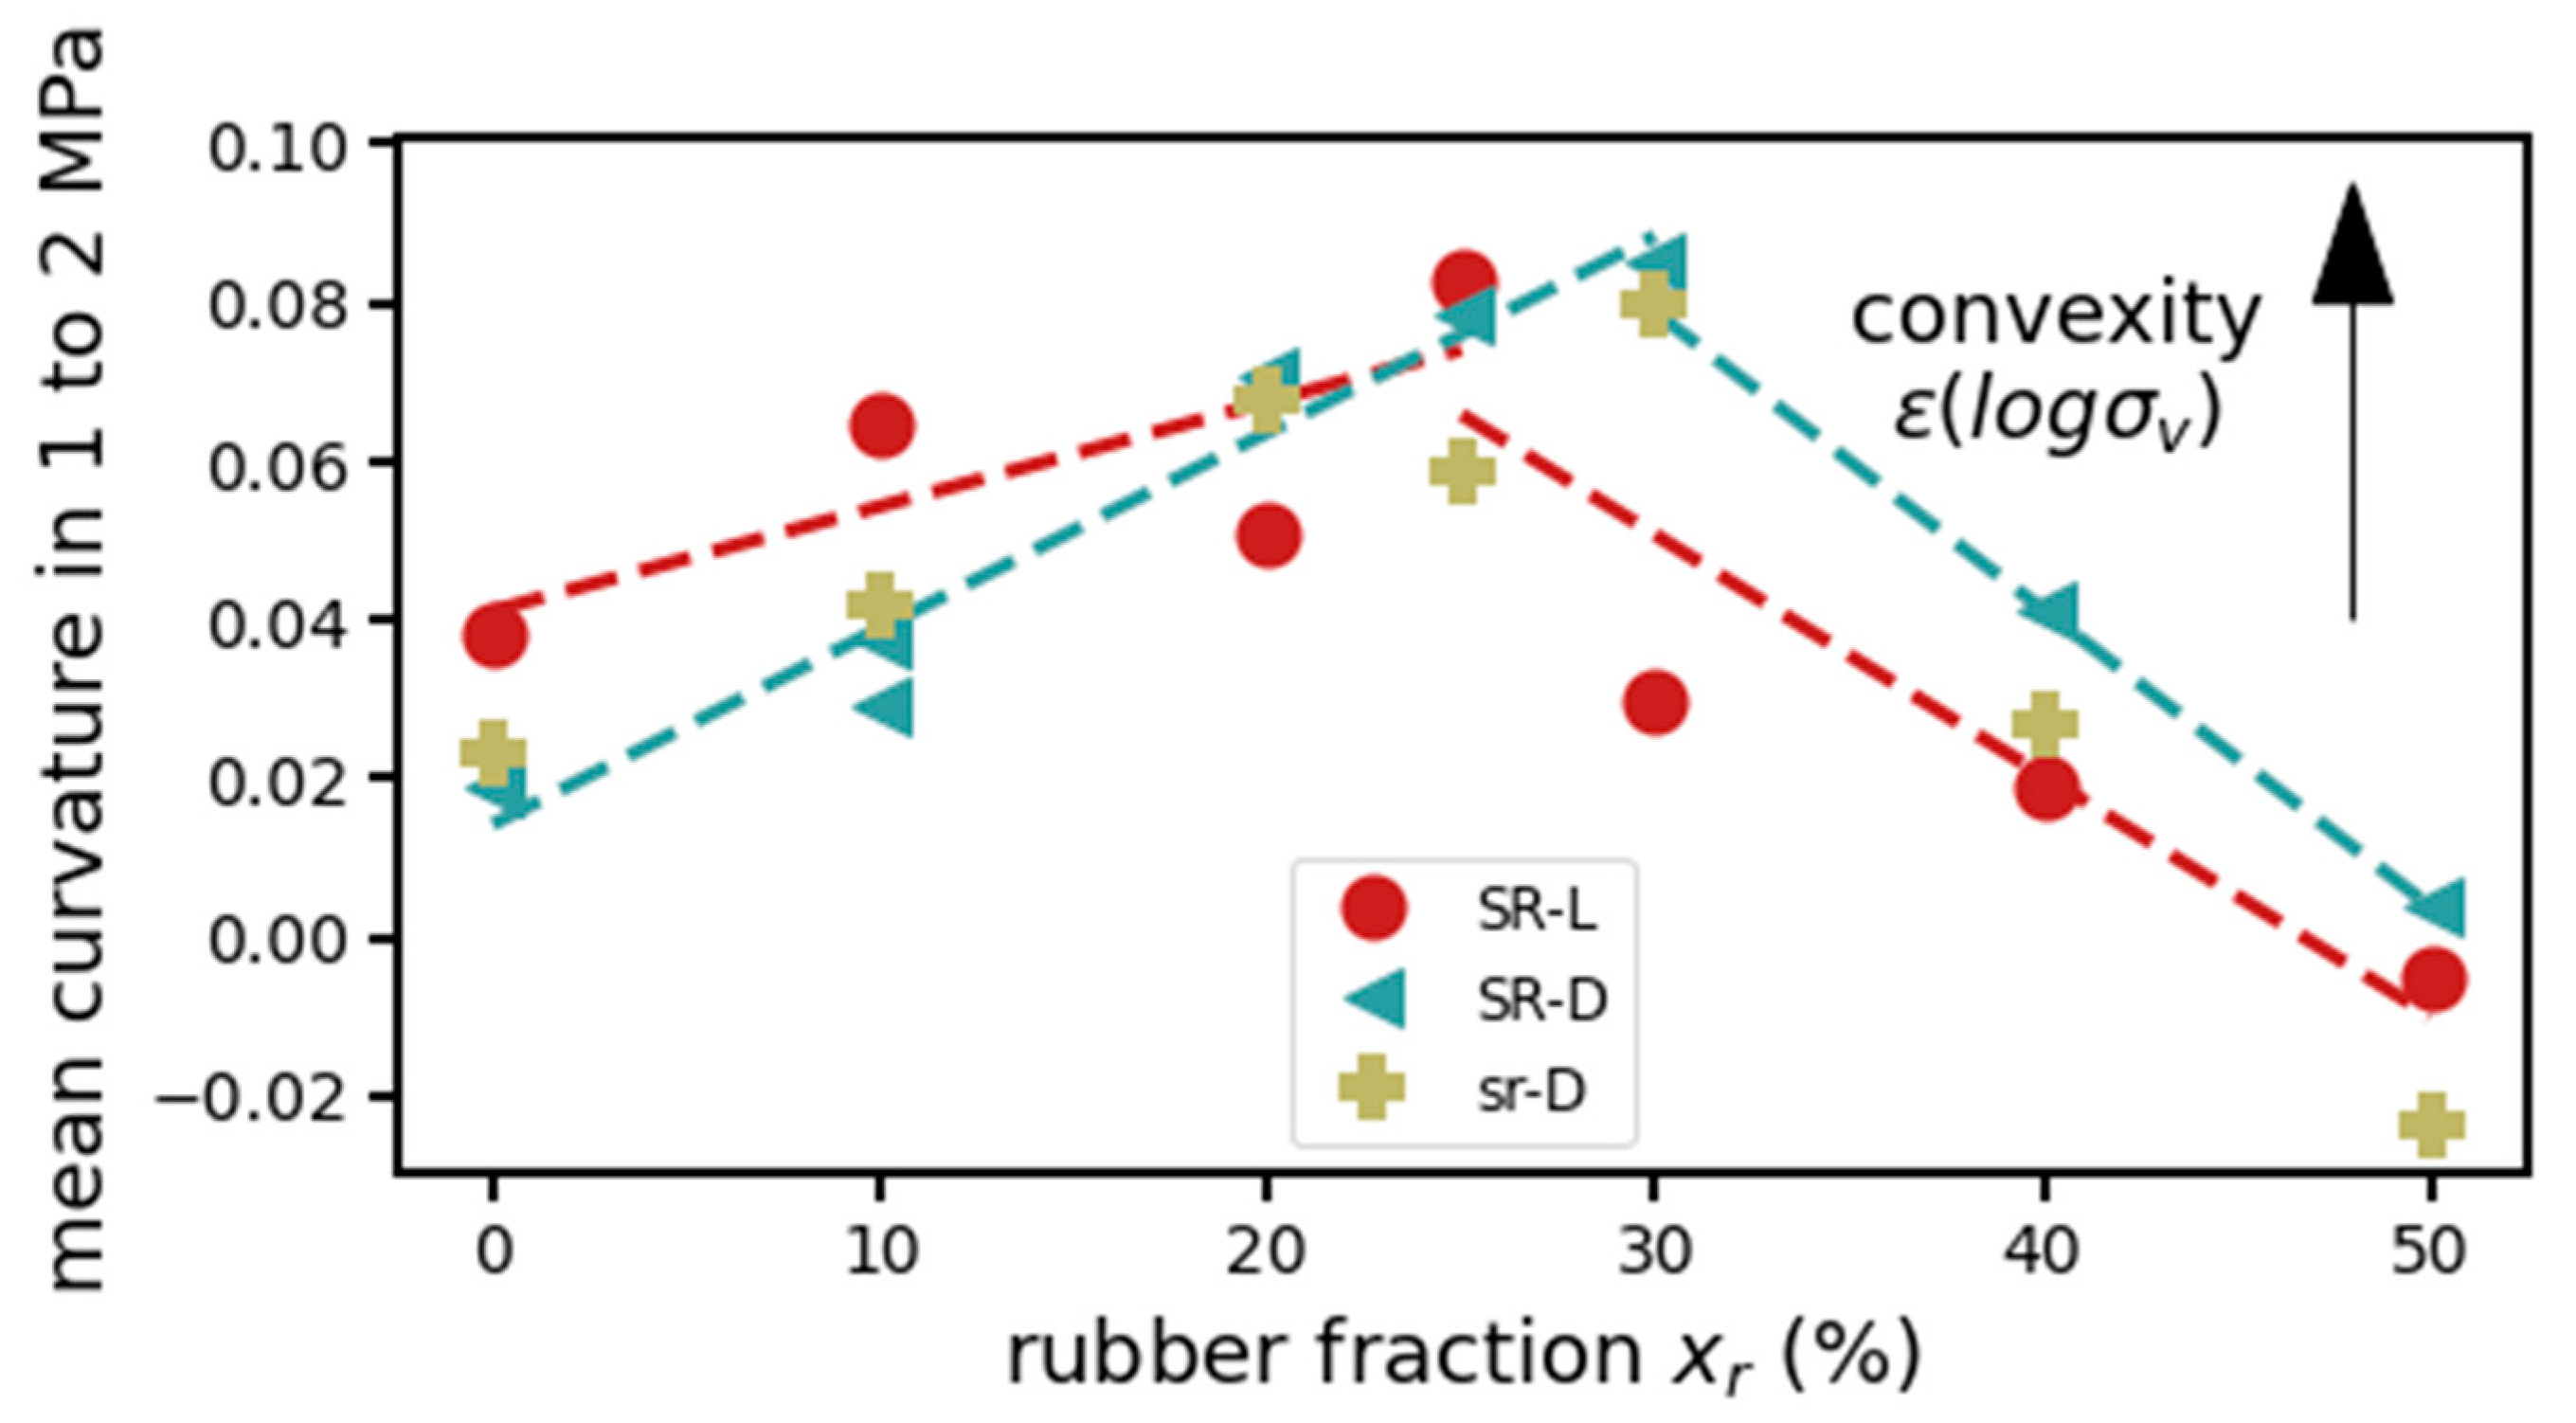
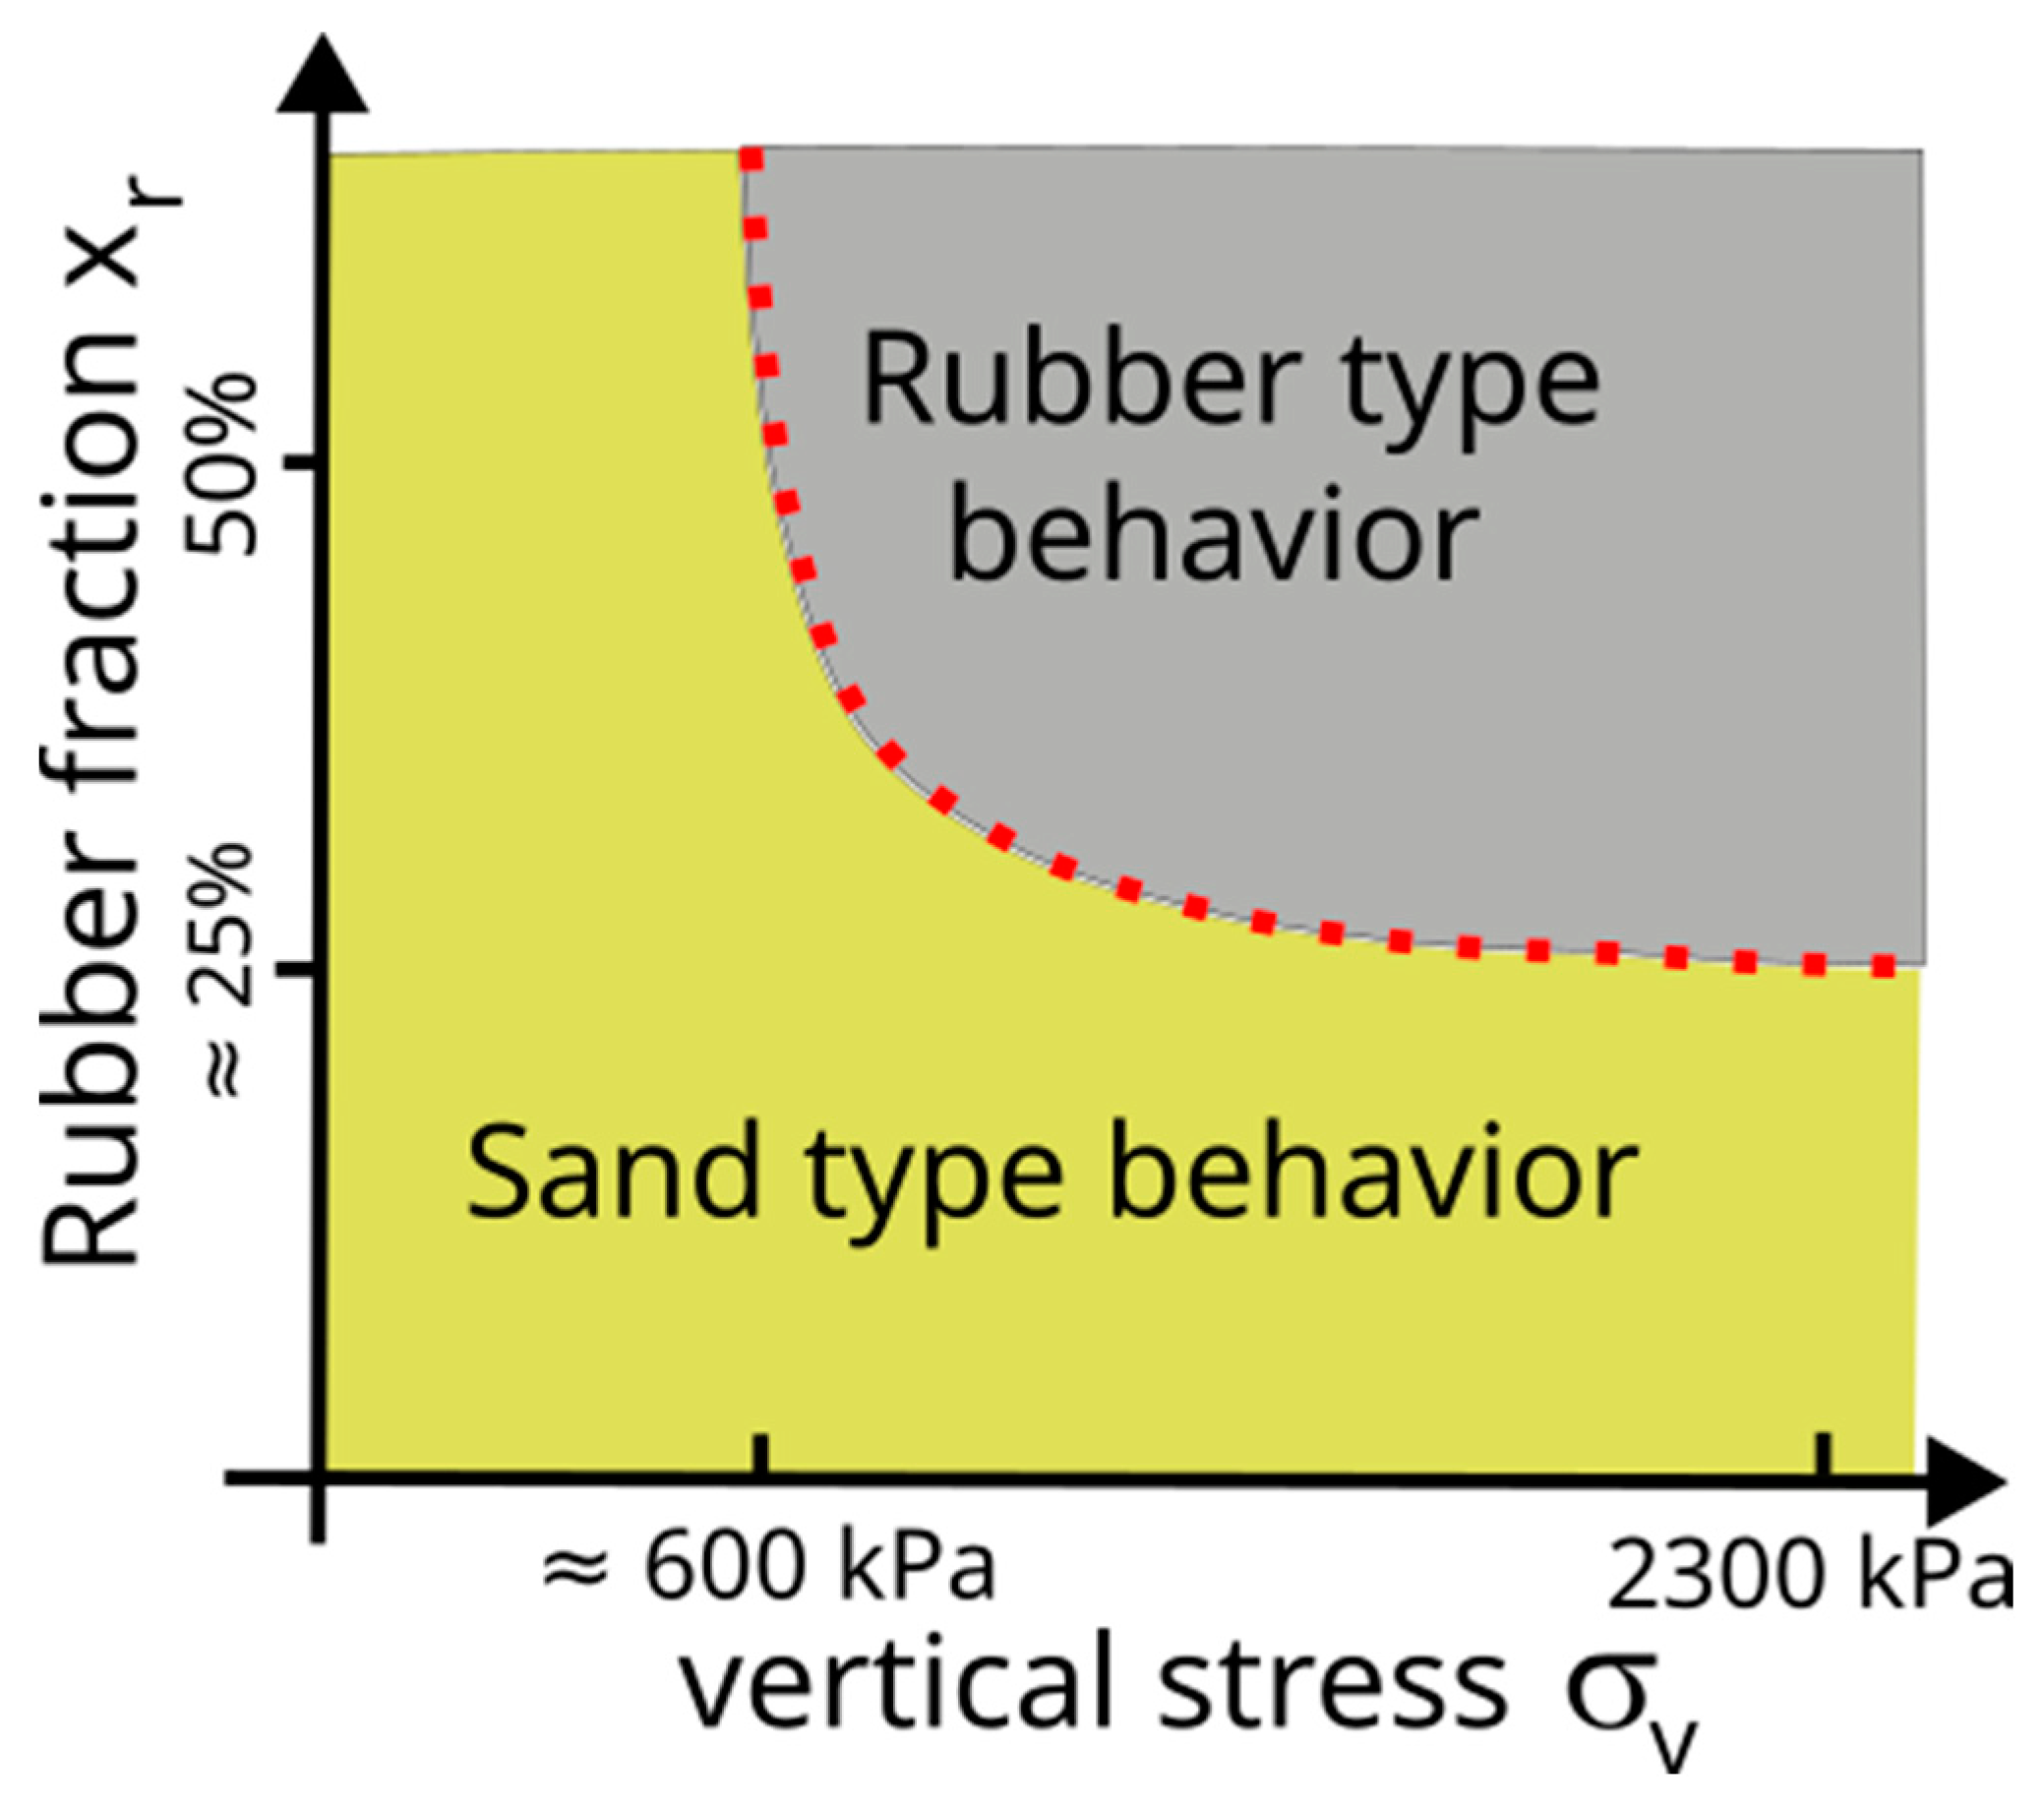
  • The concavity of the loading curve in the e—log ( σ v ) plane increased for pure sand packing with an increase in the normal stress. However, with the addition of rubber, the curve was found to become more convex at higher values of stress. The observed curvature change can be attributed to the saturation of the voids due to their filling with rubber, thus, indicating the impact of rubber addition on the macroscopic response of the mixture. An estimation of the mean curvature was performed. The mixtures were categorized into “sand-like” if the concavity increased and “rubber-like” if it decreased with the rubber fraction. This classification is helpful since it gives an objective definition of packing behavior on the basis of vertical stress and rubber fraction.
  • The one-dimensional confined stiffness was found to decrease with an increase in the rubber fraction. A power law decrease of the modulus number, m, with the rubber fraction was observed for both densities. The ratio between the m-values for loose and dense packings was relatively constant around 75% (standard deviation of 7%) on all the range of rubber fractions. The power law index was relatively constant for all tests, with slightly higher values for looser packings. Moreover, for a given rubber fraction, coarser rubber particle packings (sR-D) showed a stiffer response than the corresponding equal-sized particle mixtures, indicating a stronger sand contact force network.
This work strengthens the understanding of the mechanical response of sand–rubber mixtures. Such mixtures can be an interesting solution as a composite soil in numerous geotechnical applications. Thus, the results presented here are a step further to better understanding the behaviors of such mixtures. Numerical studies, using DEM, can be the perspective for such experiments, which will help link the micromechanical interactions with the macroscale responses observed.

Author Contributions

Conceptualization, B.C., E.I., P.R.; methodology, B.C., E.I., P.B.; formal analysis, P.B., B.C.; investigation, P.B., E.I.; resources, P.B., E.I., B.C.; writing—original draft preparation, P.B., B.C.; writing—review and editing, E.I., P.R., R.A.; supervision, P.R., B.C., E.I., R.A. All authors have read and agreed to the published version of the manuscript.

Funding

This research received no external funding.

Institutional Review Board Statement

Not applicable.

Informed Consent Statement

Not applicable.

Data Availability Statement

Data sharing is not applicable.

Conflicts of Interest

The authors declare no conflict of interest.

References

  1. Lee, J.H.; Salgado, R.; Bernal, A.; Lovell, C.W. Shredded tires and rubber-sand as lightweight backfill. J. Geotech. Geoenviron. Eng. 1999, 125, 132–141. [Google Scholar] [CrossRef]
  2. Bosscher, P.J.; Edil, T.B.; Kuraoka, S. Design of highway embankments using tire chips. J. Geotech. Geoenviron. Eng. 1997, 123, 295–304. [Google Scholar] [CrossRef]
  3. Youwai, S.; Bergado, D.T. Numerical analysis of reinforced wall using rubber tire chips–sand mixtures as backfill material. Comput. Geotech. 2004, 31, 103–114. [Google Scholar] [CrossRef]
  4. Yoon, S.; Prezzi, M.; Siddiki, N.Z.; Kim, B. Construction of a test embankment using a sand–tire shred mixture as fill material. Waste Manag. 2006, 26, 1033–1044. [Google Scholar] [CrossRef] [PubMed]
  5. Blumenthal, M.; Zelibor, J.L. Scrap tires used in rubber-modified asphalt pavement and civil engineering applications. In Utilization of Waste Materials in Civil Engineering Construction; ASCE: Reston, VA, USA, 1993; pp. 182–192. [Google Scholar]
  6. Humphrey, D.N.; Eaton, R.A. Field performance of tire chips as subgrade insulation for rural roads. In Proceedings of the 6th International Conference on Low-Volume Roads, Minneapolis, MN, USA, 25–29 June 1995; Volume 2, pp. 77–86. [Google Scholar]
  7. Poh, P.S.H.; Broms, B.B. Slope stabilization using old rubber tires and geotextiles. J. Perform. Constr. Facil. 1995, 9, 76–79. [Google Scholar] [CrossRef]
  8. Garga, V.K.; O’Shaughnessy, V. Tire-reinforced earthfill. Part 1: Construction of a test fill, performance, and retaining wall design. Can. Geotech. J. 2000, 37, 75–96. [Google Scholar] [CrossRef]
  9. Brunet, S.; De La Llera, J.C.; Kausel, E. Non-linear modeling of seismic isolation systems made of recycled tire-rubber. Soil Dyn. Earthq. Eng. 2016, 85, 134–145. [Google Scholar] [CrossRef]
  10. Kaneko, T.; Orense, R.P.; Hyodo, M.; Yoshimoto, N. Seismic response characteristics of saturated sand deposits mixed with tire chips. J. Geotech. Geoenviron. Eng. 2013, 139, 633–643. [Google Scholar] [CrossRef]
  11. Xiong, W.; Yan, M.R.; Li, Y.Z. Geotechnical seismic isolation system—Further experimental study. Appl. Mech. Mater. 2014, 580–583, 1490–1493. [Google Scholar] [CrossRef]
  12. Tsiavos, A.; Alexander, N.A.; Diambra, A.; Ibraim, E.; Vardanega, P.J.; Gonzalez-Buelga, A.; Sextos, A. A sand-rubber deformable granular layer as a low-cost seismic isolation strategy in developing countries: Experimental investigation. Soil Dyn. Earthq. Eng. 2019, 125, 105731. [Google Scholar] [CrossRef]
  13. Kaneda, K.; Hazarika, H.; Yamazaki, H. Numerical simulations of earth pressure reduction using tire chips in sand backfill. J. Appl. Mech. 2007, 10, 467–476. [Google Scholar] [CrossRef]
  14. Hazarika, H.; Kohama, E.; Sugano, T. Underwater shake table tests on waterfront structures protected with tire chips cushion. J. Geotech. Geoenviron. Eng. 2008, 134, 1706–1719. [Google Scholar] [CrossRef]
  15. Senetakis, K.; Anastasiadis, A.; Pitilakis, K. Dynamic properties of dry sand/rubber (Srm) and gravel/rubber (Grm) mixtures in a wide range of shearing strain amplitudes. Soil Dyn. Earthq. Eng. 2012, 33, 38–53. [Google Scholar] [CrossRef]
  16. Tsang, H.-H. Seismic isolation by rubber–soil mixtures for developing countries. Earthq. Eng. Struct. Dyn. 2008, 37, 283–303. [Google Scholar] [CrossRef]
  17. Badarayani, P.R.; Artoni, R.; Cazacliu, B.; Ibraim, E.; Richard, P. Segregation of sand-rubber chips mixtures subject to vertical tapping under confinement. Powder Technol. 2021, 393, 764–772. [Google Scholar] [CrossRef]
  18. Attom, M.; Khedaywi, T.; Mousa, S.A. The effect of shredded waste tire on the shear strength, swelling and compressibility properties of the clayey soil. J. Solid Waste Technol. Manag. 2007, 33, 219–227. [Google Scholar]
  19. Lee, J.-S.; Dodds, J.; Santamarina, J.C. Behavior of rigid-soft particle mixtures. J. Mater. Civ. Eng. 2007, 19, 179–184. [Google Scholar] [CrossRef] [Green Version]
  20. Promputthangkoon, P.; Hyde, A. Compressibility and liquefaction potential of rubber composite soils. In Proceedings of the International Workshop on Scrap Tire Derived Geomaterials-Opportunities and Challenges, Yokosuka, Japan, 23–24 March 2007; pp. 161–170. [Google Scholar]
  21. Trouzine, H.; Bekhiti, M.; Asroun, A. Effects of scrap tyre rubber fibre on swelling behaviour of two clayey soils in Algeria. Geosynth. Int. 2012, 19, 124–132. [Google Scholar] [CrossRef]
  22. Fu, R.; Coop, M.R.; Li, X.Q. The mechanics of a compressive sand mixed with tyre rubber. Géotech. Lett. 2014, 4, 238–243. [Google Scholar] [CrossRef]
  23. Benessalah, I.; Arab, A.; Sadek, M.; Bouferra, R. Laboratory study on the compressibility of sand–rubber mixtures under one dimensional consolidation loading conditions. Granul. Matter 2019, 21, 7. [Google Scholar] [CrossRef]
  24. Pincus, H.; Edil, T.; Bosscher, P. Engineering properties of tire chips and soil mixtures. Geotech. Test. J. 1994, 17, 453. [Google Scholar] [CrossRef]
  25. Foose, G.J.; Benson, C.H.; Bosscher, P.J. Sand reinforced with shredded waste tires. J. Geotech. Eng. 1996, 122, 760–767. [Google Scholar] [CrossRef]
  26. Zornberg, J.G.; Cabral, A.R.; Viratjandr, C. Behaviour of tire shred sand mixtures. Can. Geotech. J. 2004, 41, 227–241. [Google Scholar] [CrossRef]
  27. Asadi, M.; Thoeni, K.; Mahboubi, A. An experimental and numerical study on the compressive behavior of sand-rubber particle mixtures. Comput. Geotech. 2018, 104, 185–195. [Google Scholar] [CrossRef]
  28. Neaz Sheikh, M.; Mashiri, M.S.; Vinod, J.S.; Tsang, H.-H. Shear and compressibility behavior of sand–tire crumb mixtures. J. Mater. Civ. Eng. 2013, 25, 1366–1374. [Google Scholar] [CrossRef]
  29. Rouhanifar, S.; Afrazi, M.; Fakhimi, A.; Yazdani, M. Strength and deformation behaviour of sand-rubber mixture. Int. J. Geotech. Eng. 2021, 15, 1078–1092. [Google Scholar] [CrossRef]
  30. Kim, H.-K.; Santamarina, J.C. Sand–rubber mixtures (Large rubber chips). Can. Geotech. J. 2008, 45, 1457–1466. [Google Scholar] [CrossRef] [Green Version]
  31. Lee, C.; Truong, Q.H.; Lee, J.-S. Cementation and bond degradation of rubber–sand mixtures. Can. Geotech. J. 2010, 47, 763–774. [Google Scholar] [CrossRef]
  32. Anastasiadis, A.; Senetakis, K.; Pitilakis, K. Small-strain shear modulus and damping ratio of sand-rubber and gravel-rubber mixtures. Geotech. Geol. Eng. 2012, 30, 363–382. [Google Scholar] [CrossRef]
  33. Senetakis, K.; Anastasiadis, A. Effects of state of test sample, specimen geometry and sample preparation on dynamic properties of rubber–sand mixtures. Geosynth. Int. 2015, 22, 301–310. [Google Scholar] [CrossRef] [Green Version]
  34. Tian, Y.; Senetakis, K. Influence of creep on the small-strain stiffness of sand–rubber mixtures. Géotechnique 2022, 72, 899–910. [Google Scholar] [CrossRef]
  35. Fu, R.; Coop, M.R.; Li, X.Q. Influence of particle type on the mechanics of sand–rubber mixtures. J. Geotech. Geoenviron. Eng. 2017, 143, 04017059. [Google Scholar] [CrossRef] [Green Version]
  36. Tasalloti, A.; Chiaro, G.; Murali, A.; Banasiak, L. Physical and mechanical properties of granulated rubber mixed with granular soils—A literature review. Sustainability 2021, 13, 4309. [Google Scholar] [CrossRef]
  37. Platzer, A.; Rouhanifar, S.; Richard, P.; Cazacliu, B.; Ibraim, E. Sand–rubber mixtures undergoing isotropic loading: Derivation and experimental probing of a physical model. Granul. Matter 2018, 20, 81. [Google Scholar] [CrossRef] [Green Version]
  38. Fonseca, J.; Riaz, A.; Bernal-Sanchez, J.; Barreto, D.; McDougall, J.; Miranda-Manzanares, M.; Marinelli, A.; Dimitriadi, V. Particle–scale interactions and energy dissipation mechanisms in sand–rubber mixtures. Géotechnique Lett. 2019, 9, 263–268. [Google Scholar] [CrossRef]
  39. David Suits, L.; Sheahan, T.; Ghazavi, M.; Sakhi, M. Optimization of aspect ratio of waste tire shreds in sand-shred mixtures using cbr tests. Geotech. Test. J. 2005, 28, 12126. [Google Scholar] [CrossRef]
  40. Rao, G.V.; Dutta, R.K. Compressibility and strength behaviour of sand–tyre chip mixtures. Geotech. Geol. Eng. 2006, 24, 711–724. [Google Scholar] [CrossRef]
  41. Lee, C.; Truong, Q.H.; Lee, W.; Lee, J.-S. Characteristics of rubber-sand particle mixtures according to size ratio. J. Mater. Civ. Eng. 2010, 22, 323–331. [Google Scholar] [CrossRef]
  42. Gotteland, P.; Lambert, S.; Balachowski, L. Strength characteristics of tyre chips-sand mixtures. Stud. Geotech. Mech. 2005, 27, 55–66. [Google Scholar]
  43. Mashiri, M.S.; Vinod, J.S.; Sheikh, M.N.; Tsang, H.-H. Shear strength and dilatancy behaviour of sand–tyre chip mixtures. Soils Found. 2015, 55, 517–528. [Google Scholar] [CrossRef] [Green Version]
  44. Lanzano, G.; Visone, C.; Bilotta, E.; Santucci De Magistris, F. Experimental assessment of the stress–strain behaviour of leighton buzzard sand for the calibration of a constitutive model. Geotech. Geol. Eng. 2016, 34, 991–1012. [Google Scholar] [CrossRef]
  45. Rouhanifar, S. Mechanics of Soft-Rigid Soil Mixtures; University of Bristol: Bristol, UK, 2017. [Google Scholar]
  46. Badarayani, P.; Richard, P.; Cazacliu, B.; Artoni, R.; Ibraim, E. A numerical and experimental study of sand-rubber mixtures subjected to oedometric compression. E3S Web Conf. 2019, 92, 14010. [Google Scholar] [CrossRef]
  47. Selig, E.; Ladd, R. Preparing test specimens using undercompaction. Geotech. Test. J. 1978, 1, 16–23. [Google Scholar] [CrossRef]
  48. Ibraim, E.; Diambra, A.; Russell, A.R.; Muir Wood, D. Assessment of laboratory sample preparation for fibre reinforced sands. Geotext. Geomembr. 2012, 34, 69–79. [Google Scholar] [CrossRef]
  49. Janbu, N. Soil compressibility as determined by oedometer and triaxial tests. In Proceedings of the European Conference on Soil Mechanics and Foundation Engineering (SMFE), Budapest, Hungary, 24–27 September 1963; Volume 1, pp. 19–25. [Google Scholar]
  50. McDowell, G.R.; Bolton, M.D.; Robertson, D. The fractal crushing of granular materials. J. Mech. Phys. Solids 1996, 44, 2079–2101. [Google Scholar] [CrossRef]
Figure 1. Figure showing (a) fabrication of mixtures using the moist tamping method and (b) experimental setup for the oedometric compression tests [46].
Applsci 13 03867 g001
Figure 2. Vertical strain as a function of the vertical stress for samples with 0% to 50% rubber fractions, loading, and unloading during oedometer tests: (a) SR-D tests; (b) SR-L tests (see Table 1).
Applsci 13 03867 g002
Figure 3. Evolution of (a) the maximum vertical strain and (b) the unrecovered strain after complete unloading with the rubber fraction for SR-D, SR-L, and sr-D series tests, and Sr-D-10, Sr-D-50, sR-D-10, and sR-D-50 tests (see Table 1).
Applsci 13 03867 g003
Figure 4. Mean curvature of the e—log ( σ v ) evolution between 1 and 2 MPa of vertical stress for equally sized particle mixtures of SR-L, SR-D, and sr-D (see Table 1).
Applsci 13 03867 g004
Figure 5. Mean curvature of the e—log  σ v evolution in several ranges of vertical stress; the mean of the values is determined for the equally sized SR-D, SR-L, and sr-D mixtures at the same rubber fraction.
Applsci 13 03867 g005
Figure 6. Schematic phase diagram showing the typical behavior of the equally sized sand–rubber mixtures as a function of the stress level and the rubber fraction.
Applsci 13 03867 g006
Figure 7. Confined modulus, M, versus vertical stress, σ v , relation for equally sized particles (D50 = 1.8 mm): (a) SR-D and (b) SR-L for different rubber fractions xr (low-pass filter was applied on the confined modulus).
Applsci 13 03867 g007
Figure 8. Evolution of modulus number with the rubber fraction for the two packing initial densities (SR-L and SR-D series).
Applsci 13 03867 g008
Figure 9. Confined modulus, M, versus vertical stress, σ v , for the sR-D and Rs-D tests series compared with SR-D at 10% and 50% rubber contents, xr.
Applsci 13 03867 g009
Figure 10. Evolution of the swelling index at different levels of unloading vertical stress for the two densities of the packing and different rubber contents.
Applsci 13 03867 g010
Table 1. Summary of the testing series and sample characteristics.
Sand–Rubber Mixture TypeSand Particle Mean Size,
D50 (mm)
Rubber Particle
Mean Size,
D50 (mm)
Sand/Rubber Mean
Size Ratio
Rubber Fraction,
xr (%)
Sample Void Ratio at the Beginning of Test, eo
SR-D1.81.81.000.647
100.646
200.644
250.643
300.642
400.641
500.640
SR-L1.81.81.000.748
100.746
200.744
250.744
300.742
400.742
500.740
sr-D1.41.41.000.647
100.645
200.645
250.644
300.643
400.642
500.642
sR-D-100.71.40.5100.646
sR-D-50500.645
Sr-D-102.11.41.5100.642
Sr-D-50500.642
Disclaimer/Publisher’s Note: The statements, opinions and data contained in all publications are solely those of the individual author(s) and contributor(s) and not of MDPI and/or the editor(s). MDPI and/or the editor(s) disclaim responsibility for any injury to people or property resulting from any ideas, methods, instructions or products referred to in the content.

