Article

Application Assessment of Electrical Cables during Smoldering and Flaming Combustion

1
Faculty of Fuels and Energy, AGH University of Science and Technology, 30-059 Kraków, Poland
2
Faculty of Environmental Engineering, Geomatics and Energy, Kielce University of Technology, 25-314 Kielce, Poland
3
Faculty of Civil Engineering and Architecture, Kielce University of Technology, 25-314 Kielce, Poland
4
Research Centre for Fire Protection (CNBOP-PIB), 05-420 Józefów, Poland
*
Author to whom correspondence should be addressed.
Appl. Sci. 2023, 13(6), 3766; https://doi.org/10.3390/app13063766
Submission received: 10 January 2023 / Revised: 9 March 2023 / Accepted: 13 March 2023 / Published: 15 March 2023

Abstract

:
Electrical cables are a potential source of ignition and fire hazards in various types of buildings and industrial installations, as well as in all modes of transportation, including aircraft. Fires in buildings pose the greatest threat to human life and health. The composition of thermal degradation products depends mainly on the type of combustible materials and the type of combustion process—flaming or smoldering. The purpose of this paper was to determine, based on experimental studies, the effects of flaming and smoldering combustion on the response times of fire smoke detectors. In addition, the concentrations of fire gases formed in the process of duct combustion, including CO, SO2, NO2, NO, HCN, HCl, HBr and HF, were measured using an FTIR spectrometer. The results presented confirm the significant effect of the way the cable samples burned on detector tripping time. The highest concentration of smoke (Y) in the test chamber was obtained during flame combustion. It was further found that the characteristics of the cable insulation material used, such as the type of PVC, had a significant effect on the toxicity of the emitted gases. The largest amounts of toxic gases were emitted during the smoldering combustion of a cable with a plasticized PVC sheath.

1. Introduction

The fire safety of buildings depends on the introduction of fire-fighting equipment in these buildings, which is responsible for detecting fires in their initial phases. As a result of detection, the building’s occupants are alerted to the danger, evacuation routes are identified, roads are smoked, smoke is prevented, and the fire is finally extinguished [1]. However, for this to be possible, the speed of activation of safety systems is crucial, which depends primarily on the speed and reliability of the activation of smoke detectors [2].
The fire risk of electrical cables and wires is significantly determined by the combustible properties (fire characteristics) of the coating and insulation materials that make up their structures, together with the operating conditions and the environments in which they are used [3,4]. Electric cables and wires are integral parts of buildings and are exposed to the effects of flames, just like other elements of equipment, and, in many cases, they are also a source of ignition, resulting from, inter alia, short circuits, accidental sparks and electric arcs [5,6].
Fires in buildings represent the greatest danger to human life and health. According to data published by the National Fire Protection Association (NFPA) in 2019 showing statistics from 2012 to 2018, 10% of fires in residential construction were caused by failures of electric cables [7]. In addition, cable failures that caused fires were responsible for 19% of deaths and 10% of injuries to inhabitants [8].
Fires in the interiors of buildings are characterized by high dynamics which reduce the time for safe evacuation. Data published in the literature clearly indicate that only 3–4% of people die as a direct result of flames, while about 80% die as a result of toxic fire gases. Based on an analysis of demographic data and morbidity, it is estimated that between 310,000 and 670,000 people (excluding firefighters) in the US are exposed to fire in residential fires each year [9].
The vast majority of fires in buildings include organic-origin materials in the isolations and sheaths of electric cables. The thermal decomposition products of these materials are mainly [10,11]:
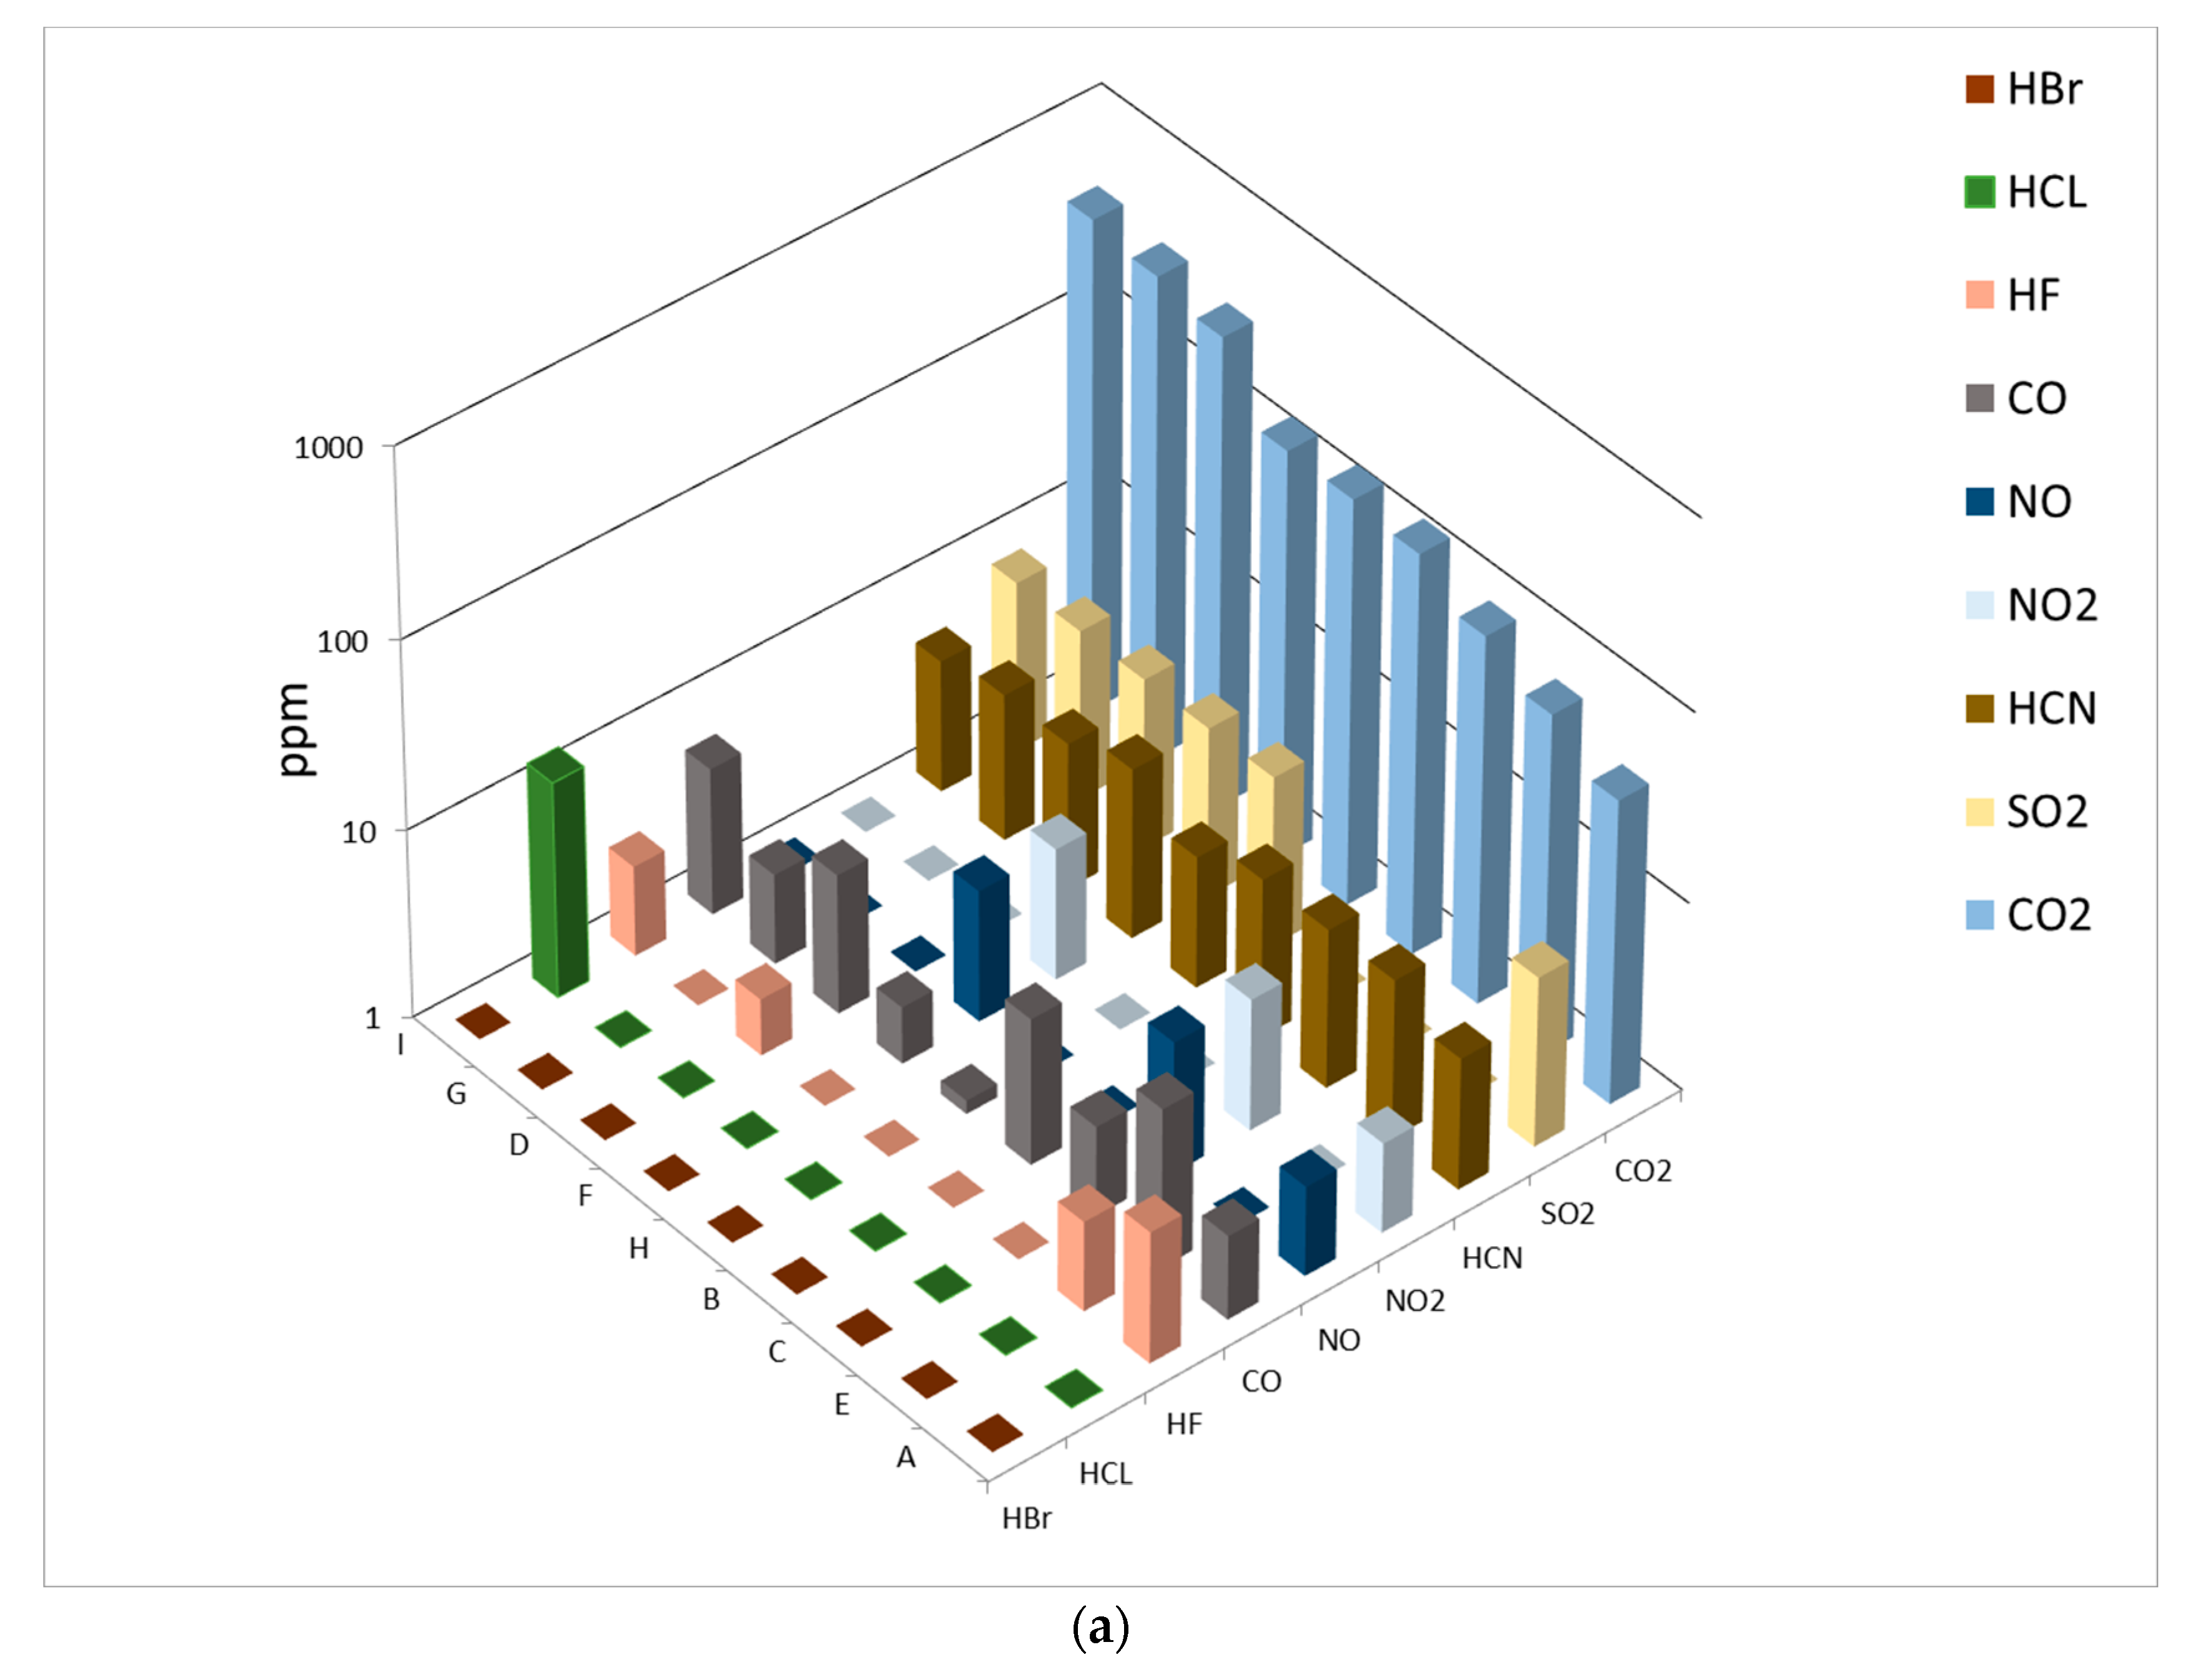
  • Nitrogen oxides (NOx: nitrogen oxide (NO) and nitrogen dioxide (NO2));
  • Carbon oxide (CO) and carbon dioxide (CO2);
  • Hydrocarbons, mainly polycyclic aromatic hydrocarbons (PAHs);
  • Oxygen, hydrogen, fluorine, chlorine, sulfur, nitrogen, and bromine compounds, such as aldehydes, acrolein and benzopyrene, determined as volatile organic compounds;
  • Sulfur oxides, mainly SO2; and
  • Solid particles (PM) containing carbon black and a lot of toxic carbon, hydrogen and oxygen compounds, as well as isocyanates, as products of burning PUR foams.
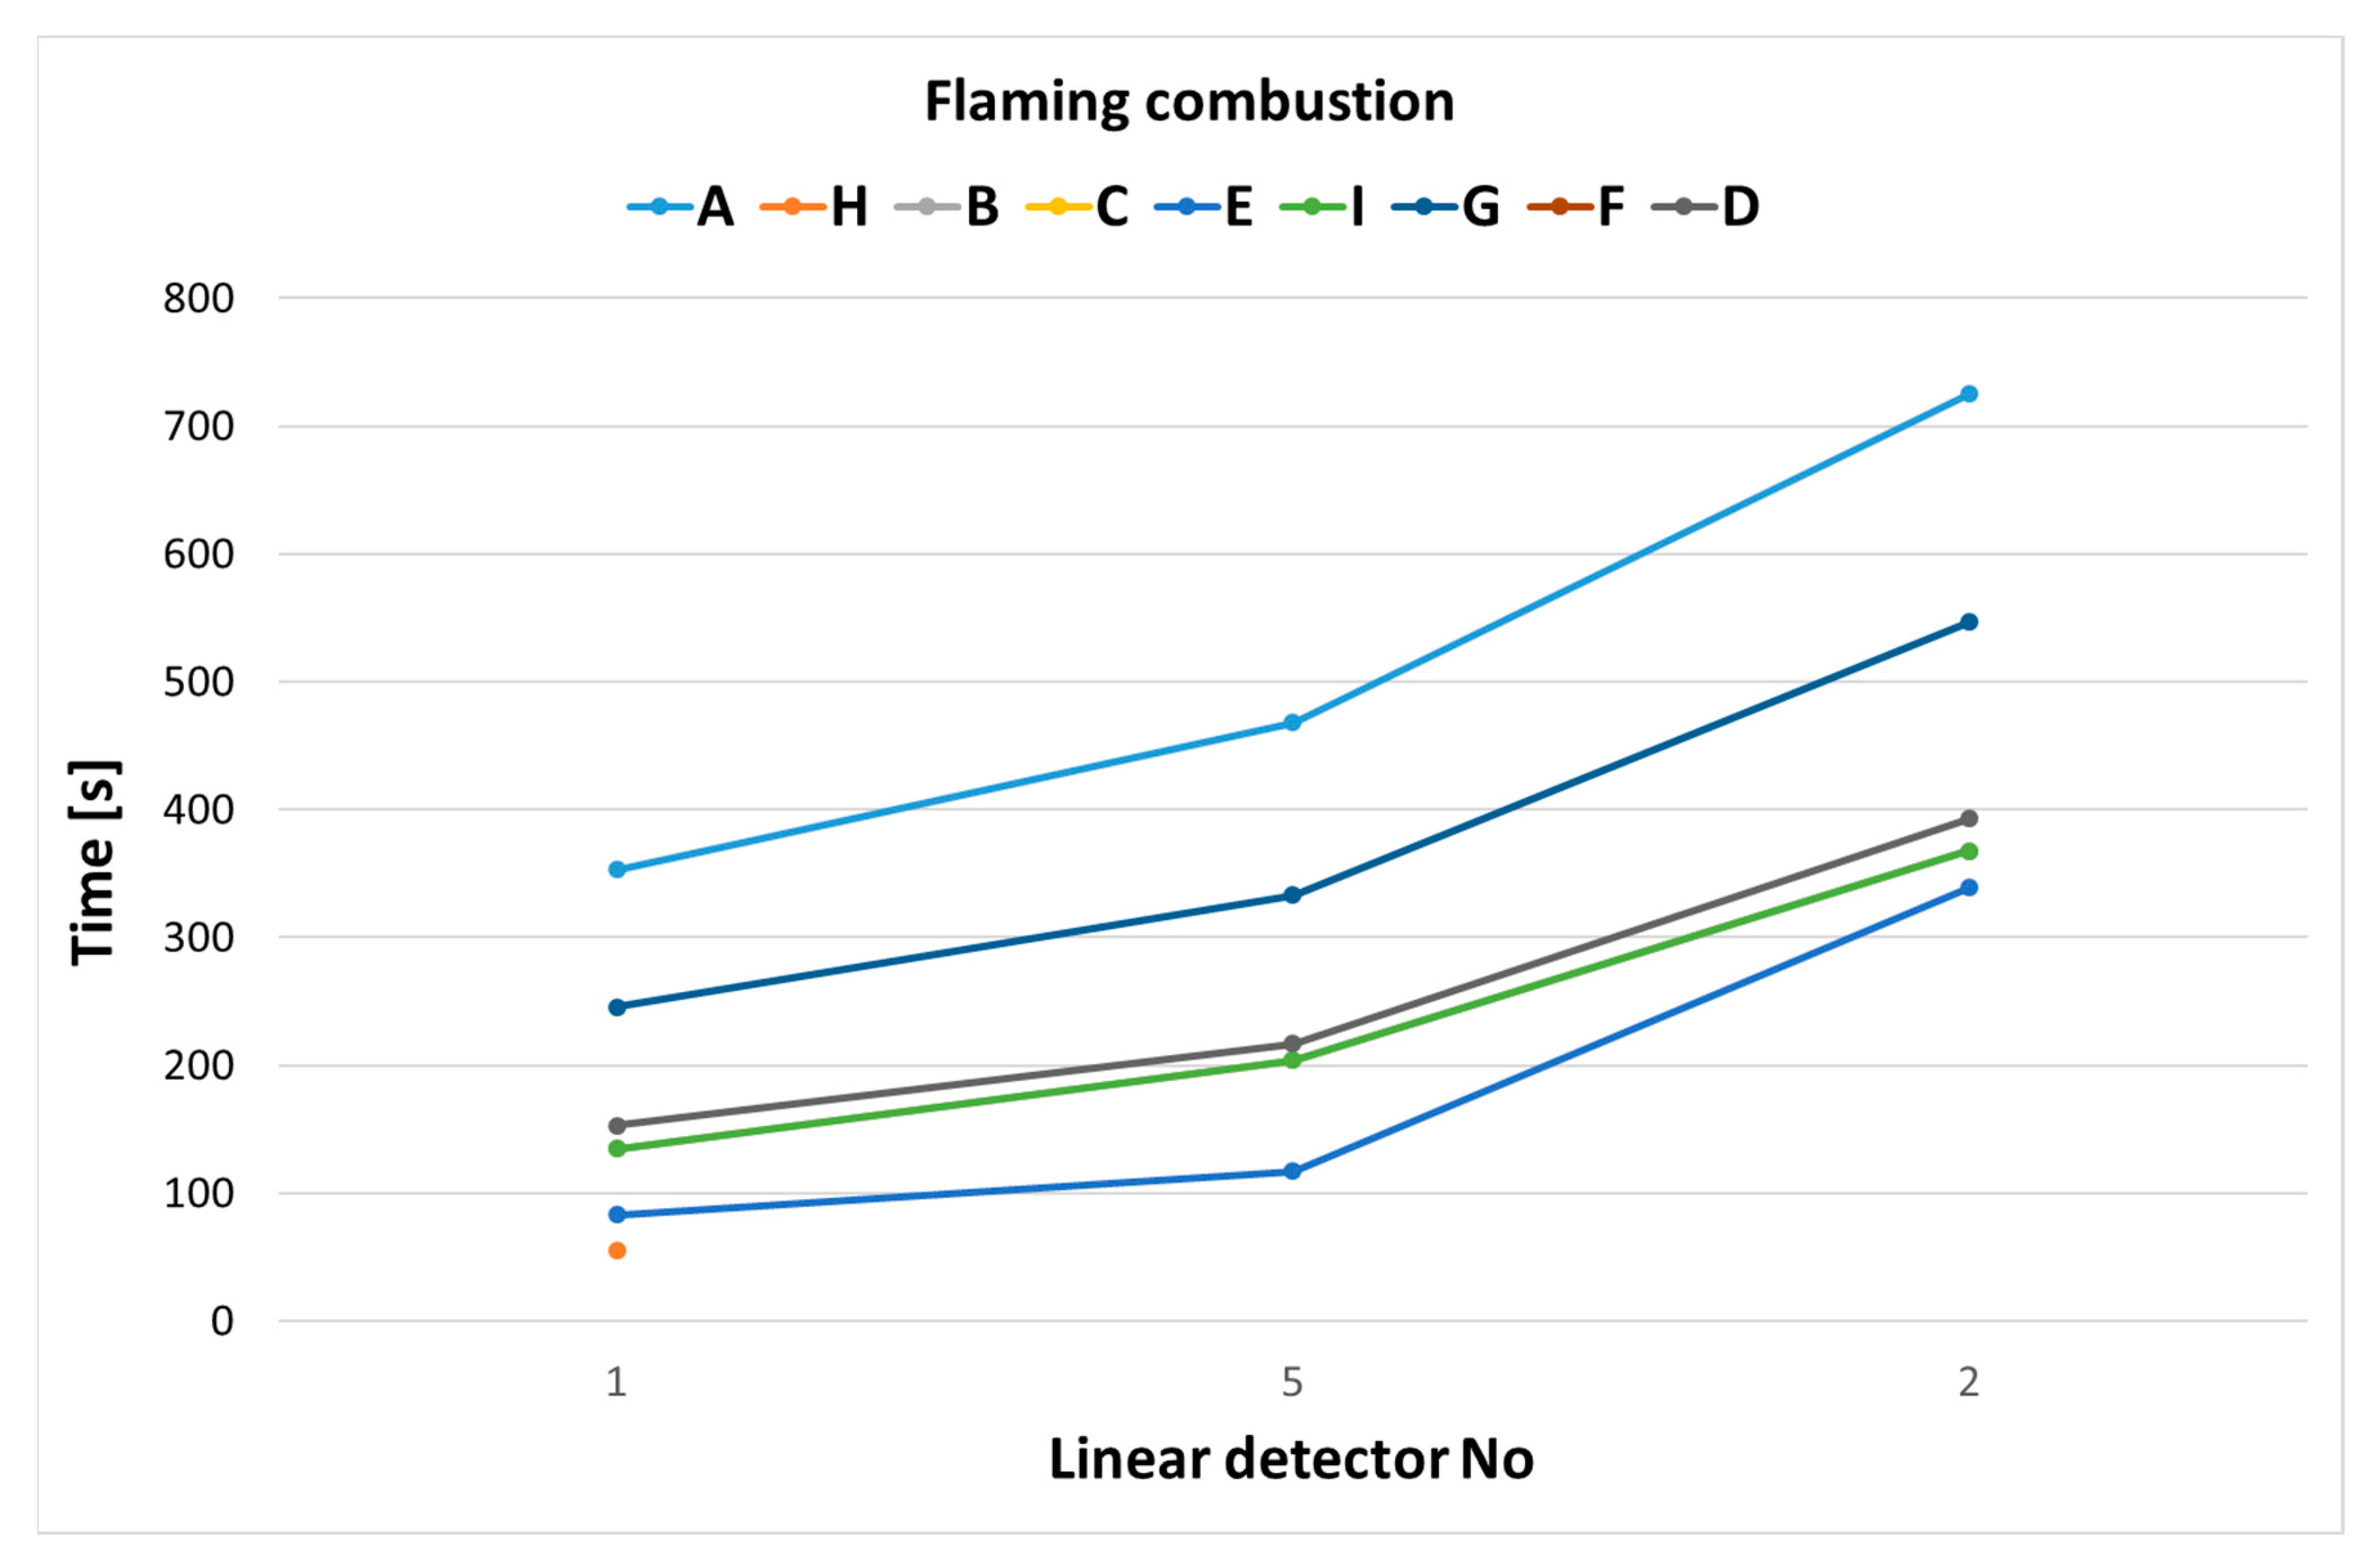
The composition of thermal degradation products depends mainly on the type of combustible materials and the type of combustion process—flaming [12] or smoldering [13,14]. Characteristic products of flame combustion are carbon dioxide and nitrogen oxides. The emission of these compounds is strongly dependent on reaction kinetics, flame temperature and oxygen diffusion to the combustion zone. Smoldering processes occur with organic combustible materials that form charred layers when heated. The phenomenon occurs with oxygen deficiency, resulting in the separation of incomplete combustion products, among which carbon monoxide and polycyclic hydrocarbons predominate [15].
Electric cables have a complex construction; wire insulation and cable sheaths can be made of different materials. This greatly impedes the identification of the products of the combustion of cables, such that only a few studies have examined basic combustion in real cable fires [16,17]. Piloted ignition time and flame spread rate were studied for several commercial cables under various externally applied radiant fluxes, showing the similarity between the pyrolysis temperature of cable insulation and the ignition temperature [5]. Based on tests of upward flame spread over 35 commercial electrical cables with a copper or aluminum core, Tewarson and Khan [18] found that the metal core acted like a heat sink and slowed down flamespread. Xie et al. [19], based on small-scale experiments (TG, FTIR and MCC) with new and aged PVC cable sheaths, found that aging has a strong effect on the heat release rate and toxic gas emissions.
Polyvinyl chloride (PVC) is one of the most versatile thermoplastic materials and is widely used in electrical cables due to its processability in the form of flexible PVC produced by adding 30–40 wt.% additives, especially plasticizers, to lower the glass transition temperature. Flexible PVC ignites more easily and burns at a higher rate than rigid PVC because the plasticizers are usually combustible [20]. For this reason, most of the publication concerns the fire behavior of flame-retardant PVC cables, including their decomposition, swelling and spontaneous ignition [21]. The results of the PVC cable tests also allowed the modeling of these cables fires. The numerical simulation of the PVC cable fires required the modelling of cable pyrolysis, which was extremely challenging due to the geometrical complexity and the wide range of different PVC compositions and plasticizers. The different approaches for modelling the kinetics of PVC degradation have been studied by Marcilla and Beltrán [22], who concluded that two parallel reactions are needed to describe the first stage of PVC degradation, while a single reaction is required for the second.
There are two main typical operating principles for smoke detectors—ionization and optical (photoelectric) detection [23]. Sensitive detectors are used in areas where even smoking is prohibited, such as toilets and schools. Smoke detectors in large commercial and industrial buildings are powered by a central fire alarm system [24]. It has been accepted that a properly functioning smoke alarm reduces the risk of fire death in residential buildings by 50% to 70% [25,26]. The US Fire Administration reports that over 85% of homes in the United States have at least one smoke alarm installed and that 60% of residential fire deaths occur in homes without a working alarm. An analysis of data from the US Fire Administration’s National Fire Incident Reporting System (NFIRS) and the NFPA’s Fire Service Survey found that, between 2003 and 2006, 31% of reported home fires and 40% of home fire deaths occurred in the absence of smoke alarms [27].
Ionization and photoelectric alarm ionization and photoelectric alarms work by different mechanisms to detect invisible/fine and visible products of combustion, respectively [28]. Photoelectric alarms use optical sensors and are more likely to respond to slow, smoldering conditions. The principle of operation of ionization detectors is based on a modified theory that considers the functionality of the soot particle charge fraction in addition to the generally accepted dependence on particle size and density [29]. Smoke detectors of the ionization or photoelectric type are designed to activate rapidly and thus provide time for alarmed occupants to escape from most residential fires, although in some cases the escape time may be short [30,31].
Smoke detectors enable the detection of a fire at an early stage of its development. Smoke extinction measurements are used in assessing smoke detector characteristics. Ionization detectors tend to have higher sensitivities at high concentrations of small particles (e.g., when burning wood), while smaller ones have higher sensitivities at low particle concentrations (e.g., large particles of smoke generated during smoldering combustion). Optical detectors have the highest sensitivity to smoke particles with a diameter equal to the wavelength of light and low sensitivity to smoke particles with a diameter much smaller than the wavelength of the light [32]. These detectors are complemented by ionization detectors, as they have higher sensitivity to smoke generated during smoldering combustion and lower sensitivity to flaming fires with low smoke emissions, for example, in the burning of alcohols [33,34].
This study analyzed the effects that the insulation materials of cables have on rates of fire detector tripping. The amounts of toxic gases emitted during the combustion of cable sheathings made of different materials were determined. This factor is very important in terms of human safety in a fire situation. The response rates of detectors at different levels of combustion were also analyzed.
The present study was designed to analyze the concentrations of smoke generated in a chamber and the extinction modulus values, as well as the response times of fire detectors in relation to the type of combustion. Also analyzed were the factors that have the greatest impact on the response times of fire detectors in different types of combustion and the amounts of poisonous gases emitted by different cable coatings. This research is very important due to the fact that human lives depend on how quickly fire detectors are triggered.
During the tests, the time of activation of fire detectors detecting smoke was verified in relation to the type of cable and the type of combustion process, and the parameters of the smoke generated during combustion were measured: extinction modulus (m), smoke concentration (Y) and the concentration of toxic gases.
The test procedure was carried out in three stages, depending on the type of combustion:
  • Flaming combustion;
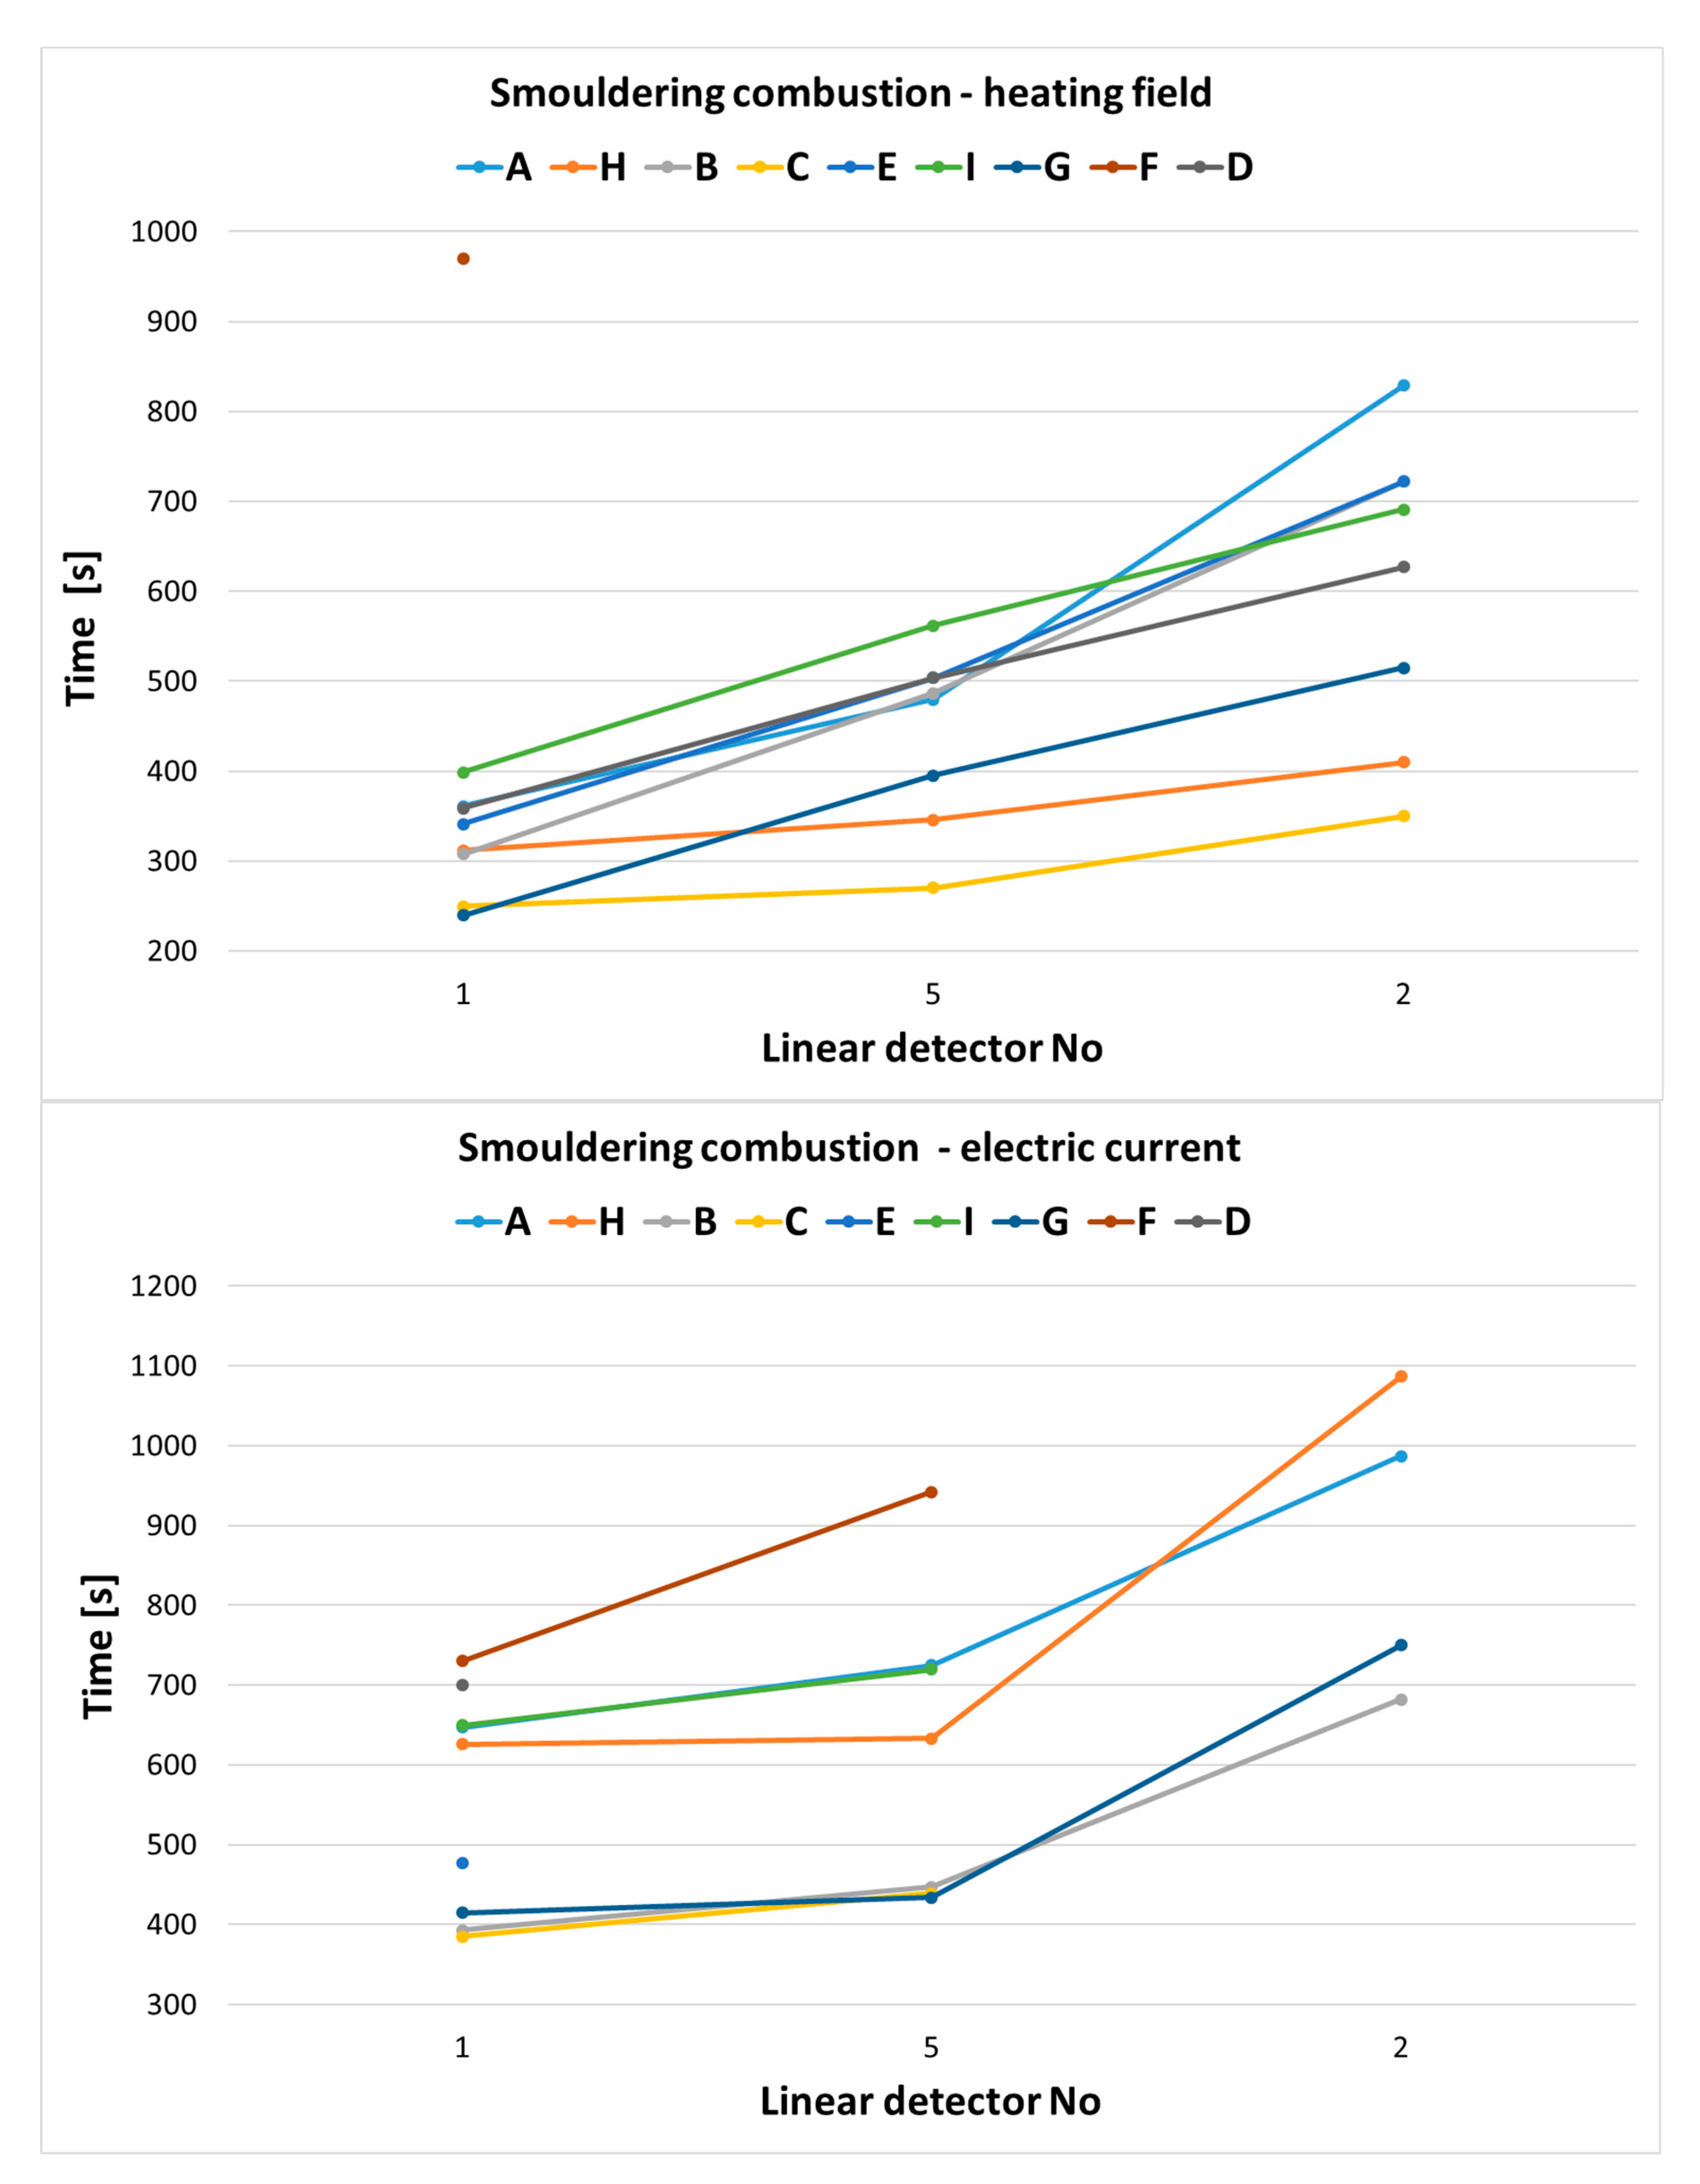
  • Smoldering combustion (cable insulation heated by a heating field);
  • Smoldering combustion (cable heated from the inside by the flow of electric current in its wires).

2. Materials and Methods

2.1. Materials

Test cables were selected to provide a wide range of materials for cable construction and applications in residential and offices buildings. Basic information on the construction, application and type of insulation is presented in Table 1.

2.2. Methods

The tests were carried out on a test bench for testing the suitability of fire detectors equipped with a test chamber with the following dimensions: 9 m × 6 m × 4 m (L × W × H), and which had a flat, horizontal ceiling.
The test chamber allows the simulation of conditions that occur during the development of an internal fire and is equipped with the following devices: a measuring ionization chamber (MIC), a densitometer, a thermocouple, fire detectors, suction tubes for a carbon monoxide concentration analyzer (Ultramat 23) and suction tubes for an FTIR spectroscope. The instrumentation of the chamber allows the acquisition of measurement data (smoke intensity, temperature and humidity, and response time), their visualization and the generation of reports being the basis for admitting tested objects for use in fire protection systems. The measurement system operates automatically by recording data in the form of a graph with the following parameters: smoke concentration—Y, extinction modulus—m, CO concentration, and fire detector activation time [35,36].
The time of activation of the following smoke detectors detecting smoke particles distributed in the combustion chamber according to the data in Table 2 was tested.
For each type of combustion, 27 tests were performed (3 tests for each of the 9 samples of electrical cables). Each test lasted 1000 s (unless all detectors had worked before or the fire parameters did not increase). Figure 1 presents an illustrative diagram of the experimental set-up; all distances are given in meters.
Two test benches were used for smoldering combustion. The first was a heating plate with a diameter of 300 mm, which was warmed up to a maximum temperature of 650 °C. The radiation output of the hotplate was a maximum of 40 kW/m2. The second test stand was a system with high current efficiency up to 120 A, and the cables were laid out in a meter-long fragment of the so-called fastening tray.
To ignite samples during flame combustion, contaminated alcohol was used, in an amount of 150 mL, which filled a vessel with dimensions of 8 × 8 × 3 cm3. Increased alcohol consumption resulted from the difficulty in starting the combustion of some samples and the duration of the test (about 1000 s). The alcohol was poured into a container placed under the samples attached to the steel hanger. Before starting the tests, 300 ml of contaminated alcohol was burnt in order to verify that the substance being combusted did not affect the measurement results. The detectors placed in the chamber did not react during the entire combustion process, and the measuring equipment did not show the content of smoke particles in the chamber.
The amount of cable material used for one test was:
  • For each type of smoldering combustion (initiated by a heating field or by the flow of electric current through wires): 2 m test cable;
  • For flaming combustion: 2 m test cable hung on a stand over a container of alcohol. Samples were placed above the flame.
In the 1970s, Scheidweiler derived an empirical formula for the efficiency of an ionization smoke detector. His research led to the definition of a mathematical model of the ionizing source in the form of the following equation [37]:
Δ I I o = 1 1 η z ( 1 e η z )
where:
  • ΔI—the change in current due to the presence of smoke;
  • Io—the current of the chamber without smoke;
  • z—the aerosol particle concentration;
  • η—the chamber constant that characterizes its sensitivity.
The constant η, for a given cell, is determined as a function of the particle and ion attachment factor, the geometric shape of the cell, and the voltage–current characteristics. In the case of parallel flat electrodes, it is expressed by the following formula [3,38]:
η = I o I n ( x 1 x 0 ) 2 β ( d ) V o b + I o I n 2 π D i ( x 1 x 0 ) 2 V o b +
where:
  • Io—the current of the chamber without smoke, with concentration of aerosol particles;
  • In—the saturation current;
  • β(d)—the ion attachment factor for particles of diameter d;
  • x1x0—the electrode spacing;
  • Vo—the voltage between electrodes at current Io;
  • b+—the electrical mobility of the positive ion, 1.4/cm2 Vs;
  • Di—the diffusion coefficient (for small ions 0.042 cm2/s);
  • d—the mean particle diameter (homogeneous, isotropic particles).
The smoke density is dependent on the ionization chamber constant and the particle diameter and is described by the following equation [32]:
y = 1 η d = 0 d n d d d d
where:
  • y—the smoke density;
  • η—the ionization chamber constant;
  • d—the particle diameter;
  • nd(d)—the normal distribution of particle diameters.
The detector’s tripping time is therefore dependent on the particle diameter as well as on the particle diameter distribution itself.
The regulation [39] specifies the detector parameters defining their sensitivity. The sensitivity of optical smoke detectors is determined by the parameter D, which denotes the reduction in transparency along a 1 m path, or by the extinction modulus m, dB/m, defined by the formula:
M = 10 l · l o g 10 p o p
where:
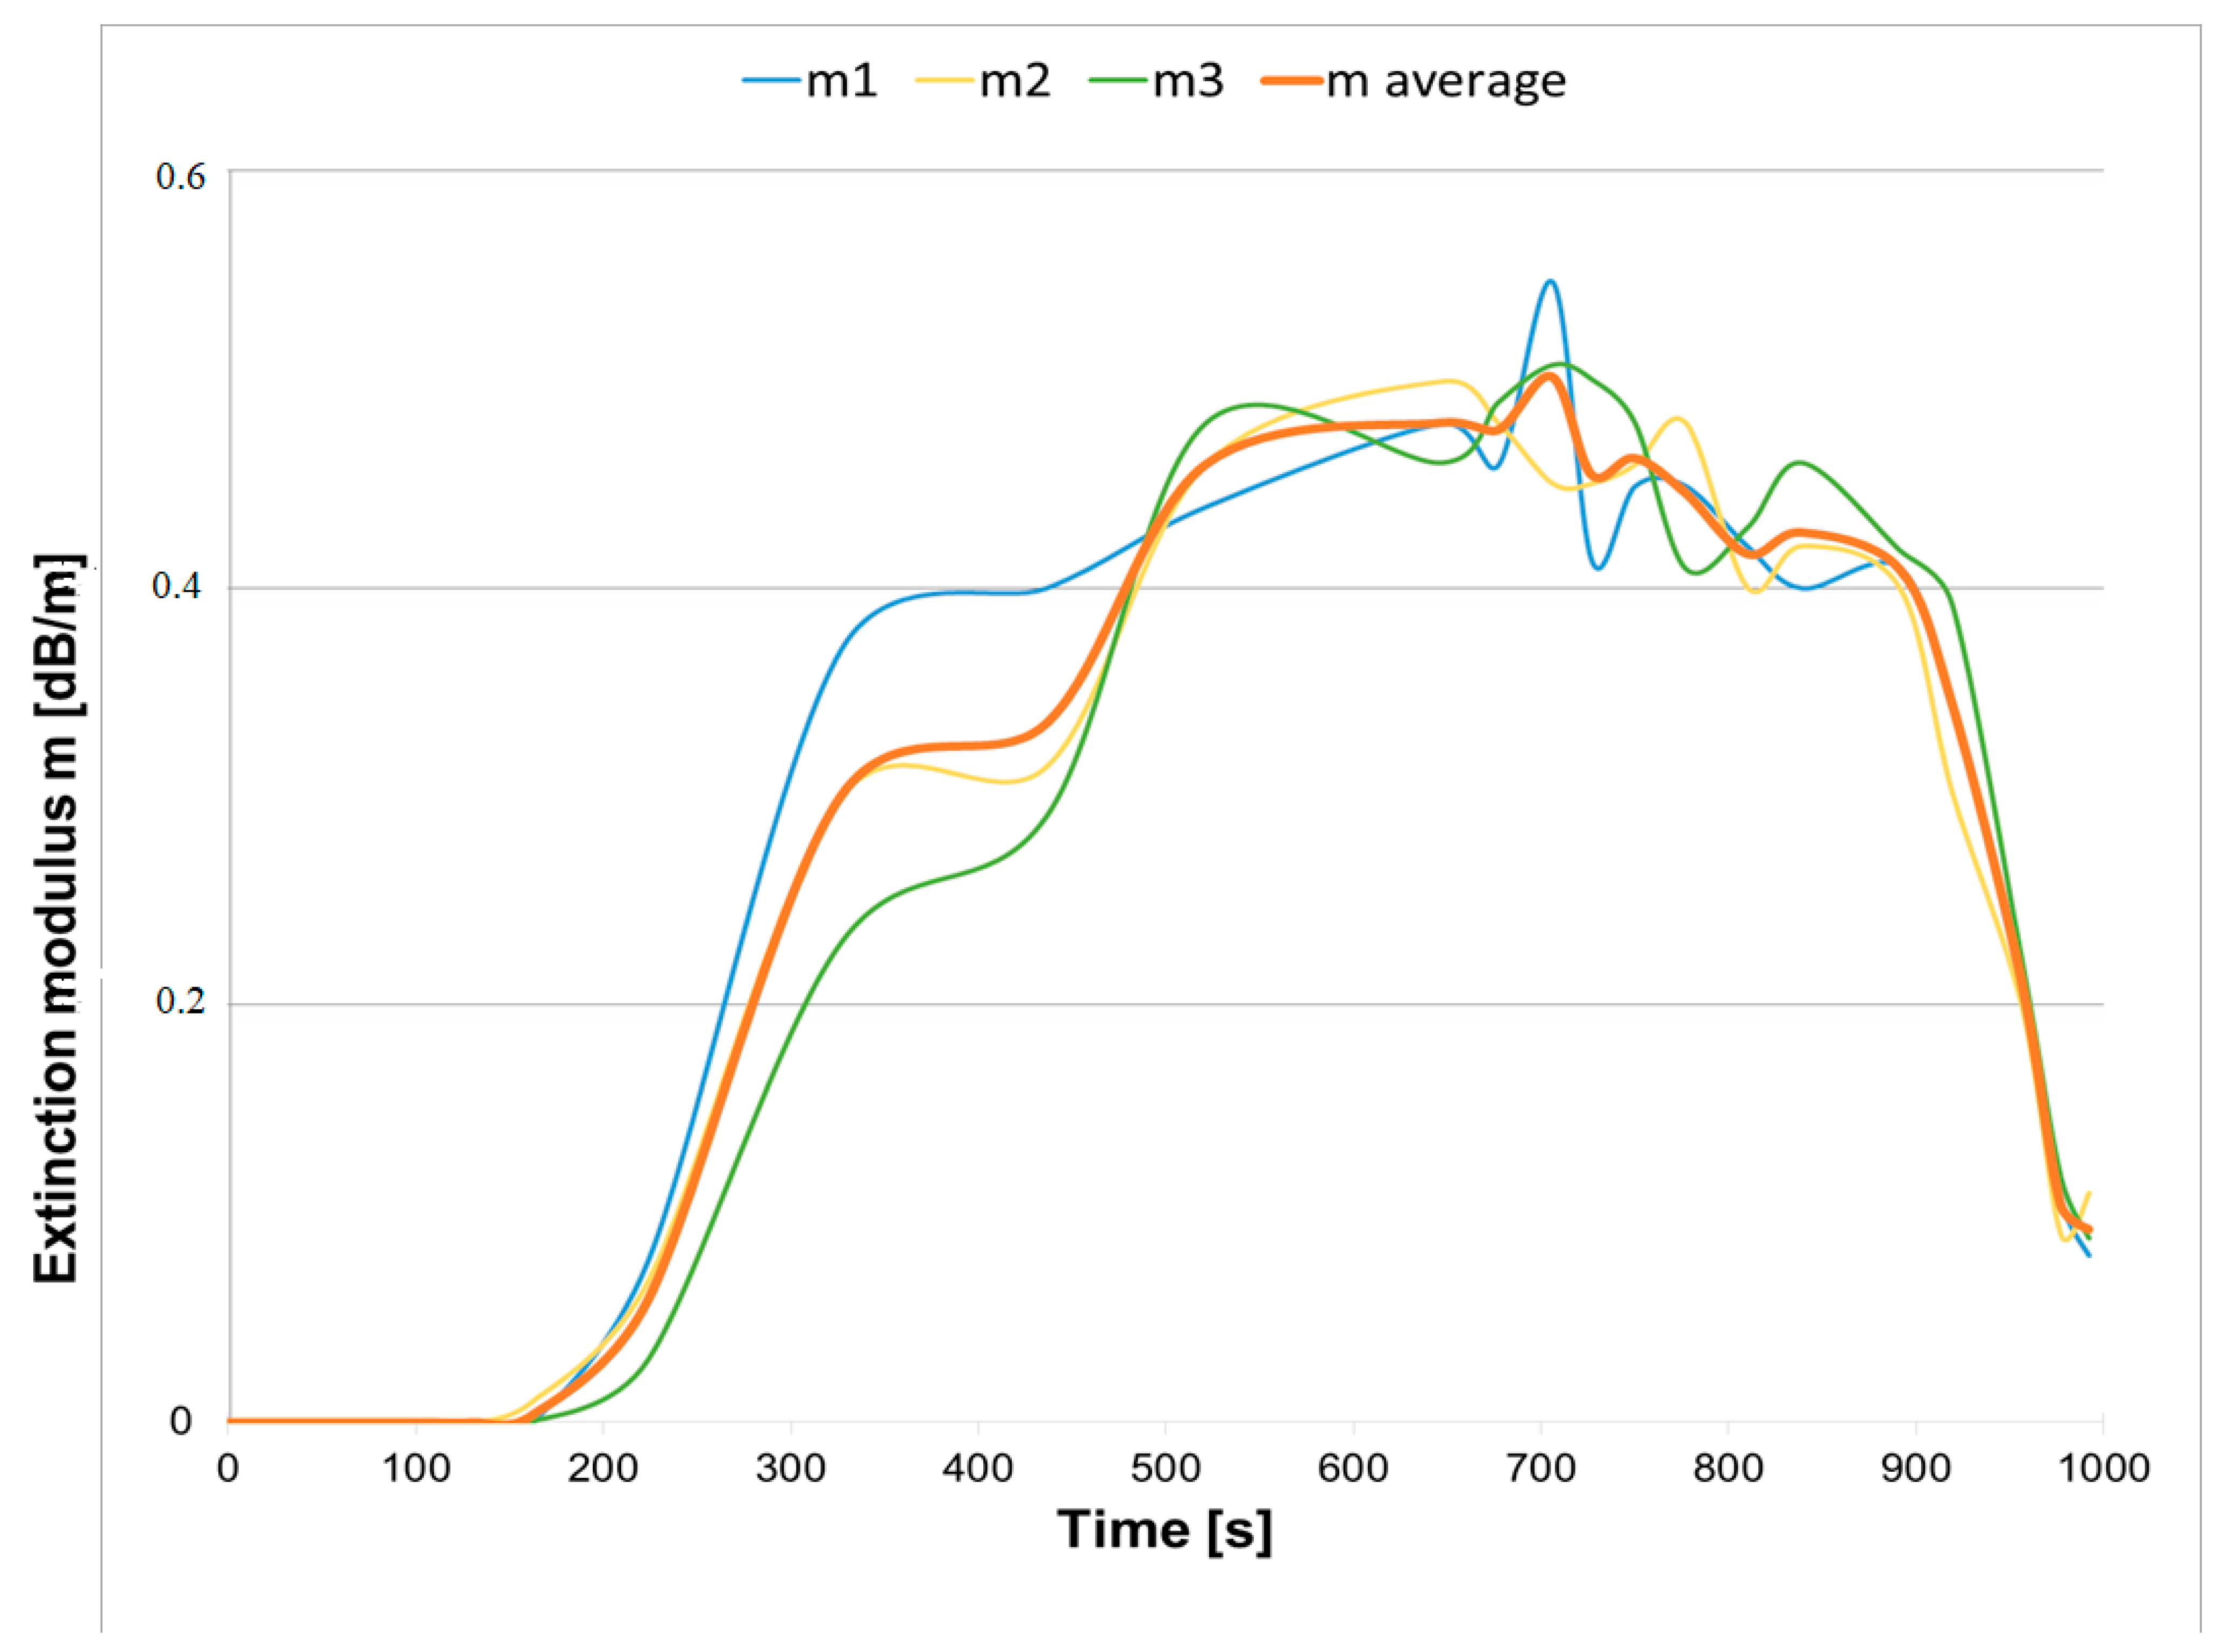
  • l—the length of the optical path measured in aerosol (m);
  • po—the radiation power received under non-aerosol conditions (dB);
  • p—the radiant power received in the presence of an aerosol (dB).

3. Results and Discussion

The A-F cable samples selected for testing were subjected to flaming and smoldering combustion processes initiated by a heating plate or by electric current flow through the copper wires. Changes in the extinction modulus and smoke concentration were examined for all tested cable samples. An exemplary graph of the extinction modulus (m) change as a function of time for cable A during smoldering combustion initiated by a heating field is shown in Figure 2.
The A–F cable samples selected for testing were subjected to flaming and smoldering combustion processes initiated by a heating plate or by electric current flow through the copper wires. Changes in the extinction modulus and smoke concentration were examined for all tested cable samples. An exemplary graph of the extinction modulus m change as a function of time for cable A during smoldering combustion initiated by a heating field is shown in Figure 2.
Based on the analysis of the results obtained for three tests, it can be concluded that the reproducibility of the measurements was at a satisfactory level. The results obtained for the average values of the extinction modulus (m) and the concentration of smoke (Y) are presented below. Changes in the mean extinction modulus (m) as a function of time for all cable samples in a smoldering combustion process initiated by a heating field or electrical current flow through wires and for flame combustion are shown in Figure 3a–c.
Based on the results obtained in the process of smoldering combustion initiated by the heating field, it can be seen that within 200 s after the heating of the heating plate, smoke particles reached the densitometer disposed on the ceiling.
Among the tested samples, cable F, for which the combustion process began the latest, after about 650 s, was significantly different. For this cable, the value of the extinction modulus was the smallest out of all the cables. In addition, it was observed that the smoke generated by the smoldering combustion of cable F (which had a silicone sheath) was significantly different from that of the other cables (a delicate mist made up of small particles which could be seen with the unaided eye) and did not diffuse the densitometer light beam.
On the other hand, the results obtained for the smoldering combustion initiated by the electrical current flow through the copper wires indicated clear differences in the course of this process compared to smoldering combustion initiated by a heating field. The value of the extinction modulus for cable C was measured only in the range of 100 to 200 s of test duration. After firing of the internal insulation through the heated wire of the cable, the value of the extinction modulus remained at the level of 0 dB/m. Moreover, the value of the extinction modulus for cable D for the duration of the test did not exceed 0.15 dB/m. The greatest extinction modulus value was measured for cable B with plasticized PVC insulation and sheath.
Based on the analysis of the results obtained for the process of flaming combustion, it can be concluded that the value of the extinction modulus for cables C and F was at the background level due to the lack of large smoke particles. The resulting smoke looked like a fog, which should be measured by an ionization chamber. Moreover, flaming combustion of cable A started from the beginning of the test, while the increase in extinction modulus deviated from the results for the other cables, as it was slower and about 300 s later the maximum during the test was reached. This result was probably related to the type of halogen-free material used and the cable construction.
The changes in the average concentration of smoke (Y) as a function of time for all cable samples in the smoldering combustion process initiated by a heating field or electrical current flowing through the wires and for flaming combustion are shown in Figure 4a–c.
Based on the results obtained for the smoldering combustion process initiated by a heating field, it can be stated that, after heating the heating plate, i.e., from about 150 s, the smoke particles began to reach the ionization chamber. In this phase of the fires, the smoke was invisible to the human eye. It should be emphasized that there was a clear difference between the results obtained for cable F and those obtained for the other cables. Particles formed in the combustion process of this cable reached the ionization chamber after a longer time, after 350 s of testing. The maximum smoke concentration value for this cable was the smallest value out of all those obtained for the cables tested and accounted for about 50% of the smoke concentration values of the other cables. For the extinction modulus, the difference was much greater, as the value of the cable F extinction modulus constituted 5% of the average value of the remaining cables. This confirms the observation that the smoke particles emitted during the combustion of the cable were only small (there were no large particles that would have scattered the light of the densitometer). This clear difference was due to the use of silicone rubber, which burns with the release of other products of combustion, and the process usually occurs at higher temperatures. Meanwhile, cables C and H achieved their maximum smoke concentrations 250 s earlier than the others.
During the smoldering combustion initiated by electric current flow through the copper wires of the cable samples, it was found that the insulation of cable F was cracked due to its internal heating. Cracks appeared on the surface of the cable, from which smoke emitted from the burned internal insulation was observed. For all cables, an increase in the smoke concentration parameter (Y) to the value of approx. 1 was observed, whereas sample F, after the heating and cracking of the insulation, burned without a flame over the entire surface, and in 850 s the measured value of Y was 2.65.
Based on the results obtained for flaming combustion, it can be concluded that, for all cables, the smoke concentration parameter Y increased. Cables C and F did not have a sharp maximum. As expected, the smoke emitted by cable F was detected by the ionization chamber. It should be emphasized that the combustion of cable A in the course of the test started from the beginning of the test, while the increase to the maximum value was slower (similar to the increase in the extinction modulus) and differed from those of the other cables.
It can be concluded that the largest extinction modulus (m) values were achieved in the course of the smoldering cable combustion tests initiated with the use of a heating field, while the smallest values were measured in the course of the flaming combustion tests. Moreover, the smallest values of smoke concentration (Y) were measured during the smoldering combustion initiated by electric current flow through the copper wires (exception: cable F). The highest values of smoke concentration (Y) were measured for the smoldering combustion cables initiated by a heating field.

3.1. The Operation Times of the Detectors

The following diagrams show the comparison of the operation times of the tested smoke detectors for smoldering and flaming combustion. The designation and type of detectors used are in accordance with Table 2. The average operation times of smoke detectors for cables during the smoldering combustion processes initiated by a heating plate or by electric current flow through the copper wires, as well as flaming combustions, are summarized in Figure 5.
On the basis of the obtained results, it can be stated that smoke detectors detected flaming combustion products more quickly than smoldering combustion products due to a higher temperature increase during combustion and the smoke particles reaching the detectors faster. In addition, for cable C, only detector 6 was activated due to the very small smoke particles generated during the combustion process. The optical detectors react faster to an increase in smoke concentration (Y) than the extinction modulus (m), e.g., cable F. It should be emphasized that fire detectors, for smaller values of extinction modulus (m), need more time to act. Linear detector 2, which was placed lowest in the chamber, did not detect a fire during 1000 s of test duration and for cable F did not work in any of the tests. The smoke detectors 1 and 6 detected fire in the shortest times, and, in addition, detector no. 6 was the only one that worked for all fires in time up to 1000 s.
The response times for the two linear detectors are shown in Figure 6.
The graphs show the time at which the smoke filled the test chamber during smoldering combustion initiated by a heating field or initiated by electric current flow and flaming combustion.
On the basis of the obtained results, it was found that, for cables C and H, during the smoldering combustion initiated by a heating field, smoke filled the chamber’s space at the lowest level for all the detectors in the shortest time (C-300 s and H-400 s), while, for the smoldering combustion initiated by the flow of electric current through wires, the chamber was filled with smoke in the case of cable B. Detector no. 2 was activated after 680 s. During the flaming combustion, the shortest time of filling of the chamber space to a height of 1.8 m was measured during the test with cable I (64 s).
The average changes in CO concentration as a function of time for the analyzed types of combustion are presented below.
The average values were determined as the arithmetic means of three measurements for the same type of cable. Such a number of measurements eliminates measurement errors and allows for averaging. Figure 7a–c show graphs for the concentration of CO for all cable samples as a result of smoldering combustion initiated by a heating field or by the flow of electric current through wires and for flaming combustion for each type of cable.
Based on the analysis of the smoldering combustion results initiated by a heating field, it can be concluded that the CO evolution began at about 240 s, and the maximum CO concentration value was measured for cable H, while, during the smoldering combustion initiated by the flow of electric current through the wires, cable C began to burn from the inside before the others, which can be seen in the m and Y curve charts (Figure 3b and Figure 4b). The maximum CO concentration value was measured for cable A. In the process of flaming combustion, CO production started about 50–100 s from the start of the test, and the maximum CO concentrations were twice as large compared to the values obtained during the smoldering combustion. In summary, it can be concluded that, for cables burned in the flaming combustion process, CO concentration values were the highest. Moreover, in the case of flaming combustion, the increase in CO concentration occurred the fastest, and the smallest CO concentration values were observed during smoldering combustion initiated by the flow of electric current through wires.

3.2. Toxic Gas Emission during Flaming and Smoldering Combustion

Diagrams of emission of CO2, CO, SO2, NO2, NO, HCN, HCl, HBr and HF in the chamber during smoldering combustion initiated by the heating field or by the flow of electric current through wires and flaming combustion for each type of cable are shown in Figure 8a–c.
Based on the above results, it can be concluded that the highest measured concentration of gas was observed for carbon dioxide and that the greatest concentration of carbon dioxide was emitted during the smoldering combustion initiated by the flow of electric current through cable wires in an amount of 950 ppm. In addition, the largest amounts of other toxic gases were released during the smoldering combustion initiated by the flow of electric current through wires. Toxic gases, such as hydrogen fluoride (HF), hydrogen cyanide (HCN) and hydrogen chloride (HCL), were emitted in concentrations of up to 10 ppm. In addition, very toxic gases, such as NO2 and NO, were released in concentrations of up to 8 ppm. Emission of hydrogen bromide (HBr) was noted only for cable B during smoldering combustion initiated by the flow of electric current through wires in an amount of 8 ppm. The observed phenomenon undoubtedly depends on the type of material used for the insulation of copper conductors, cable coatings and cable construction. Smoldering combustion initiated by the flow of electric current through the wires of cables with insulation and with coatings of plasticized PVC causes much higher emissions of CO and HCl compared to cables made of other materials, such as halogen-free, non-plasticized PVC and silicone rubber.

4. Conclusions

The presented results confirm the significant influence of combustion method on detector activation times for the cable samples. From the analysis of the measurement results, it can be concluded that the highest smoke concentration (Y) in the test chamber was achieved during flaming combustion. The highest extinction modulus values were measured during smoldering combustion initiated by the heating plate. The response time of the fire detectors was significantly influenced by the size of smoke particles and the rate of increase in their concentration. During flaming combustion, the smoke particles reached the fire detectors faster. The results obtained are consistent with data reported in the literature: optical smoke detectors are more sensitive to smoldering than flaming combustion. Only the suction system (detector 6) was able to detect all the test fires due to its having the most complex optical system.
Moreover, the characteristics of the cable insulation material, e.g., PVC type, had a significant influence on the toxicities of the emitted gases. The largest amounts of toxic gases were released during the smoldering combustion of cable B, which had a plasticized PVC sheath. This proves the high contents of various flame retardants and plasticizing additives compared to other cable sheathings made of plasticized PVC which do not emit such quantities of gases. The toxic gas for which the highest concentrations were observed was carbon dioxide, during smoldering combustion initiated by the flow of electric current. The release of CO began after about 240 s, and the maximum CO value was obtained for wire H (PVC). In contrast, during smoldering combustion initiated by the flow of electric current through the wires, wire C (mica tape banding and halogen-free plastic) began to burn from the inside earlier than the others. In the case of flame combustion, the increase in CO concentration was the fastest, and the lowest CO concentration values were observed during smoldering combustion initiated by the flow of electric current through the wires. The location of the fire detectors had an impact on the detectors’ activation times. Linear detectors should be mounted close to the ceiling. The obtained test results clearly show that the mode of combustion, i.e., smoldering or flaming, has a very large impact on the response time of detectors. The construction of the cable and the insulation material also had impacts on the results. In addition, the place where a detector was installed in the combustion chamber and the detection method used affected the detector’s fire detection time.

Author Contributions

Conceptualization, R.P., M.Z. and P.S.; methodology, P.S., M.Z. and T.P.; software, R.P., P.S. and J.G..; validation, R.K., P.B.-P. and P.R.; formal analysis, P.R.; investigation, P.B.-P. and P.S.; resources, P.S., R.P., P.B.-P. and A.C.; data curation, R.K. and A.L.; writing—original draft preparation, R.K. and R.P.; writing—review and editing, R.P., A.L. and R.K.; visualization, R.P.; supervision, J.G. and A.L.; project administration, R.K. and P.B.-P.; funding acquisition, P.B.-P. All authors have read and agreed to the published version of the manuscript.

Funding

This paper is the result of research project in frame of IDUB programme at AGH University of Science and Technology, Poland. The APC were funded by the Programme of the Polish Ministry of Science and Higher Education, the Regional Initiative of Excellence, financed by the Polish Ministry of Science and Higher Education on the basis of contract no. 025/RID/2018/19 of 28 December 2018; the amount of funding was PLN 12 million.

Institutional Review Board Statement

Not applicable.

Informed Consent Statement

Not applicable.

Data Availability Statement

Not applicable.

Conflicts of Interest

The authors declare no conflict of interest.

References

  1. Manan, N.; Idham, N.; Hasan, A.; Mariyah, N.; Faezah, N. Fire Risk Assessment of Residential Buildings Based on Fire Statistics from Selangor. J. Pharm. Sci. Innov. 2020, 7, 2321–2705. [Google Scholar]
  2. Huang, L.C.; Chang, H.C.; Chen, C.C.; Kuo, C.C. A ZigBee-based monitoring and protection system for building electrical safety. Energy Build. 2011, 43, 1418–1426. [Google Scholar] [CrossRef]
  3. Wnęk, W.; Boroń, S. Effect of smoke flow velocity on the fire protection systems. Przemysł Chemiczny. 2014, 93, 1946–1952. [Google Scholar]
  4. Kaczorek-Chrobak, K.; Fangrat, J. Influence of Constructional-Material Parameters on the Fire Properties of Electric Cables. Energies 2019, 12, 4569. [Google Scholar] [CrossRef] [Green Version]
  5. Fernandez-Pello, A.; Hasegawa, H.K.; Staggs, K.; Lipska-quinn, A.E.; Alvares, N.J. A Study of the Fire Performance of Electrical Cables. IAFSS 1991, 3, 237–247. [Google Scholar] [CrossRef] [Green Version]
  6. Torero, J. Flaming Ignition of Solid Fuels. In SFPE Handbook of Fire Protection Engineering, 5th ed.; Hurley, M.J., Gottuk, D.T., Hall, J.R., Jr., Harada, K., Kuligowski, E.D., Puchovsky, M., Torero, J.L., Watts, J.M., Jr., Wieczorek, C.J., Eds.; Springer: Berlin/Heidelberg, Germany, 2016; pp. 633–661. [Google Scholar] [CrossRef]
  7. Ahrens, M. Home Structure Fires; National Fire Protection Association: Quincy, MA, USA, 2018. [Google Scholar]
  8. Carcillo, M.; Caro, A.-S.; Sonnier, R.; Ferry, L.; Gesta, E.; Lagreve, C. Fire behaviour of electrical cables in cone calorimeter: Influence of cables structure and layout. Fire Saf. J. 2018, 99, 12–21. [Google Scholar]
  9. Klote, J.H.; Milke, J.A.; Turnbull, P.G.; Kashef AFerreira, M.J. Handbook of Smoke Control Engineering; ASHRAE: Atlanta, GA, USA, 2012. [Google Scholar]
  10. Blomqvist, P.; Rosell, L.; Simonson, M. Emissions from Fires Part I: Fire Retarded and Non-Fire Retarded TV-Sets. Fire Technol. 2004, 40, 39–58. [Google Scholar] [CrossRef]
  11. Blomqvist, P.; Rosell, L.; Simonson, M. Emissions from Fires Part II: Simulated Room Fires Part 2. Fire Technol. 2004, 40, 59–73. [Google Scholar] [CrossRef]
  12. Lyon, R.E. Solid State Thermochemistry of Flaming Combustion; Report 1999; Office of Aviation Research Washington USA: Washington, DC, USA.
  13. Ohlemiller, T.J. Modeling of Smoldering Combustion Propagation. Prog. Energy Combust. Sci. 1985, 11, 277–310. [Google Scholar] [CrossRef]
  14. Rein, G. Smouldering Combustion Phenomena in Science and Technology. Int. Rev. Chem. Eng. 2009, 1, 3–18. [Google Scholar]
  15. Stec, A.A.; Rhodes, J. Bench Scale Generation of Smoke Particulates and Hydrocarbons from Burning Polymers. In Fire Safety Science, Proceedings of the Tenth International Symposium 2011, Christchurch, New Zealand, 19–24 June 2011; International Association For Fire Safety Science: Tsukuba, Japan, 2011; pp. 629–640. [Google Scholar] [CrossRef]
  16. Braun, E.; Shields, J.R.; Harris, R.H. Flammability Characteristics of Electrical Cables Using the Cone Calorimeter; NIST Report, NISTIR 88 4003; Department of Commerce: Washington, DC, USA, 1989.
  17. Kaczorek-Chrobak, K.; Fangrat, J.; Papis, B.K. Calorimetric Behaviour of Electric Cables. Energies 2021, 14, 1007. [Google Scholar] [CrossRef]
  18. Tewarson, A.; Khan, M.M. Flame propagation for polymers in cylindrical configuration and vertical orientation. Symp. Int. Combust. 1989, 22, 1231–1240. [Google Scholar] [CrossRef]
  19. Xie, Q.; Zhang, H.; Tong, L. Experimental study on the fire protection properties of PVC sheath for old and new cables. J. Hazard. Mater. 2010, 179, 373–381. [Google Scholar] [CrossRef] [PubMed]
  20. Papazoglou, E. Flame Retardants for Plastics. In Handbook of Building Materials for Fire Protection; Harper, C.A., Ed.; McGraw-Hill: New York, NY, USA, 2004; pp. 4.1–4.88. [Google Scholar]
  21. Gong, T.; Xie, Q.; Huang, X. Fire behaviors of flame-retardant cables part I: Decomposition, swelling and spontaneous ignition. Fire Saf. J. 2018, 95, 113–121. [Google Scholar] [CrossRef]
  22. Marcilla, A.; Beltrán, M. Effect of the plasticizer concentration and heating rate on the thermal decomposition behaviour of PVC plastisols. Kinetic analysis. Polym. Degrad. Stab. 1988, 60, 1–10. [Google Scholar] [CrossRef]
  23. EN 50399:2011/A1:2016; Common Test Methods for Cables under Fire Conditions—Heat Release and Smoke Production Measurement on Cables during Flame Spread Test—Test Apparatus, Procedures, Results. CEN: Brussels, Belgium, 2011.
  24. Fangrat, J. Combustibility of building products versus fire safety. Bull. Pol. Acad. Sci. Tech. Sci. 2016, 64, 4. [Google Scholar] [CrossRef] [Green Version]
  25. Fazzini, T.; Perkins, R.; Grossman, D. Ionization and phtoelectric smoke alarms in rural Alaskan homes. West. J. Med. 2000, 173, 89–92. [Google Scholar] [CrossRef] [Green Version]
  26. Miller, T.; Bergen, G.; Ballesteros, M.; Bhattacharya, S.; Gielen, A.; Sheppard, M. Increasing smoke alarm operability through theory-based health education: A radomised trial. J. Epidemiol. Community Health 2014, 68, 1168–1174. [Google Scholar] [CrossRef]
  27. Ahrens, M. Smoke Alarm Presence and Performance in U.S. Home Fires. Fire Technol. 2011, 47, 699–720. [Google Scholar] [CrossRef]
  28. Moinuddin, K.; Bruck, D.; Shi, L. An experimental study on timely activation of smoke alarms and their effective notification in typical residential buildings. Fire Saf. J. 2017, 93, 1–11. [Google Scholar] [CrossRef] [Green Version]
  29. Kumar, A.; Gaur, A.; Singh, A.; Kumar, K.S.; Kulkarni, S.; Lala, K.; Kapoor, V.; Srivastava, S.C. Mukhopadhyay, Fire sensing technologies: A review. IEEE Sens. J. 2019, 19, 3191–3202. [Google Scholar]
  30. Sesseng, C. Mapping of Gas Concentrations, Effect of Deadair Space and Effect of Alternative Detection Technology in Smouldering Fires. SPFR Rep. A 2016, 16, 20053. [Google Scholar]
  31. Fleming, J.M. Smoke Detector Technology and the Investigation of Fatal Fires May 2000; Boston Fire Department: Boston, MA, USA, 2000.
  32. Mosisa Wako, F.; Pio, G.; Salzano, E. Reduced Combustion Mechanism for Fire with Light Alcohols. Fire 2021, 4, 86. [Google Scholar] [CrossRef]
  33. Fangrat, J.; Kaczorek-Chrobak, K.; Papis, B.K. Fire Behavior of Electrical Installations in Buildings. Energies 2020, 13, 6433. [Google Scholar] [CrossRef]
  34. Rehman, A.; Qureshi, M.A.; Ali, T.; Irfan, M.; Abdullah, S.; Yasin, S.; Draz, U.; Glowacz, A.; Nowakowski, G.; Alghamdi, A.; et al. Smart Fire Detection and Deterrent System for Human Savior by Using Internet of Things (IoT). Energies 2021, 14, 5500. [Google Scholar] [CrossRef]
  35. EN 13501-6:2018; Fire Classification of Construction Products and Building Elements—Part 6: Classification Using Data from rEaction to Fire Tests on Power, Control and Communication Cables. CEN: Brussels, Belgium, 2018.
  36. Available online: http://www.jascoint.co.jp/asia/products/spectroscopy/ftir/ftir4700.html (accessed on 10 February 2022).
  37. Bukowski, R.; Peacock, R.; Averill, J.; Bryner, N.; Walton, W.; Reneke, P.; Kuligowski, E. Performance of Home Smoke Alarms Analysis of the Response of Several Available Technologies in Residential Fire Settings. NIST Technical Note 1455-1. 2008. Available online: https://www.nist.gov/system/files/documents/2017/04/28/NIST_TN_1455-1_Feb2008.pdf (accessed on 11 February 2022).
  38. Gałązka, E.; Piechocka, E. Metody Obliczeniowe Wybranych Parametrów Palności, Wybuchowości i Dymotwórczości Substancji Chemicznych; SGSP: Warszawa, Poland, 2004. [Google Scholar]
  39. PN-EN 54:7; 2004/A2:2009 Fire Alarm Systems. Part 7: Smoke Detectors. Point Detectors Working with Scattered Light, Trans-mitted Light or Ionization. CEN: Brussels, Belgium, 2018.
Figure 1. Scheme of the experimental arrangement.
Applsci 13 03766 g001
Figure 2. Changes in the extinction modulus (m) as a function of time for cable A, smoldering combustion initiated by a heating field.
Applsci 13 03766 g002
Figure 3. (ac) Changes in the mean extinction modulus (m) as a function of time for all cable samples in flaming and smoldering combustion processes. (a) Smoldering combustion process initiated by a heating field. (b) Smoldering combustion process initiated by electric current flow through the copper wires. (c) Flaming combustion.
Applsci 13 03766 g003aApplsci 13 03766 g003b
Figure 4. Changes in smoke concentration (Y) as a function of time for all cable samples in smoldering and flaming combustion processes. (a) Smoldering combustion process initiated by a heating field. (b) Smoldering combustion process initiated by electric current flow through the copper wires. (c) Flaming combustion.
Applsci 13 03766 g004aApplsci 13 03766 g004b
Figure 5. The average operation times of smoke detectors 1–6 for cables during smoldering and flaming combustions.
Applsci 13 03766 g005aApplsci 13 03766 g005bApplsci 13 03766 g005cApplsci 13 03766 g005d
Figure 6. The response times for the two linear detectors during smoldering and flaming combustion.
Applsci 13 03766 g006aApplsci 13 03766 g006b
Figure 7. (ac) The concentrations of CO for all cable samples as a result of smoldering and flaming combustion. (a) Smoldering combustion initiated by a heating field. (b) Smoldering combustion initiated by the flow of electric current through wires. (c) Flaming combustion.
Applsci 13 03766 g007aApplsci 13 03766 g007b
Figure 8. (ac) Toxic gas emissions for all cable samples as a result of smoldering and flaming combustion. (a) Smoldering combustion initiated by the heating field. (b) Smoldering combustion initiated by the flow of electric current through wires. (c) Flaming combustion.
Applsci 13 03766 g008aApplsci 13 03766 g008b
Table 1. Test cables’ characteristics.
Cable MarkingInsulation and/or Sheath MaterialNumber and Rated Diameter of Wires (mm2)Cable
Diameter (mm)
Information about Cable
Cable AHalogen-free plastic5 × 2 × 0.810.9Control cable with multi-wire copper conductors, in halogen-free plastic insulation and in halogen-free plastic coating
Cable BPlasticized PVC3 × 4.010.3Control cable with multi-wire copper wires, PVC insulation and PVC coating
Cable CMica tape banding and halogen-free plastic2 × 2 × 1.411.6Telecommunication cable resistant to fire, with copper wires insulated with mica tape and halogen-free insulation with a high oxygen index and a halogen-free plastic coating
Cable DPlasticized PVC1 × 2 × 1.410.0Telecommunication cable, with single-wire copper conductors, PVC insulation and flame-retardant PVC coating
Cable EPlasticized PVC5 × 2 × 0.810.9Multi-wire cables, PVC insulation, copper braid shield
Cable FSilicone3 × 1.58.5Recommended applications include foundries, steel mills, glass factories, baking equipment, burners, heating and lighting systems
Cable GPlasticized PVC3 × 2.5 10.4Wire with copper conductors, PVC wire insulation, rubber coatings for housing applications
Cable HPVC3 × 1.58.9Halogen-free, does not spread the flame, low smoke emission
Cable IRubber2 × 2.5 12.7Control cable with multi-wire copper conductors, rubber insulation
Table 2. Distribution of smoke detectors detecting smoke particles in the combustion chamber.
No.Detector TypeInstallation Place in the Combustion Chamber
1Linear detectorHeight 3.8 m,
1 m from the center of the chamber
2Linear detector Height 2.8 m,
1 m from the center of the chamber
3Optical detector plus CO detectorOn radius R = 3 m, mounting height 3.9 m
4Optical detector plus CO detectorOn radius R = 3 m, mounting height 3.9 m
5Optical detector plus CO detector Height 1.8 m,
1 m from the center of the chamber
6Suction detector (suction system)Height 3.85 m,
1 m from the center of the chamber
Disclaimer/Publisher’s Note: The statements, opinions and data contained in all publications are solely those of the individual author(s) and contributor(s) and not of MDPI and/or the editor(s). MDPI and/or the editor(s) disclaim responsibility for any injury to people or property resulting from any ideas, methods, instructions or products referred to in the content.

