1. Introduction
Nowadays, as people pay more and more attention to environmental protection, how to reduce the energy consumption and exhaust emissions of vehicles has become an important trend in vehicle research and development [
1,
2,
3]. Structural lightweight is an important means to achieve this goal. There are two ways to realize the lightweight of automobile structure: optimization of automobile structure design and lightweight of body material [
4,
5,
6]. High-strength steel is a relatively mature, lightweight material with great application and development prospects. The use of high-strength steel can reduce the thickness of the steel plate on the basis of ensuring the strength and stiffness of the body so as to effectively reduce the weight of the body and then greatly reduce the fuel consumption, ultimately achieving energy saving and environmental protection [
7,
8,
9,
10].
BR1500HS high-strength steel is a kind of high-performance material that can realize the lightweight of an automobile body and also meet the safety performance of automobile crashes [
11,
12]. This kind of steel has good formability, high-temperature plasticity, and low resilience [
13]. After hot stamping and quenching, the tensile properties and hardness of the material have been greatly improved, and it is widely used in automobile reinforced structures and high-strength parts [
14]. Due to the high strength of the high-strength steel body, the biggest problem in the application is the connection strength of the weld. To give full play to the advantages of high-strength steel, advanced welding methods must be used to obtain welded joints with qualified mechanical properties.
Laser welding technology is more and more widely used in high-strength steel and aluminum alloy materials, which can improve the strength of the weld, reduce the width of the heat-affected zone and reduce the softening of the heat-affected zone, so the weld formed by laser welding has better mechanical properties [
15,
16,
17]. The good performance of welded joints depends on the appropriate welding process, so the selection of welding process parameters is very important [
18].
At present, some research achievements have been made in laser welding of high-strength steel. Chen et al. [
19] explored the influence of different oscillation modes on the properties and microstructure of ultra-high-strength steel and found that laser welding with the circular oscillation mode has the best tensile properties and microhardness among the four explored oscillation modes. Hietala et al. [
20] investigated the double lap joints of LS and UHS steels fabricated by laser welding at different energy densities and found that fatigue cracks nucleated at the intersection of the HAZ and the plate boundary in the welded zone. Razmpoosh et al. [
21] researched different joints of the third generation AHSS by characterizing the mechanical behavior and the evolution of microstructure and found that because of local tempering of initial martensite in the material structure, there is severe HAZ softening within the HAZ on the TRIP1100 and 22MnB5 sides of the joint. Alves et al. [
22] investigated the influence of welding parameters on the mechanical behavior and microstructure changes of ultra-high-strength dual-phase steels. Zhao et al. [
23] studied the mechanical behavior and microstructural evolution of dissimilar joints obtained under different heat inputs by laser welding.
At present, the research on the welding of BR1500HS high-strength steels mainly adopts resistance spot welding, while the research on laser welding is very limited and only stays on the rough exploration of process parameters. Therefore, in this paper, BR1500HS high strength steel was laser welded under various process parameters. The welded samples were heated in a furnace for 5 min with a temperature of 900 °C and then water-quenched. The effects of process parameters and quenching process on mechanical properties and microstructure of the joints were investigated to provide valuable guidance for BR1500HS steel welding. The effects of process parameters of laser power and welding speed on the tensile strength, fracture morphology, microhardness, and weld formation are analyzed, and the influence of the quenching process on the grain diameter, grain orientation, and phase of the joint is revealed.
2. Materials and Methods
2.1. Materials
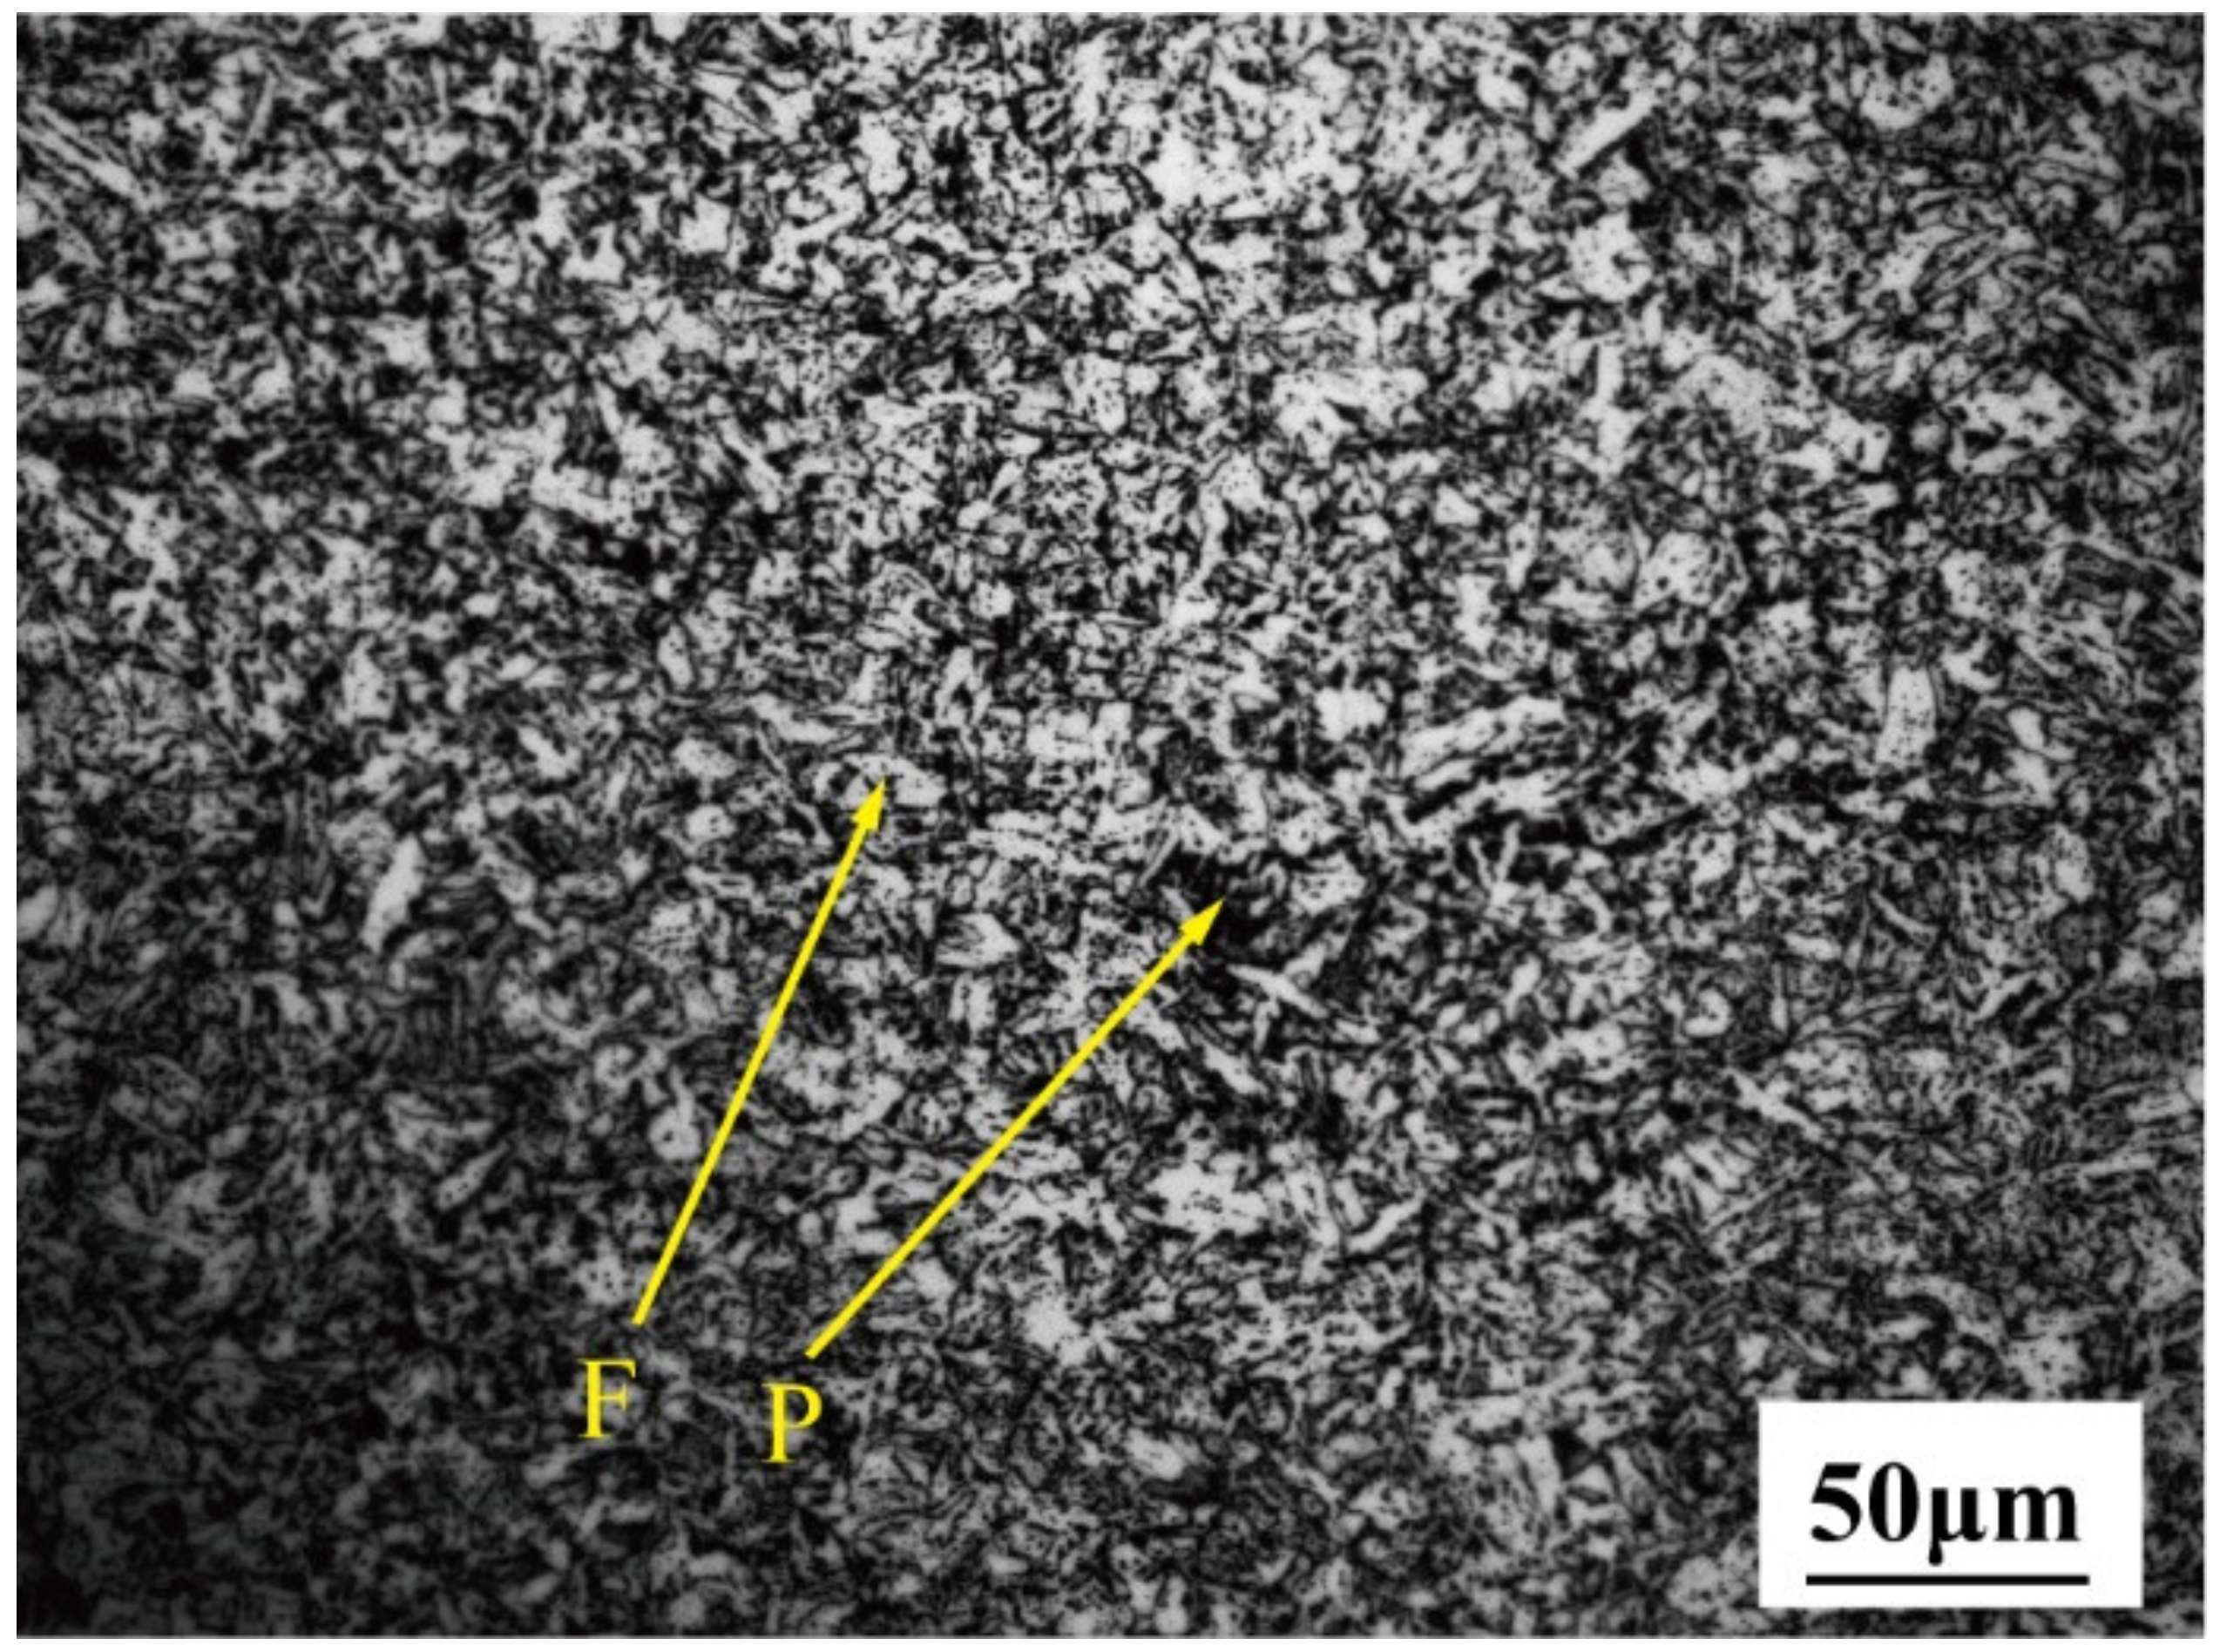
The material of the experimental sample was hot-rolled BR1500HS steel, provided by Baosteel (Shanghai, China), with a thickness of 3.5 mm. The chemical compositions of BR1500HS are listed in
Table 1. The material was in the hot-rolled supply state with a tensile strength of about 630 MPa. After quenching, the tensile strength can reach 1800 MPa [
3,
24,
25]. The original microstructure is shown in
Figure 1, consisting of pearlite and ferrite.
2.2. Laser Welding
The laser welding experiments of BR1500HS were performed by the RFL-C4000W fiber laser system. The maximum power of the system is 4000 W and the wavelength is 1064 ± 5 nm. The industrial robot MOTOMAN-GP50 carried out the welding process. The experimental material was cut into 240 mm × 120 mm blanks. Before assembling, the blanks were polished with sandpaper to remove the oxide and corroded surface. During the welding process, pure argon was adopted as the shielding gas. The schematic illustration of the welding process and the field experiment image are shown in
Figure 2. The process parameters are listed in
Table 2. When the welding process was finished, the samples were heated in a furnace for 5 min at a temperature of 900 °C and then quenching them using a water-cooled die.
2.3. Mechanical Properties Tests
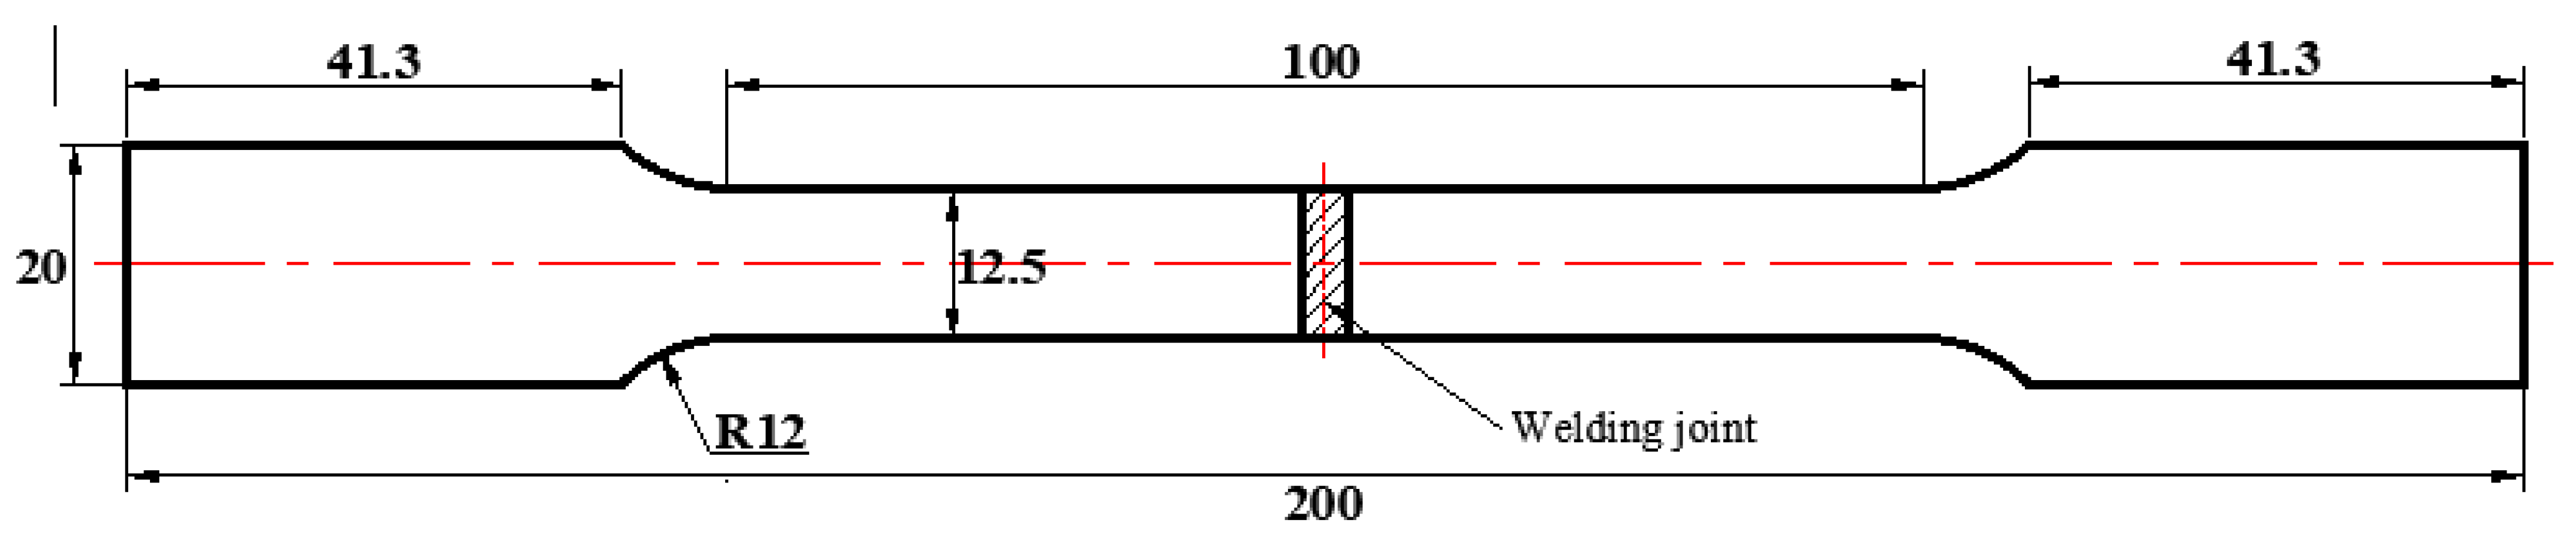
Tensile tests were carried out to research the effects of process parameters on the mechanical properties of welded joints. The samples were cut from blanks by wire-electrode cutting according to ISO 6892-1:2019 [
26]. The dimensions of the tensile samples are shown in
Figure 3. The samples before and after quenching were tested on an SHT4106 universal material test machine for the tensile strength of the welded joints. The tensile tests were performed with the loading speed of 1 mm/min and were repeated four times.
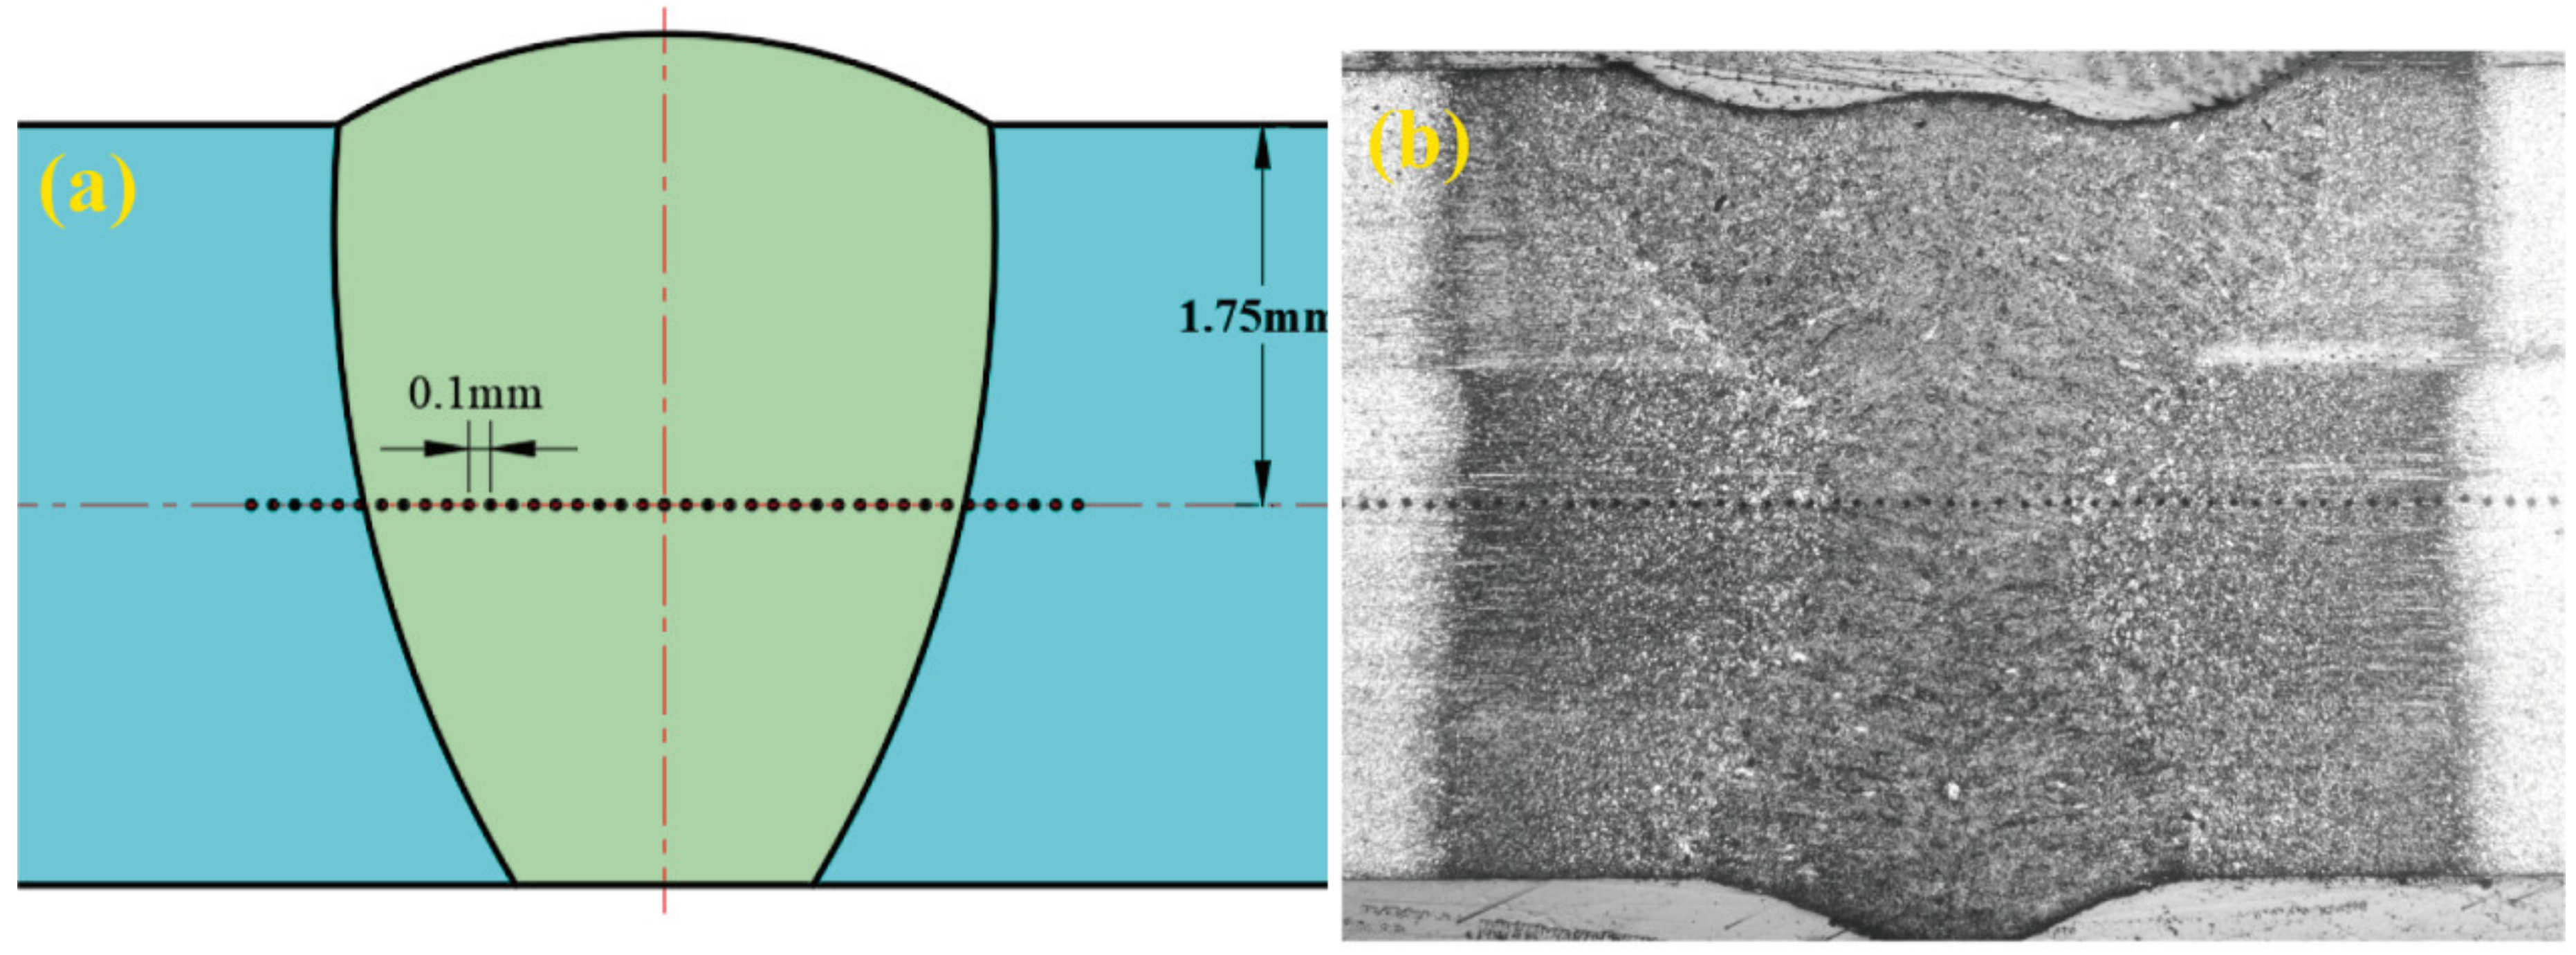
The Vickers hardness tests were performed on the cross-section of welded joints using an HV-1000A Vickers hardness tester, with a load of 500 g, and a holding time of 15 s. The distribution of microhardness test points is shown in
Figure 4. The distance between every two test points was 0.1 mm. Each point was tested three times and the average value of the three measurements was taken as the result.
2.4. Characterization
The welded samples before and after quenching were made into metallographic specimens, which were polished with sandpaper and then polished with polishing fluid. Then 4% nitric acid alcohol was used to corrode the specimens for 10–20 s. The Zeiss Axio Scope A1 optical microscope (OM) was used to magnify to 25 times and 500 times to observe the macrostructure and microstructure of the weld joints, respectively. The electron backscatter diffraction (EBSD) test was carried out by Quanta FEG 450 scanning electron microscopes (SEM) to analyze the change in the grain size, grain boundary, grain orientation, and the distribution of retained austenite before and after quenching. The Hitachi SU8010 field emission scanning electron microscope (SEM) was used to capture high magnification images of the fracture surfaces of the tensile specimens.
3. Results and Discussion
3.1. Effect of Heat Input on Tensile Strength
The tensile test results of all the samples before and after quenching are shown in
Table 3. Laser power and welding speed are two important process parameters that have a significant impact on the tensile strength of the welded joint. The ratio of laser power to welding speed is defined as heat input, which takes into account the effects of the two parameters. The expression for heat input is as follows:
where
q is the input,
P is the laser power, and
v is the welding speed.
From
Table 3, before quenching, the fracture position of all the samples is on the base material (BM). For all the samples, the tensile strength of the BM is about 630 MPa. It’s obvious that the welded joints have good mechanical properties and excellent formation. After quenching, the tensile strength of BM can reach 1800 MPa, while the maximum tensile strength of the welded joint is 1644 MPa. The fracture position of all the samples is on the joint. It indicates that the joint is the weakest area. The tensile strength of all the joints is lower than that of the BM because the BM is in the quenched state, which is the highest strength obtained by the optimal quenching process of BR1500HS. However, the thermal process of laser welding will affect the quenching process, resulting in a decrease in the tensile strength of the welded joint [
27]. The tensile strength of all the samples at different heat inputs after quenching is shown in
Figure 5. We can see when the heat input is low, the tensile strength of the samples is also low. And when the heat input increases, the tensile strength gradually increases. When the value of heat input is 1440 J/cm, the tensile strength of the joint reaches a maximum value and then decreases. When the value of heat input is below 1440 J/cm, the BM is not completely fused because the heat input is low. The tensile strength of the joint is insufficient, which is less than 1500 MPa. Therefore, to achieve complete penetration, the value of heat input must be greater than 1440 J/cm during the laser welding process. As the heat input increases, the tensile strength of the joint decreases when the value of heat input is greater than 1440 J/cm. The reason for the above trend is that, as the heat input increases, the range of the HAZ becomes larger, also the range of the BM affected by the welding thermal cycle becomes larger. Therefore, then the grain size increases. At the same time, as the heat input increases, the volume of martensite (M) also decreases. Due to the above two reasons, the tensile strength of the joint will decrease. For BR1500HS ultra-high-strength steel after quenching, the value of heat input should be kept above 1440 J/cm to obtain the optimal tensile strength. Therefore, according to the experimental results, it can be found that heat input is a very important process parameter in the process of autogenous laser welding, which can reflect the mechanical properties of the joint more specifically.
3.2. Fracture Morphology
All tensile samples fracture at the base material before quenching and fracture at the joint after quenching. The fracture morphology is very similar. Therefore, the fracture morphology of samples No. 4
# and No. 5
# are taken as an example to analyze. The fracture morphologies of the base material of samples No. 4
# and No. 5
# before quenching are shown in
Figure 6a and
Figure 7a and the fracture morphologies of the joint of samples No. 4
# and No. 5
# after quenching are shown in
Figure 6b and
Figure 7b. As shown in
Figure 6a and
Figure 7a, the fracture surface of the base material is plastic macroscopically, and the surface is not flat. It consists of fiber area, extension area, and sheer lip. The fracture is very close to the “quasi-cleavage” of the “cleavage” morphology. The dimples of the base material are small and dense, with few secondary microcracks distributed on the fracture surface. The microstructure of the joint consists of martensite with high strength and brittleness after quenching. Therefore, as can be seen from
Figure 6b and
Figure 7b, after quenching, there are the cleavage facets, few shallow dimples, and dissociation river patterns in the fracture morphology. Moreover, the fracture morphology is smooth, signifying that a small plastic deformation occurred before the fracture and the fracture surface is brittle macroscopically.
3.3. Microhardness
3.3.1. Effect of Welding Speed on Microhardness
Welding process parameters and quenching process have a great impact on the microhardness of welded joints. When the laser power is 2600 W, the microhardness of the joint before and after quenching at different welding speeds is shown in
Figure 8. As can be seen from
Figure 8a, before quenching, the microhardness of FZ, CGZ, and FGZ is higher than BM and IRZ due to a large amount of martensite. The microhardness of the former is greater than 400 HV, while that of BM is only about 200 HV. This also explains why the strength of the joint is higher than that of BM before quenching. As the welding speed increases, the width of FZ and HAZ gradually decreases, which can also be seen in
Figure 9. It can be seen from
Figure 8a that all samples exist in the softened area in the HAZ. The hardness drops to a minimum in the critical zone and then rises linearly. The softening occurs near the base metal in the HAZ because of the area between the peak temperature
~
in the HAZ is not completely quenched and the martensite in the area below the temperature
is tempered. The two parts jointly form the softened area and the softest spot appears in the interface between the quenching zone and the tempering zone. In
Figure 8a, when the laser power is constant and the welding speed increases, the minimum hardness increases, and the width of the softened area decreases. The width of the softened area reflects the isotherm distribution of the temperature field and the minimum hardness reflects the thermal cycle of each temperature point. As the welding speed increases, the temperature field elongates in the welding direction, the area below
becomes narrower. Therefore, the softened area becomes narrower. The high welding speed will shorten the maintenance time of each temperature point and the cooling rate will be fast. The original structure will be less affected, so the minimum hardness will increase [
28].
Figure 8b shows the microhardness of the joint after quenching at different welding speeds. After quenching, the microstructure of the FZ, HAZ, and BM transforms into martensite and a small number of retained austenite with uniform grains. As a result, the microhardness of all joint areas becomes more uniform and is between 400 HV and 500 HV. The microhardness of BM increased significantly from about 200 HV to about 475 HV, while the microhardness of FZ, CGZ, and FGZ increased slightly after quenching.
3.3.2. Effect of Laser Power on Microhardness
When the welding speed is 75 cm/min, the microhardness of the joint before and after quenching under different laser powers is shown in
Figure 10. It can be seen from
Figure 8a that as the laser power increases, the widths of FZ and HAZ first increase and then decrease, reaching the maximum value when the power is 3000 W, which can also be seen in
Figure 11. It can also be seen from
Figure 9a that when the welding speed is constant, as the power increases, the change in the width of the softened area and the minimum hardness is different. When the welding speed is constant and the laser power increases, the power absorbed by the molten pool does not necessarily increase, but the energy of the plasma on the upper and back of the workpiece increases. This part of the energy will transmit to the workpiece through conduction and radiation, so the width of the softened area increases [
29,
30]. The thermal cycle of each temperature point is mainly affected by the welding speed. The welding speed remains unchanged, and the change in the thermal cycle of each temperature point is not obvious, so the minimum hardness does not change significantly.
Figure 9b shows the microhardness of the joint after quenching under different laser powers. The microhardness of the whole joint is between 400 HV and 500 HV. Furthermore, the distribution of the microhardness is uniform. According to the microhardness analysis, it can be concluded that the process parameters, including welding speed and laser power, only impact the microhardness of the joint before quenching and have little influence on the microhardness of the joint after quenching. The quenching process significantly increases the hardness of BM and IRZ, while for FZ, CGZ, and FGZ, it is only a process of homogenizing the microstructure and microhardness.
3.4. Effect of Process Parameters on Weld Formation
When the laser power is 2600 W, the macro morphology of the joint under different welding speeds is shown in
Figure 10; when the welding speed is 75 cm/min, the macro morphology of the joint under different laser power is shown in
Figure 11. It can be seen from
Figure 10 and
Figure 11 that all the samples are deep penetration. As can be seen from
Figure 10, when the laser power is 2600 W, the cross-sectional shape of the weld joint is the “wine glass”. With the increase in welding speed, each part of the “wine glass” shrinks in almost the same proportion. As is shown in
Figure 11, as laser power increases, the foot of the “wine glass” gradually becomes thicker and transits to an “hourglass” shape. As the laser power increases to 3000 W, the cross-section becomes a typical “hourglass” shape.
For in-depth analysis, taking the connecting line where the curvature of the fusion line profile changes the most as the boundary, the cross-section of the weld is divided into two parts, the upper part is the “smooth segment”, and the lower part is the “deep segment”, as shown in
Figure 12. The parameters of the weld shape are as follows: front-bead width A, back-bead width B, and the height of smooth segment H.
Figure 13 shows the changes in the parameters of the weld shape with the welding speed and laser power. It can be seen from
Figure 13a that when the laser power is constant, the front-bead width A, back-bead width B, and the height of smooth segment H all decrease as the welding speed increases.
Figure 13b shows that when the welding speed is constant, the shape of the weld is affected by the laser power more complicatedly. The back-bead width B increases as the laser power increases, while the front-bead width A and the height of the smooth segment H increase first and then decrease. The front-bead width A reaches the maximum when the laser power is 3000 W, and the height of the smooth segment H does not change much.
All samples are deep penetration; that is, a stable “keyhole” is formed during the welding process, and the keyhole is the heat source that forms the molten pool [
29]. After the keyhole penetrates, the plasma in the hole will be ejected from the opening at the bottom of the keyhole, taking away a part of the heat. And some of this energy will conduct and radiate to the bottom of the molten pool on the back of the workpiece, which will increase the back-bead width. As the plasma is ejected out of the hole, it promotes the energy to transfer from the upper part of the keyhole downward so that the strength of each part of the cone is uniform. The Marangoni flow in molten pool results in the basic shape of the “hourglass” of the penetration weld, and the difference in the strength of each part of the combined heat source causes the size of each part of the “hourglass” to change.
The higher the laser power is, the more plasma is generated by the ionization of the metal vapor in the hole. Then the temperature and density increase. When the pressure inside the keyhole increases, the plasma erupts at the bottom of the hole more intensely, and the heat source outside the hole increases. At the same time, the intensity of the heat source inside the hole transfers downward. In short, as laser power increases, the energy obtained at the bottom of the molten pool increases, but the energy obtained at the top of the molten pool does not necessarily or even reduces. Moreover, the energy obtained by the entire molten pool is not necessarily positively correlated with the laser power as the energy is taken away by the plasma ejection [
30,
31]. Therefore, when the laser power increases from 1800 W to 3400 W, the back-bead width decreases gradually, while the front-bead width and the height of the smooth segment increase first and then decrease. When the laser power is constant and the welding speed increases, the energy obtained by the whole molten pool decreases. Moreover, the weld pool elongates in the direction opposite to the welding speed and its width decreases. Therefore, the front-bead width, back-bead width, and the area of weld all decrease.
3.5. Microstructure
As the microstructures of all the samples are analogous, the microstructure of sample No. 4# is taken as the research object.
3.5.1. Microstructure before Quenching
Figure 14 illustrates the microstructure of the weld joint before quenching. The macro morphology of the welded joint is shown in
Figure 14a. The welded joint consists of the base material (BM), heat-affected zone (HAZ), and fusion zone (FZ). After laser welding, the cooling rate of the FZ is very high and it is instantly solidified from the liquid state. As shown in
Figure 14b, the microstructure of the FZ is mainly martensite (M). The HAZ may be classified into an incomplete recrystallization zone (IRZ), coarse grain zone (CGZ), and fine grain zone (FGZ) based on different grain morphologies and the composition of the microstructure. During the welding process, the heating temperature of the metal in the CGZ and FGZ is above
, so that the metal is fully austenitized. Therefore, the microstructure of these two regions is composed of martensite. As shown in
Figure 14c, the welding thermal cycle experienced by CGZ causes severe growth of austenite grains, which eventually transformed into coarse M and retained austenite (RA). Compared with the CGZ, the metal in the FGZ is heated to a lower temperature. The residence time at high temperatures is short and the growth of grains is not apparent. Therefore, the M in the FGZ is much finer than that in the CGZ, as shown in
Figure 14d. In the IRZ, the peak temperature of this zone is between
and
, and only part of the pearlite (P) is austenitized and transformed into a small amount of M after rapid cooling. Therefore, as shown in
Figure 14e, the microstructure of IRZ consists of ferrite (F) and M. The metal in the BM has not experienced the thermal cycle and almost does not have microstructure transformation. As shown in
Figure 14f, the microstructure is still composed of F and P.
3.5.2. Microstructure after Quenching
Figure 15 shows the microstructure of welded joint after quenching. The macro morphology of the welded joint is shown in
Figure 15a. The boundaries of the FZ, HAZ, and BM are hard to differentiate after quenching. The microstructure of the three zones is transformed into M and retained austenite (RA), which are shown in
Figure 15b–d, respectively. The grain size of the M in the HAZ is roughly the same and there is no obvious difference, as shown in
Figure 15c. However, the influence of the heat treatment process on the grain refinement of FZ is more prominent. As shown in
Figure 15b, in the FZ, there are many irregular grains. Moreover, the grain size is not uniform. Because of the restraint of grain size on the growth of M, the M in the FZ is finer than that in other regions. As shown in
Figure 15d, the distribution of M in the BM is more uniform than in the FZ and HAZ.
3.6. EBSD Analysis
For the purpose of investigating the effect of the quenching process on the grain diameter, grain orientation, and phase of joint, sample No. 4# was researched by EBSD test before and after quenching.
3.6.1. Grain Size
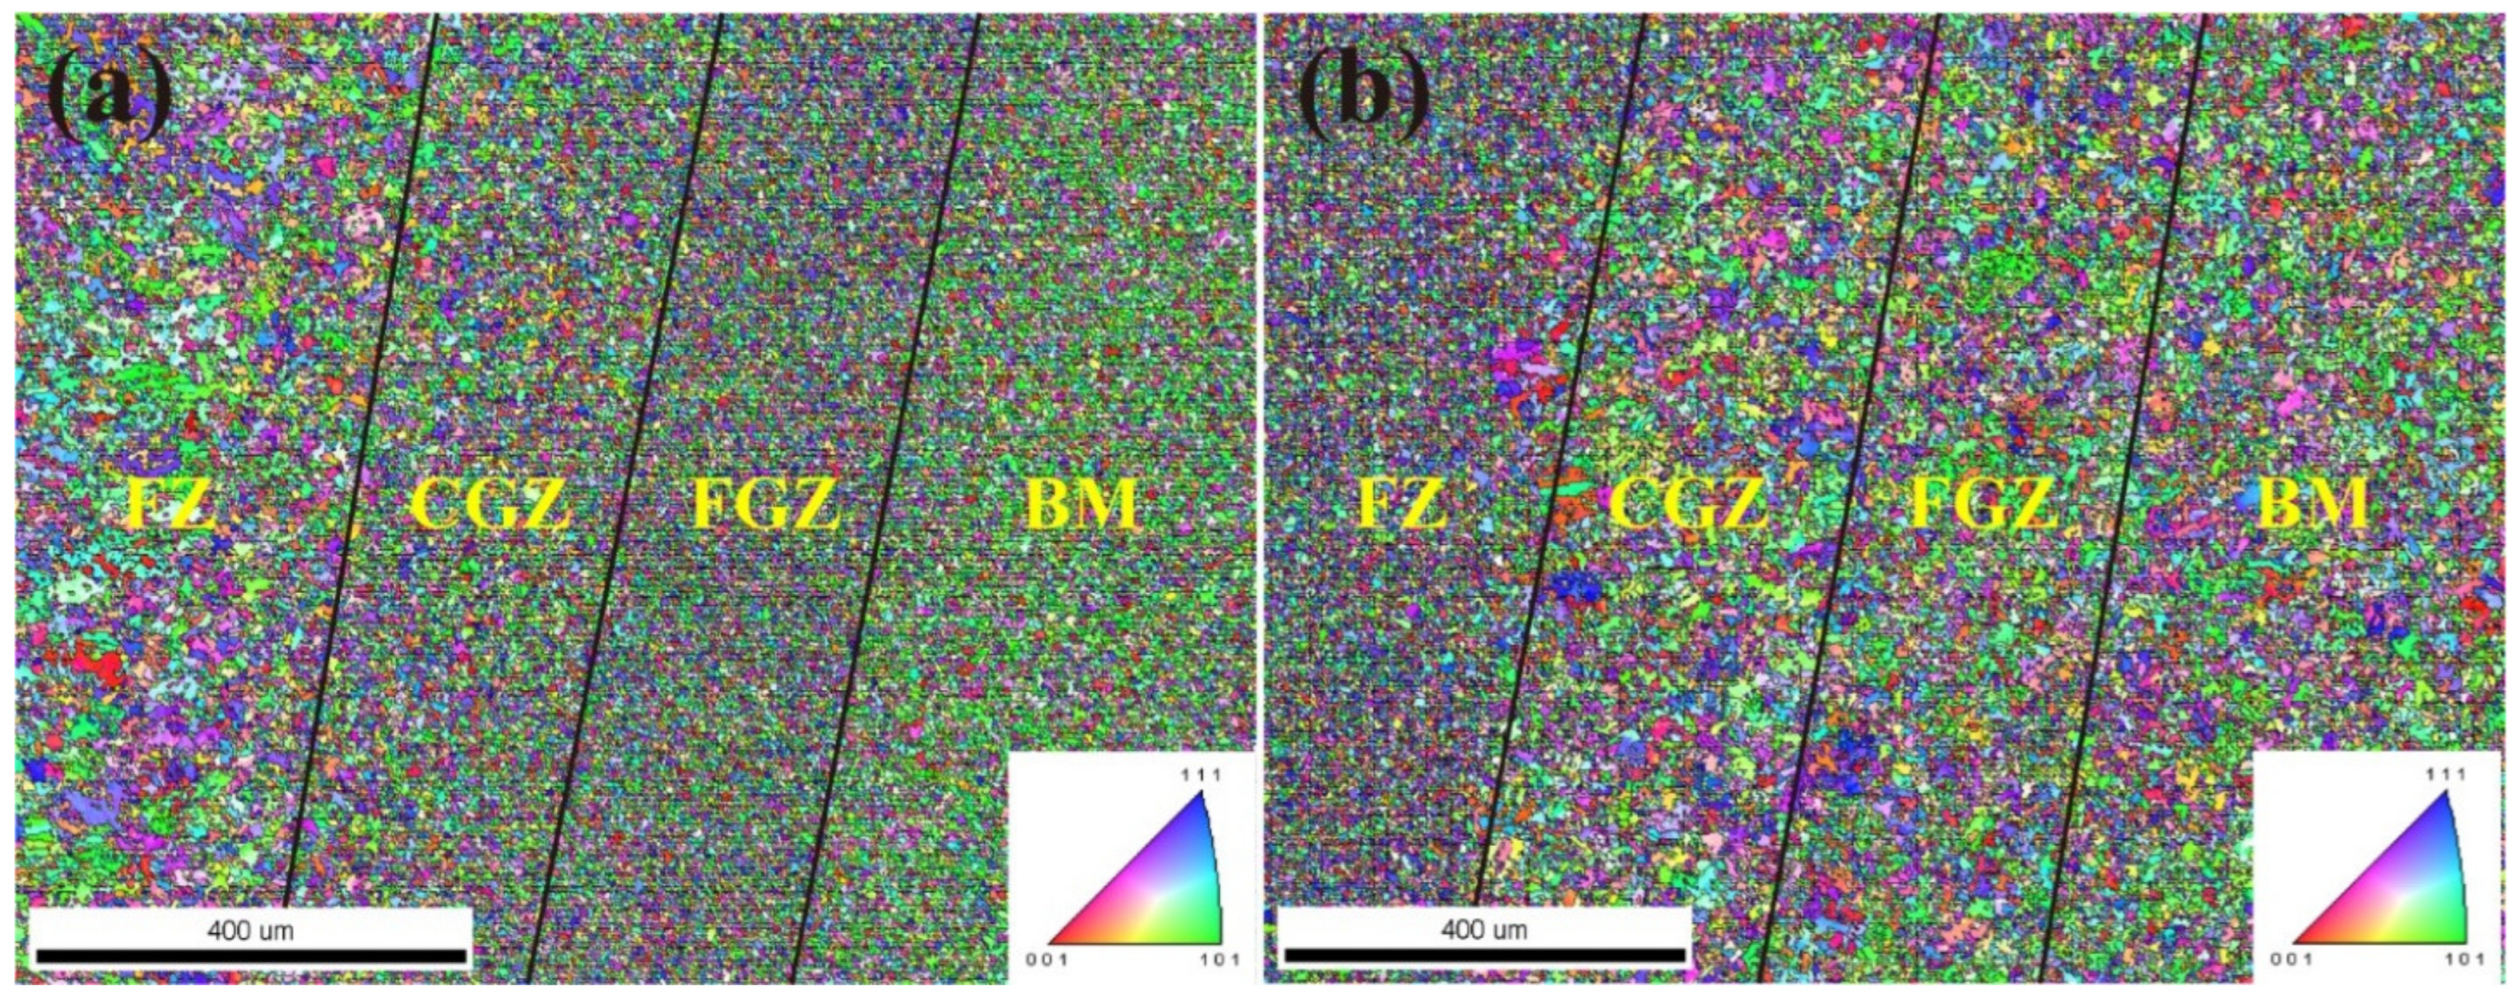
The grain distribution of the welded joint is shown in
Figure 16. Before quenching, as shown in
Figure 16a, the grain size of the FZ and the HAZ is obviously uneven; the grain size of FGZ is the smallest, that of CGZ is coarser, and that of FZ is the coarsest. The FZ is mixed with a large number of coarse grains with a diameter of about 40 μm. After quenching, as shown in
Figure 16b, the grain size of the FZ has changed significantly, the original coarse grains have all been refined, and a large number of fine equiaxed crystals have been formed. The grain size of CGZ and FGZ is basically the same, while the grain size of BM has grown up due to heat preservation during the quenching process. Therefore, the grain size of BM is larger than that of other zones. The statistics of the grain diameter are shown in
Figure 17. As the figure shows, before and after quenching, most of the grain diameter of the joint is less than 15.8 μm. Before quenching, the diameter of most grains is between 3.3 and 7.5 μm, accounting for 76.6% of the total grains. After quenching, the diameter of most grains is between 3.2 and 10.1 μm, accounting for 77.2% of the total grains. Before quenching, in the FZ, there are coarse grains that are larger than 39 μm in diameter. However, after quenching, the grain size is refined and the maximum grain size is less than 32 μm.
3.6.2. Grain Boundary
The distribution of angle misorientation of grain boundary is shown in
Figure 18, and the statistics of angle misorientation are shown in
Figure 19. As can be seen from
Figure 19, before quenching, the high-angle misorientation boundary (15–180°) accounts for 89.2%, while the middle-angle (5–15°) and the low-angle (0–5°) misorientation boundary account for 6.5% and 4.4%, respectively. In addition, most of the grain boundary misorientation in the joint is between 0–5° and 25–60°. As shown in
Figure 18a, before quenching, in the FZ, the grain size is not uniform, and there are many red boundaries (2–5°) inside the coarse M. While in the FGZ, there are more blue boundaries (15–180°). The BM has more green boundaries (5–15°) than FZ and HAZ. According to
Figure 19, after quenching, the high-angle misorientation boundary decreases to 84.8%, while the middle-angle and low-angle misorientation boundary increase to 7.3% and 8%, respectively. In addition, more grain boundaries of 0–15° and 50–60° are formed after quenching, while grain boundaries of 15–50° decreased significantly. After quenching, it can be seen from
Figure 18b that more blue boundaries (15–180°) are generated in the FZ and more green boundaries (5~15°) and red boundaries (2~5°) are generated in the HAZ and BM. Before quenching, there are massive high-angle misorientation boundaries in the FGZ, while the high-angle misorientation boundary of FZ, CGZ, and BM are relatively few. After quenching, the grain boundaries of the FZ are basically composed of high-angle misorientation boundaries, while more low-angle misorientation boundaries are formed in the HAZ and BM.
3.6.3. Grain Orientation
The distribution of the grain orientation is shown in
Figure 20. It can be seen from
Figure 20a that the grain of BM has obvious orientation and most of its grain orientation is green {101} before quenching because of the rolling process. While the grain orientation of FZ and HAZ is not obvious as the metal in the FZ and HAZ cools naturally after a high-temperature thermal effect. However, after quenching, it can be seen from
Figure 20b that the grain orientation of BM, FZ, and HAZ is not obvious. In the BM, the grain orientation of green {101} decreases and more grain orientation of red {001} and blue {111} generates. The grains in the HAZ and FZ are refined, the distribution of the grain size is more uniform and the grain orientation is not obvious.
3.6.4. Retained Austenite
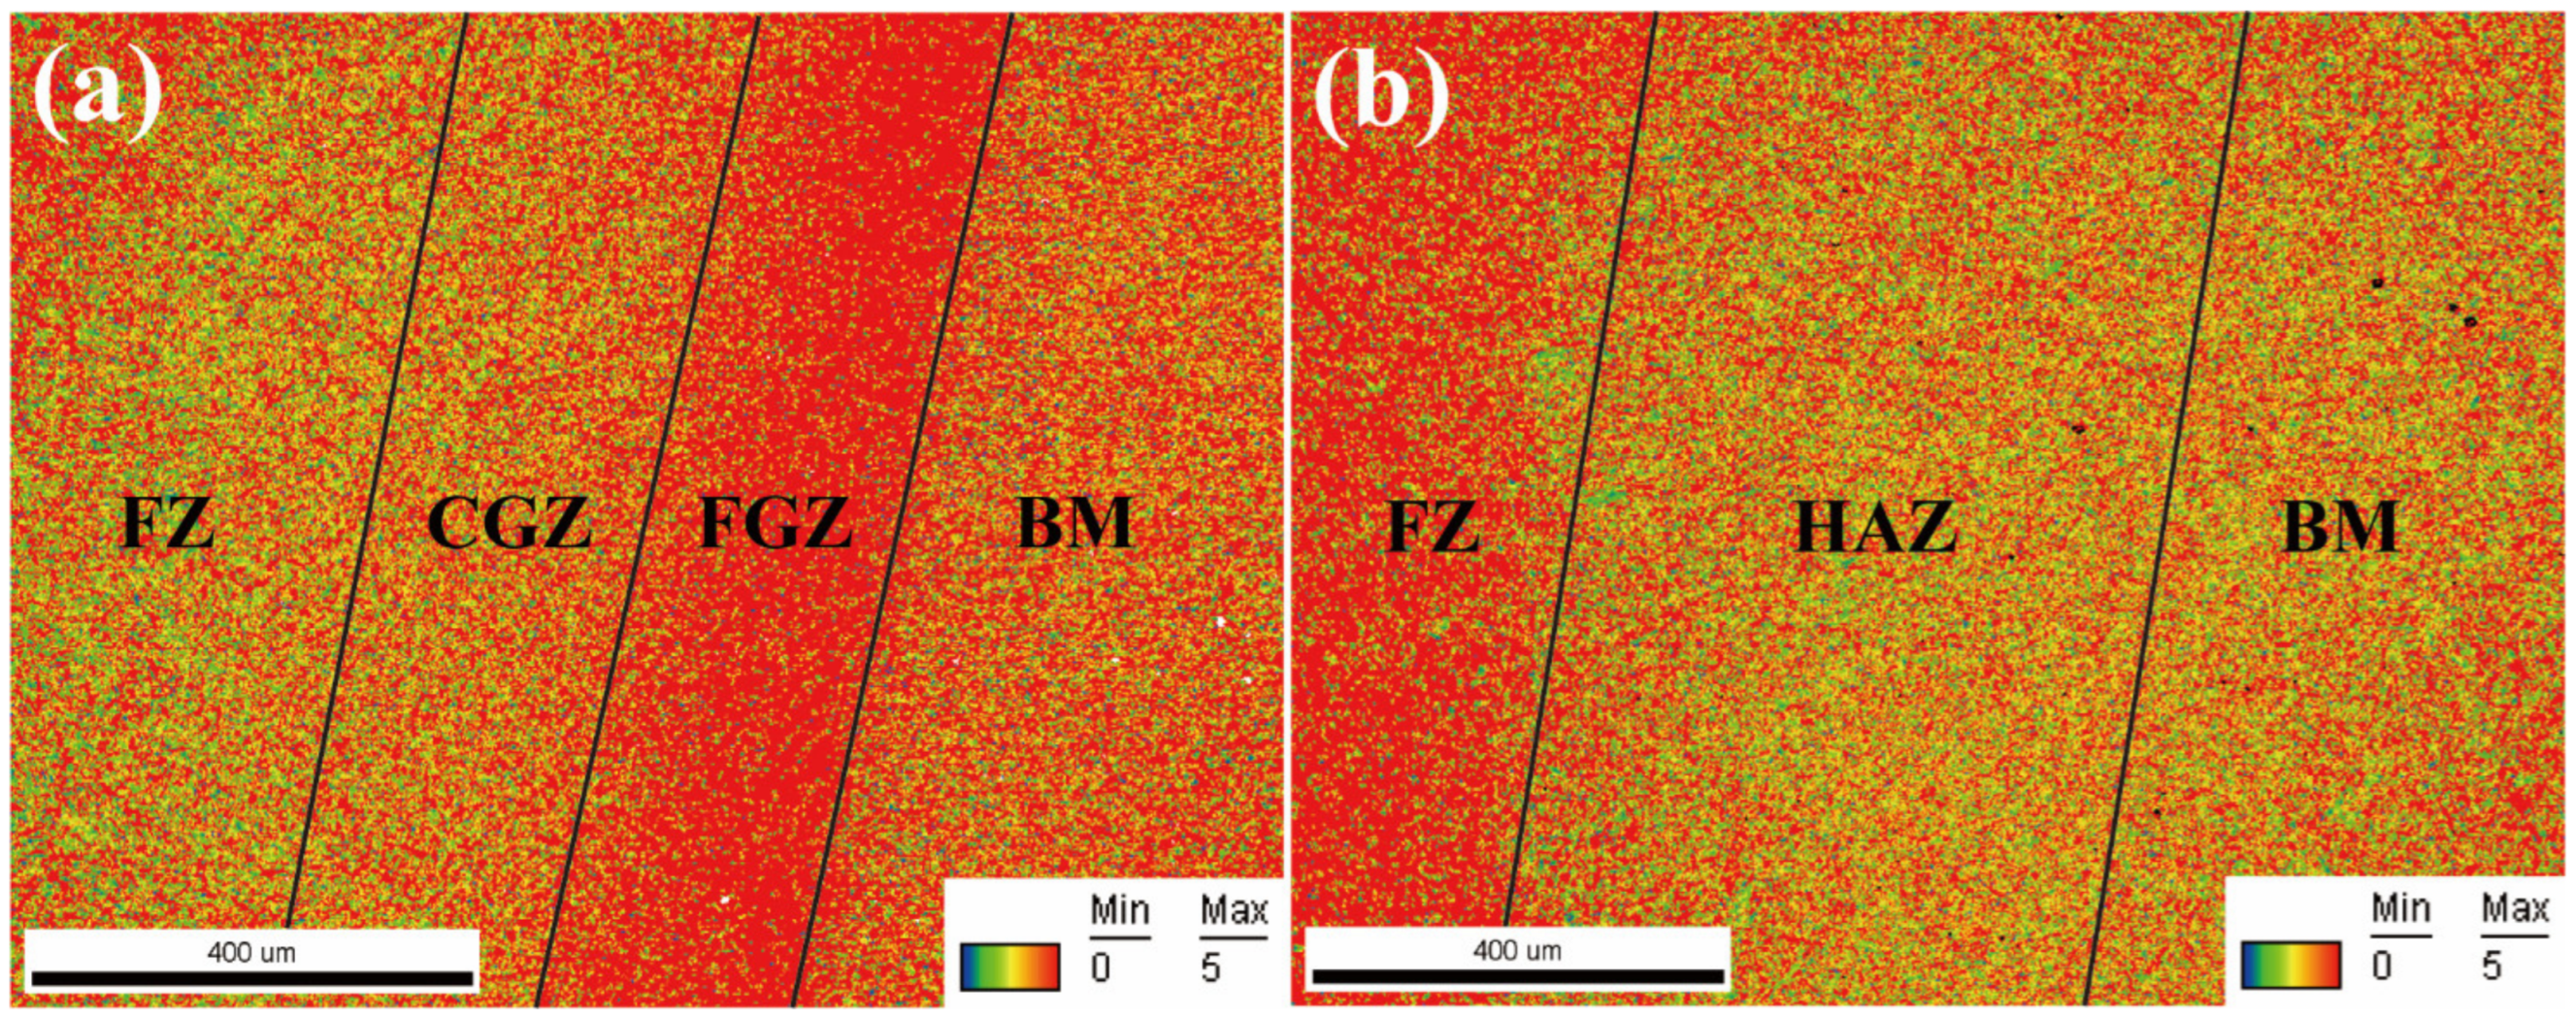
The distribution of retained austenite is shown in
Figure 21. As can be seen from
Figure 21a, before quenching, there is a great amount of RA in the FGZ and its distribution is very uneven. However, in the FZ, CGZ, and BM, there is relatively few RA. As can be seen from
Figure 21b, after quenching, the content of RA increased from 8.7% to 8.9%, and its content basically did not change much. Moreover, a great amount of RA produces in the FZ. While the content of RA in the FGZ reduces greatly and the grain size of retained austenite is smaller, which shows that the content of martensite after quenching is higher than that before quenching. Therefore, after quenching, the strength of the joint is higher and the hardness distribution is more uniform.
3.6.5. Kernel Average Misorientation
The distribution of kernel average misorientation is shown in
Figure 22. Kernel average misorientation may qualitatively reflect the degree of homogenization of plastic deformation. The higher the value is, the higher the degree of plastic deformation or defect density is [
32]. As shown in
Figure 22a, before quenching, there are a large number of middle-angle misorientations (1–4°) in FZ and CGZ. The low-angle misorientation (0°) in BM is more than those in FZ and CGZ. There are many high-angle misorientations (5°) in FGZ, indicating that FGZ has a large degree of plastic deformation. As shown in
Figure 22b, after quenching, FZ produces a large number of high-angle misorientations, while the high-angle misorientation in FGZ greatly reduces. The misorientation in FGZ has no significant difference from CGZ. At this time, there are a large number of middle-angle misorientations in HAZ and BM. After quenching, the dislocation density in FZ increases, and then the strain also increases so that the material is more likely to fracture, which also explains the reason why the fracture of the tensile samples is located at the joint after quenching.
4. Conclusions
In this paper, the effects of process parameters and quenching process on the mechanical properties and microstructure of the BR1500HS welded joints have been researched. The conclusions of this paper are as follows.
When the BR1500HS high strength steel is welded by laser welding and the value of heat input is 1440 J/cm, the best mechanical properties of the welded joint can be obtained. Before quenching, the dimples of the BM are small and dense, which indicates good plasticity. However, after quenching, a small plastic deformation occurred before the fracture and the fracture surface is brittle macroscopically.
When the welding speed increases, the minimum hardness increases and the width of the softened area decreases; while the laser power increases, the width of the softened area increases, and the minimum hardness does not change significantly.
As the welding speed increases, the front-bead width A, the back-bead width B, and the height of the smooth segment H all decrease; while the laser power increases, the back-bead width B increases, the front-bead width A and the height of the smooth segment H increase first and then decrease. The front-bead width A reaches the maximum when the laser power is 3000 W, and the height of the smooth segment H does not change much.
Before quenching, the FZ, CGZ, and FGZ consist of M and RA, and the IRZ consists of F and M. After quenching, the microstructure of the FZ, HAZ, and BM is transformed into M and RA.
Before quenching, in the FZ, there are coarse grains, which are larger than 39 μm in diameter. There are massive high-angle misorientation boundaries in the FGZ, while the high-angle misorientation boundary of FZ, CGZ, and BM are relatively few. But after quenching, the grain size is refined and the maximum grain size is less than 32 μm. The grain boundaries of the FZ are basically composed of high-angle misorientation boundaries, while more low-angle misorientation boundaries are formed in the HAZ and BM.
Author Contributions
Conceptualization, Y.K. and C.Z.; methodology, Y.K. and C.Z.; formal analysis, X.X. and Y.K.; investigation, Y.K. and R.W.; resources, Y.K. and R.W.; data curation, X.X. and R.W.; writing—original draft preparation, Y.K.; writing—review and editing, X.X. All authors have read and agreed to the published version of the manuscript.
Funding
This work was supported by Suizhou-WUT Industry Research Institute grant number suikefa [2019]9.
Institutional Review Board Statement
Not applicable.
Data Availability Statement
The datasets used or analyzed during the current study are available from the corresponding author on reasonable request.
Conflicts of Interest
The authors declare no conflict of interest.
References
- Wadas, T.; Tisza, M. Lightweight Manufacturing of Automotive Parts. IOP Conf. Ser. Mater. Sci. Eng. 2020, 903, 012036. [Google Scholar] [CrossRef]
- Taub, A.I.; Luo, A.A. Advanced lightweight materials and manufacturing processes for automotive applications. MRS Bull. 2015, 40, 1045–1054. [Google Scholar] [CrossRef] [Green Version]
- Karbasian, H.; Tekkaya, A.E. A review on hot stamping. J. Mater. Process. Technol. 2010, 210, 2103–2118. [Google Scholar] [CrossRef]
- Gu, X.; Zhu, K.; Wu, S.; Duan, Z.; Zhu, L. Effect of welding parameters on weld formation quality and tensile-shear property of laser welded SUS301L stainless steel lap filet weld. J. Mater. Res. Technol. 2020, 9, 4840–4854. [Google Scholar] [CrossRef]
- Tekkaya, A.E.; Min, J. Special Issue on Automotive Lightweight. Automot. Innov. 2020, 3, 2. [Google Scholar] [CrossRef]
- Venturato, G.; Novella, M.; Bruschi, S.; Ghiotti, A.; Shivpuri, R. Effects of Phase Transformation in Hot Stamping of 22MnB5 High Strength Steel. Procedia Eng. 2017, 183, 316–321. [Google Scholar] [CrossRef]
- Bok, H.H.; Lee, M.G.; Pavlina, E.J.; Barlat, F.; Kim, H.D. Comparative study of the prediction of microstructure and mechanical properties for a hot-stamped B-pillar reinforcing part. Int. J. Mech. Sci. 2011, 53, 744–752. [Google Scholar] [CrossRef]
- Lee, H.T.; Wu, J.L. The effects of peak temperature and cooling rate on the susceptibility to inter-granular corrosion of alloy 690 by laser beam and gas tungsten arc welding. Corros Sci. 2009, 51, 439–445. [Google Scholar] [CrossRef]
- Terada, M.; Saiki, M.; Costa, I.; Padilha, A.F. Microstructure and inter-granular corrosion of the austenitic stainless steel 1.4970. J. Nucl. Mater. 2006, 358, 40–46. [Google Scholar] [CrossRef]
- Liang, X.; Yuan, X.; Wang, H.; Li, X.; Li, C.; Pan, X. Microstructure, mechanical properties and failure mechanisms of resistance spot welding joints between ultra high strength steel 22MnB5 and galvanized steel HSLA350. Int. J. Precis. Eng. Manuf. 2016, 17, 1659–1664. [Google Scholar] [CrossRef]
- Choi, H.S.; Park., G.H.; Lim., W.S.; Kim., B.M. Evaluation of weldability for resistance spot welded single-lap joint between GA780DP and hot-stamped 22MnB5 steel sheets. J. Mech. Sci. Technol. 2011, 25, 1543–1550. [Google Scholar] [CrossRef]
- Jong, Y.S.; Lee, Y.K.; Kim, D.C.; Kang, M.J.; Hwang, I.S.; Lee, W.B. Microstructural Evolution and Mechanical Properties of Resistance Spot Welded Ultra High Strength Steel Containing Boron. Mater. Trans. 2011, 52, 1330–1333. [Google Scholar] [CrossRef] [Green Version]
- Zz, A.; Xw, A.; Qian, S.B.; By, A.; Li, X.A.; Hl, C. Study on microstructure and properties of laser dissimilar welded joints of ultra-high strength PHS1500/PHS2000 steel. Opt. Laser Technol. 2022, 150, 107933. [Google Scholar]
- Jia, J.; Yang, S.L.; Ni, W.Y.; Bai, J.Y. Microstructure and mechanical properties of fiber laser welded joints of ultrahigh-strength steel 22MnB5 and dual-phase steels. J. Mater. Res. 2014, 29, 2565–2575. [Google Scholar] [CrossRef]
- Li, M.; Yao, D.; Guan, Y.; Duan, Y.; Yang, L. Effect of Welding Speed and Post Quenching on the Microstructure and Mechanical Properties of Laser-Welded B1500HS Joints. Materials 2020, 13, 4645. [Google Scholar] [CrossRef]
- Pelsmaeker, J.D.; Graulus, G.J.; Vlierberghe, S.V.; Thienpont, H.; Hemelrijck, D.V.; Dubruel, P.; Ottevaere, H. Clear to clear laser welding for joining thermoplastic polymers: A comparative study based on physicochemical characterization. J. Mater. Process. Technol. 2018, 255, 808–815. [Google Scholar] [CrossRef]
- Pereira, A.B.; Fernandes, F.; Morais, A.; Quinto, J. Mechanical Strength of Thermoplastic Polyamide Welded by Nd:YAG Laser. Polymers 2019, 11, 1381. [Google Scholar] [CrossRef] [Green Version]
- Ragavendran, M.; Vasudevan, M. Effect of Laser and Hybrid Laser Welding Processes on the Residual Stresses and Distortion in AISI Type 316L(N) Stainless Steel Weld Joints. Metall. Mater. Trans. 2021, 52, 1–22. [Google Scholar] [CrossRef]
- Chen, C.; Zhou, H.; Wang, C.; Liu, L.; Zhang, K. Laser welding of ultra-high strength steel with different oscillating modes. J. Manuf. Process. 2021, 68, 761–769. [Google Scholar] [CrossRef]
- Hietala, M.; Hamada, A.; Keskitalo, M.; Askari, M.J.; Jrvenp, A. Mechanical characterization of laser-welded double-lap joints in ultra-high and low strength steels for sandwich panel applications. Mater. Today Proc. 2019, 28, 455–460. [Google Scholar] [CrossRef]
- Mhr, A.; Am, B.; Eb, A.; Yz, A. Microstructure and dynamic tensile characteristics of dissimilar fiber laser welded advanced high strength steels. Mater. Sci. Eng. 2020, 773, 138729. [Google Scholar]
- Alves, P.H.O.M.; Lima, M.S.F.; Raabe, D.; Sandim, H.R.Z. Laser beam welding of dual-phase DP1000 steel. J. Mater. Process. Technol. 2018, 252, 498–510. [Google Scholar] [CrossRef]
- Zhao, H.; Huang, R.; Sun, Y.; Tan, C.; Wu, L.; Chen, B.; Song, X.; Li, G. Microstructure and mechanical properties of fiber laser welded QP980/press-hardened 22MnB5 steel joint. J. Mater. Res. Technol. 2020, 9, 10079–10090. [Google Scholar] [CrossRef]
- Guler, H. Investigation of Usibor 1500 Formability in a Hot Forming Operation. Mater. Sci. 2013, 19, 144–146. [Google Scholar] [CrossRef]
- Eller, T.K.; Greve, L.; Andres, M.T.; Medricky, M.; Hatscher, A.; Meinders, V.T.; Van Den Boogaard, A.H. Plasticity and fracture modeling of quench-hardenable boron steel with tailored properties. J. Mater. Process. Technol. 2014, 214, 1211–1227. [Google Scholar] [CrossRef]
- ISO 6892-1:2019; Metallic materials—Tensile testing—Part 1: Method of test at room temperature. ISO: Geneva, Switzerland, 2019.
- Zhang, W.; Tao, W.; Yang, S. Mechanical properties and fracture behaviors in remote laser spot welding of quenching and partitioning 980 steel. Opt. Laser Technol. 2021, 140, 107053. [Google Scholar] [CrossRef]
- Aeo, A.; Vv, A.; Fd, A.; Rd, A.; Pm, B.; Nk, A. Effect of laser beam welding on microstructure, tensile strength and fatigue behaviour of duplex stainless steel 2205. J. Manuf. Process. 2021, 72, 148–158. [Google Scholar]
- Dowden, J.; Kapadia, P. A mathematical investigation of the penetration depth in keyhole welding with continuous CO2 lasers. J. Phys. D Appl. Phys. 1995, 28, 2252. [Google Scholar] [CrossRef]
- Hao, Z.; Chen, H.; Jin, X.; Yu, X.; Liu, Z. Direct observation of keyhole with an innovative layer-by-layer imaging method during deep penetration laser welding. Opt. Laser Technol. 2022, 152, 108142. [Google Scholar] [CrossRef]
- Cheng, H.; Zhou, L.; Li, Q.; Du, D.; Chang, B. Effect of welding parameters on spatter formation in full-penetration laser welding of titanium alloys. J. Mater. Res. Technol. 2021, 15, 5516–5525. [Google Scholar] [CrossRef]
- He, K.; Wang, Y.; Wang, H. Influence of dynamic strain aging on ferritic/martensitic steel and stability analysis. Fusion Eng. Design. 2021, 171, 112581. [Google Scholar] [CrossRef]
Figure 1.
Microstructure of BR1500HS high-strength steel.
Figure 1.
Microstructure of BR1500HS high-strength steel.
Figure 2.
Welding process: (a) schematic illustration; (b) field experiment.
Figure 2.
Welding process: (a) schematic illustration; (b) field experiment.
Figure 3.
Dimensions of tensile samples.
Figure 3.
Dimensions of tensile samples.
Figure 4.
Distribution of microhardness test points: (a) schematic illustration; (b) test illustration.
Figure 4.
Distribution of microhardness test points: (a) schematic illustration; (b) test illustration.
Figure 5.
The tensile strength of all the samples at different heat inputs after quenching.
Figure 5.
The tensile strength of all the samples at different heat inputs after quenching.
Figure 6.
Tensile fracture morphology of samples No. 4#: (a) base materials (BM); (b) joint.
Figure 6.
Tensile fracture morphology of samples No. 4#: (a) base materials (BM); (b) joint.
Figure 7.
Tensile fracture morphology of samples No. 5#: (a) base materials (BM); (b) joint.
Figure 7.
Tensile fracture morphology of samples No. 5#: (a) base materials (BM); (b) joint.
Figure 8.
Microhardness of joint at different welding speeds: (a) before quenching; (b) after quenching.
Figure 8.
Microhardness of joint at different welding speeds: (a) before quenching; (b) after quenching.
Figure 9.
Macro morphology of the joint under different welding speeds: (a) 65 cm/min; (b) 75 cm/min; (c) 100 cm/min; (d) 125 cm/min; (e) 150 cm/min.
Figure 9.
Macro morphology of the joint under different welding speeds: (a) 65 cm/min; (b) 75 cm/min; (c) 100 cm/min; (d) 125 cm/min; (e) 150 cm/min.
Figure 10.
Microhardness of joint under different laser power: (a) before quenching; (b) after quenching.
Figure 10.
Microhardness of joint under different laser power: (a) before quenching; (b) after quenching.
Figure 11.
Macro morphology of the joint under different power: (a) 1800 W; (b) 2200 W; (c) 2600 W; (d) 3000 W; (e) 3400 W.
Figure 11.
Macro morphology of the joint under different power: (a) 1800 W; (b) 2200 W; (c) 2600 W; (d) 3000 W; (e) 3400 W.
Figure 12.
Schematic diagram of the parameters of weld shape.
Figure 12.
Schematic diagram of the parameters of weld shape.
Figure 13.
Changes in the parameters of the weld shape with: (a) welding speed; (b) power.
Figure 13.
Changes in the parameters of the weld shape with: (a) welding speed; (b) power.
Figure 14.
Microstructure of sample No.4# before quenching: (a) macro morphology; (b) FZ; (c) CGZ; (d) FGZ; (e) IRZ; (f) BM.
Figure 14.
Microstructure of sample No.4# before quenching: (a) macro morphology; (b) FZ; (c) CGZ; (d) FGZ; (e) IRZ; (f) BM.
Figure 15.
Microstructure of sample No.4# after quenching: (a) macro morphology; (b) FZ; (c) HAZ; (d) BM.
Figure 15.
Microstructure of sample No.4# after quenching: (a) macro morphology; (b) FZ; (c) HAZ; (d) BM.
Figure 16.
Grain distribution: (a) before quenching; (b) after quenching.
Figure 16.
Grain distribution: (a) before quenching; (b) after quenching.
Figure 17.
Statistics of the grain diameter.
Figure 17.
Statistics of the grain diameter.
Figure 18.
Distribution of angle misorientation of grain boundary (a) before quenching; (b) after quenching.
Figure 18.
Distribution of angle misorientation of grain boundary (a) before quenching; (b) after quenching.
Figure 19.
Statistics of the angle misorientation.
Figure 19.
Statistics of the angle misorientation.
Figure 20.
Distribution of grain orientation: (a) before quenching; (b) after quenching.
Figure 20.
Distribution of grain orientation: (a) before quenching; (b) after quenching.
Figure 21.
Distribution of retained austenite: (a) before quenching; (b) after quenching.
Figure 21.
Distribution of retained austenite: (a) before quenching; (b) after quenching.
Figure 22.
Distribution of kernel average misorientation: (a) before quenching; (b) after quenching.
Figure 22.
Distribution of kernel average misorientation: (a) before quenching; (b) after quenching.
Table 1.
Chemical composition of BR1500HS (wt %).
Table 1.
Chemical composition of BR1500HS (wt %).
| Mn | Si | C | Cr | Ni | Mo | B | Al | Ti | Cu | V | S | P |
|---|
| 1.35 | 0.25 | 0.23 | 0.19 | 0.028 | 0.04 | 0.003 | 0.04 | 0.03 | 0.016 | 0.004 | 0.006 | 0.015 |
Table 2.
Process parameters used in the welding process.
Table 2.
Process parameters used in the welding process.
| Laser Power | 1800, 2200, 2600, 3000, 3400 W |
|---|
Welding speed
Flow rate of shielding gas | 65, 75, 100, 125, 150 cm/min
15 L/min |
Table 3.
Tensile test results of all the samples before and after quenching.
Table 3.
Tensile test results of all the samples before and after quenching.
| No. | Power (P) | Welding Speed ()
| Heat Input (q) | Before Quenching | After Quenching |
|---|
| Tensile Strength | Fracture Position | Tensile Strength | Fracture
Position |
|---|
| Unite | W | cm/min | J/cm | MPa | - | MPa | - |
|---|
| 1# | 2200 | 75 | 1760 | 632.1 ± 1.6 | BM | 1616 ± 20.2 | Joint |
| 2# | 2600 | 75 | 2080 | 633.6 ± 3.3 | BM | 1607 ± 28.6 | Joint |
| 3# | 3000 | 75 | 2400 | 630.7 ± 2.2 | BM | 1545 ± 37.2 | Joint |
| 4# | 2600 | 150 | 1040 | 631.2 ± 2.8 | BM | 1446 ± 43.7 | Joint |
| 5# | 2600 | 125 | 1248 | 628.8 ± 2.5 | BM | 1535 ± 26.8 | Joint |
| 6# | 2600 | 100 | 1560 | 625.5 ± 3.6 | BM | 1587 ± 34.9 | Joint |
| 7# | 1800 | 75 | 1440 | 630.3 ± 1.2 | BM | 1644 ± 18.6 | Joint |
| 8# | 3400 | 75 | 2720 | 627.3 ± 2.4 | BM | 1585 ± 24.5 | Joint |
| 9# | 2600 | 65 | 2400 | 624.9 ± 3.2 | BM | 1607 ± 32.4 | Joint |
| Disclaimer/Publisher’s Note: The statements, opinions and data contained in all publications are solely those of the individual author(s) and contributor(s) and not of MDPI and/or the editor(s). MDPI and/or the editor(s) disclaim responsibility for any injury to people or property resulting from any ideas, methods, instructions or products referred to in the content. |
© 2023 by the authors. Licensee MDPI, Basel, Switzerland. This article is an open access article distributed under the terms and conditions of the Creative Commons Attribution (CC BY) license (https://creativecommons.org/licenses/by/4.0/).


