Article

Research on the Warping and Dross Formation of an Overhang Structure Manufactured by Laser Powder Bed Fusion

School of Mechanical and Automotive Engineering, South China University of Technology, Guangzhou 510641, China
*
Author to whom correspondence should be addressed.
Appl. Sci. 2023, 13(6), 3460; https://doi.org/10.3390/app13063460
Submission received: 21 January 2023 / Revised: 3 March 2023 / Accepted: 7 March 2023 / Published: 8 March 2023

Abstract

:
Warping and dross formation are the main defects of an overhang structure formed by laser powder bed fusion. In order to study these defects, a seven−shaped overhang structure with different lengths and heights of the overhang was printed. The influence of the temperature and stress field on the overhang structure was investigated using a 3D finite element (FE) model. The results of the simulation showed that the molten pool in the powder support zone was much larger than the molten pool in the solid support zone. The molten pool sank due to the actions of gravity and the capillary force. This led to the powder melting, which then formed a droplet−like dross formation on the lower surface. The temperature difference between the regions led to a large residual stress. When the residual stress exceeded the material strength, warping deformation occurred in the top area, affecting the subsequent powder−laying process. The warping zone was remelted when the next layer was processed. As the number of forming layers increased, the thermal conductivity and stiffness increased continuously, and the deformation of the top area gradually decreased. The experiment results showed that the longer the overhanging length was, the more serious the warpage was. When the overhanging length was below 3 mm, the warping of the top area continued to decrease to zero as the building process proceeded. Meanwhile, the dross formation appeared at the bottom of the overhanging area in all experimental groups. Studying the process of warping and dross formation was helpful to understand the defect change process in the manufacturing process of an overhang structure.

1. Introduction

Laser powder bed fusion (LPBF) is an additive manufacturing technology for manufacturing metal and alloy parts. It is considered a promising manufacturing technology due to its high manufacturing flexibility [1]. An overhang structure inevitably appears in the design and manufacture of LPBF, bringing great difficulties to the manufacturing process [2]. In ideal conditions, there is no need to add support to the overhang structure because of the support of the powder bed during the LPBF process [3]. In reality, however, the conditions are very complex. Therefore, when the incline angle is too small or the overhanging length is too long, warping, dross formation, and a series of defects are often encountered [4]. The cause of the warping deformation is believed to be the lack of support of the overhang and the residual stress generated by the LPBF [5,6]. The residual stress is thought to be caused by localized heating and cooling during the LPBF process [7]. Without a connection with the substrate, the heat cannot be dissipated in the overhanging area, and an overheating zone is formed during laser processing. This causes the building contour to exceed expectations, resulting in the formation of dross [8]. These defects could cause the failure of the part [9].
In order to ensure the forming size and performance of parts, many scholars have carried out a series of studies on overhang structures. Di Wang [10] and Weipeng Duan [11] studied the influence of the incline angle. They found that at a smaller incline angle, a lower scanning speed and a larger laser energy caused the warping trend to become greater; meanwhile, the quality of the overhanging surface is in a relatively optimal state when the bending angle of the two overhanging surfaces is 80° (60° relative to the horizontal plane). Enrico Ossola carried out a series of studies on a spiderweb structure, and the result showed that when the incline angle is 0°, many dross formations are produced in the bottom area of the spiderweb and its surface quality is greatly reduced [12]. Therefore, improving the formation quality of the overhang structure has become a focus of attention. Pratik Vora found that the AlSi12 alloy could only reach 2 mm of overhanging length under the LPBF process without support [13]. Ema Vasileska used a layered control strategy to significantly increase the bridge−forming length by 5 mm [14].
In order to eliminate the warp and dross formation defects caused by the overhang structure, an external structure is required to support the overhang structure during LPBF in a general case [15,16,17]. Zafer Cagatay Oter analyzed the influence of the support profile on the dimensional stability of the overhang structure and the quality of the bottom surface [18]. This study found that the strong support profile had a higher dimensional stability, while the weak support profile had a better surface quality. Compared to the experimental research methods, the numerical analysis method fully solves the problems without consumption [19]. Additionally, the numerical analysis method can theoretically identify the variable process of temperature, stress, and deformation and is of great help in understanding the change of the physical field in the LPBF process. Many scholars have studied the formation process of the overhang structure by using a numerical simulation. Dongdong Gu investigated a novel reticulated shell structure with a large proportion of overhang structure and found a strut angle of 75 degrees demonstrated the best compressive behavior [20]. Quanquan Han et al. investigated the manufacturing limit of the fully circular AlSi10Mg overhang structure, which was 15 mm in diameter without added support. When a longer diameter was formed, the overhang surface produced significant dross formation defects [21]. K.Q. Le studied the effect of laser energy density on the process of the overhang structure by using a raytracing model. They found that using a high laser power while maintaining a low laser energy density could eliminate defects such as pores or warping and significantly improve the forming quality [22]. Igor Yadroitsev and Ina Yadroitsava used the residual stress coupling model and found that the residual stress of the samples in the scanning direction is higher than that in the vertical direction [23]. Through numerical simulation and microstructure observation, Jinliang Zhang found that an insufficient or too high energy density would lead to spherification or stomata formation during the manufacture of AlSi10Mg overhang structures [24]. A low energy density leads to incomplete powder melting, while a high energy density leads to droplet splashing. At the same time, the high cooling rate of the LPBF process can cause the stress to exceed the material strength, which can lead to cracking.
According to the literature, warping and deformation are the main defects in the manufacture of overhang structures by LPBF. Therefore, it is necessary to understand the processes of warping and dross formation to solve the forming difficulties caused by the overhang structure. In this study, a three−dimensional FE model was established by combining a Gaussian moving heat source, the difference of the thermal physical properties between the AlSi10Mg powder and the solid, and a layer addition feature. This model was used to obtain the temperature field and stress field. In combination with the experimental result, the process of warping and dross formation was studied. This provided theoretical support for the subsequent optimization of the process of forming an overhang structure and helped to propose a more reasonable optimization method for improving the quality of the parts.

2. Materials and Methods

2.1. Experiment Methods

An experimental study was carried out in order to explore the warping and dross formation of a horizontal overhang structure in the process of fabrication. The experiment was carried out using the Dimetal−100H LPBF equipment, which was developed by South China University of Technology. It used AlSi10Mg powder provided by Avimetal Powder Metallurgy Technology company; the composition is shown in Table 1. The particle size, which was obtained through the statistical method of volume distribution, was 15–53 μm [25]. The D10 was 19.72 μm, D50 was 35.34 μm, and D90 was 56.79 μm. The experimental process parameters are shown in Table 2. Experimental samples are shown in Figure 1b. There were 42 experimental groups with 7 groups of different lengths of overhang structure (2.0 mm, 2.5 mm, 3.0 mm, 3.5 mm, 4.0 mm, 4.5 mm, and 5.0 mm). Each group had six different heights (0.3 mm, 0.6 mm, 1.2 mm, 1.8 mm, 2.4 mm, and 3.0 mm), as shown in Table 2. Figure 1a shows the placement of parts on the substrate. Each substrate was placed in two different overhang structure height groups, and four aluminum alloy substrates were used in the experiment. After formation, the parts were separated from the substrate by wire cutting. In this paper, the VHX5000 ultra−depth−of−field, three−dimensional microscope produced by the Geness Company was used to shoot and measure the separated samples. The measured values of the maximum warping deformation of the top area were averaged over three series of measurements.

2.2. Heat Transfer Model

In this paper, the finite element method was used to simulate the temperature field. The current model has some assumptions. (1) This model is without regard for the convection of the liquid in the molten pool. (2) The volume shrinkage caused by the solidification of the powder layer is not considered in this model. (3) This model ignores the mass transport of heat.
During the LPBF process, a laser beam is used as a heat source, the powder on the laser path is heated directly by the laser beam, and the heat is transferred to the surrounding space through heat convection and heat radiation. Moreover, the heat is conducted to the powder bed, causing the powder to go through the process of melting and cooling. Together, these three processes determine the temperature distribution inside the material.
The transient spatial distribution of the temperature satisfies the following differential equations of 3D heat conduction in a domain region D, which can be described as [26,27,28]:
H t = x k T x + y k T y + z k T z + Q ,     x ,   y ,   z D
where H is the enthalpy (J/m3), T is the temperature (°C), t is the time (s), k is the thermal conductivity (W/m·°C), and Q is the heat generated per unit volume of the interior (W/m3)
The enthalpy can be expressed as a function of temperature [28,29]:
H T = T r T ρ T c T d T   ( T < T s ) T r T s ρ T c T d T + T s T ρ T d L d T + c T d T     T s < T T l T r T s ρ T c T d T + T s T l ρ T c T d T + T l T ρ T c T d T     T T l  
where ρ is the density of AlSi10Mg (kg/m3), c is the specific heat capacity (J/kg·°C), Ts is the solidus temperature (°C), Tl is the liquidus temperature (°C), Tr is a reference temperature that is below Ts (°C), and L is the latent heat (J/kg).
Before the LPBF process begins, the initial temperature is equal to 20 °C and can be expressed as:
T x , y , z t = 0 = T 0 ,     x ,   y ,   z D
The natural boundary condition that occurs on the free surface, including the inside conduction, surface convection, and radiation, can be described as [30]:
k T N q + q c + q r = 0 ,     x ,   y ,   z S
where S represents the surfaces that are attached to imposed heat fluxes, convection, and radiation; N is the normal vector of surface; the input heat flux is presented by Equation (7); q c is the heat convection; and q r is the heat radiation, which can be expressed by:
q c = h c T T 0
q r = σ S B ε T 4 T 0 4
where h c is the convective heat transfer coefficient, σ S B is the Stefan–Boltzmann constant, and ε is the emissivity of the powder bed.
On the laser processing surface, the laser intensity distribution is approximately a Gaussian distribution. In this paper, the Gaussian body heat source model is used as the heat source model. This model considers the laser distribution in the direction of the vertical machining surface and assumes that the laser intensity decreases with the increase in depth. The Gaussian heat source is expressed as:
q = 2 A P π r 2 η e x p 2 x 2 + y 2 r 2 e x p z η ,     x ,   y ,   z D
where P is the laser power (W); A is the laser absorptivity of AlSi10Mg [31]; η is the longitudinal penetration depth of laser, which is regarded as one thickness of the powder layer (m); and r is the corresponding radius when the laser irradiation decreases to its maximum value of 1 / e 2     (m) [32].

2.3. Stress Model

For the sequentially coupled thermo−mechanical analysis, the calculations were conducted in two steps. First, the transient thermal analysis was calculated. Then, the mechanical analysis was performed to calculate the residual stress and deformation [4]. The following assumptions were made.
  • The yield deformation process of the material obeys the von Mises yield principle;
  • The volume of the material remains when plastic deformation occurs;
  • The material follows both the flow rule and the bilinear strengthening rule during the plastic deformation;
  • The mechanical properties of the material are in a linear relationship with the stress and strain in a small increment of time;
  • The entire powder layer is assumed to melt at once instead of in a track−by−track fashion.
For the stress analysis model, the thermal strain, elastic strain, and plastic strain are considered [33].
d ε = d ε e + d ε c p + d ε t h
where d ε is the total stain tensor, d ε e is the elastic tensor, d ε c p is the plastic tensor, and d ε t h is the thermal strain tensor.
The increment in stress and strain satisfies the following equation:
d σ = D e p d ε α T d T
where d σ is the stress, d T is the temperature increment, α T is the thermal expansion coefficient, and D e p is the elastic–plastic matrix, which can be calculated from the following equation.
D e p = D ¯ e D e σ ¯ σ σ ¯ σ T D e H + σ ¯ σ T D e σ ¯ σ
where D e is the elastic matrix, σ ¯ is the equivalent stress, and H is the hardening coefficient.

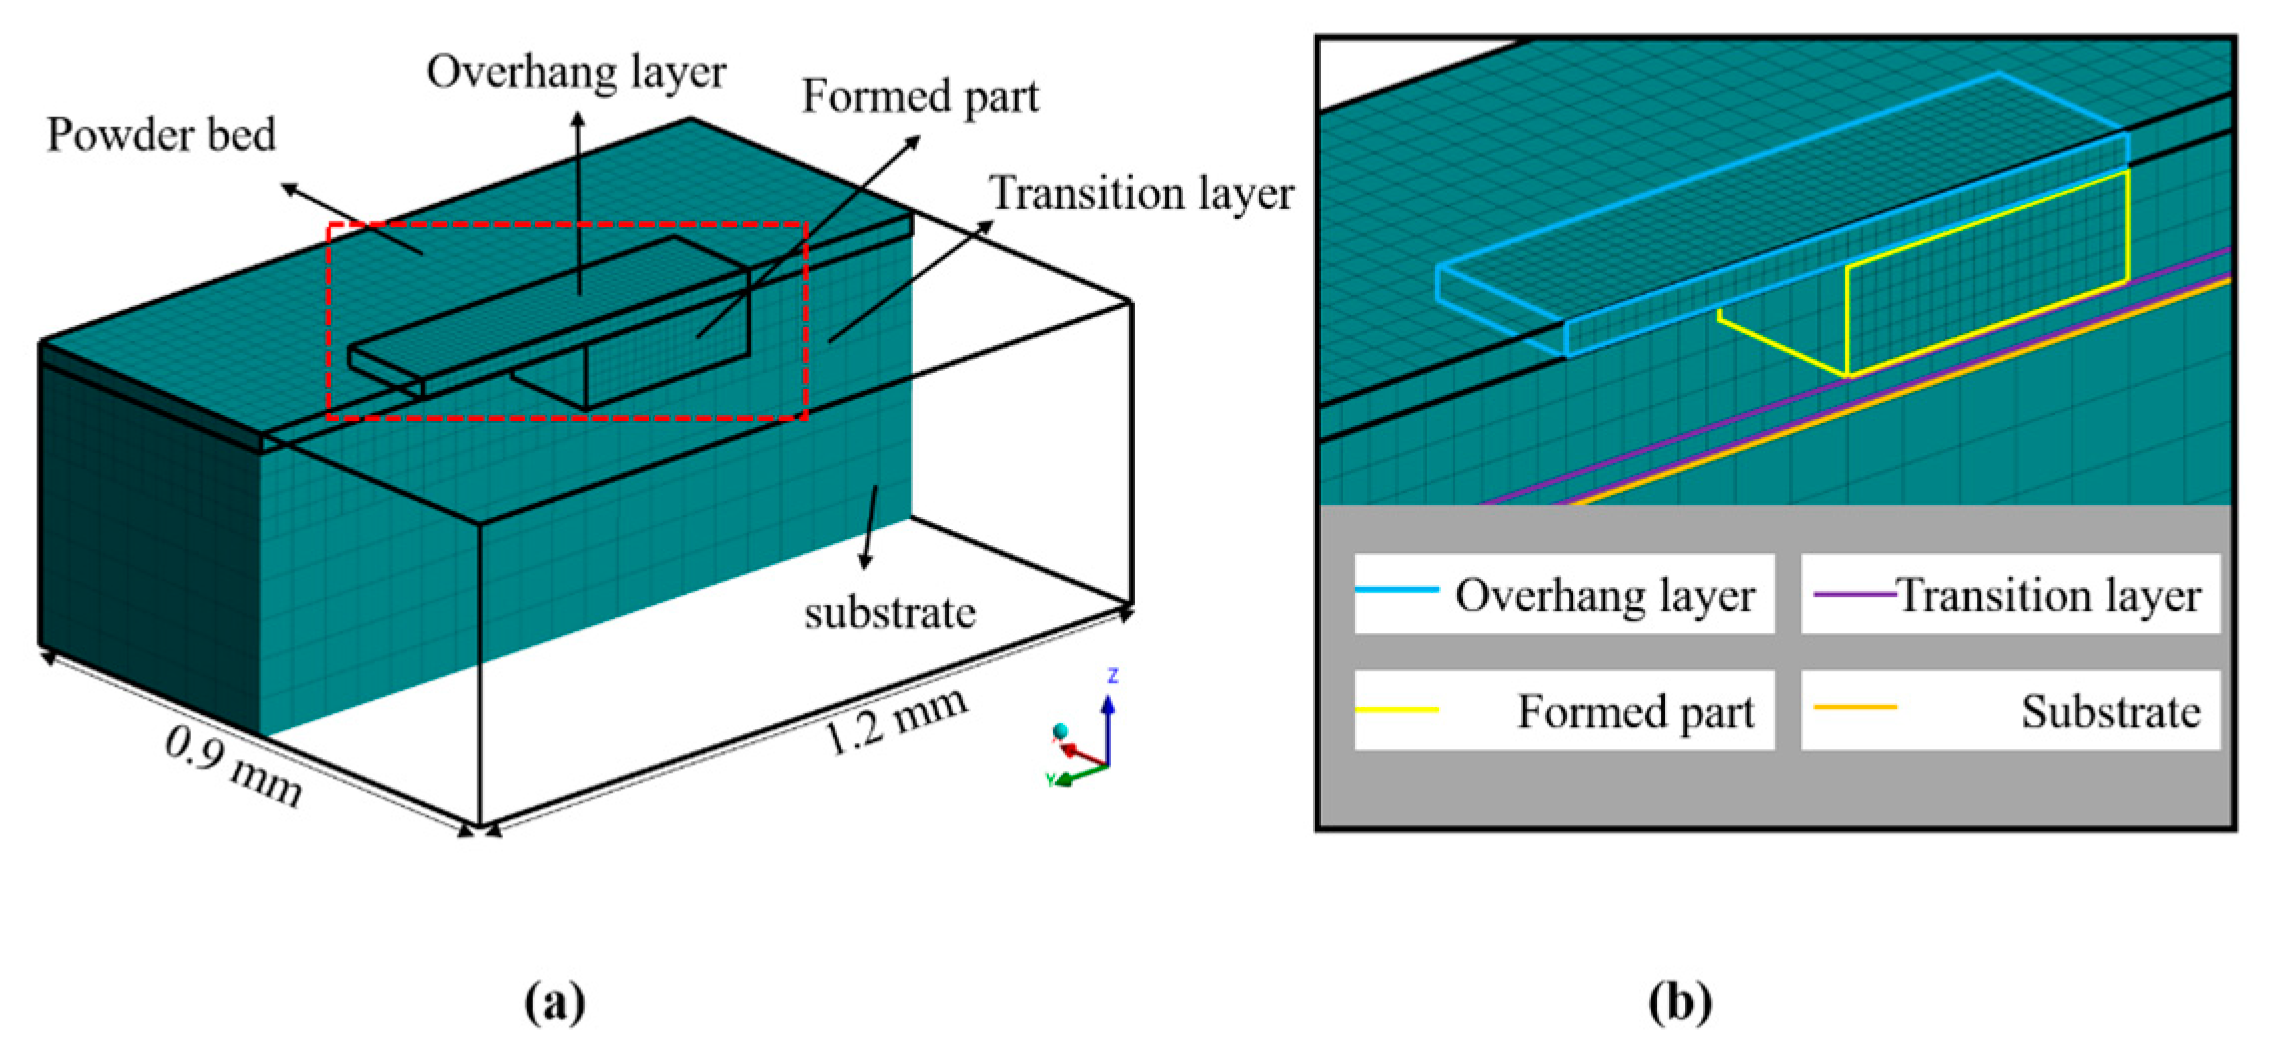
2.4. Physical Description of the Mode

Figure 2 shows the cross−section of the finite element model. In this model, the size of the aluminum alloy substrate was 1.2   mm   ×   0.9   mm   ×   0.33   mm , the size of each layer of the formed−part layer was 0.3   mm   ×   0.3   mm   ×   0.03   mm , and the size of each overhang layer was 0.6   mm   ×   0.3   mm   ×   0.03   mm . In addition, the mesh size of the parts (the overhanging layer and the formed part layer) was 15   μ m   ×   15   μ m   ×   15   μ m . In order to make the mesh size change smoother and to improve the computational efficiency and accuracy, a transition layer was designed between the parts and the substrate; its mesh size was the same as that of the powder layer, i.e., 30   μ m   ×   30   μ m   ×   30   μ m . For the remaining part of the substrate, the mesh size was the same as that of the powder layer, i.e., 60   μ m   ×   60   μ m   ×   60   μ m . Figure 1c shows the scanning strategy adopted by the temperature field model, and all scanning parameters are the same as in the experiment. This paper aims to study the changes in the overhang layer during the manufacturing process. In order to improve the computational efficiency, the model was simplified, assuming that the bottom of the part layer had been formed.

2.5. Material Properties of AlSi10Mg

The phases of the AlSi10Mg powder and the solid phases were considered separately in the model presented in this paper, which used temperature−dependent thermophysical properties including the thermal conductivity, density, specific heat capacity, and enthalpy. The temperature−dependent physical properties of the solid phase were obtained using JMatPro software. The density of the   AlSi 10 Mg changes with the temperature and can be expressed as [34]
ρ p = 1 φ ρ s T < T m ρ s T > T m
where ρ p is the powder bed density, ρ s is the solid phase density, and φ is the porosity, which was set as 0.4 in this paper [35].
The thermal conductivity k is more significantly affected by the material phase. In the model, it was assumed that the thermal conductivity of the   AlSi 10 Mg powder is the same as 0.01 of the solid phase. The relationship between conductivity and temperature is as follows [36]:
k = k p , T < T m k s , T T m = 0.01 × k s , T < T m k s , T T m
where k p is the equivalent thermal conductivity of the powder bed, k s is the density of the solid phase material, and T m is the melting temperature of the powder.
Table 3 shows the thermophysical properties of the AlSi10Mg material used in this model.

3. Results and Discussion

3.1. Experiment Result

The experiment results are shown in Figure 3: samples with different overhanging lengths warped in the first few printing layers. The two groups of experiments with lengths of 4.5 mm and 5.0 mm needed to stop the forming process by deleting the corresponding length−processing files due to excessive warping when the formation reached seven layers. For the two groups of parts with lengths of 3.5 mm and 4 mm, the first 20 layers warped seriously. However, this did not hinder the continuation of the manufacturing process. When the fabricated height was greater than 0.6 mm (20 layers), the warping of the parts was too large to continue processing and had to be stopped.
As shown in Figure 4, the overhang bottoms of all the formed parts are not flat. As the distance increased from the solid support area, the height gradually decreased. Figure 4 shows a partially enlarged detail of the fourth group (2.0 mm × 1.8 mm), which demonstrated a better forming result than the other groups. The actual forming height of the sample was shorter than expected, as is the length of the overhang structure, and a large amount of granular powder occurred at the bottom. The actual forming bottom is inclined.
Figure 5a shows the deformation of the top area of the part. With the increase in the forming height, the warping of the top area gradually improved and finally tended toward 0 mm. Compared with the experimental group with a longer overhanging length, the deformation of the top area with a shorter overhanging length decreased faster. Figure 5b shows the actual forming lengths of different combinations. Figure 5a shows that the actual manufacturing length of the samples with lengths of 2.0 mm and 2.5 mm are capable of meeting the design requirements. As the overhanging length continued to increase, the actual lengths of C, D, and E, shown in in Figure 5b, demonstrated a large deviation. For group C, which has an overhanging length of 3.0 mm, the actual length was less than the design length when the forming height was less than 0.6 mm (20 layers). When the overhanging height was 1.8 mm (60 layers), the actual length was greater than the design length.
Throughout the experiment, it was found that the forming defects mainly consisted of dross formation and warping in the printing process. The dross formation mainly appeared at the bottom of the overhang layer, while the warping mainly appeared at the edge of the overhang layer. In order to further explore the forming process of the defects, the LPBF process was simulated.

3.2. Temperature Analysis

Figure 6 shows the temperature distribution cloud diagram of the laser scanning of the powder support zone and the solid support zone. Figure 6a,b show the difference between the solid support zone and the powder support zone on the X–Y plane, while Figure 6c,d show the difference between the solid support zone and the powder support zone on the Y–Z plane. The cloud images were taken on the same scale, and the temperature scale of the cloud image was processed. A temperature boundary of 570 °C, which is the melting point of AlSi10Mg, was added. Therefore, the size of the molten pool in the printing process was within the boundary. In Figure 6c,d, it can be clearly seen that the molten pool in the solid support zone is smaller than the molten pool in the powder support zone. It is hard for heat to travel downward in the powder support zone during the forming process of the overhang structure because the thermal conductivity of powder is much smaller; therefore, the molten pool in the powder support zone is larger [10].
Temperature is the key factor affecting the size of the molten pool. In order to further study the specific process of change of the temperature in different support areas, six points were equally spaced on the first track of both the first and third layers, as shown in Figure 7a,b. On the second and fourth layers, the midpoint of each laser was taken as the research point. In Figure 7, the blue dots represent the secant lines of the overhanging area. The left side of the line is the powder support zone, and the other side is the solid support zone. The interval between the six points in the first layer and the third layer was 0.09 mm, the distance between point A and the starting point of Track 1 on Layer 1 was 0.02 mm, and the distance between point P and the end point of Track 1 on Layer 3 was 0.02 mm. In the second and fourth layers, the midpoints of each scanning track were selected. The spacing of all scanning tracks was 0.13 mm.
Figure 8 shows the temperature variation with time at each research point in the first four layers. The pink dotted line in the vertical direction corresponds to the time at which the laser reached this point. As can be seen from Figure 8, the peak temperature appeared after the arrival time. This is because when the laser passes the current point it continues to heat the parts, and the temperature is conducted to the previous point due to heat conduction; therefore, the temperature rises at the previous point and reaches the maximum value. Figure 8a shows the scanning results of the first layer. When the laser scanning was on the solid support zone, the highest temperature at three points, A, B, and C, gradually increased. When the laser scanning was on the powder support zone, the temperature variation range between two points, C and D, was significantly larger than the temperature variation between three points, A, B, and C. When the laser scanning was at point D, the maximum temperature of the point increased significantly, and the increase between two points, C and D, was more than 14%. Figure 8b shows the scanning results of the second layer, which starts from the powder support zone. Figure 8b shows that when the laser scanned from H to I, the maximum temperature decreased significantly, and the temperature between the two points in the same zone kept increasing, such as at G and H and at I and J. A further analysis of the results shows that the temperature between the two points H and I fell, which is because G and H where at the powder support zone where the temperature is conducted slowly outward due to the bottom of the area being powder; therefore, the molten pool at the G and H points was larger. When the laser scanned from points H to I, the thermal conductivity was approximately 100 times that of the powder because the bottom of the area was solid. This made the temperature conduct outward faster, so there was a significant drop in temperature. Similarly, the same result can be observed in Figure 8c. The scanning sequence of the third layer is also from the powder support zone to the solid support zone. In the process of laser scanning from M to N, the temperature also decreased. However, with the increase in the scanning layer, the temperature variation between the two regions became increasingly smaller when the laser passed through the boundary. Comparing Figure 8a,c, the highest temperature decreased from 2497 °C to 1659 °C. In Figure 8b,d, the maximum temperature decreased from 1821.8 °C to 1731 °C. This is mainly because the thermal conductivity of the powder support zone is improved by the manufacture of the first few layers and is equivalent to providing a thin, solid support zone for the current layer so that the heat can be transferred to the bottom layer faster than before. This situation is more obvious in Figure 8d. The increase of the highest temperature point tended to be the same among all points, and the temperature change from point R to point S was not as obvious as the temperature change between points H and I. This is also because the laser heating rate is much higher than the cooling rate in the LPBF process of creating an overhang structure [41]. Therefore, the influence of thermal conductivity on the molten pool and temperature field is more obvious.

3.3. Dross Formation Process

As shown in Figure 8, the temperature distribution in different areas was very large: when the laser scans the solid support zone, heat can be conducted at the bottom because of the higher thermal conductivity of the currently established area. However, when the laser scans the powder support zone, the thermal conductivity of the powder is only 1% of the entity; therefore, it is difficult for heat to be conducted at the powder layer. The heat can only be conducted in the formed area in the current layer. Due to the accumulation of the heat in the powder support zone and a dramatic increase in temperature, the size of the molten pool increased. The overhanging bottom was not connected to the substrate, so the excessive molten pool melted the powder at the bottom, thus exceeding the original contour. Figure 4 shows the part of the experimental result in which there are a large number of spherical formations at the bottom of overhang structure. Figure 9 shows the schematic diagram of the process of dross formation. The molten pool in the powder support area sank to the bottom powder area due to gravity and the capillary force [10], resulting in many powder particles attaching to the bottom. The thermal cycle in the LPBF process makes the situation more complex, and the previously formed area also affects subsequent processing. These factors made the parts under the overhang area of the surface form a large number of globular dross formations, leading to the actual forming thickness in the process being greater than the design requirements. Therefore, the poor surface quality and dimensional accuracy do not meet the actual requirements.

3.4. Deformation Analysis

Figure 10 shows the resulting cloud map of the warping changes of each layer. The proportion of the deformation displayed is 1:1. It can be seen that the warp is concentrated at the bottom surface of the edge of the overhang structure. Previous studies proved that the warp tends to be more obvious at the edge of the overhang structure under the same conditions [4]. Figure 10 shows the deformation distribution along the Z−axis of the model. The cloud image distribution shows that the warping deformation of the top layer did not intensify all the time while the fourth layer was forming. When the model was formed to the first and second layers, as shown in Figure 10a,b, the maximum deformation area was concentrated on the overhanging area. The warping at the edge of the overhang structure is quite serious. In Figure 10c, as the processing progressed, the deformation at the top of the overhang structure began to differ from the deformation at the bottom. Figure 10 shows that the maximum deformation area did not move upward and the cloud image changed, taking the bottom of the left side of the overhang structure as the center of the circle, and gradually decreased outward. As shown in Figure 10d, the high deformation zone (red area) existed at the bottom when the fourth layer was fabricated and, with the increase in the forming layer, the deformation of the top layer was continuously alleviated compared with the third layer, as shown in Figure 10c.
In order to understand the trend of warpage, the maximum deformation value point of each layer was selected to draw the deformation trend map, as shown in Figure 11. In the process of machining, the maximum deformation of the overhang structure increases continuously, while the increasing amplitude is not constant. As shown by the midpoint plot in Figure 11, the difference in the maximum deformation amount between the second layer and the first layer is 28.5 μm. However, as the number of forming layers increased, the deformation of the top area decreased and the deformation of the parts increased continuously. The temperature gradient in the powder support zone was large, making the residual stress in the area large as well and bending occurred as the forming layer in this area had no bottom constraint and a low stiffness. In the manufacturing process of the initial two layers, the melting pool in the powder support zone of the second layer was still large. This affected the manufactured area of the first layer again in a manner equivalent to remelting the warped part of the first layer and further aggravating the overall deformation degree. When progress was made in the process, the number of formed layers increased continuously, and the stiffness of the overall structure increased as well. Therefore, when the subsequent layer was formed, the formed layer provided constraints that gradually reduced the subsequent deformation.

3.5. Residual Stress Analysis

As shown in Figure 8, the heating rate at each point was significantly greater than the cooling rate in the laser processing process; a higher heating rate may lead to instability in the molten pool and splashing [42], and the cooling rate affects the residual stress distribution of the LPBF parts [43]. When the laser scanned the powder support zone, the temperature rose significantly, and the temperature gradient was greater than that in the solid support zone.
Figure 12 shows the residual stress distribution of each layer. The residual stress distribution of the part was relatively uniform. The stress was concentrated inside the part, while the stress at the four corners of the part was obviously smaller, especially in the powder support area. This result conforms to the above analysis of the temperature field and temperature gradient. In the stress distribution diagram of the first layer in Figure 12a, the residual stress in the overhanging part was low. This is because the stiffness of the structure in the overhanging area was poor. Due to the large temperature gradient that occurred during the process, the residual stress exceeded the material strength, the deformation occurred at this position, and the residual stress was released. Therefore, the residual stress in this area was low. This same phenomenon also existed in the experiment. For the same overhang length group, the deformation of the first 20 layers (0.6 mm) was large. As the number of forming layers increased, the thickness of the overhanging part increased, and the structural stiffness was enhanced as well. The deformation diagram shows that the deformation of a subsequent layer was smaller than that of the previous layer. The residual stress in the overhanging part also increased with the increase from approximately 160 Mpa to 250 MPa in the forming layers, as shown in Figure 12b–d. In the stress distribution diagram, the stress was the largest in the contact area between the bottom of the part and the substrate. This was due to the stress concentration phenomenon in the corner position, where the print part and the substrate were in contact. At the edge, the temperature gradient was large because of the surrounding powder; therefore, the residual stress was also relatively large.

3.6. Warping Process

Some researchers believe that due to the lack of constraints on the other side of the struts for horizontal overhang structures, deformation gradually accumulates and eventually leads to failure [33]. However, the experimental results showed that a structure with an overhanging length of less than 3.0 mm can be formed successfully. When the overhang structure is in the early stage of manufacturing, as shown in Figure 13a,b, the residual stress in the forming process of the first few layers of the powder exceeds the material strength, and there is no entity to constrain its deformation because the bottom of the overhang area is supported by the powder at this time, making the deformation of the first few layers larger. The results in Figure 12 also confirm this conclusion: the low residual stress area at the edge of the part was mainly caused by the lack of constraints and deformation, which released stress. In the subsequent powder spreading process, the warping deformation of the part affected the powder spreading process of LPBF, as shown in Figure 13c,d. During the subsequent process, the laser directly heated the previously formed part area in the warping area because of the lack of powder, resulting in local remelting. The remelting results in a smoother surface [44]. The corresponding situation was also found in the experimental group, and there are obvious differences between the surface quality of the warped area and the top surface of the part. As the manufacturing progressed, the experiment and simulation results both showed that the condition of the subsequent forming layer gradually improves. This is because as more solids are generated, the thermal conductivity and stiffness of the powder support area tend to be the same as that of the solid support area in the same layer. As shown in Figure 8d, the temperature change of each point tends to be the same. Heat can be transferred to the formed area at the bottom of the overhanging area, which can also provide a certain constraint for the subsequent forming layer so that the top warpage gradually improves. However, when the overhang length exceeded 3.0 mm, the distance between the overhang edge portion and the solid pillar was too long, resulting in warpage that exceeded the thickness of the powder layer. Such a large deformation seriously affected the subsequent powder spreading process and caused damage to the scraper; therefore, the processing needed to be stopped.

4. Conclusions

In this article, a 3D FE model was developed to analyze the influence of the number of forming layers and the overhanging length on the warping and dross formation in the forming process of an overhang structure. Meanwhile, 30 groups of experiments with different parameters were carried out. Combined with the simulation results, the main conclusions are as follows:
  • The different thermal conductivity between the powder and solid support zone leads to the difference in the molten pool size, which is the main reason for the appearance of dross formation. The simulation result showed that when the laser scanned the powder support zone, the temperature difference between the two regions reached approximately 900 °C, causing the size of molten pool to increase significantly. The molten pool sank due to the actions of gravity and the capillary force, leading to the droplet−like dross formation on the lower surface beyond the designed shape area. With the increase in the number of forming layers, each formed layer plays a role in heat conduction; therefore, the difference becomes smaller and smaller;
  • The main reason for warping deformation is that when manufacturing commences, the overhang structure has no constraint; therefore, plastic deformation occurs when the residual stress exceeds the strength of the material. This leads to a low residual stress zone at the edge of overhang area. This deformation affects the subsequent powder spreading process, which makes the warping area exist in a state of remelting. As the number of forming layers increases, the stiffness of the overhang structure increases as well, and the warping deformation gradually decreases;
  • In the forming process, the warpage at the top of the parts that can be formed will continue to decrease. The results of the experiment showed that the top warpage reduced to zero for groups 1–6 (2 mm length) with a 1.2 mm (40 layers) height, groups 7–12 (2.5 mm length) with a 1.8 mm (60 layers) height, and groups 13–18 (3 mm length) with a 2.4 mm (80 layers) height. During the simulation process, as the number of forming layers increased, the deformation of the top area decreased from 28.5 μm to 9.18 μm, and the warpage of the parts increased from 2.44 μm to 56.1 μm. These values indicate that with the increase in the number of manufacturing layers, the overall warping of the parts also increased, while the top warping gradually decreased.
This study is helpful for understanding the generation and change of defects and can provide some ideas for subsequent process parameter optimization. For example, from the simulation results, it seems that different scanning methods will have a greater impact. At the same time, improving the thermal conductivity of the powder support area is a key problem to be solved. Future work can continue from the above aspects to study the optimization of the overhanging structure.

Author Contributions

Conceptualization: C.S. and Y.Y.; investigation, C.S., P.L. and M.W.; methodology, M.W. and V.A.T.; validation, P.L.; writing—original draft, P.L.; writing—review and editing, M.W., C.S. and Y.Y. All authors have read and agreed to the published version of the manuscript.

Funding

This research was supported by the Guangdong Basic and Applied Basic Research Foundation (2020B1515120013, 2022B1515120066), National Natural Science Foundation of China (No. U2001218), Key-Area Research and Development Program of Guangdong Province (2020B090923001). Special Support Foundation of Guangdong Province (No. 2019TQ05Z110).

Institutional Review Board Statement

Not applicable.

Informed Consent Statement

Not applicable.

Data Availability Statement

Not applicable.

Conflicts of Interest

The authors declare no conflict of interest.

References

  1. Bo, Q.; Yu-Sheng, S.; Qing-Song, W.; Hai-Bo, W. The helix scan strategy applied to the selective laser melting. Int. J. Adv. Manuf. Technol. 2012, 63, 631–640. [Google Scholar] [CrossRef]
  2. Xie, D.; Zhao, J.; Liang, H.; Shen, L.; Tian, Z.; Ahsan, N.; Song, Y.; Xiao, M. Comprehension of overhanging structure distortion via selective laser melting based on theory of constraining force induced distortion. In Proceedings of the 17th International Bhurban Conference on Applied Sciences and Technology (IBCAST), Islamabad, Pakistan, 14–18 January 2020; pp. 1–4. [Google Scholar]
  3. Atzeni, E.; Salmi, A. Study on unsupported overhangs of AlSi10Mg parts processed by Direct Metal Laser Sintering (DMLS). J. Manuf. Process. 2015, 20, 500–506. [Google Scholar] [CrossRef]
  4. Li, L.; Pan, T.; Zhang, X.; Chen, Y.; Cui, W.; Yan, L.; Liou, F. Deformations and stresses prediction of cantilever structures fabricated by selective laser melting process. Rapid Prototyp. J. 2021, 27, 453–464. [Google Scholar] [CrossRef]
  5. Lin, H.-Y.; Tran, H.-C.; Lo, Y.-L.; Le, T.-N.; Chiu, K.-C.; Hsu, Y.-Y. Optimization of Surface Roughness and Density of Overhang Structures Fabricated by Laser Powder Bed Fusion. 3D Print. Addit. Manuf. 2022. [Google Scholar] [CrossRef]
  6. Zhao, J.; Xie, D.; Liang, H.; Xiao, M.; Shen, L.; Tian, Z. Review of Distortion and Residual Stress in Metal Additive Manufacturing. J. Nanjing Univ. Aeronaut. Astronaut. 2019, 51, 1–6. [Google Scholar] [CrossRef]
  7. Kruth, J.P.; Froyen, L.; Vaerenbergh, J.V.; Mercelis, P.; Rombouts, M.; Lauwers, B. Selective laser melting of iron-based powder. J. Mater. Process. Technol. 2004. [Google Scholar] [CrossRef]
  8. Charles, A.; Elkaseer, A.; Paggi, U.; Thijs, L.; Hagenmeyer, V.; Scholz, S. Down-facing surfaces in laser powder bed fusion of Ti6Al4V: Effect of dross formation on dimensional accuracy and surface texture. Addit. Manuf. 2021, 46, 102148. [Google Scholar] [CrossRef]
  9. Jia, H.; Sun, H.; Wang, H.; Wu, Y.; Wang, H. Scanning strategy in selective laser melting (SLM): A review. Int. J. Adv. Manuf. Technol. 2021, 113, 2413–2435. [Google Scholar] [CrossRef]
  10. Wang, D.; Yang, Y.; Yi, Z.; Su, X. Research on the fabricating quality optimization of the overhanging surface in SLM process. Int. J. Adv. Manuf. Technol. 2013, 65, 1471–1484. [Google Scholar] [CrossRef]
  11. Duan, W.; Han, J.; Xia, Q.; Wang, K.; Wu, M.; Song, D. Investigation on the relationship between bending angle of the overhanging surface and overhanging surface quality printed using selective laser melting. Rapid Prototyp. J. 2021, 27, 1573–1579. [Google Scholar] [CrossRef]
  12. Ossola, E.; Shapiro, A.A.; Pate, A.; Firdosy, S.; Brusa, E.; Sesana, R. Fabrication defects and limitations of AlSi10Mg lattice structures manufactured by selective laser melting. Proc. Inst. Mech. Eng. Part L J. Mater. Des. Appl. 2021, 235, 2071–2082. [Google Scholar] [CrossRef]
  13. Vora, P.; Mumtaz, K.; Todd, I.; Hopkinson, N. AlSi12 in-situ alloy formation and residual stress reduction using anchorless selective laser melting. Addit. Manuf. 2015, 7, 12–19. [Google Scholar] [CrossRef] [Green Version]
  14. Vasileska, E.; Demir, A.G.; Colosimo, B.M.; Previtali, B. A novel paradigm for feedback control in LPBF: Layer-wise correction for overhang structures. Adv. Manuf. 2022, 10, 326–344. [Google Scholar] [CrossRef]
  15. Ma, Z.; Gao, M.; Guo, K.; Wang, Q.; Li, L.; Liu, C.; Zhu, G.; Liu, Z. Analysis and Optimization of Energy Consumption for Multi-part Printing Using Selective Laser Melting and Considering the Support Structure. Int. J. Precis. Eng. Manuf. Technol. 2022, 1–15. [Google Scholar] [CrossRef]
  16. Yadroitsev, I.; Shishkovsky, I.; Bertrand, P.; Smurov, I. Manufacturing of fine-structured 3D porous filter elements by selective laser melting. Appl. Surf. Sci. 2009, 255, 5523–5527. [Google Scholar] [CrossRef]
  17. Ameen, W.; Al-Ahmari, A.; Mohammed, M.K. Self-supporting overhang structures produced by additive manufacturing through electron beam melting. Int. J. Adv. Manuf. Technol. 2019, 104, 2215–2232. [Google Scholar] [CrossRef]
  18. Oter, Z.C.; Coskun, M.; Akca, Y.; Surmen, O.; Yilmaz, M.S.; Ozer, G.; Tarakci, G.; Khan, H.M.; Koc, E. Support optimization for overhanging parts in direct metal laser sintering. Optik 2019, 181, 575–581. [Google Scholar] [CrossRef]
  19. Kappes, B.; Moorthy, S.; Drake, D.; Geerlings, H.; Stebner, A. Machine learning to optimize additive manufacturing parameters for laser powder bed fusion of Inconel 718. In Proceedings of the 9th International Symposium on Superalloy 718 and Derivatives-Energy, Aerospace, and Industrial Applications, Champion, PA, USA, 17–21 September 2000; pp. 595–610. [Google Scholar]
  20. Gu, D.; Yang, J.; Wang, H.; Lin, K.; Yuan, L.; Hu, K.; Wu, L. Laser powder bed fusion of bio-inspired reticulated shell structure: Optimization mechanisms of structure, process, and compressive property. CIRP J. Manuf. Sci. Technol. 2021, 35, 1–12. [Google Scholar] [CrossRef]
  21. Han, Q.; Gu, H.; Soe, S.; Setchi, R.; Lacan, F.; Hill, J. Manufacturability of AlSi10Mg overhang structures fabricated by laser powder bed fusion. Mater. Des. 2018, 160, 1080–1095. [Google Scholar] [CrossRef]
  22. Le, K.; Wong, C.; Chua, K.; Tang, C.; Du, H. Discontinuity of overhanging melt track in selective laser melting process. Int. J. Heat Mass Transf. 2020, 162, 120284. [Google Scholar] [CrossRef]
  23. Yadroitsev, I.; Yadroitsava, I. Evaluation of residual stress in stainless steel 316L and Ti6Al4V samples produced by selective laser melting. Virtual Phys. Prototyp. 2015, 10, 67–76. [Google Scholar] [CrossRef]
  24. Zhang, J.; Song, B.; Wei, Q.; Bourell, D.; Shi, Y. A review of selective laser melting of aluminum alloys: Processing, microstructure, property and developing trends. J. Mater. Sci. Technol. 2019, 35, 270–284. [Google Scholar] [CrossRef]
  25. Brika, S.E.; Letenneur, M.; Dion, C.A.; Brailovski, V. Influence of particle morphology and size distribution on the powder flowability and laser powder bed fusion manufacturability of Ti-6Al-4V alloy. Addit. Manuf. 2020, 31, 100929. [Google Scholar] [CrossRef]
  26. Liu, B.; Li, B.-Q.; Li, Z.; Bai, P.; Wang, Y.; Kuai, Z. Numerical investigation on heat transfer of multi-laser processing during selective laser melting of AlSi10Mg. Results Phys. 2019, 12, 454–459. [Google Scholar] [CrossRef]
  27. Liu, S.; Zhu, H.; Peng, G.; Yin, J.; Zeng, X. Microstructure prediction of selective laser melting AlSi10Mg using finite element analysis. Mater. Des. 2018, 142, 319–328. [Google Scholar] [CrossRef]
  28. Huang, Y.; Yang, L.; Du, X.; Yang, Y. Finite element analysis of thermal behavior of metal powder during selective laser melting. Int. J. Therm. Sci. 2016, 104, 146–157. [Google Scholar] [CrossRef]
  29. Lewis, R.W.; Nithiarasu, P.; Seetharamu, K.N. Fundamentals of the Finite Element Method for Heat and Fluid Flow; John Wiley & Sons: Hoboken, NJ, USA, 2004. [Google Scholar]
  30. Dai, K.; Shaw, L. Finite element analysis of the effect of volume shrinkage during laser densification. Acta Mater. 2005, 53, 4743–4754. [Google Scholar] [CrossRef]
  31. Pei, W.; Zhengying, W.; Zhen, C.; Junfeng, L.; Shuzhe, Z.; Jun, D. Numerical simulation and parametric analysis of selective laser melting process of AlSi10Mg powder. Appl. Phys. A-Mater. Sci. Process. 2017, 123, 540. [Google Scholar] [CrossRef]
  32. Yin, J.; Zhu, H.; Ke, L.; Hu, P.; He, C.; Zhang, H.; Zeng, X. A finite element model of thermal evolution in laser micro sintering. Int. J. Adv. Manuf. Technol. 2016, 83, 1847–1859. [Google Scholar] [CrossRef]
  33. Zhang, X.; Wang, J.; Kang, J.; Rong, Y.; Duan, G.; Wu, P.; Zheng, L. The dynamic arch bending mechanism of flat bridge structure of AlSi10Mg during SLM process. Mater. Des. 2020, 188, 108469. [Google Scholar] [CrossRef]
  34. Liu, S.; Zhu, J.; Zhu, H.; Yin, J.; Chen, C.; Zeng, X. Effect of the track length and track number on the evolution of the molten pool characteristics of SLMed Al alloy: Numerical and experimental study. Opt. Laser Technol. 2020, 123, 105924. [Google Scholar] [CrossRef]
  35. Aboulkhair, N.T.; Everitt, N.M.; Ashcroft, I.; Tuck, C. Reducing porosity in AlSi10Mg parts processed by selective laser melting. Addit. Manuf. 2014, 1, 77–86. [Google Scholar] [CrossRef]
  36. Foroozmehr, A.; Badrossamay, M.; Foroozmehr, E.; Golabi, S. Finite Element Simulation of Selective Laser Melting process considering Optical Penetration Depth of laser in powder bed. Mater. Des. 2016, 89, 255–263. [Google Scholar] [CrossRef]
  37. Wu, J.; Wang, L.; An, X. Numerical analysis of residual stress evolution of AlSi10Mg manufactured by selective laser melting. Optik 2017, 137, 65–78. [Google Scholar] [CrossRef]
  38. Wang, L.; Jiang, X.; Zhu, Y.; Zhu, X.; Sun, J.; Yan, B. An approach to predict the residual stress and distortion during the selective laser melting of AlSi10Mg parts. Int. J. Adv. Manuf. Technol. 2018, 97, 3535–3546. [Google Scholar] [CrossRef]
  39. Xiaohui, J.; Chunbo, Y.; Honglan, G.; Shan, G.; Yong, Z. Effect of supporting structure design on residual stresses in selective laser melting of AlSi10Mg. Int. J. Adv. Manuf. Technol. 2022, 118, 1597–1608. [Google Scholar] [CrossRef]
  40. Jiang, X.; Xiong, W.; Wang, L.; Guo, M.; Ding, Z. Heat treatment effects on microstructure-residual stress for selective laser melting AlSi10Mg. Mater. Sci. Technol. 2020, 36, 168–180. [Google Scholar] [CrossRef]
  41. Wu, F.; Sun, Z.; Chen, W.; Liang, Z. The Effects of Overhang Forming Direction on Thermal Behaviors during Additive Manufacturing Ti-6Al-4V Alloy. Materials 2021, 14, 3749. [Google Scholar] [CrossRef]
  42. Liu, Y.; Yang, Y.; Mai, S.; Wang, D.; Song, C. Investigation into spatter behavior during selective laser melting of AISI 316L stainless steel powder. Mater. Des. 2015, 87, 797–806. [Google Scholar] [CrossRef]
  43. Liu, Y.; Yang, Y.; Wang, D. A study on the residual stress during selective laser melting (SLM) of metallic powder. Int. J. Adv. Manuf. Technol. 2016, 87, 647–656. [Google Scholar] [CrossRef]
  44. Jun, S.; Qian, T.; Qixiang, F.; Shuai, M.; Quanquan, H.; Setchi, R. Effect of Remelting Process on Surface Quality and Tensile Behaviour of a Maraging Steel Manufactured by Selective Laser Melting; Springer: Singapore, 2021; pp. 251–260. [Google Scholar]
Figure 1. Illustration of part shapes and scanning strategy: (a) the distribution of parts on the substrate; (b) the shape of sample parts; and (c) 90° scanning strategy.
Applsci 13 03460 g001
Figure 2. Finite element model: (a) model geometric information and (b) local amplification.
Applsci 13 03460 g002
Figure 3. Different heights and lengths of overhang structure specimens.
Applsci 13 03460 g003
Figure 4. Partial enlargement diagram of the sample.
Applsci 13 03460 g004
Figure 5. Experiment results: (a) deformation and (b) formed length of overhang structure.
Applsci 13 03460 g005
Figure 6. The temperature distribution of layer 1: (a) scan of the solid support zone on the X–Y plane; (b) scan of the powder support zone on the X–Y plane; (c) scan of the solid support zone on the Y–Z plane; and (d) scan of the powder support zone on the Y–Z plane.
Applsci 13 03460 g006
Figure 7. Studied points on different overhang layers: (a) Layer 1; (b) Layer 2; (c) Layer 3; and (d) Layer 4.
Applsci 13 03460 g007
Figure 8. Temperature histories at different study points: (a) Layer 1; (b) Layer 2; (c) Layer 3; and (d) Layer 4.
Applsci 13 03460 g008
Figure 9. Schematic diagram of dross formation generation process.
Applsci 13 03460 g009
Figure 10. Deformation at different study points: (a) Layer 1; (b) Layer 2; (c) Layer 3; and (d) Layer 4.
Applsci 13 03460 g010
Figure 11. The deformation and its increment between different layers.
Applsci 13 03460 g011
Figure 12. Residual stress: (a) Layer 1; (b) Layer 2; (c) Layer 3; and (d) Layer 4.
Applsci 13 03460 g012
Figure 13. Illustration of overhang structure warping deformation process.
Applsci 13 03460 g013
Table 1. Chemical composition of AlSi10Mg powders (wt%).
AlSiMgFeMnZnNi
Balance9.660.420.100.2<0.010.02
Table 2. Experimental design for different lengths of overhang structure.
TrialLength of Overhang Structure (mm)Laser Power (W)Beam Diameter (mm)Layer Thickness (mm)Hatch Spacing (mm)Scan Speed (m/s)Scan Strategy
1–62.03000.10.030.131.390° rotation
7–122.53000.10.030.131.390° rotation
13–183.03000.10.030.131.390° rotation
19–243.53000.10.030.131.390° rotation
25–304.03000.10.030.131.390° rotation
31–364.53000.10.030.131.390° rotation
37–425.03000.10.030.131.390° rotation
Table 3. Temperature−independent physical properties of AlSi10Mg alloy [37,38,39,40].
Temperature (°C)201203205208201120
Density (kg/m3)266026432606256823742266
Thermal conductivity (W/(m·K))15014413012010763
Specific heat capacity (J/(kg·K))7007488481066922925
Density (powder) (kg/m3)1596158615631541
Thermal conductivity (powder)
(W/(m·K))
1.51.41.31.2
Specific heat capacity (powder)
(J/(kg·K))
4204495091066
Coefficient of thermal expansion (10−6/K)21.721.831.420.6
Young’s modulus (GPa)7672645200
Poisson’s ratio0.320.330.340.360.50.5
Yield strength (MPa)25015010570
Latent heat (J/kg)3.9 × 105
Disclaimer/Publisher’s Note: The statements, opinions and data contained in all publications are solely those of the individual author(s) and contributor(s) and not of MDPI and/or the editor(s). MDPI and/or the editor(s) disclaim responsibility for any injury to people or property resulting from any ideas, methods, instructions or products referred to in the content.

