Article

Vision Transformer Approach for Classification of Alzheimer’s Disease Using 18F-Florbetaben Brain Images

1
Department of Translational Biomedical Sciences, College of Medicine, Dong-A University, Busan 49201, Republic of Korea
2
Institute of Convergence Bio-Health, Dong-A University, Busan 49201, Republic of Korea
3
Department of Information Sciences and Mathematics, Dong-A University, Busan 49315, Republic of Korea
4
Department of Management Information Systems, Dong-A University, Busan 49236, Republic of Korea
5
Department of Nuclear Medicine, Dong-A University Hospital, Dong-A University College of Medicine, Busan 49201, Republic of Korea
*
Author to whom correspondence should be addressed.
Appl. Sci. 2023, 13(6), 3453; https://doi.org/10.3390/app13063453
Submission received: 10 February 2023 / Revised: 3 March 2023 / Accepted: 6 March 2023 / Published: 8 March 2023
(This article belongs to the Special Issue Deep Learning and Machine Learning in Biomedical Data)

Abstract

:
Dementia is a degenerative disease that is increasingly prevalent in an aging society. Alzheimer’s disease (AD), the most common type of dementia, is best mitigated via early detection and management. Deep learning is an artificial intelligence technique that has been used to diagnose and predict diseases by extracting meaningful features from medical images. The convolutional neural network (CNN) is a representative application of deep learning, serving as a powerful tool for the diagnosis of AD. Recently, vision transformers (ViT) have yielded classification performance exceeding that of CNN in some diagnostic image classifications. Because the brain is a very complex network with interrelated regions, ViT, which captures direct relationships between images, may be more effective for brain image analysis than CNN. Therefore, we propose a method for classifying dementia images by applying 18F-Florbetaben positron emission tomography (PET) images to ViT. Data were evaluated via binary (normal control and abnormal) and ternary (healthy control, mild cognitive impairment, and AD) classification. In a performance comparison with the CNN, VGG19 was selected as the comparison model. Consequently, ViT yielded more effective performance than VGG19 in binary classification. However, in ternary classification, the performance of ViT cannot be considered excellent. These results show that it is hard to argue that the ViT model is better at AD classification than the CNN model.

1. Introduction

Dementia is a degenerative disease that is increasing in prevalence within an aging population [1]. Alzheimer’s disease (AD) is the most common type of dementia, accounting for 60–80% of dementia cases, and is one of the leading causes of death worldwide [2]. AD begins with mild declines in memory, thinking, and learning processes and may lead to severe loss of consciousness and difficulty with physical abilities due to brain damage [3]. Although it is possible to prevent and delay the onset of AD using FDA-approved therapeutic approaches, there is currently no treatment that can dramatically reverse the pathological changes following onset [4]. Therefore, early detection and management are the best ways to slow the progression of AD, and early diagnosis is especially crucial.
AD biomarkers (biological markers of diseases such as amyloid and tau) can be utilized for the early identification of diseases in people with mild or no cognitive impairment [5]. Amyloid accumulation in the brain, which is one of the causes of AD, is known to occur when an abnormal form of amyloid is deposited in the brain due to a metabolic problem [6]. Through an amyloid positron emission tomography (PET) test, an amyloid biomarker is injected into the body, and a brain image is taken to determine the location and amount of the deposited amyloid.
Deep learning is an artificial intelligence technique that has been used to diagnose and predict diseases by extracting meaningful features from medical images [7,8,9]. The convolutional neural network (CNN), a representative application of deep learning, is primarily used in image data recognition tasks, and has also been employed as a powerful tool in diagnosing AD [10,11,12]. Almost all previous studies have used CNN-based backbones for feature extraction; however, vision transformers (ViT) have recently emerged as an image diagnostic classification tool to replace CNNs. The transformer architecture was initially developed for the natural language processing (NLP) field [13]. It has since been applied to computer vision tasks [14,15,16], as it yields a performance exceeding that of CNN in some diagnostic image classifications [17,18,19]. Whereas a CNN uses a convolutional filter to gradually extract important features from an entire image, a ViT directly captures the correlation between image areas. Because the brain is a very complex network with interrelated regions, vision transformers that capture direct relationships between images may be more effective for brain image analysis than CNN.
Many prior studies have conducted AD classification by applying FBB PET images to various CNN models; however, such images have not yet been used for ViT models. The most common type of data used with ViT is MRI data [17,18,19,20,21,22,23], with 18F FDG images used as PET images [24,25]. We therefore applied a novel 18F-FBB PET image to a ViT, and subsequently evaluated the classification performance. VGG19 [24] was selected for comparison with ViT, with both models being pre-trained using ImageNet. The performance of the two pre-trained models was evaluated through a two-group classification (normal control and abnormal) and three-group classification (healthy control, mild cognitive impairment, and Alzheimer’s disease).
This article makes several contributions. First, it was confirmed that the pretrained model and augmented data effectively classify brain PET image data into brain imaging regions. Lack of medical image data is a chronic problem in learning models, and this study utilized data augmentation to solve the imbalance of each class among the data. We expected that the learning performance would improve considering the non-generalization of the model when training an insufficient amount of brain PET images as data, but rather, when the model is trained by augmenting data with severely imbalanced data of each class, we found that the learning performance was worse. Second, to evaluate the possibility of replacing VGG19 and ViT models with CNN in AD classification using brain PET images, we compared VGG19 and ViT models in terms of classification performance. We expected either the ViT model or the CNN model to have better classification performance, but the ViT model performed better than the VGG19 model on the binary classification task and performed poorly on the ternary classification task. The ViT model did not necessarily outperform the CNN model in brain PET image AD classification.

1.1. Related Works

Due to the importance of prevention and delay, there are many studies on the diagnostic classification of AD. For example, Hu et al. [26] proposed a VGG-TSwinformer model based on a convolutional neural network (CNN) and transformer. The classification process of stable MCI (sMCI) and progressive MCI (pMCI) was performed, and an accuracy of 77.2%, sensitivity of 79.97%, specificity of 71.59%, and AUC of 0.8153 were obtained. The VGG-TSwinformer model is a deep learning model for short-term longitudinal studies of MCI that can build a model of brain atrophy progression from longitudinal MRI images and improve diagnostic efficiency compared to algorithms that only use cross-sectional sMRI images. Yin et al. [19] proposed a SMIL-DeiT network for the AD classification task between three groups: AD, MCI, and normal control (NC). Vision Transformer is the basic structure of our work, and the data pre-training was performed using DINO, a self-supervised technique, while the downstream classification task was performed by multi-instance learning. The learning performance reached 93.2% on the Alzheimer’s Disease Neuroimaging Initiative (ADNI) dataset (MRI), with the accuracy higher than 90.1% of Transformer and 90.8% of CNN. Carcagnì et al. [27] studied three deep convolutional models (ResNet, DenseNet, and EfficientNet) and two transducer-based architectures (MAE and DeiT) to improve the automatic detection of dementia in MRI brain images. Experiments showed that the very deep ResNet and DenseNet models performed better than the shallow ResNet and VGG versions tested in the literature. The significant improvement in accuracy (up to 7%) motivated us to consider the CAD approach in real-world applications. Lyu et al. [17] proposed a slicewise convolutional embedding method to improve the standard patching operation in vanilla ViT. The proposed cross-domain transfer learning method classified AD and CN, with an accuracy of 95.3%, recall of 94.4%, and precision of 90.0%, which can achieve similar classification performance compared to the most recent research. Kadri et al. [28] proposed a multimodal method based on MRI and PET modalities for the diagnosis of Alzheimer’s disease using a combination of efficientnet V2 and a vision converter enhanced by a novel data augmentation based on self attention generative adversarial networks (SAGAN). The proposed method achieved 96% accuracy by combining the main advantages of vision transducer and Efficientnet V2. We validated the proposed method using ADNI and the Open Access Series of Imaging Studies (OASIS). Jang et al. [29] proposed a three-dimensional medical image classifier using Multi-plane and Multi-slice Transformer (M3T) networks to classify Alzheimer’s disease in three-dimensional MRI images. They used the Alzheimer’s Disease Neuroimaging Initiative (ADNI) training dataset containing MRI images, and for validation data, they used datasets from three institutions (AIBL, OASIS, and ADNI). In the validation results, ADNI achieved AUC 0.9634 and ACC 93.21%, AIBL with AUC 0.9258 and ACC 93.27%, and OASIS with 0.8961 and ACC 85.26%, which demonstrated the feasibility of efficiently combining CNN and Transformer for 3D medical imaging. Kushol et al. [30] analyzed the performance of a multi-visual transducer network to detect AD based on features extracted from a set of 2D coronal slices. ImageNet was used to train the model with coronal 2D slices, which were selected to utilize transfer learning properties. The classification performance to distinguish between AD and CN showed an ACC of 88.2%, a recall of 95.6%, and a specificity of 77.4%. Zhu et al. [31] proposed an advanced deep learning architecture called Brain Informer (BraInf) based on an efficient self-attention mechanism. The proposed model integrated representation learning, feature extraction, and classifier modeling into a unified framework. The effectiveness of the proposed model was validated using the Alzheimer’s Disease Neuroimaging Initiative dataset. The model achieved 97.97% and 91.89% accuracy on the Alzheimer’s disease and mild cognitive impairment classification tasks, respectively. Liu et al. [32] proposed a novel transformer for disease classification based on multimodal data, the Multi-Modal Mixing Transformer (3MT). In addition to the fact that labeled medical images are already scarce, the performance of data-driven methods such as deep learning is severely hampered. Therefore, multimodal methods that can seamlessly handle missing data in various clinical settings are highly desirable. We tested our model for AD and NC classification using neuroimaging data, gender, age, and MMSE scores. The model used a novel cascaded modality transducer architecture with cross-attention to integrate multimodal information for prediction. 3MT was directly applied to AIBL after training on the ADNI dataset and achieved a test accuracy of 92.5% without fine-tuning. Wang et al. [33] proposed a hybrid machine learning framework consisting of multiple convolutional neural networks, which are linear support vector classifiers that use extracted image features along with non-image information to make robust final predictions. The model achieved an ACC of 88% and an AUC of 0.95 in classifying sMCI and pMCI. On a completely different cohort dataset collected from a different population, it achieved an ACC of 84% and an AUC of 0.91. Eroglu et al. [34] proposed an mRMR-based hybrid CNN in their study. First, they extracted MRI features from Darknet53, InceptionV3, and Resnet101 models. The extracted features were then concatenated. The obtained features were then optimized using the mRMR method. SVM and KNN classifiers were used to classify the optimized features, achieving an accuracy of 99.1%.

1.2. Organization of Article

In the introduction part of the article, the topic and related studies are examined. In the second part, the dataset used in the article are described. Then, the models and the methods are revealed. In the third part, the experiments and the results are presented. In the fourth part, the subject is discussed. Finally, the fifth part is the conclusion.

2. Materials and Methods

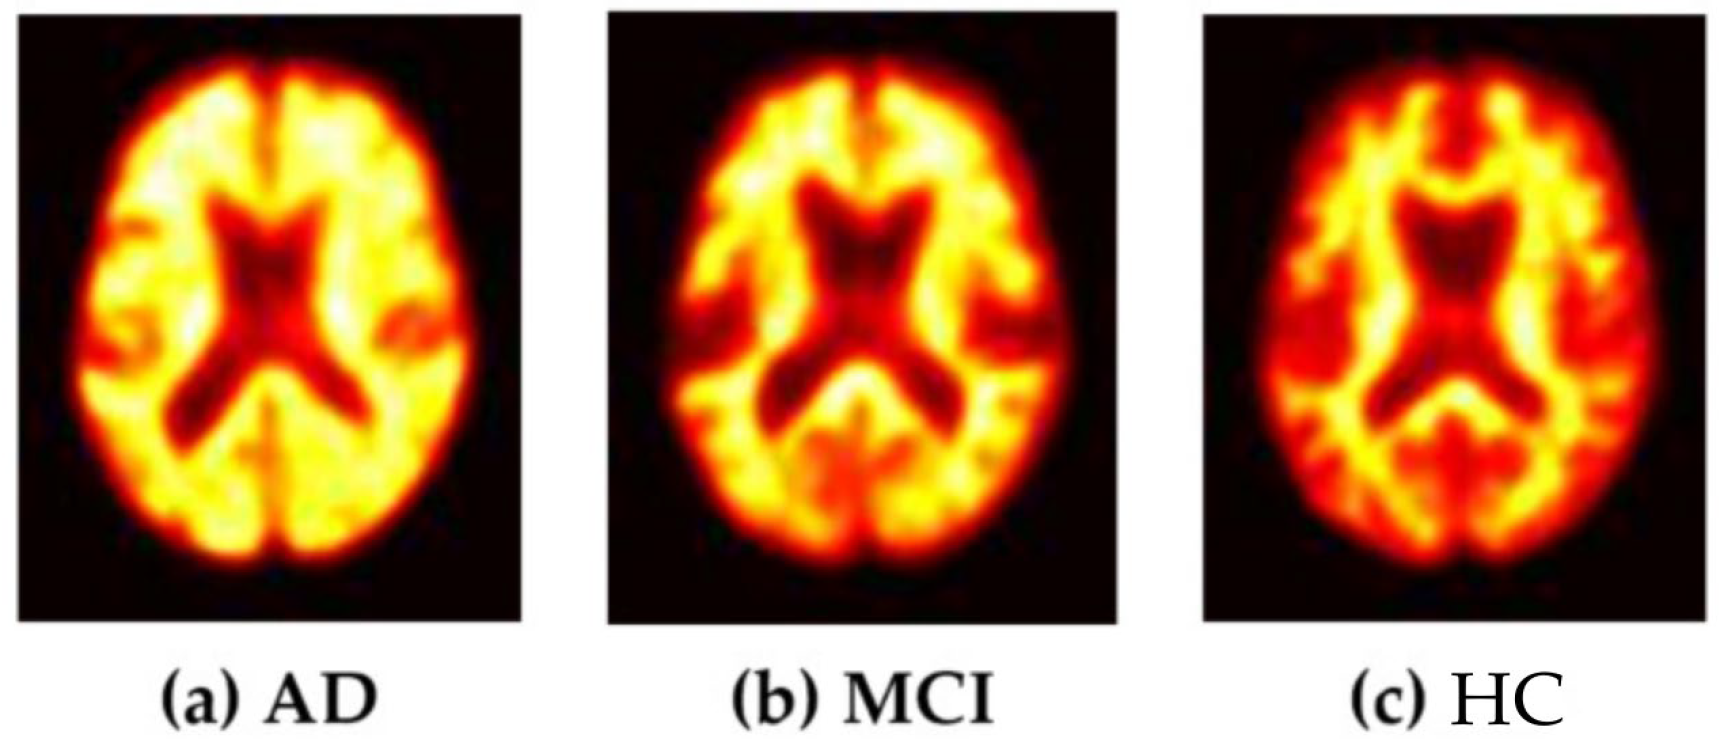
2.1. Data Acquisition

This study included subjects with dual FBB images who underwent FBB testing between 1 April 2016, and 30 June 2022, in the Dong-A University cohort. In total, 716 subjects underwent FBB testing during this period. We included 383 subjects, excluding those with neurological, medical, or psychiatric disorders, as well as cases of unavailable or damaged images. The 383 subjects were classified according to their diagnoses into 220 patients with AD, 113 patients with MCI, and 37 subjects as HC (Table 1, Figure 1). Each phase of an FBB image was confirmed by a nuclear medicine physician following collection to ensure that the Aβ distribution labels were accurate. The brain amyloid plaque load (BAPL) score is a system measured by a doctor according to the visual assessment of amyloid deposition. BAPL is a three-grade scoring system: BAPL score 1 is No Amyloid-β Load, BAPL score 2 is Minor Amyloid-β Load, and BAPL score 3 is significant amyloid-β load [35]. During binary classification, subjects with AD and MCI were classified in the “abnormal group,” whereas HC subjects were classified into the “normal group”. The Dong-A University Hospital Institutional Review Board (DAUHIRB) reviewed this study with the members who participated in the Institutional Review Board Membership List and approved this study protocol (DAUHIRB-17–108).

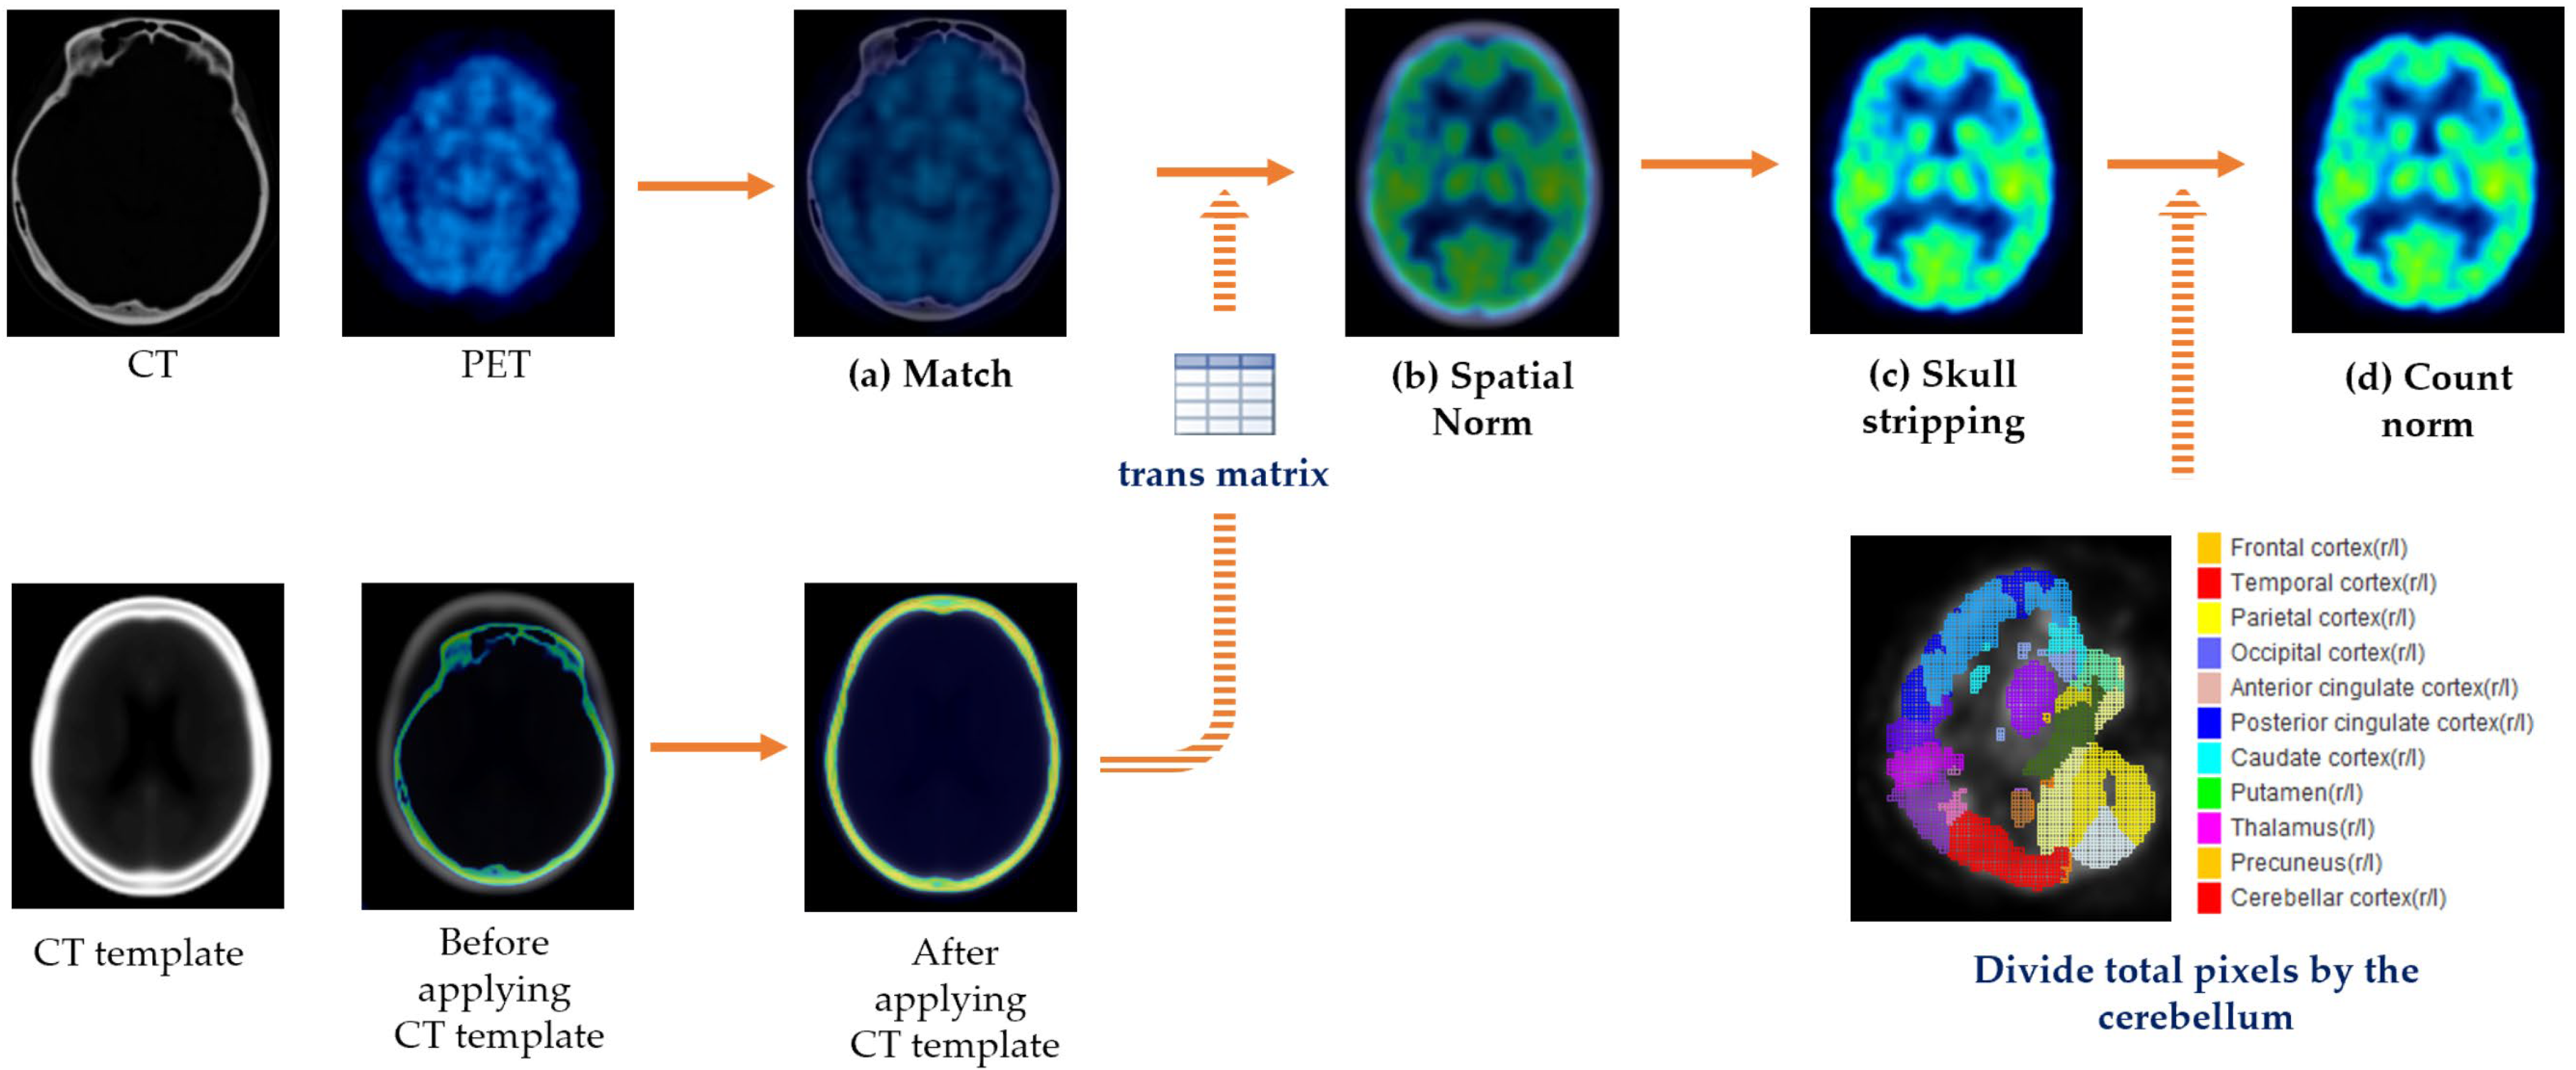
2.2. Data Preprocessing

2.2.1. Image Acquisition and Preprocessing

All PET scans were performed using a Biograph 40 m CT Flow PET/CT scanner (Siemens Healthcare, Knoxville, TN, USA). PET images were acquired by performing without an intravenous contrast agent at 100 kVP and 228 mA with a spin time of 0.5 s. The skull was scanned from apex to base using Ultra HD-PET (True X-TOF) for 90–110 min after injection.
Image pre-processing was performed using PMOD software (version 3.613, PMOD Technologies Ltd., Zurich, Switzerland). Using PMOD ‘s Fuse It program, CT and PET are called at the same time and matched. Using the Neuro program of PMOD, the area is cropped so that the CT image is not cut. Using PMOD’s Fusion program, trans matrix (tx) files are saved by matching standard CT images with cropped CT images. The matrix file is applied to the PET image and performs spatial normalization. The PET image is called up using PMOD’s View program and performs a count normalization with the cerebellum. Skull stripping was performed, enabling the model to classify only the brain tissue and finally acquire the preprocessed 3D image (size 91 × 109 × 91) (Figure 2).

2.2.2. Conversion of 3D Images to 2D Images and Data Augmentation

The final image obtained through preprocessing is a 3D image. Because the model accepts 2D images as input, each 3D image was converted to a 2D image. The 3D image was segmented into 91 pieces in the axial direction, and 28 pieces corresponding to the middle were selected. Consequently, 28 2D images were obtained for each subject. Data augmentation techniques were applied to maximize the dataset size and prevent overfitting. Specifically, we resized every image to 224 × 224 pixels as the input for the ViT model. For data analysis for the experiment, a MW Digitbox (single processor 4GPU) located at the Neuroscience Translational Research Solution Center (Busan, Republic of Korea) was used.
Transfer learning can alleviate the scarcity of training samples. Although transfer-trained models are known to be less sensitive to sample size [14], the sample size still affects transmission performance. Accordingly, we applied data augmentation to increase the amount of training data [36]. Data augmentation is a technology that increases the amount of data through various algorithms using machine learning and deep learning techniques. We applied only image rotation among the affine transforms, considering that amyloid plaques were identified in the entire brain when diagnosing AD with FBB images. Rotations of ±5°, ±10°, and ±15° were applied to each original image.
Test set was selected separately as BAPL scores 1, 2, and 3 indicated in Table 2a, and train/validation set was configured in consideration of the ratio of BAPL scores 1, 2, and 3 in Table 2b. The original and augmented datasets were constructed as shown in Table 2c. For the test data, 30 subjects were selected, with 10 subjects representing AD, MCI, and HC. Based on the test data, the original dataset was allocated according to a 6:2:2 ratio. The data were randomly extracted to configure the training and validation sets, with the test set for the augmented data prepared equivalently to that for the original data. The augmented data was configured by randomly extraction by applying ±5°, ±10°, and ±15° to the remaining data except the test data.

2.3. Pretrained Models Used in the Study

The architectures used in this study are the Vision Transformer and VGG19 models.

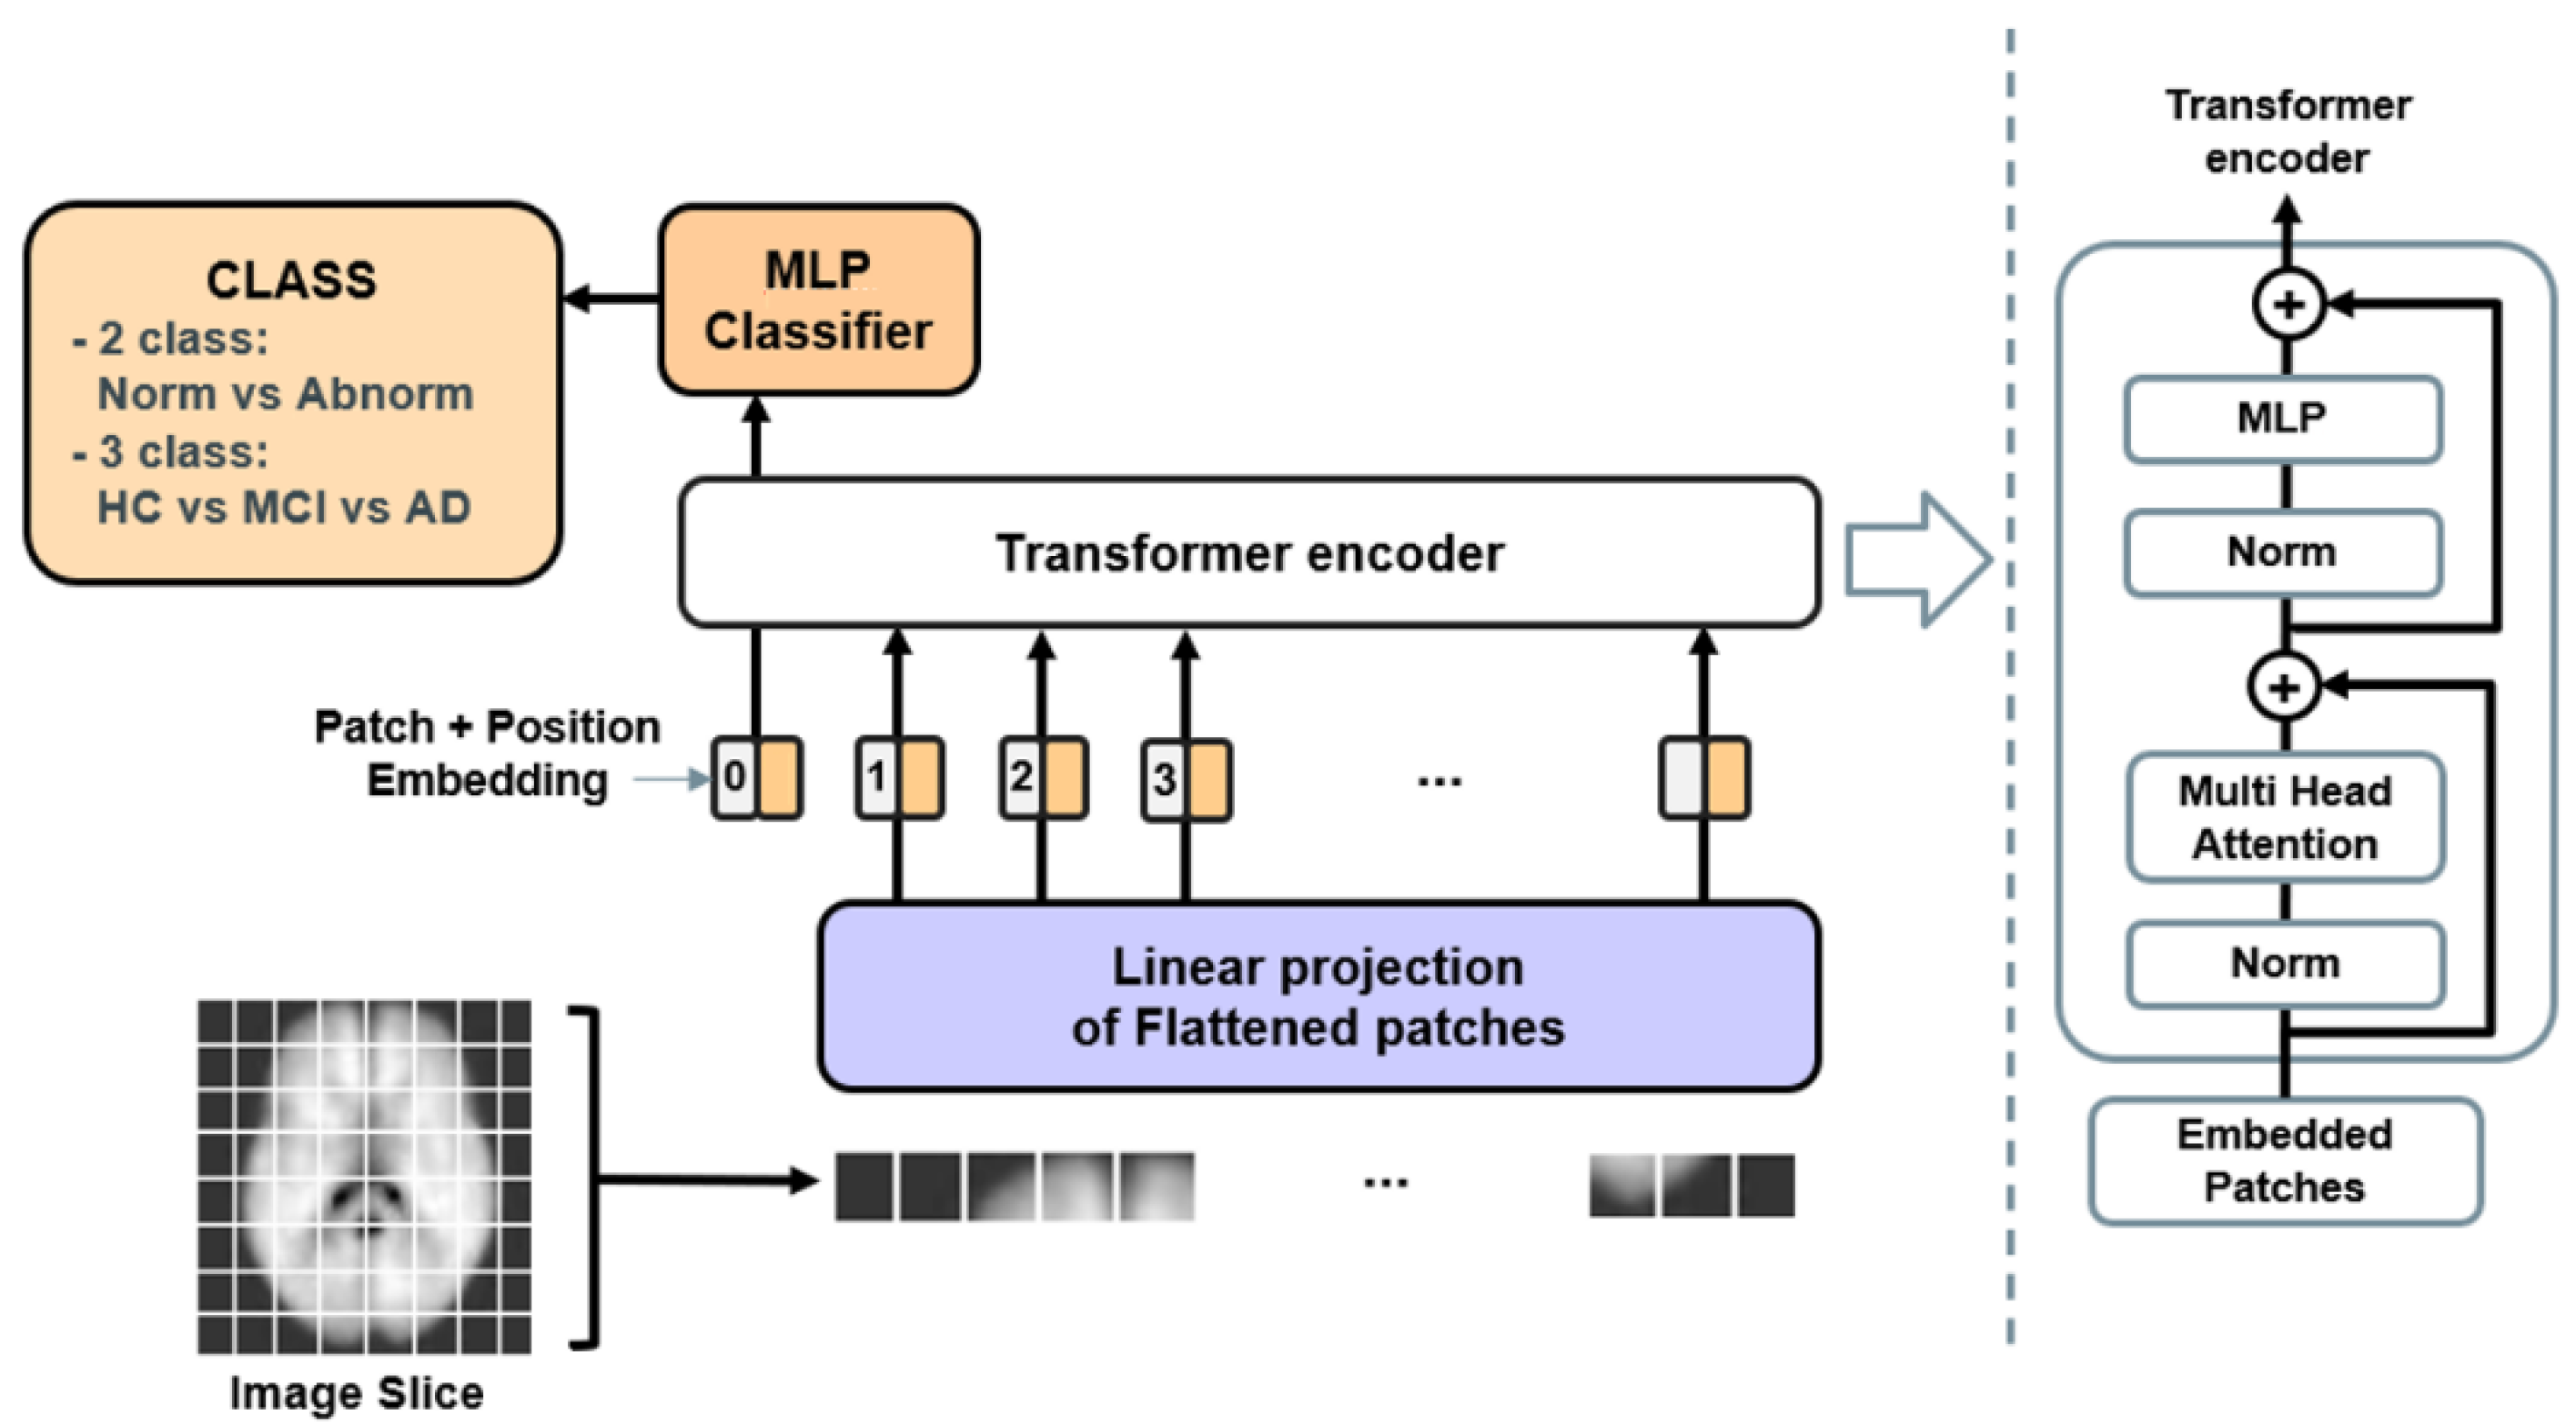
2.3.1. ViT Architecture

The transformer is a model first proposed in the paper ‘Attention is All You Need’ [14], published by Google in 2017. The encoder-decoder, characterized by a sequence-to-sequence structure, has a disadvantage in that some information of the input sequence is lost when the sequence is compressed into a single vector. However, the use of attention to compensate for this loss is outside the network bounds. The architecture of the ViT used in this study is illustrated in Figure 3 [14].
First, an image patch is created. Transformers require one-dimensional embeddings as a starting point in the field of NLP. The image in (224, 224, 1) produces 28 × 28 patch images in (8, 8, 1). The following steps include the creation of patch embedding, addition of class tokens, and addition of positional embedding. The conversion of each patched image to one dimension is known as linear projection. Each pixel is connected in a row to ensure one-dimensionality.
x   ϵ R H × W × C
(1)
represents the original image size.
x l R N × P 2 × C
(2)
is the input to the ViT after flattening the original image:
N = H W P 2
(3)
represents the number of patches, with N being the sequence length of the transformer. P is the size of the patch, which is a square. The resolution of the original image is (H, W) and the patch resolution of each image is (P, P).
A learnable class token is added to the front of the embedded patch. When this class token passes through several encoder layers of the transformer and emerges as a final output, it serves as a one-dimensional representation vector for the image. Finally, a position embedding of the same dimension is added to the vector, and order information is added to the embedding. Consequently, the entire image is defined as a one-dimensional embedding vector and input into the transformer’s encoder.
Layer normalization, multi-head self-attention (MSA), and residual connections are performed. All image embeddings are layer normalized on a channel basis. To perform self-attention using patch + position embedding, one key (k), query (q), and value (v) are obtained for each embedding, and attention values are obtained accordingly, concatenated in the dimensional direction, with the multi-head creating attention. Subsequently, a residual connection is made by adding input embeddings to the multi-head attention.
Layer normalization, multilayer perceptron (MLP), and residual connections are applied. The residual connection matrix is normalized on a channel basis, as previously described. The MLP consists of two linear layers. The embedding size is expanded in the first layer and restored to its original size in the second layer. Subsequently, matrices are added to generate the final output feature. The process of creating the final output feature through input embedding is summarized by the following equations:
z 0 = x c l a s s · x c 1 E ;   x c 2 E   ;   x c N E   + E c o s   , E ϵ R l 2 · C × D , E c o s R N + 1 × L
z l = MSA ( L N z l 1 + z l 1   , l = 1 L
z l = MLP L N z L + z L   , l = 1 L
y = LN z L 0
The MLP classifier can be considered the output stage of the transformer and is functionally identical to the image classifier of a general CNN. The peculiarity is that only class tokens are used. When a class token passes through several encoder layers and the transformer’s layer normalization to obtain the final output, it serves as a one-dimensional representation vector for the image.

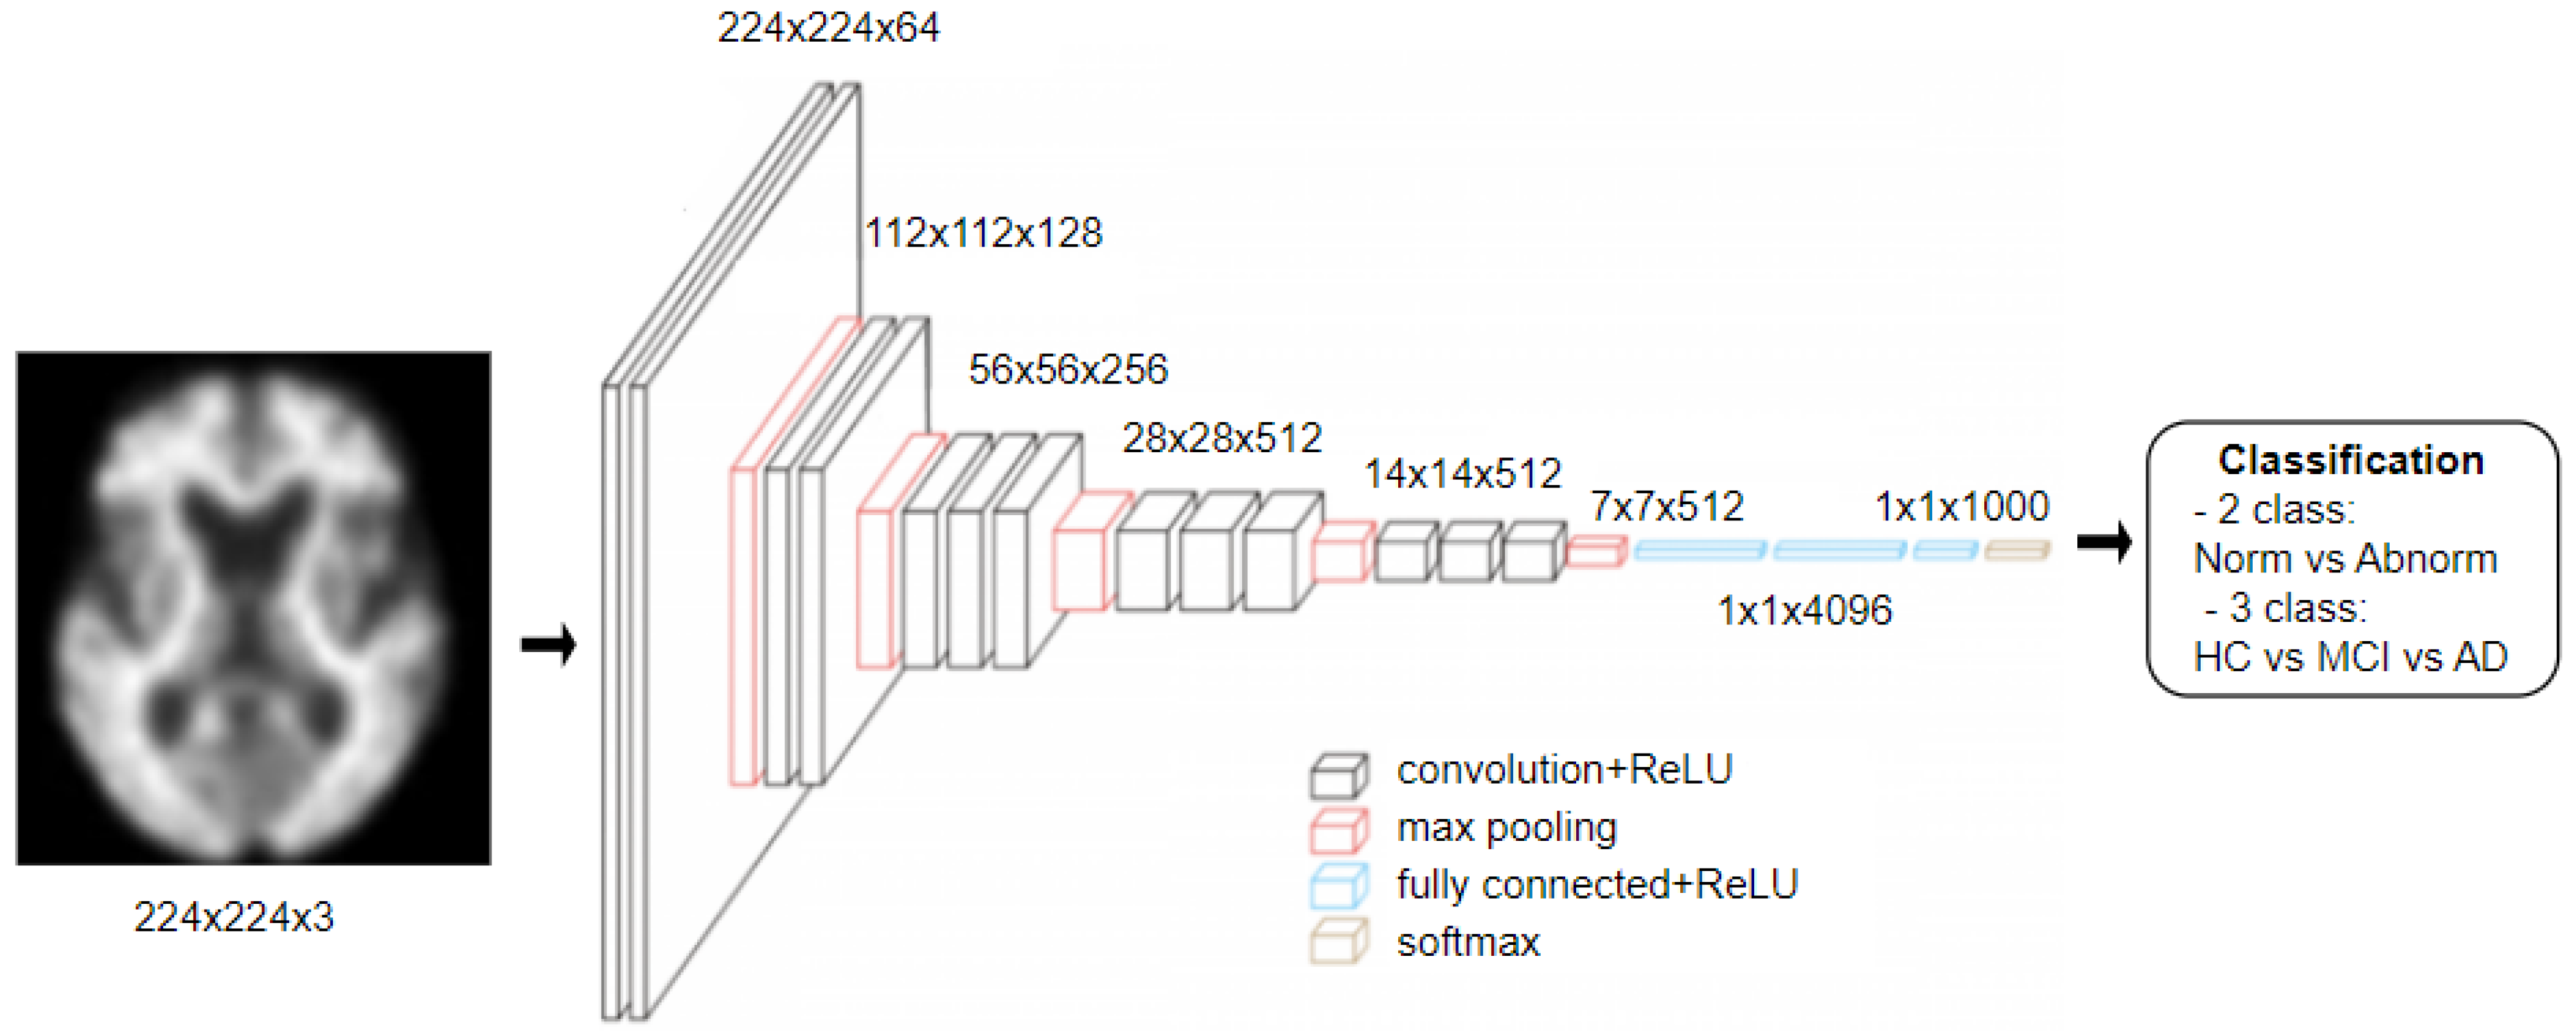
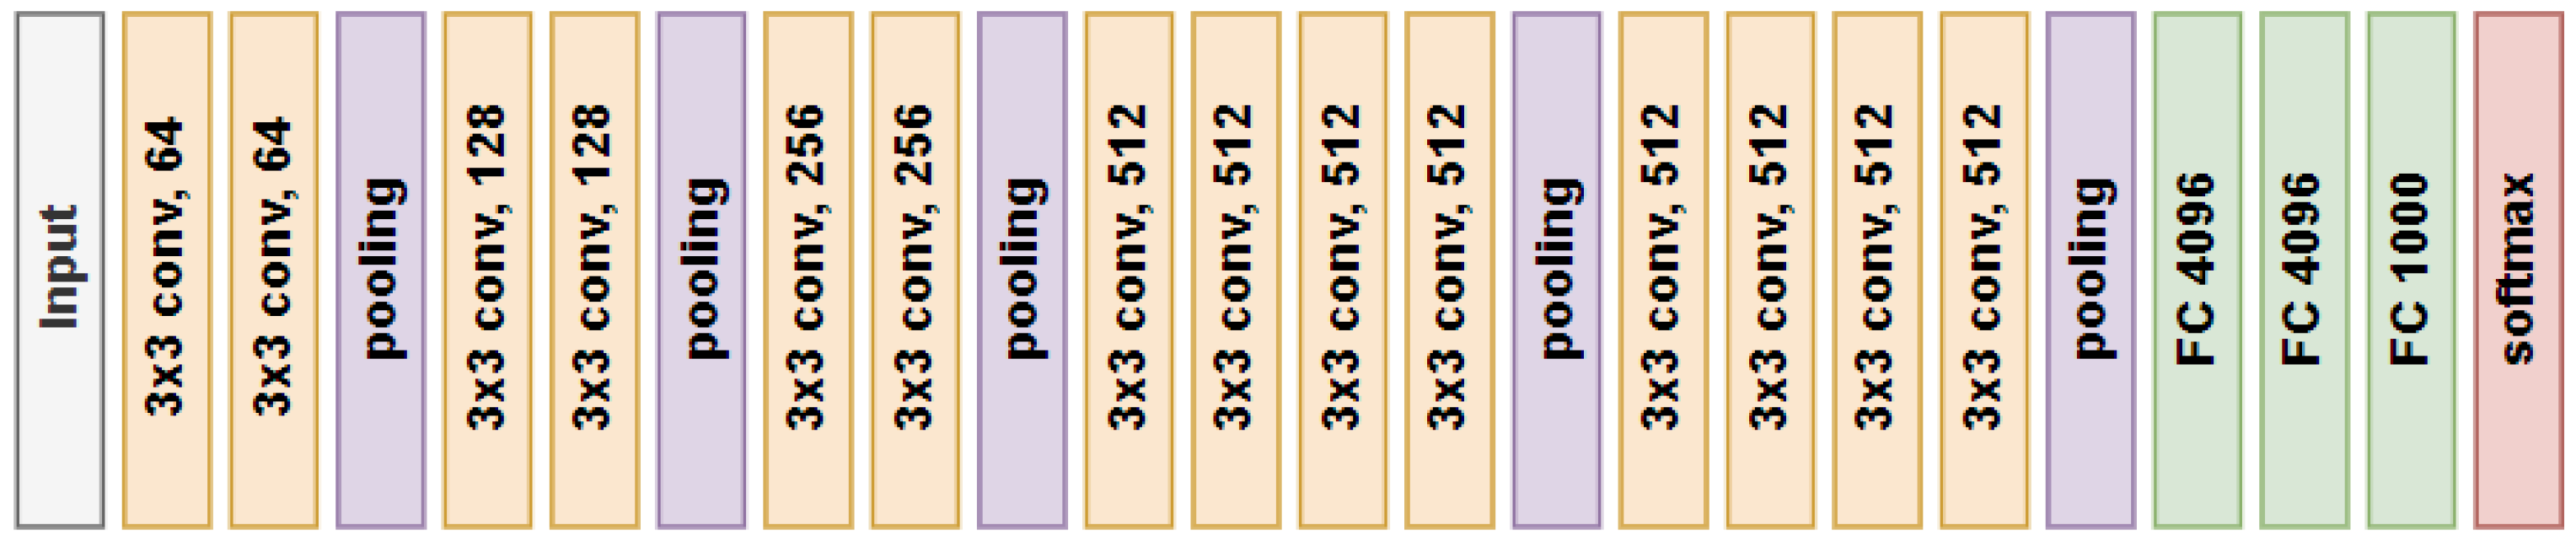
2.3.2. VGG19 Architecture

VGGNet is a model developed by the Oxford University research team VGG, which was the runner-up in the 2014 ImageNet image recognition competition. VGGNet refers to a model with 16 or 19 layers, and the model used in this study is VGG19 [37]. Among the CNN models for comparison with the ViT model, we chose VGG19 because it achieves the best performance on various tasks and uses a small kernel (3 × 3) [38] instead of a large kernel. The image is input with a size of 224 × 224 × 3, and the convolutional kernel dimension is 3 × 3. The layer structure used Maxpooling for downsampling and adjusted ReLU as the activation function. By selecting the largest value in the image region as the region’s pooled value, features can be extracted with minimal image distortion (Figure 4 and Figure 5) [39].

3. Experiments and Results

To compare the efficiency of the pre-trained models (VGG19, ViT), experiments were conducted based on classification tasks of two and three classes.

3.1. Experimental Setting

We compared the ViT and VGG19 architectures. All models were trained using the hyperparameters listed in Table 3 to equalize the experimental conditions.
There were 28 2D images per subject, with each chapter classified differently. Accordingly, the subject classification criteria were defined as follows: In the case of binary classification, if more than five out of the 28 sheets were found to be abnormal, the subject was classified as abnormal. In the case of three-class classification, if more than five of the 28 chapters were classified as AD, the subject was classified as AD; if more than five chapters were classified as MCI, the subject was classified as MCI; and if both AD and MCI were classified with less than five chapters, the subject was classified as HC.

3.2. Classification Performance

The classification performance of the introduced model settings was reported and analyzed. The model was considered as follows: accuracy, recall, precision, and F1 score [40]. Depending on the normal and abnormal outcomes of the model, it can be represented as true positive (TP, the total number of correct predictions in the abnormal case), true negative (TN, the total number of incorrect predictions in the abnormal case), false positive (FN, the total number of correct predictions in the normal case), and false negative (FN, the total number of incorrect predictions in the normal case).
Accuracy is a performance metric that is typically evaluated when positive and negative groups are equal.
Accuracy = T P + T N T P + T N + F P + F N
Recall (=sensitivity) is the percentage of correctly predicted positive observations out of the total positive predictions.
R e c a l l = T P T P + F N
Precision calculates the accuracy of the classification model with a positive predicted value.
P r e c i s i o n = T P T P + F P
Accuracy does not take into account the distribution of the data. The F1 score is used to manage the distribution.
F 1   s c o r e = 2 × P r e c i s i o n × R e c a l l P r e c i s i o n + R e c a l l
In Table 4, we confirm that the ViT model performed better than the VGG19 model for the classification of normal and abnormal subjects. However, contrary to the expectations, we observe that the augmented dataset exhibited worse results than the original dataset irrespective of the model. This suggests that the augmented data applied to the two models were not effective. When the augmented dataset was used, recall and precision were very low, indicating that there were many false positives. We believe that the model was trained to match the abnormal group, as the quantity of abnormal data increased proportionally when data augmentation was performed with a 1:2 ratio between the normal and abnormal groups. The confusion matrix for the binary classification in Table 4 can be found in Table 5.
In Table 6, VGG19 shows better classification performance for AD, MCI, and HC with the original dataset, whereas ViT shows better classification performance with the augmented data. However, both models generally exhibited a low classification performance of less than 0.7. The confusion matrix for the three-class classification in Table 6 can be found in Table 7. As shown in Table 4, classification performance with the augmented dataset is better than that with the original dataset.
Because performance with the augmented dataset is poorer than that with the original dataset, we attempted to check the classification performance in training and validation. As shown in Table 8, the validation accuracy of the ViT and VGG19 models was higher with the augmented dataset than the original dataset. In the binary case, the validation accuracy of VGG19 was higher than that of ViT, and in the three-class case, ViT and VGG19 both exhibited higher validation accuracy.

4. Discussion

Authors should discuss the results and how they can be interpreted from the previous perspective because the idea that ViT conveys the function of different regions within the brain has great potential for future work. The model’s performance was compared with that of the CNN-based model VGG19. Although ViT exhibited higher performance than VGG19 in the binary classification task, its performance was low in the three-class classification. Furthermore, when data augmentation was applied, classification performance was lower than that of the original data regardless of the model. When comparing the validation accuracy performance following training, a higher value was obtained in the case of the augmented data; therefore, data augmentation resulted in overfitting.
There are several speculations regarding the failure of ViT. The first is the augmented data problem. In fact, data augmentation resulted in lower classification performance regardless of the model. We attempted data augmentation through image rotation to solve the problem of data scarcity. Consequently, the training set increased in volume from 60 subjects to 630 subjects. When the actual augmented data were applied, the validation accuracy after training increased. However, when performance was compared by applying the test, it was lower than that before data augmentation. Furthermore, it was confirmed that the classification performance for normal subjects deteriorated as the data were augmented.
Furthermore, we did not perform proper fine-tuning. Although ViT consumes relatively less time per epoch than VGG19, it requires significant trial and error to optimize the hyperparameters. There is no certainty we achieved optimal performance, and the conditions to attain such performance can only be ascertained within the researcher’s efforts.
The third reason for poor performance is that we had to set a very small batch size to fit the model into GPU memory. Under a small batch size, the statistics for batch normalization degrade the performance of the unstable station model.
However, although ViT has been reported to perform better than some other models, it is not possible to reliably judge the classification performance, owing to the lack of consistency, as the techniques are not implemented on the same criteria, such as the number of data samples, form, preprocessing technique, and database. Moreover, the best and most accurate technique for diagnosing Alzheimer’s disease has yet to be determined. Deep learning models, such as CNNs, appear promising for AD diagnosis, especially given that they can utilize transfer learning to overcome the availability limitations of many medical images [20].
The limitations of this study are, first, that it was conducted with data from the Dong-A University Hospital cohort only. According to Table 1, we can see the imbalance of the classes included in this study and the BAPL scores corresponding to the classes. We expected the model to be able to learn the final AD classification through training, as opposed to the BAPL score classification typically performed with PET images. However, the results suggest that the number of data was not large enough for the model to learn the final AD classification rather than the BAPL score classification. Not only did the HC group misclassify 100% of the two subjects in BAPL 2, but the majority of the MCI group (61 subjects in BAPL 1, 17 subjects in BAPL 2, and 35 subjects in BAPL 3) were misclassified as either AD or HC. To solve this data imbalance and lack of data, we augmented the data by rotating the images, but this only made the data more imbalanced, resulting in worse classification performance. Another limitation is that we did not train various models and compared the AD classification performance with only two models, ViT and VGG19. Currently, there are many different ViT models and CNN models for medical image classification. It is difficult to say that our study has found and compared the most suitable model among them.
In the future, we plan to conduct a comparative study between the advanced ViT and CNN models by acquiring more data. In addition, we plan to apply dual PET images by adding early PET images [41], as it is considered that there are limitations in classifying HC, MCI, and AD with PET images alone.

5. Conclusions

In this study, augmented FBB PET image data were applied to a pre-trained ViT model for Alzheimer’s disease diagnosis. We evaluated the accuracy, recall, precision, and F1 scores by comparing different classifications and differences in data size. However, the classification performance of this model was not ideal, possibly owing to overfitting and under-induction bias due to the limitations of the PET image data.
We hypothesized that the computer would yield accurate AD classification results apart from amyloid accumulation through amyloid PET imaging. In fact, the limitations of amyloid PET imaging have been identified previously. As a result, this study did not find that ViT could outperform CNN in PET image analysis. In addition, clinical classification through PET images can be divided into two classes by comparing normal and abnormal groups; however, there is a limitation in classifying the three classes by comparing HC, MCI, and AD. As a result, it is difficult to claim that the ViT model is better at AD classification than the CNN model. Further research is needed to acquire enough PET image data or add multimodal data to supplement the lack of image data [42,43].

Author Contributions

Conceptualization, H.S. and D.K.; methodology, H.S. and S.J.; software, H.S.; validation, H.S. and D.K.; formal analysis, H.S.; investigation, H.S.; resources, D.K.; data curation, H.S.; writing—original draft preparation, H.S.; writing—review and editing, Y.S., S.K. and D.K.; visualization, H.S. and S.J.; supervision, Y.S., S.K. and D.K.; project administration, D.K.; funding acquisition, D.K. All authors have read and agreed to the published version of the manuscript.

Funding

This research was supported by the Korea Basic Science Institute (National Research Facilities and Equipment Center) grant funded by the Ministry of Education (grant No.: 2021R1A6C101A425).

Institutional Review Board Statement

This study was performed in accordance with the ethical standards laid down in the Helsinki Declaration of 1964 and its later amendments or comparable ethical standards. The research protocol was reviewed and approved by the Institutional Review Committee of Dong-A University Hospital.

Informed Consent Statement

Patient consent was waived due to retrospective study in permission of IRB.

Data Availability Statement

The data used for this study are available upon request from the corresponding author.

Conflicts of Interest

The authors declare no conflict of interest.

References

  1. Botirovich, E.O.; Zoxirovna, X.N. Nursing Care for Patients with Cognitive Impairment and Dementia. Eur. J. Mod. Med. Pract. 2022, 2, 55–56. [Google Scholar]
  2. World Health Organization. Global Status Report on the Public Health Response to Dementia. Available online: https://www.who.int/publications/i/item/9789240033245 (accessed on 11 November 2022).
  3. Behfar, Q.; Ramirez Zuniga, A.; Martino-Adami, P.V. Aging, Senescence, and Dementia. J. Prev. Alzheimer’s Dis. 2022, 9, 523–531. [Google Scholar] [CrossRef]
  4. Rasmussen, J.; Langerman, H. Alzheimer’s disease—Why we need early diagnosis. Degener. Neurol. Neuromuscul. Dis. 2019, 9, 123–130. [Google Scholar] [CrossRef] [PubMed] [Green Version]
  5. Jack, C.R., Jr.; Bennett, D.A.; Blennow, K.; Carrillo, M.C.; Dunn, B.; Haeberlein, S.B.; Holtzman, D.M.; Jagust, W.; Jessen, F.; Karlawish, J.; et al. Contributors NIA-AA Research Framework: Toward a biological definition of Alzheimer’s disease. Alzheimers Dement. 2018, 14, 535–562. [Google Scholar] [CrossRef]
  6. Mecocci, P.; Boccardi, V. The impact of aging in dementia: It is time to refocus attention on the main risk factor of dementia. Ageing Res. Rev. 2020, 65, 101210. [Google Scholar] [CrossRef]
  7. Aggarwal, R.; Sounderajah, V.; Martin, G.; Ting, D.S.W.; Karthikesalingam, A.; King, D.; Ashrafian, H.; Darzi, A. Diagnostic accuracy of deep learning in medical imaging: A systematic review and meta-analysis. Npj Digit. Med. 2021, 4, 65. [Google Scholar] [CrossRef]
  8. Varoquaux, G.; Cheplygina, V. Machine learning for medical imaging: Methodolaogical failures and recommendations for the future. Npj Digit. Med. 2022, 5, 48. [Google Scholar] [CrossRef] [PubMed]
  9. Salahuddin, Z.; Woodruff, H.C.; Chatterjee, A.; Lambin, P. Transparency of deep neural networks for medical image analysis: A review of interpretability methods. Comput. Biol. Med. 2022, 140, 105111. [Google Scholar] [CrossRef]
  10. Acquarelli, J.; van Laarhoven, T.; Postma, G.J.; Jansen, J.J.; Rijpma, A.; van Asten, S.; Heerschap, A.; Buydens, L.M.C.; Marchiori, E. Convolutional neural networks to predict brain tumor grades and Alzheimer’s disease with MR spectroscopic imaging data. PLoS ONE 2022, 17, e0268881. [Google Scholar] [CrossRef]
  11. Samhan, L.F.; Alfarra, A.H.; Abu-Naser, S.S. Classification of Alzheimer’s Disease Using Convolutional Neural Networks. Int. J. Acad. Inf. Syst. Res. 2022, 6, 18–23. [Google Scholar]
  12. Kang, W.; Lin, L.; Zhang, B.; Shen, X.; Wu, S.; Alzheimer’s Disease Neuroimaging Initiative. Multi-model and multi-slice ensemble learning architecture based on 2D convolutional neural networks for Alzheimer’s disease diagnosis. Comput. Biol. Med. 2021, 136, 104678. [Google Scholar] [CrossRef] [PubMed]
  13. Vaswani, A.; Shazeer, N.; Parmar, N.; Uszkoreit, J.; Jones, L.; Gomez, A.N.; Kaiser, Ł.; Polosukhin, I. Attention is all you need. In Proceedings of the 31st Conference on Neural Information Processing Systems (NIPS), Long Beach, CA, USA, 4–9 December 2017; Volume 30. [Google Scholar]
  14. Dosovitskiy, A.; Beyer, L.; Kolesnikov, A.; Weissenborn, D.; Zhai, X.; Unterthiner, T.; Dehghani, M.; Minderer, M.; Heigold, G.; Gelly, S.; et al. An image is worth 16 × 16 words: Transformers for image recognition at scale. arXiv 2020, arXiv:2010.11929. [Google Scholar]
  15. Carion, N.; Massa, F.; Synnaeve, G.; Usunier, N.; Kirillov, A.; Zagoruyko, S. End-to-end object detection with transformer. In European Conference on Computer Vision—ECCV 2020, 16th European Conference, Glasgow, UK, August 23–28, 2020; Springer: Cham, Switzerland, 2020; pp. 213–229. [Google Scholar]
  16. Guo, J.; Han, K.; Wu, H.; Tang, Y.; Chen, X.; Wang, Y.; Xu, C. Cmt: Convolutional neural networks meet vision transformers. In Proceedings of the IEEE/CVF Conference on Computer Vision and Pattern Recognition, New Orleans, LA, USA, 18–24 June 2022; pp. 12175–12185. [Google Scholar]
  17. Lyu, Y.; Yu, X.; Zhu, D.; Zhang, L. Classification of Alzheimer’s Disease via Vision Transformer: Classification of Alzheimer’s Disease via Vision Transformer. In Proceedings of the 15th International Conference on PErvasive Technologies Related to Assistive Environments, Corfu Island, Greece, 29 June–1 July 2022; pp. 463–468. [Google Scholar]
  18. Sarraf, S.; Sarraf, A.; DeSouza, D.D.; Anderson, J.A.E.; Kabia, M.; Alzheimer’s Disease Neuroimaging Initiative. OViTAD: Optimized vision transformer to predict various stages of Alzheimer’s disease using resting-state fMRI and structural MRI data. Brain Sci. 2023, 13, 260. [Google Scholar] [CrossRef] [PubMed]
  19. Yin, Y.; Jin, W.; Bai, J.; Liu, R.; Zhen, H. SMIL-DeiT: Multiple Instance Learning and Self-supervised Vision Transformer network for Early Alzheimer’s disease classification. In Proceedings of the International Joint Conference on Neural Networks (IJCNN), Padua, Italy, 18–23 July 2022; pp. 1–6. [Google Scholar]
  20. Mirzaei, G.; Adeli, H. Machine learning techniques for diagnosis of Alzheimer disease, mild cognitive disorder, and other types of dementia. Biomed. Signal Process. Control 2021, 72, 103293. [Google Scholar] [CrossRef]
  21. Castellazzi, G.; Cuzzoni, M.G.; Ramusino, M.C.; Martinelli, D.; Denaro, F.; Ricciardi, A.; Vitali, P.; Anzalone, N.; Bernini, S.; Palesi, F.; et al. A Machine Learning Approach for the Differential Diagnosis of Alzheimer and Vascular Dementia Fed by MRI Selected Features. Front. Neuroinform. 2020, 14, 25. [Google Scholar] [CrossRef] [PubMed]
  22. Kruthika, K.; Rajeswari; Maheshappa, H. Multistage classifier-based approach for Alzheimer’s disease prediction and retrieval. Inform. Med. Unlocked 2019, 14, 34–42. [Google Scholar] [CrossRef]
  23. Richhariya, B.; Tanveer, M.; Rashid, A. Diagnosis of Alzheimer’s disease using universum support vector machine based recursive feature elimination (USVM-RFE). Biomed. Signal Process. Control 2020, 59, 101903. [Google Scholar] [CrossRef]
  24. Liang, G.; Xing, X.; Liu, L.; Zhang, Y.; Ying, Q.; Lin, A.L.; Jacobs, N. Alzheimer’s disease classification using 2d convolutional neural networks. In Proceedings of the 2021 43rd Annual International Conference of the IEEE Engineering in Medicine & Biology Society, Virtual, 1–5 November 2021. [Google Scholar]
  25. Yoon, H.J.; Jeong, Y.J.; Kang, D.-Y.; Kang, H.; Yeo, K.K.; Jeong, J.E.; Park, K.W.; Choi, G.E.; Ha, S.-W. Effect of Data Augmentation of F-18-Florbetaben Positron-Emission Tomography Images by Using Deep Learning Convolutional Neural Network Architecture for Amyloid Positive Patients. J. Korean Phys. Soc. 2019, 75, 597–604. [Google Scholar] [CrossRef]
  26. Hu, Z.; Wang, Z.; Jin, Y.; Hou, W. VGG-TSwinformer: Transformer-based deep learning model for early Alzheimer’s disease prediction. Comput. Methods Programs Biomed. 2023, 229, 107291. [Google Scholar] [CrossRef] [PubMed]
  27. Carcagnì, P.; Leo, M.; Del Coco, M.; Distante, C.; De Salve, A. Convolution Neural Networks and Self-Attention Learners for Alzheimer Dementia Diagnosis from Brain MRI. Sensors 2023, 23, 1694. [Google Scholar] [CrossRef]
  28. Kadri, R.; Bouaziz, B.; Tmar, M.; Gargouri, F. Multimodal deep learning based on the combination of EfficientNetV2 and ViT for Alzheimer’s disease early diagnosis enhanced by SAGAN data augmentation. Int. J. Comput. Inf. Syst. Ind. Manag. Appl. 2022, 14, 313–325. [Google Scholar]
  29. Jang, J.; Hwang, D. M3T: Three-dimensional Medical image classifier using Multi-plane and Multi-slice Transformer. In Proceedings of the IEEE/CVF Conference on Computer Vision and Pattern Recognition, New Orleans, LA, USA, 18–24 June 2022; pp. 20718–20729. [Google Scholar]
  30. Kushol, R.; Masoumzadeh, A.; Huo, D.; Kalra, S.; Yang, Y.-H. Addformer: Alzheimer’s Disease Detection from Structural Mri Using Fusion Transformer. In Proceedings of the 2022 IEEE 19th International Symposium on Biomedical Imaging (ISBI), Kolkata, India, 28–31 March 2022; pp. 1–5. [Google Scholar] [CrossRef]
  31. Zhu, J.; Tan, Y.; Lin, R.; Miao, J.; Fan, X.; Zhu, Y.; Liang, P.; Gong, J.; He, H. Efficient self-attention mechanism and structural distilling model for Alzheimer’s disease diagnosis. Comput. Biol. Med. 2022, 147, 105737. [Google Scholar] [CrossRef]
  32. Liu, L.; Liu, S.; Zhang, L.; To, X.V.; Nasrallah, F.; Chandra, S.S. Cascaded Multi-Modal Mixing Transformers for Alzheimer’s Disease Classification with Incomplete Data. arXiv 2022, arXiv:2210.00255. [Google Scholar]
  33. Wang, C.; Li, Y.; Tsuboshita, Y.; Sakurai, T.; Goto, T.; Yamaguchi, H.; Yamashita, Y.; Sekiguchi, A.; Tachimori, H.; Alzheimer’s Disease Neuroimaging Initiative. A high-generalizability machine learning framework for predicting the progression of Alzheimer’s disease using limited data. Npj Digit. Med. 2022, 5, 43. [Google Scholar] [CrossRef] [PubMed]
  34. Eroglu, Y.; Yildirim, M.; Cinar, A. mRMR-based hybrid convolutional neural network model for classification of Alzheimer’s disease on brain magnetic resonance images. Int. J. Imaging Syst. Technol. 2022, 32, 517–527. [Google Scholar] [CrossRef]
  35. Barthel, H.; Gertz, H.J.; Dresel, S.; Peters, O.; Bartenstein, P.; Buerger, K.; Hiemeyer, F.; Wittemer-Rump, S.M.; Seibyl, J.; Reininger, C.; et al. Cerebral amyloid-B PET with florbetaben (18F) in patients with Alzheimer’s disease and healthy controls: A mlticenter phase 2 diagnostic study. Lancet Neurol. 2011, 10, 424–435. [Google Scholar] [CrossRef] [PubMed]
  36. Chlap, P.; Min, H.; Vandenberg, N.; Dowling, J.; Holloway, L.; Haworth, A. A review of medical image data augmentation techniques for deep learning applications. J. Med. Imaging Radiat. Oncol. 2021, 65, 545–563. [Google Scholar] [CrossRef]
  37. Simonyan, K.; Zisserman, A. Very deep convolutional networks for large-scale image recognition. arXiv 2014, arXiv:14091556. [Google Scholar]
  38. Lee, S.Y.; Kang, H.; Jeong, J.H.; Kang, D.Y. Performance evaluation in [18F] Florbetaben brain PET images classification using 3D Convolutional Neural Network. PLoS ONE 2021, 16, e0258214. [Google Scholar] [CrossRef]
  39. Xiao, J.; Wang, J.; Cao, S.; Li, B. Application of a Novel and Improved VGG-19 Network in the Detection of Workers Wearing Masks. J. Phys. Conf. Ser. 2020, 1518, 012041. [Google Scholar] [CrossRef]
  40. Manimurugan, S. Classification of Alzheimer’s disease from MRI Images using CNN based Pre-trained VGG-19 Model. J. Comput. Sci. Intell. Technol. 2020, 1, 15–21. [Google Scholar]
  41. Lu, S.; Xia, Y.; Cai, W.; Fulham, M.; Feng, D.D. Early identification of mild cognitive impairment using incomplete random forest-robust support vector machine and FDG-PET imaging. Comput. Med. Imaging Graph. 2017, 60, 35–41. [Google Scholar] [CrossRef] [PubMed] [Green Version]
  42. Xing, X.; Liang, G.; Zhang, Y.; Khanal, S.; Lin, A.-L.; Jacobs, N. Advit: Vision Transformer On Multi-Modality Pet Images For Alzheimer Disease Diagnosis. In Proceedings of the 2022 IEEE 19th International Symposium on Biomedical Imaging (ISBI), Kolkata, India, 28–31 March 2022; pp. 1–4. [Google Scholar] [CrossRef]
  43. Ilias, L.; Askounis, D. Multimodal Deep Learning Models for Detecting Dementia From Speech and Transcripts. Front. Aging Neurosci. 2022, 14, 830943. [Google Scholar] [CrossRef] [PubMed]
Figure 1. Preprocessed FBB images of subjects. (a) FBB image of AD. (b) FBB image of MCI. (c) FBB image of HC.
Applsci 13 03453 g001
Figure 2. Data preprocessing. (a) Match: match CT and PET images into one; (b) Spatial Norm: spatial normalization. With the matrix information obtained by matching the CT to the CT template, the shape of the PET is also matched to the CT template; (c) Skull stripping: Remove the skull from the matched image; (d) Count norm: count normalization. Divide the total pixels by the cerebellum value.
Applsci 13 03453 g002
Figure 3. Vision Transformer model architecture.
Applsci 13 03453 g003
Figure 4. VGG19 model architecture.
Applsci 13 03453 g004
Figure 5. Layers of VGG19.
Applsci 13 03453 g005
Table 1. Subject characteristics.
SubjectsM/FAge RangeBAPL Score 1BAPL Score 2BAPL Score 3
AD224102/12247–903925156
MCI11344/6944–86611735
HC5018/3237–804820
AD: Alzheimer’s disease; MCI: mild cognitive impairment; HC: healthy control; M/F: male/female; BAPL: beta amyloid plaque load.
Table 2. Train, validation, and test sets.
a. BAPL Score Ratios of train, validation, and test Sets
Train/Validation Set RatioTest Set Ratio
BAPL 1BAPL 2BAPL 3BAPL 1BAPL 2BAPL 3
AD8428217
MCI2488622
HC3910910
b. The number of train, validation, and test sets in the original data
Train/ValidationTest
BAPL 1BAPL 2BAPL 3BAPL 1BAPL 2BAPL 3
AD8428217
MCI2488622
HC3910910
Sum(Train)
90
(Validation) 3030
c. The number of train, validation, and test sets in the augmented data
Train/ValidationTest
BAPL 1BAPL 2BAPL 3BAPL 1BAPL 2BAPL 3
AD5628196217
MCI1685656622
HC27370910
Sum(Train)
630
(Validation) 21030
Table 3. Representative hyper-parameters used for model training.
Hyper-ParameterValue
Batch size16
Epochs100
Input size224
Dropout0.1
Learning rate0.001
Batch size: quantity of data loaded at one time during training; epochs: number of learning iterations; input size: size of the image input to the model; dropout: probability of ignoring the layers of the model; learning rate: model learning rate.
Table 4. Binary classification performance of ViT and VGG19.
ModelData SetACCRecallPrecisionF1 Score
ViToriginal data0.80000.60000.75000.6667
ViTaugmented data0.70000.10001.00000.1818
VGG19original data0.73330.60000.60000.6000
VGG19augmented data0.66670.10000.50000.1667
Binary: Abnormal vs. normal control, ViT: Vision Transformer, ACC: accuracy.
Table 5. Binary classification confusion matrix of ViT and VGG19.
Predictive Class
ViT ModelVGG19 Model
Original DataAugmented DataOriginal DataAugmented Data
01010101
Actual Class064196419
1218020416119
Table 6. Three-class classification performance of ViT and VGG19.
ModelData SetACCRecallPrecisionF1 Score
ViToriginal data0.56670.56670.52780.5455
ViTaugmented data0.53330.53330.50560.5174
VGG19original data0.66670.66670.67940.6660
VGG19augmented data0.46670.46670.32860.3673
Three-class: AD vs. MCI vs. HC, ViT: Vision Transformer, ACC: accuracy.
Table 7. Three-class classification confusion matrix of ViT and VGG19.
Predictive Class
ViT ModelVGG19 Model
Original DataAugmented DataOriginal DataAugmented Data
012012012012
Actual Class0370622830253
1154145142127
20370281380010
Table 8. Three-class classification performance of ViT and VGG19.
Data Set2 Class3 Class
ViTVGG19ViTVGG19
original data0.68930.81190.64290.6429
augmented data0.76890.96710.77780.8260
Disclaimer/Publisher’s Note: The statements, opinions and data contained in all publications are solely those of the individual author(s) and contributor(s) and not of MDPI and/or the editor(s). MDPI and/or the editor(s) disclaim responsibility for any injury to people or property resulting from any ideas, methods, instructions or products referred to in the content.

