Article

Characteristics of Commercial Effervescent Tablets Using Selected Pharmacopeial and Novel Analytical Methods

1
Faculty of Pharmaceutical Sciences in Sosnowiec, Doctoral School of the Medical University of Silesia in Katowice, 41-200 Sosnowiec, Poland
2
Department of Basic Biomedical Science, Faculty of Pharmaceutical Sciences in Sosnowiec, Medical University of Silesia in Katowice, 3 Kasztanowa Str., 41-200 Sosnowiec, Poland
3
Institute of Biomedical Engineering, Faculty of Science and Technology, University of Silesia, 39 Bedzinska Str., 41-200 Sosnowiec, Poland
4
Department of Pharmaceutical Technology, Faculty of Pharmaceutical Sciences in Sosnowiec, Medical University of Silesia in Katowice, 3 Kasztanowa Str., 41-200 Sosnowiec, Poland
*
Author to whom correspondence should be addressed.
Appl. Sci. 2023, 13(5), 3171; https://doi.org/10.3390/app13053171
Submission received: 31 January 2023 / Revised: 23 February 2023 / Accepted: 26 February 2023 / Published: 1 March 2023

Abstract

:
In the present study, we aimed to determine whether the shelf life of effervescent tablets may be assessed during storage using total directional hemispherical reflectance (THR). We also analyzed selected pharmacopeial parameters of the tablets and used X-ray microtomography to assess the internal structure of the tablets. Two types of effervescent tablets of one commercial product containing magnesium and vitamin B6 (expired and unexpired) were analyzed. In addition, randomly selected unexpired and expired tablets were dried in a vacuum oven for 24 h at 50 °C. The expired effervescent tablets disintegrated in a significantly shorter time than the unexpired tablets (68 s vs. 83 s, p = 0.016). The remaining pharmacopeial parameters did not differ between the two types of tablets. We observed that expired effervescent tablets showed lower mean values of THR in five spectral ranges, which indicates that a greater amount of radiation beam was transmitted into their inner structure than for unexpired tablets. The density of the inner structure assessed on the microtomographic scans differed significantly between all the analyzed tablets (p < 0.001). The highest mean density was observed in the case of the unexpired tablets dried in a vacuum oven (1.273 g/cm3), while the lowest density was observed in the case of the expired tablets (1.261 g/cm3). The expired tablets had a larger pore diameter compared to the unexpired tablets (0.095 mm vs. 0.074 mm, respectively; p = 0.007). Additionally, the percentage of porosity was higher in the expired tablets compared to the unexpired tablets (p < 0.001).

1. Introduction

Since the oral route of administration of active pharmaceutical ingredients (API) is the most popular, conventional tablets are the most popular pharmaceutical forms. Unfortunately, these forms show slower absorption and, in turn, delayed onset of action; additionally, tablets need to be swallowed, which may be a problem for many patients, especially the elderly and pediatric ones. Effervescent tablets may overcome the disadvantages of traditional tablets [1]. They are used to administer dietary supplements used for prophylactic purposes, as well as analgesics, antipyretics, antacids, betaines, and glucosamines [2,3]. These tablets differ from conventional ones in the composition of their excipients, as they contain substances that disintegrate upon contact with water, resulting in the release of carbon dioxide and API [4]. Most commonly, CO2 is released by the interaction of tartaric or citric acid with alkali metal carbonates or bicarbonates in an aqueous environment [1]. This form allows for large doses of API to be taken and masks its unpleasant taste [5,6,7]. However, the disadvantage of effervescent preparations is their sensitivity to environmental conditions, especially moisture. Hygroscopic ingredients can absorb moisture from the environment, leading to hydrolysis processes, especially when the storage temperature is above 25 °C.
The therapeutic value of a medicinal preparation is ensured, among other things, by its durability, which means that it should be produced, stored, and used under appropriate conditions. Each ingredient in the drug formulation should be selected in such a way as to ensure the stability of the final product. The assessment of the stability of pharmaceutical products is carried out to ensure that appropriate standards of quality, efficacy, and safety of drugs are maintained throughout their shelf life. The guidelines for stability tests are set out by the International Conference on Harmonization (ICH) Stability Q1A-Q1F [8]. These guidelines require conducting organoleptic, physicochemical, and microbiological tests relevant to the stability of the medicinal product.
Currently, new analytical techniques are being sought to allow for the quick and effective detection of unfavorable changes in medicinal products. Previously, several spectroscopic and spectrometric methods were used to evaluate effervescent tablets in the context of their stability [9,10,11]. The API content was analyzed using methods such as near-infrared spectroscopy [9,10] or by ratio spectra-continuous wavelet transform and ratio spectra-derivative spectrophotometry [11]. In turn, the HPLC method was used to quantify the degradants and process-related impurities of effervescent formulations with N-acetyl-L-cysteine [12]. In another study of hydrogen-producing effervescent tablets, the total amount of generated hydrogen and the weight gain of the samples were assessed in a stability test [13]. The change in moisture content, as determined by the dynamic vapor sorption method, was used as a criterion for the stability of the effervescent granulate formulation [13]. Water sorption tests were also used to study the physical stability of effervescent tablets containing benzonidazole complexed with cyclodextrin [14]. The tablets were stored at 25 °C under 0 or 80% relative humidity (RH) in hermetic systems for 7 days. Kadivar et al. [15], in accordance with ICH guidelines, determined the physical stability of imatinib mesylate effervescent floating sustained-release tablets, stored for 6 months at 40 °C and 75% RH, using parameters such as drug content, hardness value, floating behavior, and visual observations of matrix integrity.
One of the novel, non-invasive methods of analysis of pharmaceutical products is the measurement of their reflectance. Reflectance is a quantity describing the ratio of the light beam reflected from the surface of the tested object to the beam incident on the object. The surface of the analyzed object (e.g., a pharmaceutical formulation) can reflect, scatter, and/or absorb light radiation from the reflectometer. Knowing the amount of light radiation that is scattered or reflected from the tablet, it is possible to determine how much radiation is absorbed by it. Thus, the strength of the influence of the given spectral ranges on the pharmaceutical product can be determined. Except for our recent study [16], the measurement of hemispherical reflectance has not yet been used to evaluate the stability of pharmaceutical products. Earlier, this method was used to analyze counterfeit drugs [17]. Other studies have demonstrated that the analysis of reflectance and transmittance can be used to predict drug content [18], as well as to measure hardness and porosity using the near-infrared diffuse reflectance spectroscopy method [19].
In turn, computer microtomography uses X-rays to analyze the inner structure of the analyzed object. Different objects absorb X-rays differently, which is affected by both the density and thickness of the material they are made of. Thicker and denser materials absorb more radiation. With this method, individual elements can be distinguished in the tested object with an accuracy of 1 µm. In pharmacy, microtomography is able to visualize any structural defects, such as micro-cracks, air bubbles, or delamination [20,21]. Several studies have demonstrated the usefulness of X-ray microtomography in evaluating pharmaceutical products, including modified-release tablets containing pellets with theophylline [22], multiple-unit pellet system (MUPS) tablets [23], as well as mini-tablets with moxidectin [24]. Both hemispherical reflectance and X-ray microtomography have several important advantages, including ease of sample preparation, speed, and saving of test samples.
The present study aimed to determine whether directional hemispherical reflectance allows for the shelf life of effervescent tablets containing magnesium and vitamin B6 to be assessed during storage. In addition, we analyzed selected pharmacopeial parameters that are used to describe tablets as a standard, and we used X-ray microtomography to evaluate the internal structure of the tablets.

2. Methods

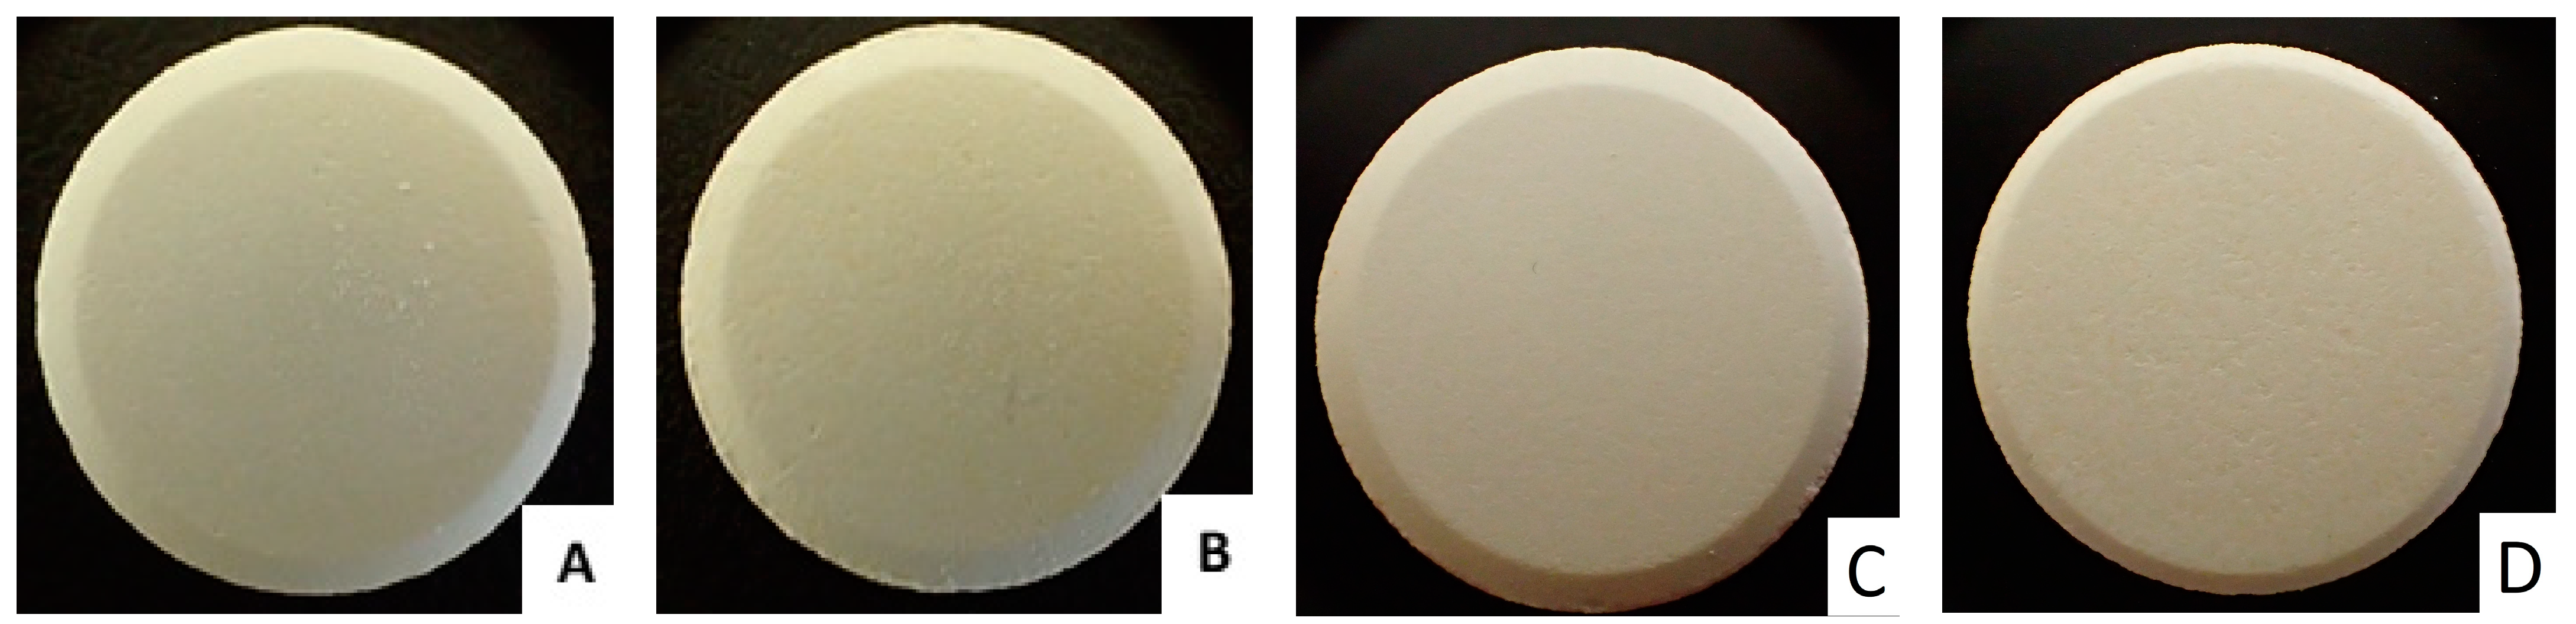
2.1. Analyzed Tablets

In the present study, two types of effervescent tablets of one commercial product containing magnesium and vitamin B6 (Zdrovit; Natur Produkt Pharma sp. z o. o., Ostrów Mazowiecka, Poland) were analyzed: one expired (expiration date: 04.2021) and one unexpired (expiration date: March 2024). Three unexpired and three expired tablets were randomly selected and dried in a vacuum drying oven (Model DZ-1BCII, CHEMLAND, Stargard, Poland) at 50 °C for 24 h. The tablets were evaluated visually, and the external appearance was assessed under visible light using an Olympus Tough camera with a Dermlite attachment (Olympus Europa Se & Co. KG, Hamburg, Germany).

2.2. Evaluation of the Effervescent Tablets

Uniformity of weight was assessed according to European Pharmacopoeia’s 10th edition (Ph. Eur. 10); each of the 20 randomly selected tablets in one series was weighed, and the arithmetic mean weight was determined [25]. The hardness, diameter, and thickness of the tablets were determined in the MultiTest50 hardness tester (Pharmatron Dr. Schleuniger, Thun, Switzerland). The friability was determined using a friabilator (Model EF 2W, Electrolab, Navi Mumbai, India) for 4 min at 25 rpm.

2.3. Disintegration Time and Moisture Content

In vitro disintegration test was carried out for 6 tablets. The analysis was carried out for one tablet at a time in a beaker that contained 200 mL of purified water at 15–25 °C. The disintegration time was measured with a stopwatch. Numerous gas bubbles were emitted at the beginning of disintegration, and when gas was released around each tablet or tablet fragment and no significant tablet agglomerates remained, it was considered disintegrated.
Moisture content was determined using two types of dryers:
  • A moisture analyzer WS-30 (Radwag, Radom, Poland) under the following conditions: for 60 min at 70 °C.
  • A vacuum oven under the following conditions: for 24 h at 50 °C.
Before drying, the tablets were weighed and then placed in the drying device. After drying, the final weight was determined. The weight loss percentage represented the moisture content.

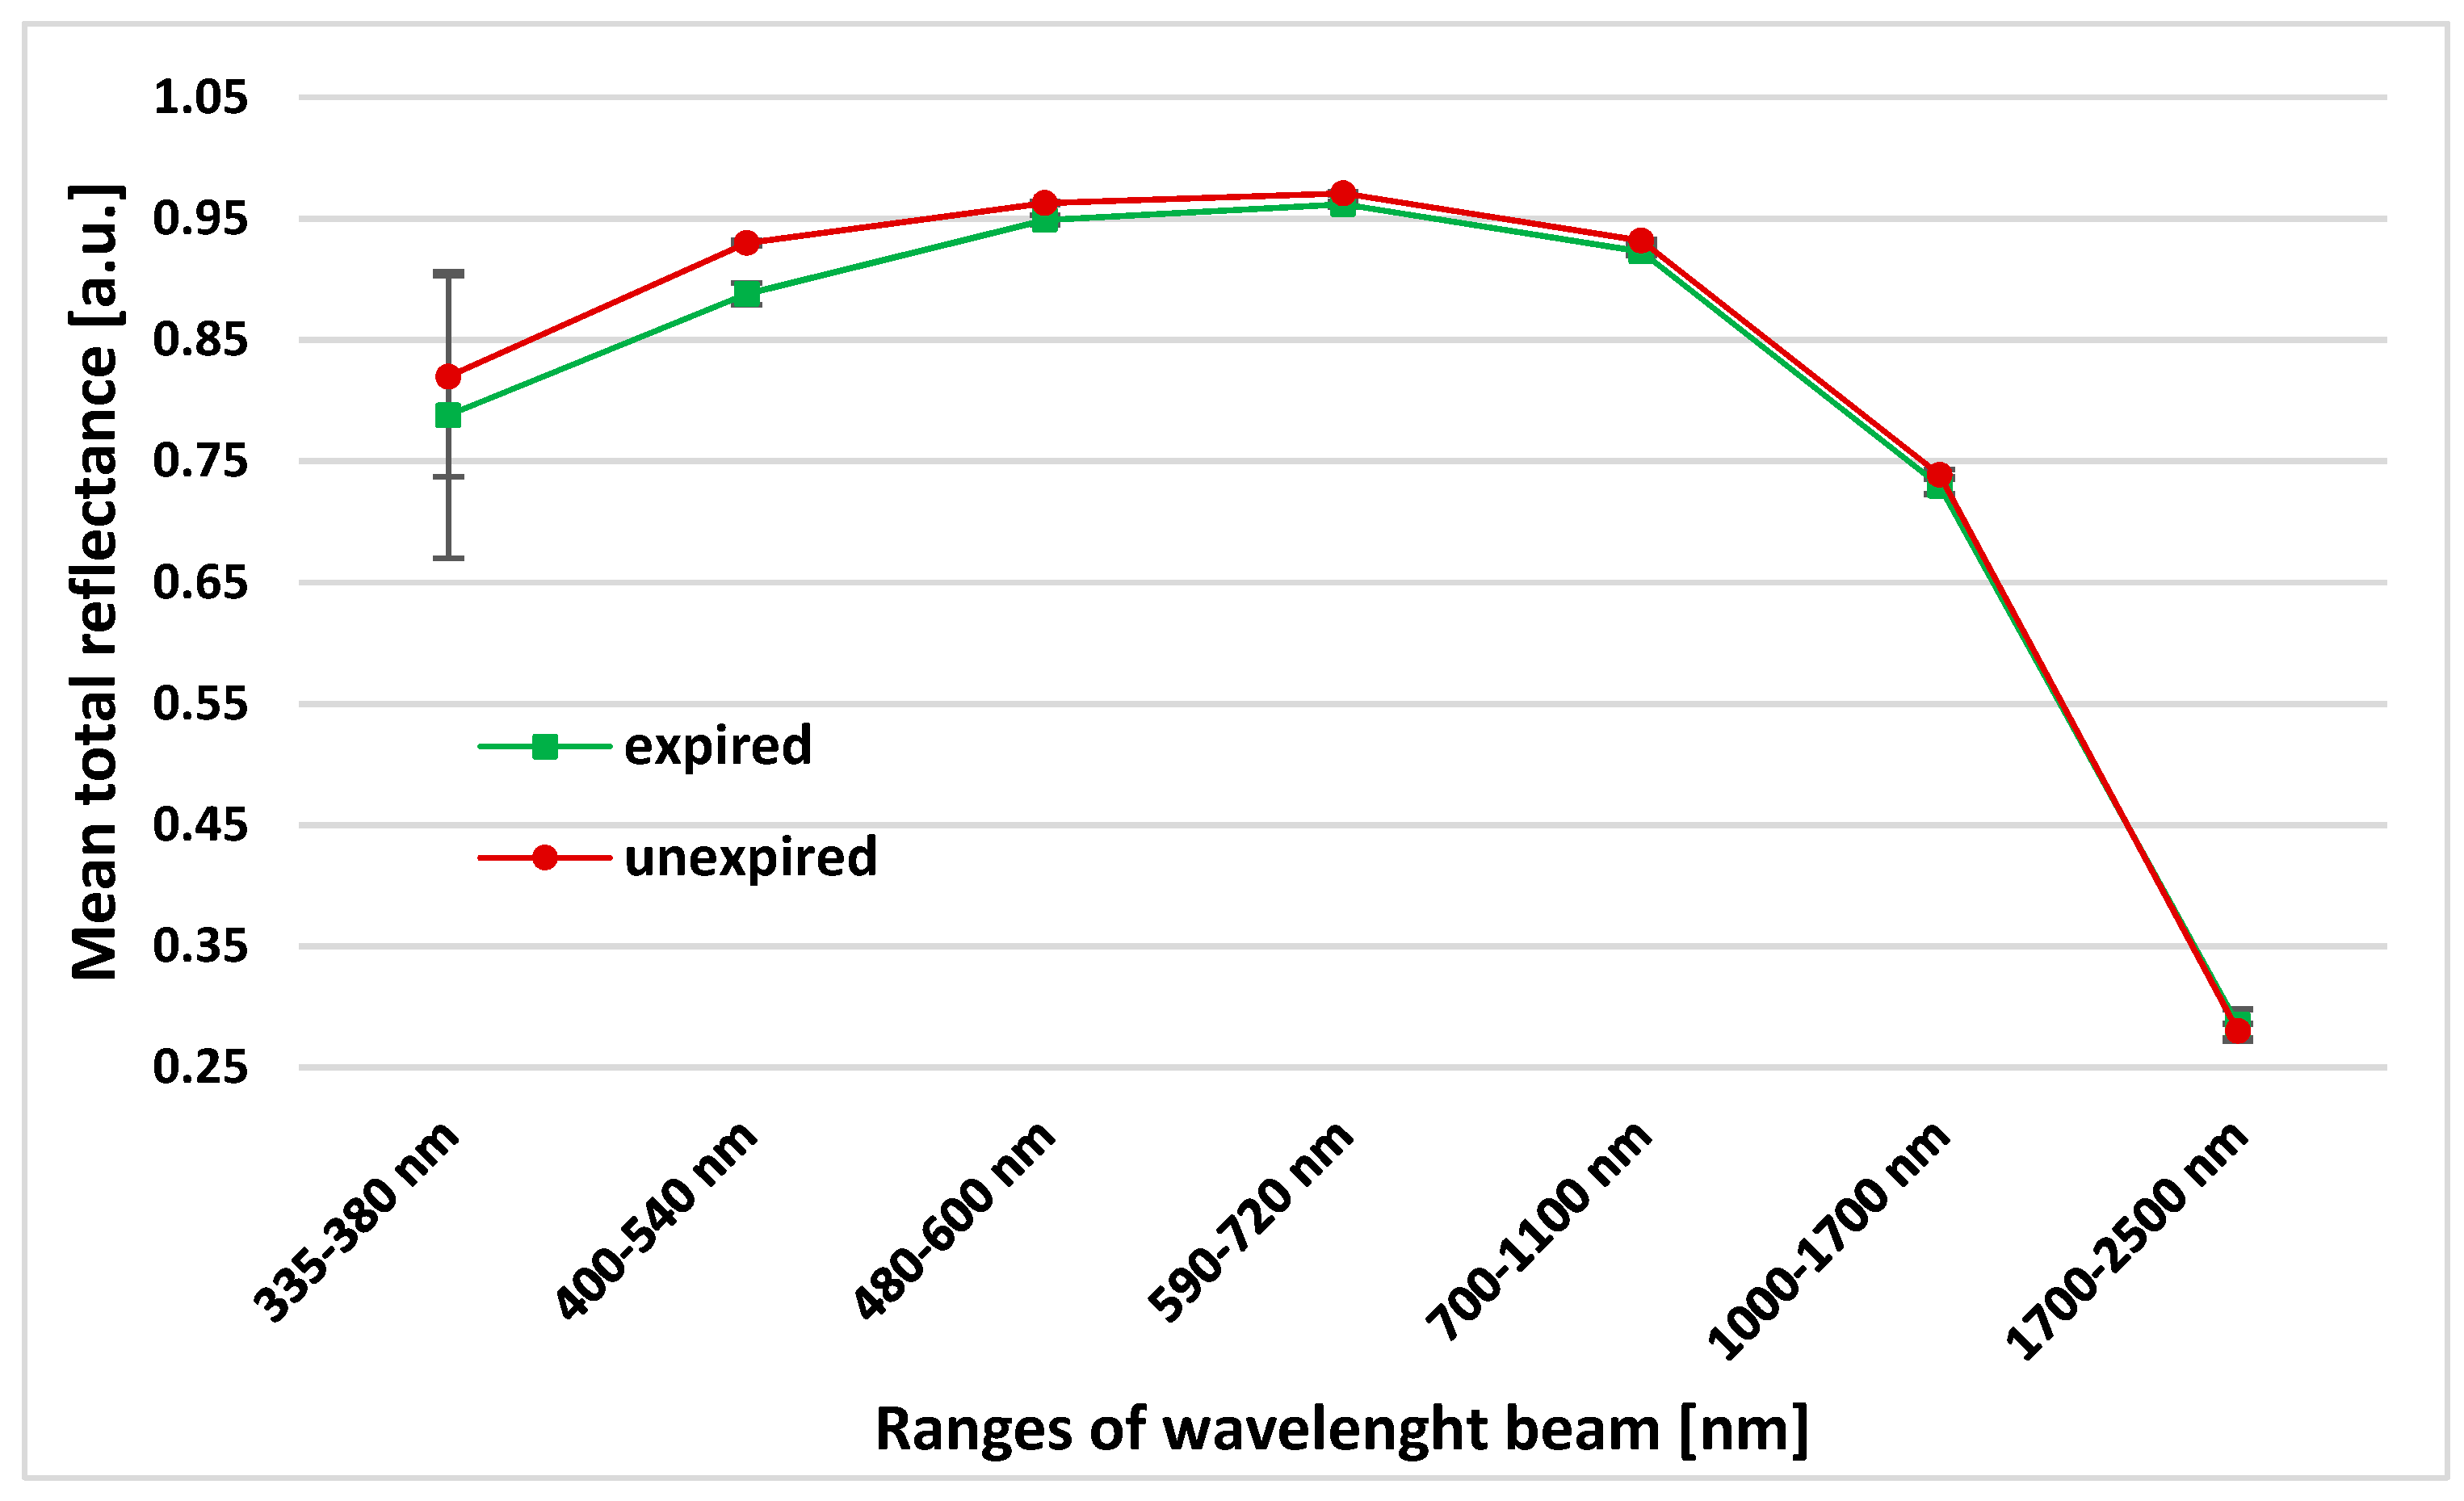
2.4. Analysis of Directional Hemispherical Reflectance

With the use of the SOC-410 Directional Hemispherical Reflectometer (USA), the assessments of THR were performed. The apparatus measures reflectance within seven wavelength bands, including 335–380 nm, 400–540 nm, 480–600 nm, 590–720 nm, 700–1100 nm, 1000–1700 nm, and 1700–2500 nm, i.e., from ultraviolet to near-infrared. The results for THR were obtained for the beam at an angle of 20°. For each tablet analyzed, three measurements were performed.
The calibration coupons (mirror and diffuse) certified by the American National Institute of Standards and Technology (ANIST) were the control group in our study and were used to calibrate the device. The calibration process was repeated after testing every 4 tablets, and each time we obtained the same values of reflectance for the coupons. The repeatability of the results was 99.9%. In addition, we repeated the measurements of the tablets after two weeks and found that the values of reflectance were comparable between the analyses, the difference was less than 2%.
The accuracy of the directional reflectance measurement method using a reflectometer is below ±3% and has been specified by the manufacturer in the entire spectral range for all materials that are not transparent or hemitransparent, and this applies to both electrics and dielectrics.

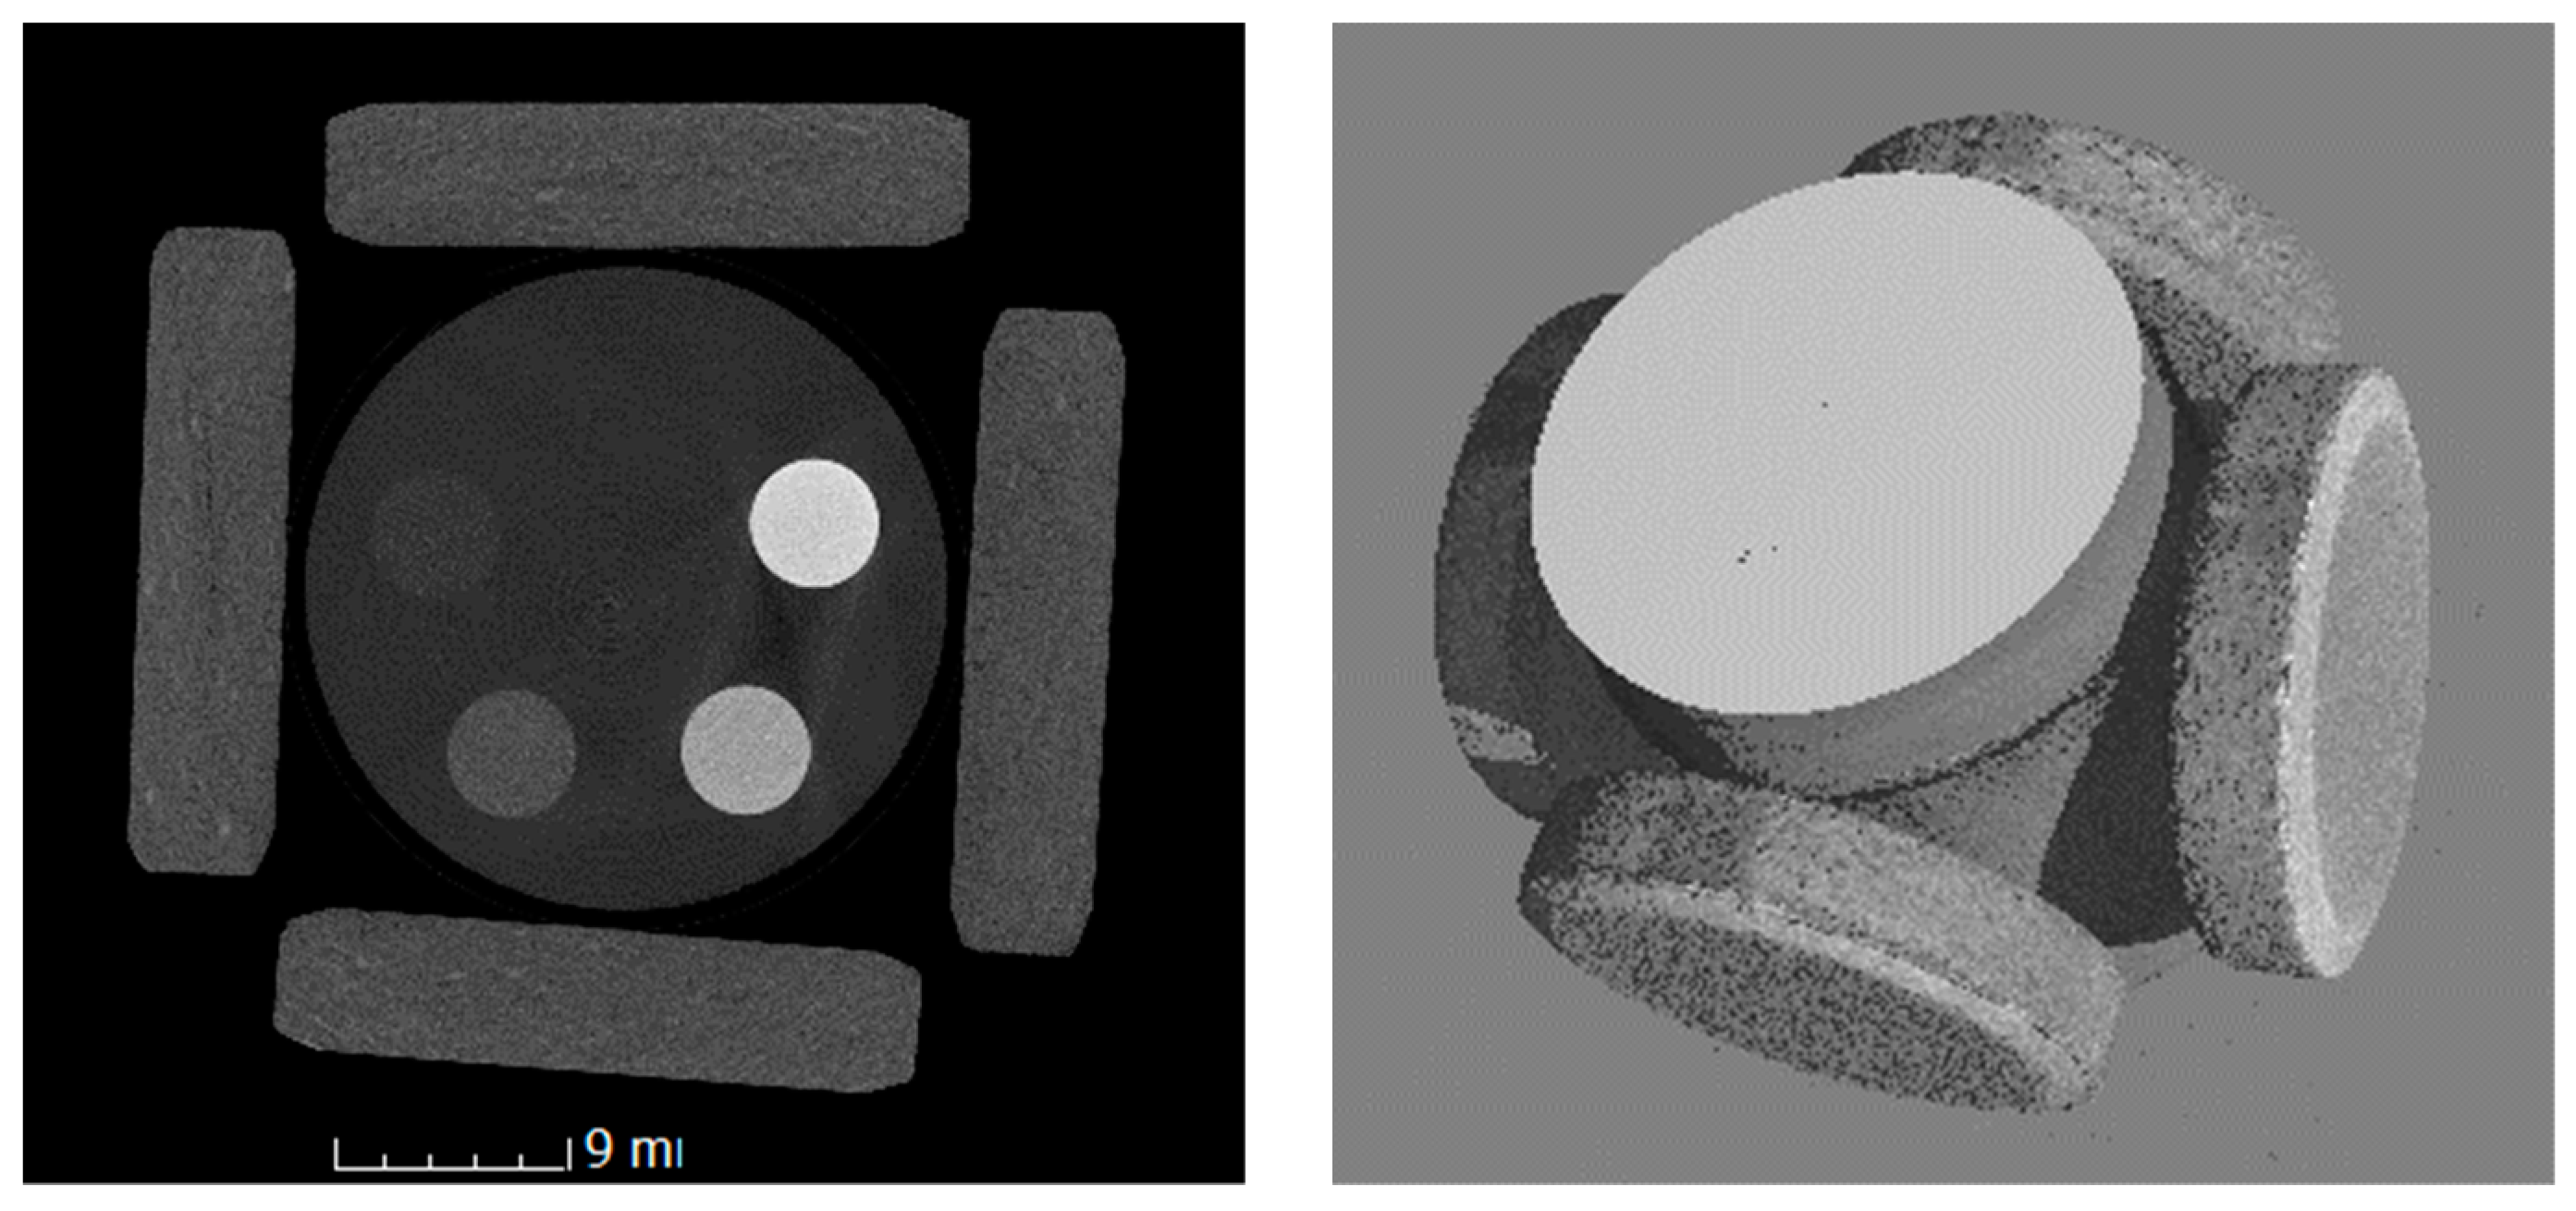
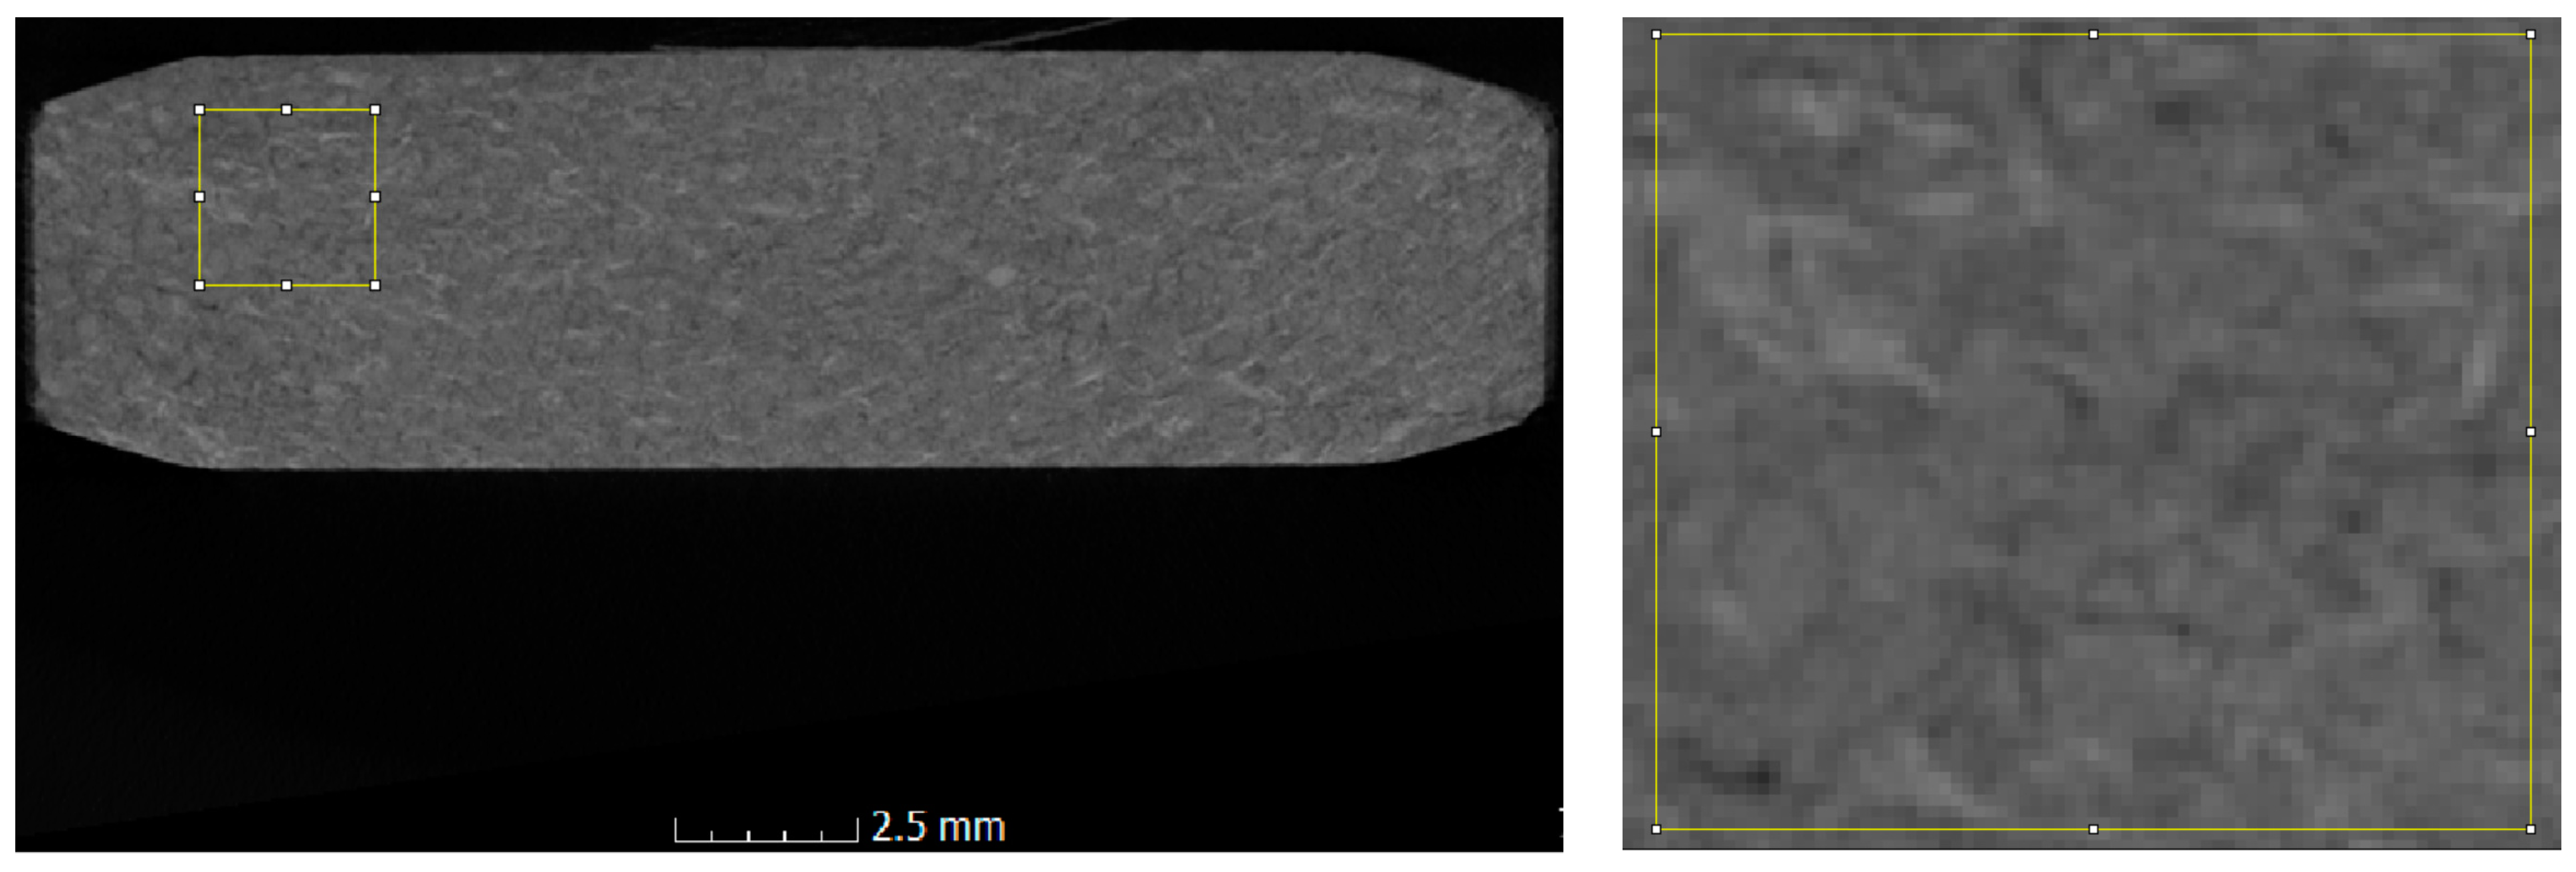
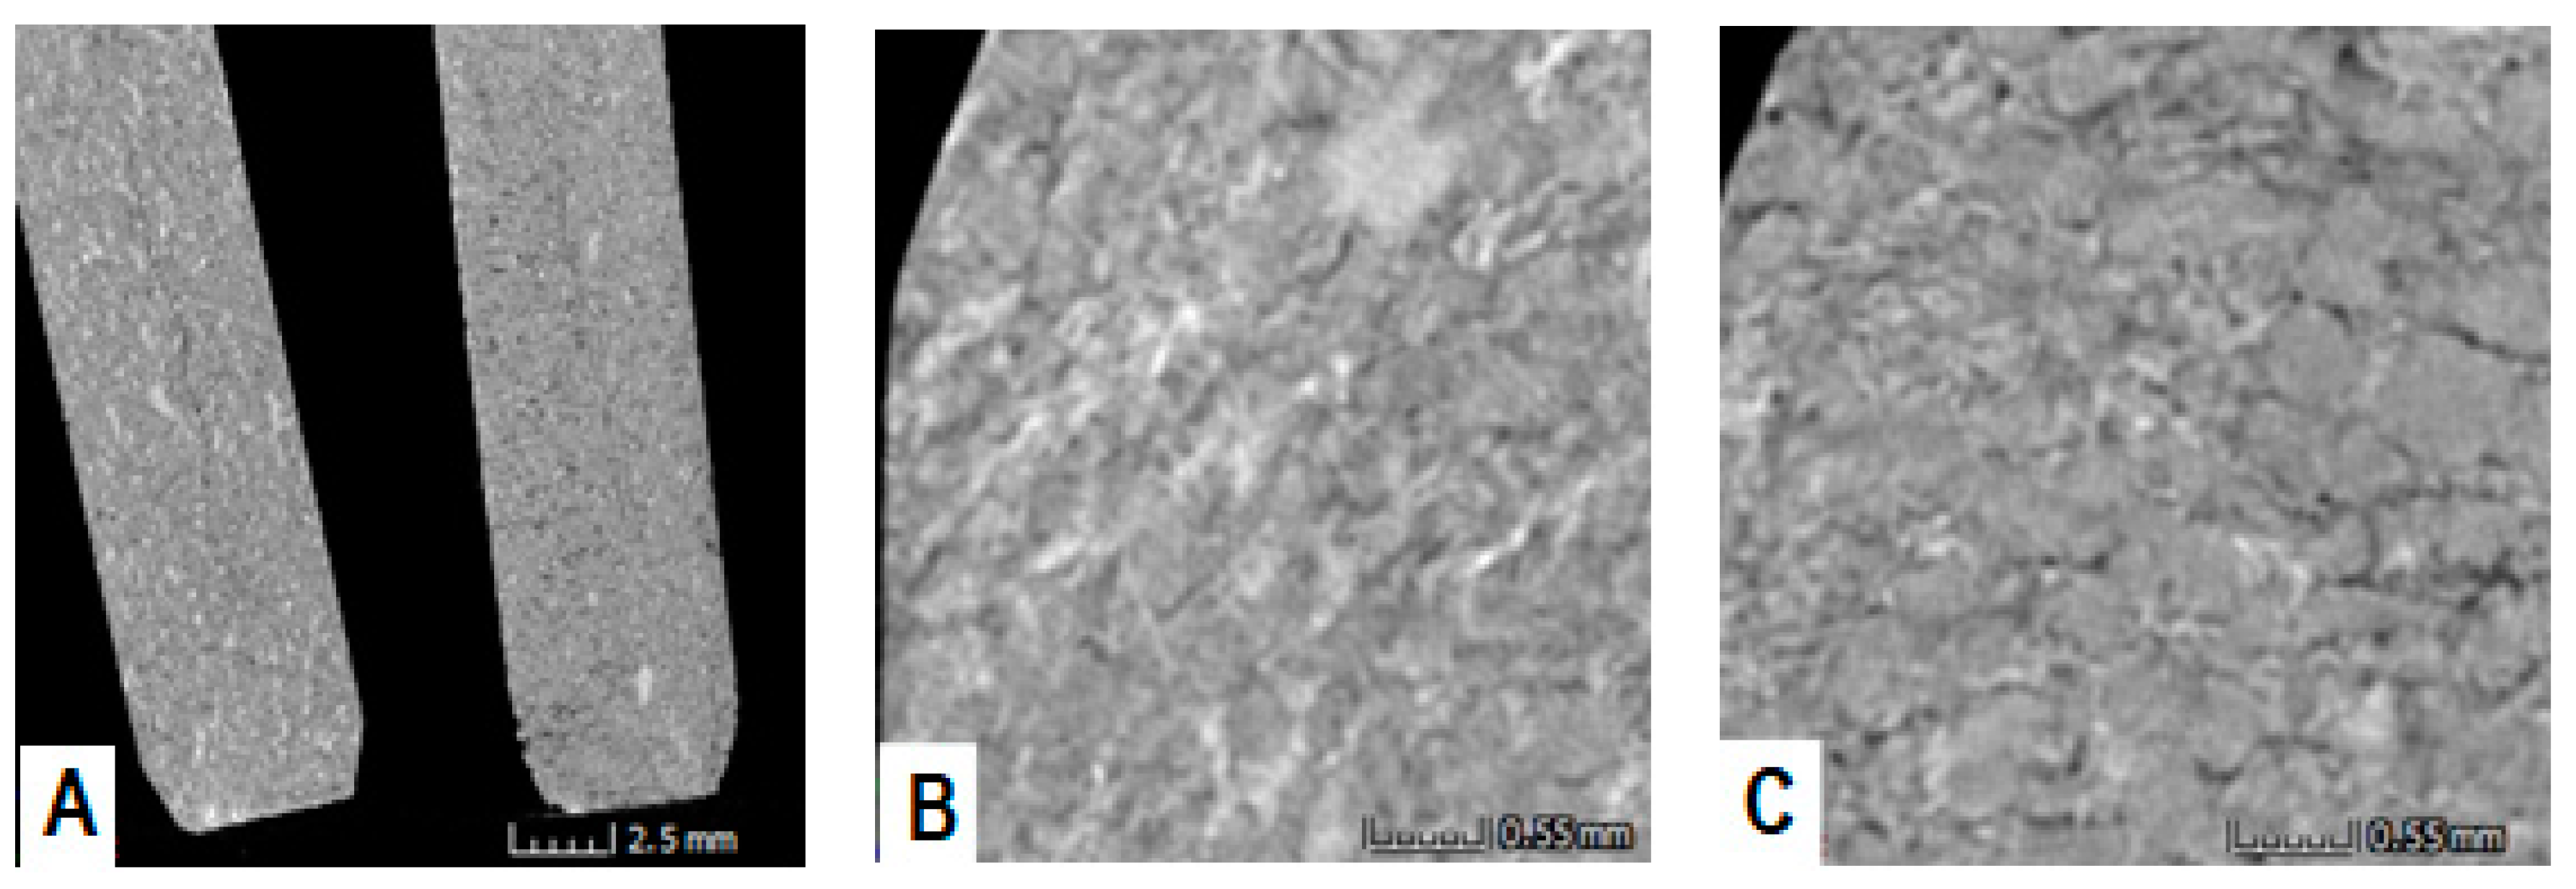
2.5. X-ray Microtomography Analyses

2.5.1. Density Analysis

X-ray microtomography (Phoenix vǀtomeǀx, GE Sensing & Inspection Technologies GmbH, Wunstorf, Germany) allows for registration of the scans of analyzed tablets.
The tablets were scanned at a voltage of 180 kV. The images were recorded with a resolution of 2024 × 2024 pixels. A total of 2000 scans for each tablet were recorded, with a total scan time of 86 min and an amperage of 100 μA. The smallest possible voxel of 25 μm was established to obtain the maximum image resolution. The microtomographic projections were acquired every 0.18° with a total object rotation of 360°. For image acquisition and image reconstruction, we used the scanner manufacturer’s software, Phoenix Datos|x 2.0.
During the analysis, X-rays are absorbed by the analyzed object in proportion to its density, which is reflected in the microtomographic image by the gray level. We assumed that “bright” pixels represent areas of high density, while “dark” pixels represent areas of low density. A phantom with known density areas (Micro-CT HA Phantom D32) was scanned simultaneously, under the same conditions as effervescent tablets, to establish the grayscale level of the reference density (Figure 1).
The analysis of the average brightness value of pixels for the region of interest (ROI) (Figure 2) was performed with the ImageJ software (ImageJ 1.53a; National Institutes of Health, Madison, WI, USA) with the following command: first “Analyze”, and then “Measure”. This allowed for determining the density vs. mean intensity calibration curve, and, consequently, it became possible to determine the density of any area of the tablet slice.
We analyzed 120 random ROIs from the 20 microtomographic slices of the tablet. Therefore, we evaluated the density of each tablet through 20 of its thickness layers. The selected squares with an average region of interest (ROI) of 3.30 cm2 (calculated by multiplying the area of a single pixel by the number of pixels in the ROI) were marked, and the average brightness was measured.

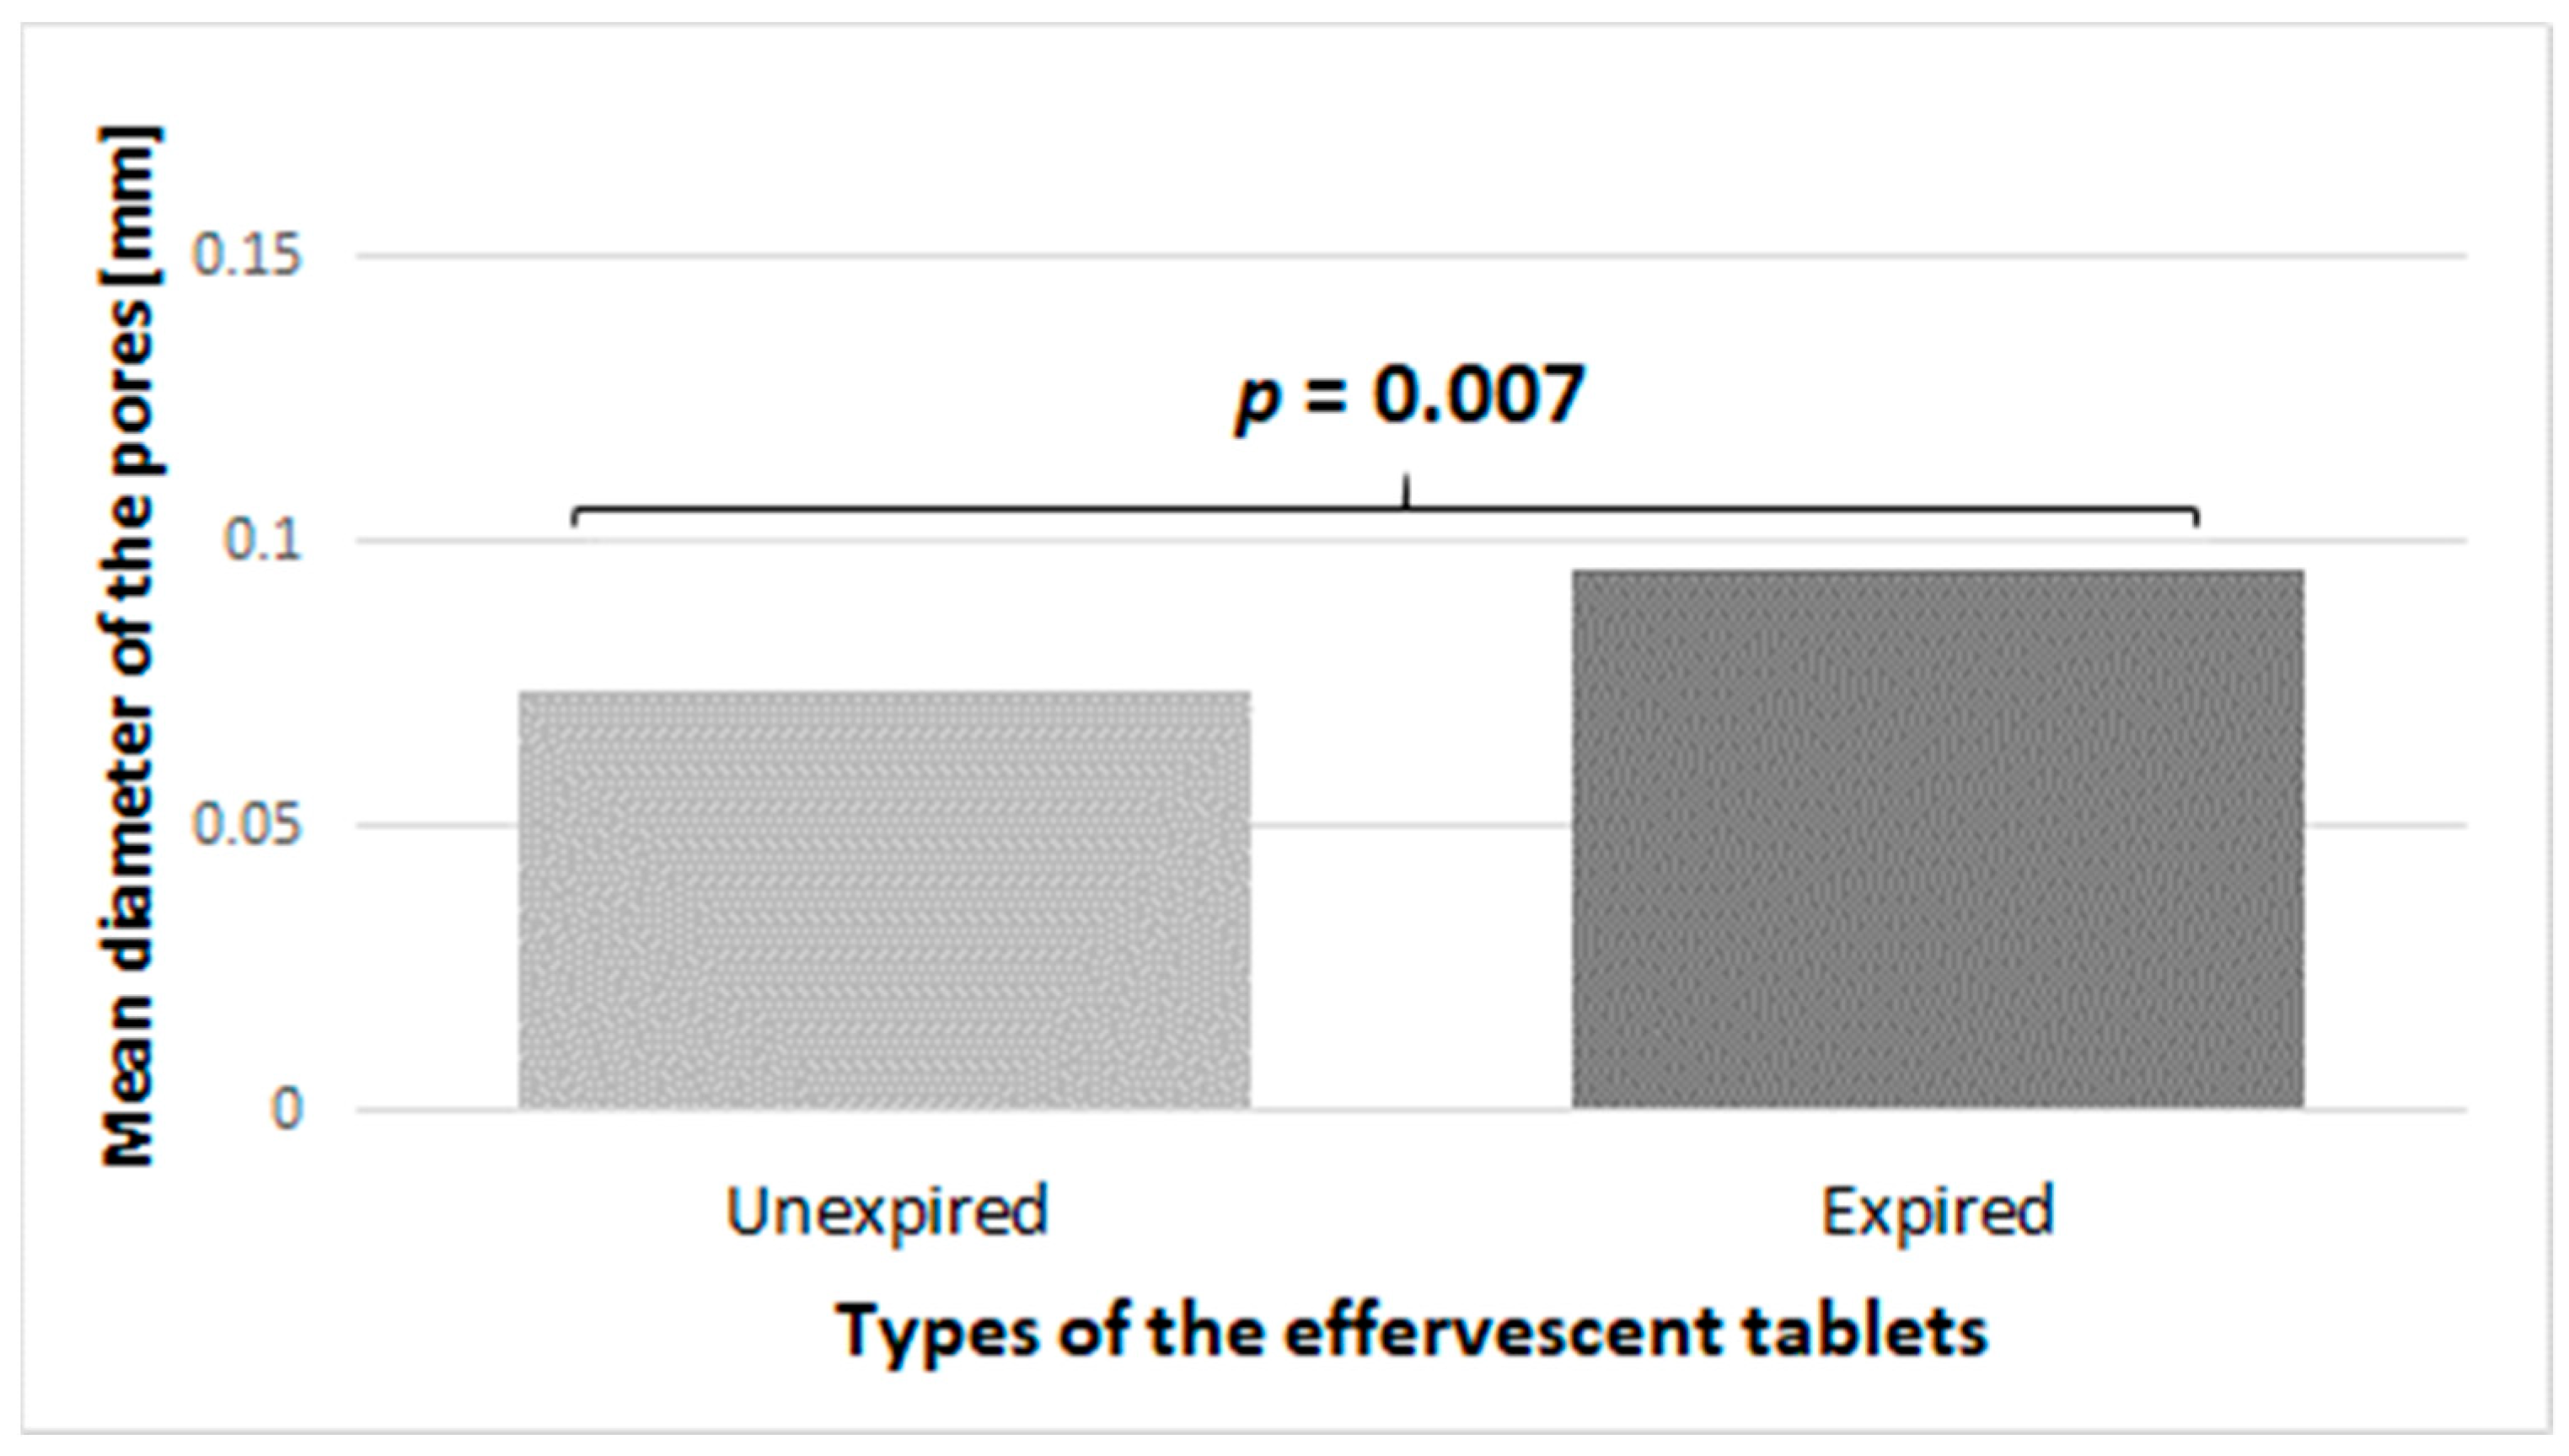
2.5.2. Diameters of the Pores

To analyze the diameters of the pores exposed on the microtomographic slices, 100 random measurements for each tablet type were made using myVGL 3.1 software (Viewer for Data Processed by Volume Graphics GmbH, Heidelberg, Germany).

2.5.3. Percentage Determination of Porosity

Porosity analysis was performed using ImageJ software. The volumes were loaded into the program, and then the images were rotated so that the edge of the tablet base was horizontal or vertical. After performing the “Stacks/Reslice” operation, a circle for analysis with a diameter of about 22 mm was marked. After setting the “Threshold” to the background level, the degree of porosity from the top to the bottom of the tablet was analyzed. The results were obtained as a percentage.

2.6. Statistical Analyses

Data were analyzed statistically using Statistica 13 software (StatSoft, Tulsa, OK, USA). The continuous data (weight, disintegration time, force needed to crush the tablet, hardness factor, brightness of the pixels, tablet’s density, and diameter of the slots) were presented as mean (M) and standard deviation (SD). The normality of the distribution of quantitative data was assessed using the W Shapiro–Wilk test. Mean values of quantitative data between the analyzed subgroups were compared using analysis of variance (ANOVA) when the distribution of data did not differ from the normal distribution or Kruskal–Wallis test when the distribution of quantitative data differed from the normal distribution. In the case of significant differences found by the Kruskal–Wallis test, the Mann–Whitney U test was used for post hoc pairwise comparisons. Spearman’s correlation coefficients were assessed to establish possible correlations between continuous variables. Every result with p ≤ 0.05 turned out to be statistically significant.

3. Results

3.1. Characteristics of the Analyzed Effervescent Tablets

Both unexpired and expired effervescent tablets were cylindrical with flat top and bottom surfaces. In addition, an amount of powder was observed on the surface of both types of tablets (Figure 3A,B), which may suggest high friability. The expired effervescent tablets showed some discoloration, impurities, or cracks. Unexpired and expired tablets that were dried in a vacuum oven at 50 °C for 24 h showed similar features to tablets that were not dried in a vacuum oven (Figure 3C,D).
The dimensions of the tablets, i.e., diameter and thickness, met the Ph.Eur.10 requirements. The analyzed effervescent tablets also showed weight uniformity, which was fully compliant with the pharmacopeial standards. The weight of none of the tablets exceeded the permitted variation of ±5%. Table 1 shows the mean values of weight, thickness, and diameter of the analyzed effervescent tablets.
There were no differences in mean weight, thickness, or diameter between the two analyzed types of effervescent tablets.

3.2. Hardness, Friability, and Disintegration Time of the Effervescent Tablets

The mean values of the parameters typically analyzed for tablets as a dosage form, i.e., hardness factor, force needed to crush the tablet, and disintegration time, are presented in Table 2. We were unable to determine the tablets’ friability because, after a few revolutions of the friabilator’s drum, the tablets broke up into several or a dozen pieces.
We observed that expired effervescent tablets disintegrated in a significantly shorter time than unexpired tablets (68 s vs. 83 s, p = 0.016). Both the mean force needed to crush the tablet and the mean hardness factor were comparable between the tablets without statistical significance. We did not observe a correlation between hardness and disintegration time.
The moisture content in the expired tablets was twofold higher than in the unexpired tablets (0.4% vs. 0.2%), as assessed by a moisture analyzer. When the moisture content was evaluated in a vacuum oven, we found that expired tablets had 0.44% moisture while unexpired tablets had 0.28%. Thus, the results obtained from both analyses were comparable.

3.3. Comparison of Expired and Unexpired Tablets in Terms of THR Value

Mean values of THR were obtained for 24 unexpired tablets and 24 expired tablets within all analyzed spectral bands. For both types of tablets, the mean values of THR were highest in two wavelength ranges of visible light (i.e., 480–600 and 590–720 nm), while the lowest mean value of THR was found in the infrared range (i.e., 1700–2500 nm) (Figure 4). We observed that the mean THR within the ranges of 400–540, 480–600, 590–720, 700–1100, and 1000–1700 nm was significantly higher for the unexpired effervescent tablets than for the expired ones (p < 0.001).
Interestingly, significant differences in mean THR were also observed when the top side of the tablets (i.e., the side of the tablet facing the closure of the package) and the bottom side of the tablets (i.e., the side of the tablet facing the bottom of the package) were compared (p < 0.001).

3.4. Analyses Using X-ray Microtomography

3.4.1. Density

The mean densities of the tablets’ inner structure are presented in Table 3.
Overall, a significant difference was observed in the density of the inner structure among all the analyzed tablets. The post hoc analysis revealed significant differences in the following pairs of tablets: unexpired vs. expired (p < 0.001), unexpired vs. unexpired dried in a vacuum oven (p = 0.004), expired vs. unexpired dried in a vacuum oven (p < 0.001), and expired vs. expired dried in a vacuum oven (p < 0.001). No differences were observed when expired tablets dried in a vacuum oven were compared with both unexpired tablets (p = 1.000) and unexpired tablets dried in a vacuum oven (p = 0.071). The highest mean density was observed in the case of unexpired tablets dried in a vacuum oven (1.273 g/cm3), while the lowest density was found in the expired tablets (1.261 g/cm3). Thus, unexpired tablets showed better homogeneity than expired tablets.

3.4.2. Diameter of the Pores

Despite the homogeneity of the inner structure, slices of the three types of effervescent tablets analyzed were also examined. The arrangement of two types of tablets during microtomographic analysis and images from the microtomographic scans showing the surface of the tablets are presented in Figure 5.
We observed that the surface of expired tablets is heterogeneous, with many defects and numerous pores.
The diameters of the exposed pores were also analyzed. Figure 6 presents the mean diameters of the pores observed in the two types of tablets analyzed.
We observed differences in mean pore diameter between the expired and unexpired effervescent tablets. The expired tablets were characterized by a larger pore diameter compared to the unexpired tablets (0.095 mm vs. 0.074 mm, respectively; p = 0.007). In the unexpired tablets, the diameter of the pores correlated negatively with the density of the inner structure; the higher the density, the lower the diameter on average (r = −0.326, p = 0.042).

3.4.3. Percentage Determination of Porosity in the Tested Tablets

The mean percentage of porosity based on the results obtained from individual sections according to the axis of the tablet is presented in Table 4.
The percentage of porosity differed significantly between the tablets (Table 4). The post hoc analysis revealed significant differences in the following pairs of tablets: unexpired vs. expired (p < 0.001), unexpired vs. unexpired dried in a vacuum oven (p = 0.015), unexpired vs. expired dried in a vacuum oven (p = 0.007), expired vs. unexpired dried in a vacuum oven (p < 0.001), and expired vs. expired dried in a vacuum oven (p < 0.001). No difference in porosity was demonstrated when the expired tablets dried in a vacuum oven were compared with the unexpired tablets dried in a vacuum oven.

4. Discussion

The quality of the pharmaceutical product is determined by its physical and chemical properties. Our study evaluated the appearance, diameter, thickness, uniformity of weight, dissolution time, moisture content, as well as mechanical strength of effervescent tablets containing magnesium and vitamin B6. We analyzed both the unexpired and expired types of the selected preparation. Unexpired tablets showed longer disintegration time compared to expired tablets, while, as expected, there were no significant differences in the tablets’ weight, thickness, diameter as well as hardness. The mean total reflectance of the surface and the inner structure of the effervescent tablets using reflectance analysis and X-ray microtomography, respectively also were evaluated, as we assumed that these methods may help in the rapid assessment of the degradation process. We observed that the mean THR was significantly higher within the ranges of 400–540 nm, 480–600, 590–720, 700–1100, and 1000–1700 for the unexpired effervescent tablets compared to the expired tablets. In addition, we observed significant differences in mean THR between the top and bottom sides of the tablets. In general, the bottom sides of the tablets showed higher reflectance, which may indicate that more physicochemical changes occurred during storage on the top sides and thus more light is transmitted into the tablet. This may be linked to the packaging material. Previously, near-infrared spectroscopy (NIR) was used to determine degradation products [26] or the quality parameters of mucoadhesive bi-layer thin-film composites [27]. However, the use of hemispheric directional reflectance is a relatively new idea, and there is not much data on the topic [16,17].
Expired effervescent tablets were characterized by a lower density compared to unexpired tablets, which may translate into a specific dissolution time that was significantly shorter for expired tablets. The microstructure of the solid form of the drug affects parameters such as mechanical strength, stability, and disintegration time. This microstructure is characterized by the density, size, and shape of particles, the distribution of excipients and APIs, and the size of pores, fissures, and micro-cracks. Thus, the high porosity of the tablet facilitates the penetration of the liquid into the tablet and increases the rate of dissolution. The values of the average pore diameter of the analyzed effervescent tablets were higher for expired tablets than for unexpired ones. The obtained values of the parameters assessed by X-ray computed microtomography were correlated with each other, and we observed that the higher the density, the lower the diameter on average.
The Ph. Eur. 10 defines effervescent tablets as compressed tablets that contain, in addition to the medicinal substance(s), mixtures of acids (e.g., citric or tartaric acid) and sodium carbonates and/or bicarbonates [25]. Increasingly, this form provides a source of vitamins and/or minerals or other substances with nutritional or other physiological effects [2,3]. Earlier, numerous studies presented effervescent tablets as a matrix to obtain medicinal preparations with faster disintegration, higher drug solubilization, and better stability under higher humidity storage conditions. Such formulations can be obtained by modifying their method of preparation or by adding microcapsules and solid dispersions to the formulation [13,14,28,29,30].
In the present study, we used a commercial formulation that contains citric acid and sodium carbonates as acidity regulators; magnesium carbonate, fructose, cyclamates, and saccharin as sweeteners; aroma; vitamin B6; and riboflavin as a dye. Magnesium is one of the essential ions for the functioning of the body and plays a vital role in the functioning of the brain, heart, and skeletal muscles. It is a cofactor involved in more than 600 biochemical reactions, and its deficiency can result in serious dysfunction [31,32]. Decreased levels of magnesium have been shown to be associated with anxiety, depressive disorders, and mood changes [33]. It has been observed that vitamin B6 acts as a cofactor in more than 160 enzyme reactions [34]. A previous experimental study based on a rat model showed that the administration of high doses of vitamin B6 increased magnesium concentration [35]. Sodium bicarbonate, included in the formulation of effervescent tablets, facilitates the disintegration of the tablet and enhances gastric emptying, resulting in the API reaching the site of absorption faster and appearing in the blood in a shorter time [1,36,37,38,39]. In addition, the contact time of the drug with the gastric mucosa and the possibility of its inactivation in an acidic environment are reduced [40]. Many studies have proven significant differences in the pharmacokinetic parameters of API released from an effervescent tablet compared to conventional oral preparations [41,42,43]. Unfortunately, effervescent components are hygroscopic and moisture-labile, and storing tablets at temperatures above 25 °C accelerates the decomposition of bicarbonate into carbonate.
A stable production process allows obtaining a pharmaceutical product that retains its quality characteristics throughout its shelf life. During the production of tablets or other drug forms, data can be obtained using various types of devices used to control and monitor the process. These measurements can be carried out using different methods: “at-line”, “on-line”, and “in-line”. Each manufactured batch of tablets is tested for compliance with the requirements of the specification. Of the entire batches, only randomly selected samples are tested through the most often time-consuming tests. The assessment of the quality of tablets includes the following tests: organoleptic, dimensions, content of medicinal substances and possibly decomposition products, disintegration time, resistance to abrasion and crushing of tablets, and microbiological purity.
The use of spectroscopic techniques may allow obtaining new spatial information about the sample. Particularly noteworthy are modern, non-destructive analytical techniques, including NIR, Raman spectroscopy, X-ray fluorescence, terahertz spectroscopy, and others. Previously, such studies were conducted [11,27,44,45], although they are still not standard procedures. In addition, using these methods, it is possible to control the quality of the samples from a given batch in a non-destructive, non-invasive, fast, and time-saving manner. These methods can also be used during the storage of a pharmaceutical product to gain new knowledge about the degradation processes occurring in the tablet, enabling the data obtained from them to be correlated with data from pharmacopeial tests.
We found a few studies analyzing effervescent tablets during storage [12,13,14,15,46,47]. Thoke et al. [46] analyzed effervescent tablets containing alendronate sodium and vitamin D3 and observed no significant change in physiochemical properties after storage at various temperatures and humidity conditions for one month and then for three months. The hardness and solution time of the tablets showed a tendency to be higher after three months of storage, but the changes were insignificant. According to the authors, degradation and changes in the formulation did not occur in these tablets [46]. On the other hand, Neuberger et al. [47] analyzed the degradation of effervescent tablets containing acetylsalicylic acid and ascorbic acid that were stored at 30 °C with varying relative humidity (RH) conditions, i.e., 33%, 52%, and 75%. Using Raman spectroscopy, the authors demonstrated that it is possible to discriminate between non-degraded and degraded effervescent tablets after storage at 52% RH for approx. 24 h [47]. Chayia et al. [48] prepared effervescent tablets with a matrix made of an hydroxypropyl methylcellulose (HPMC) gel layer and an eutectic mixture of ibuprofen (IBU) and poloxamer 407 (P407) as a model drug. The authors demonstrated that effervescence promoted the increase in interconnected porosities, which directly influenced several features of the prepared drug form, including the strength of the gel layer microstructure, the drug release, and the release mechanism.
To the best of the authors’ knowledge, the present study is the first to use the analysis of hemispherical reflectance to evaluate differences in the comparative evaluation of unexpired and expired effervescent tablets. However, the present study has some limitations related to the pilot nature of the research resulting from the small number of tablets measured. In addition, no chemical analysis of the active ingredients was performed. Since chemical degradation may also affect the physical structure of tablets, the data obtained from the proposed techniques should be correlated with data from chemical analyses in the future to confirm the usefulness of these methods in the rapid screening of physical changes occurring in different types of solid oral dosage forms during storage.

5. Conclusions

Based on the reflectance measurements, the expired effervescent tablets containing magnesium and vitamin B6 showed lower mean values of THR in five spectral ranges. This indicates that the radiation beam is transmitted to a greater extent into the inner structure than for unexpired tablets. Furthermore, a negative correlation between the density of the tablet interior and the average size of the pores was reported, indicating that the higher the density, the lower the diameter on average. The microstructure of the tablets, as observed by X-ray computed microtomography, showed that the expired tablets were characterized by a greater diameter of pores and a higher percentage of porosity than the unexpired tablets.
THR analysis is a novel technique that may be used for the rapid identification of physical changes. This technique can be used for routine evaluation of drug forms in the future. Combined with data from microtomographic analyses, it can be an attractive tool for stability screening. The simplified procedure of both methods enables the homogeneity of a matrix of solid dosage forms to be determined.

Author Contributions

Conceptualization, B.S.-H. and B.S.-M.; methodology, B.S.-H., B.S.-M., M.M. and P.D.; software, B.S.-H., B.S.-M., M.M. and P.D.; formal analysis, B.S.-H. and B.S.-M.; investigation, B.S.-H., B.S.-M., M.M. and P.D.; resources, B.S.-H. and B.S.-M.; data curation, B.S.-H., B.S.-M., M.M. and P.D.; writing—original draft preparation, B.S.-H., B.S.-M., M.M. and P.D.; writing—review and editing, B.S.-H. and B.S.-M.; visualization, B.S.-H.; supervision, B.S.-H.; project administration, B.S.-H.; funding acquisition, B.S.-H. All authors have read and agreed to the published version of the manuscript.

Funding

This research was funded by the Medical University of Silesia in Katowice, Poland, under the project PCN-1-058/K/2/O.

Institutional Review Board Statement

Not applicable.

Informed Consent Statement

Not applicable.

Data Availability Statement

The data presented in this study are available upon request from the Department of Basic Biomedical Science, School of Pharmaceutical Sciences in Sosnowiec, Medical University of Silesia in Katowice, Poland. The data are not publicly available due to privacy restrictions.

Conflicts of Interest

The authors declare no conflict of interest.

References

  1. Aslani, A.; Jahangiri, H. Formulation, characterization and physicochemical evaluation of ranitidine effervescent tablets. Adv. Pharm. Bull. 2013, 3, 315. [Google Scholar] [PubMed]
  2. Wegehaupt, F.J.; Lunghi, N.; Hogger, V.M.G.; Attin, T. Erosive potential of vitamin and vitamin+mineral effervescent tablets. Swiss Dent. J. 2016, 126, 457–465. [Google Scholar] [PubMed]
  3. Gurdogan Guler, E.B.; Bayrak, G.D.; Unsal, M.; Selvi Kuvvetli, S. Effect of pediatric multivitamin syrups and effervescent tablets on the surface microhardness and roughness of restorative materials: An in vitro study. J. Dent. Sci. 2021, 16, 311–317. [Google Scholar] [CrossRef] [PubMed]
  4. Patel, S.G.; Siddaiah, M. Formulation and evaluation of effervescent tablets: A review. JDDT 2018, 8, 296. [Google Scholar] [CrossRef]
  5. Tajmim, A.; Siddique, A.B.; El Sayed, K. Optimization of taste-masked (-)-oleocanthal effervescent formulation with potent breast cancer progression and recurrence suppressive activities. Pharmaceutics 2019, 11, 515. [Google Scholar] [CrossRef] [Green Version]
  6. Møller, P.L.; Nørholt, S.E.; Ganry, H.E.; Insuasty, J.H.; Vincent, F.G.; Skoglund, L.A.; Sindet-Pedersen, S. Time to onset of analgesia and analgesic efficacy of effervescent acetaminophen 1000 mg compared to tablet acetaminophen 1000 mg in postoperative dental pain: A single-dose, double-blind, randomized, placebo-controlled study. J. Clin. Pharmacol. 2000, 40, 370. [Google Scholar] [CrossRef] [PubMed]
  7. Opawale, F.; Nayak, P.; Meisel, G. Effervescent Tablet Containing High Level of Aspirin. U.S. Patent 10258562B2. 2014. Application on 28 February 2018.
  8. ICH Harmonization for Better Health. Available online: https://www.ich.org/page/quality-guidelines (accessed on 22 February 2023).
  9. Merckle, P.; Kovar, K. Assay of effervescent tablets by near-infrared spectroscopy in transmittance and reflectance mode: Acetylsalicylic acid in mono and combination formulations. J. Pharm. Biomed. Anal. 1998, 17, 365. [Google Scholar] [CrossRef]
  10. Muntean, D.; Porfire, A.; Alecu, C.; Iurian, S.; Casian, T.; Gavan, A.; Tomuta, I. A non-destructive NIR spectroscopic method combined with chemometry for simultaneous assay of paracetamol and caffeine in tablets. Ro. J. Pharm. Prac. 2021, 14, 68. [Google Scholar] [CrossRef]
  11. Dinc, E.; Baleanu, D. Ratio Spectra-Continuous Wavelet Transform and Ratio Spectra-Derivative Spectrophotometry for the Quantitative Analysis of Effervescent Tablets of Vitamin C and Aspirin. Rev. Chem. 2008, 59, 499–504. [Google Scholar] [CrossRef]
  12. Elizabeth, M.M.; Ravi, A.; Rameshwar, N.; Sudheer, M.; Krishnamurthy, B. Development and validation of an analytical method for related substances in N-acetyl–L- cysteine effervescent Tablets by RP-HPLC. Indian J. Pharm. Educ. Res. 2017, 51, 626–635. [Google Scholar]
  13. Rosch, M.; Lucas, K.; Al-Gousous, J.; Pöschl, U.; Langguth, P. Formulation and Characterization of an Effervescent Hydrogen-Generating Tablet. Pharmaceuticals 2021, 14, 1327. [Google Scholar] [CrossRef] [PubMed]
  14. Maximiano, F.P.; Costa, G.H.; de Sá Barreto, L.C.; Bahia, M.T.; Cunha-Filho, M.S. Development of effervescent tablets containing benzonidazole complexed with cyclodextrin. J. Pharm. Pharmacol. 2011, 63, 786–793. [Google Scholar] [CrossRef]
  15. Kadivar, A.; Kamalidehghan, B.; Javar, H.A.; Davoudi, E.T.; Zaharuddin, N.D.; Sabeti, B.; Chung, L.Y.; Noordin, M.I. Formulation and in vitro, in vivo evaluation of effervescent floating sustained-release imatinib mesylate tablet. PLoS ONE 2015, 10, e0126874. [Google Scholar] [CrossRef] [PubMed]
  16. Sarecka-Hujar, B.; Szulc-Musioł, B.; Meisner, M.; Duda, P. The use of novel, rapid analytical tools in the assessment of the stability of tablets—A pilot analysis of expired and unexpired tablets containing nifuroxazide. Processes 2022, 10, 1934. [Google Scholar] [CrossRef]
  17. Wilczyński, S.; Koprowski, R.; Błońska-Fajfrowska, B. Directional reflectance analysis for identifying counterfeit drugs: Preliminary study. J. Pharm. Biomed. Anal. 2016, 124, 341–346. [Google Scholar] [CrossRef]
  18. Thosar, S.S.; Forbess, R.A.; Ebube, N.K.; Chen, Y.; Rubinovitz, R.L.; Kemper, M.S.; Reier, G.E.; Wheatley, T.A.; Shukla, A.J. A comparison of reflectance and transmittance near-infrared spectroscopic techniques in determining drug content in intact tablets. Pharm. Dev. Technol. 2001, 6, 19–29. [Google Scholar] [CrossRef]
  19. Donoso, M.; Kildsig, D.O.; Ghaly, E.S. Prediction of tablet hardness and porosity using near-infrared diffuse reflectance spectroscopy as a nondestructive method. Pharm. Dev. Technol. 2003, 8, 357–366. [Google Scholar] [CrossRef]
  20. da Silva, Í.B. X-ray Computed microtomography technique applied for cementitious materials: A review. Micron 2018, 107, 1. [Google Scholar] [CrossRef]
  21. Landis, E.N.; Keane, D.T. X-ray microtomography. Mater. Charact. 2010, 61, 1305. [Google Scholar] [CrossRef]
  22. Wilczyński, S.; Koprowski, R.; Duda, P.; Banyś, A.; Błońska-Fajfrowska, B. Microtomographic studies of subdivision of modified-release tablets. Int. J. Pharm. 2016, 511, 899–912. [Google Scholar] [CrossRef] [PubMed]
  23. Novikova, A.; Markl, D.; Zeitler, J.A.; Rades, T.; Leopold, C.S. A non-destructive method for quality control of the pellet distribution within a MUPS tablet by terahertz pulsed imaging. Eur. J. Pharm. Sci. 2018, 111, 549–555. [Google Scholar] [CrossRef] [Green Version]
  24. Wagner-Hattler, L.; Québatte, G.; Keiser, J.; Schoelkopf, J.; Schlepütz, C.M.; Huwyler, J.; Puchkov, M. Study of drug particle distributions within mini-tablets using synchrotron X-ray microtomography and superpixel image clustering. Int. J. Pharm. 2020, 573, 118827. [Google Scholar] [CrossRef] [PubMed]
  25. European Pharmacopoeia, 10th ed.; EDQM Council of Europe: Strasbourg, France, 2022.
  26. Drennen, J.K.; Lodder, R.A. Nondestructive near-infrared analysis of intact tablets for determination of degradation products. J. Pharm. Sci. 1990, 79, 622. [Google Scholar] [CrossRef] [PubMed]
  27. Fountain, W.; Dumstorf, K.; Lowell, A.E.; Lodder, R.A.; Mumper, R.J. Near-infrared spectroscopy for the determination of testosterone in thin-film composites. J. Pharm. Biomed. Anal. 2003, 33, 18. [Google Scholar] [CrossRef] [PubMed]
  28. Wang, Y.; Xu, S.; Xiao, Z.; Jiang, Y.; Jiang, Q.; Li, J.; He, W. Stiripentol enteric solid dispersion-loaded effervescent tablets: Enhanced dissolution, stability, and absorption. AAPS Pharm. Sci. Tech. 2022, 23, 141. [Google Scholar] [CrossRef]
  29. Lima, A.L.; Pinho, L.A.G.; Chaker, J.A.; Sa-Barreto, L.L.; Marreto, R.N.; Gratieri, T.; Gelfuso, G.M.; Cunha-Filho, M. Hot-melt extrusion as an advantageous technology to obtain effervescent drug products. Pharmaceutics 2020, 12, 779. [Google Scholar] [CrossRef]
  30. Huang, J.; Feng, X.; Zhang, S.; Wang, L.; Yue, J.; Chu, L. Preparation and characterization of astaxanthin-loaded microcapsules and its application in effervescent tablets. J. Sci. Food. Agric. 2022, 103, 1421–1431. [Google Scholar] [CrossRef]
  31. de Baaij, J.H.; Hoenderop, J.G.; Bindels, R.J. Magnesium in man: Implications for health and disease. Physiol. Rev. 2015, 95, 1. [Google Scholar] [CrossRef]
  32. Noah, L.; Dye, L.; Bois De Fer, B.; Mazur, A.; Pickering, G.; Pouteau, E. Effect of magnesium and vitamin B6 supplementation on mental health and quality of life in stressed healthy adults: Post-hoc analysis of a randomised controlled trial. Stress Health 2021, 37, 1000. [Google Scholar] [CrossRef]
  33. Islam, M.R.; Islam, M.R.; Shalahuddin Qusar, M.M.A.; Islam, M.S.; Kabir, M.H.; Mustafizur Rahman, G.K.M.; Islam, M.S.; Hasnat, A. Alterations of serum macro-minerals and trace elements are associated with major depressive disorder: A case-control study. BMC Psychiatry 2018, 18, 94. [Google Scholar] [CrossRef] [PubMed] [Green Version]
  34. Sato, K. Why is vitamin B6 effective in alleviating the symptoms of autism? Med. Hypotheses 2018, 115, 103. [Google Scholar] [CrossRef] [PubMed]
  35. Majumdar, P.; Boylan, L.M. Alteration of tissue magnesium levels in rats by dietary vitamin B6 supplementation. Int. J. Vitam. Nutr. Res. 1989, 59, 300. [Google Scholar] [PubMed]
  36. Aslani, A.; Fattahi, F. Formulation, characterization and physicochemical evaluation of potassium citrate effervescent tablets. Adv. Pharm. Bull. 2013, 3, 217. [Google Scholar] [PubMed] [Green Version]
  37. Rygnestad, T.; Zahlsen, K.; Samdal, F.A. Absorption of effervescent paracetamol tablets relative to ordinary paracetamol tablets in healthy volunteers. Eur. J. Clin. Pharmacol. 2000, 56, 141. [Google Scholar] [CrossRef]
  38. Dubray, C.; Maincent, P.; Milon, J.Y. From the pharmaceutical to the clinical: The case for effervescent paracetamol in pain management. A narrative review. Curr. Med. Res. Opin. 2021, 37, 1039. [Google Scholar] [CrossRef]
  39. Fathi, M.; Kazemi, S.; Zahedi, F.; Shiran, M.R.; Moghadamnia, A.A. Comparison of oral bioavailability of acetaminophen tablets, capsules and effervescent dosage forms in healthy volunteers. Curr. Issues Pharm. Med. Sci. 2018, 31, 5. [Google Scholar] [CrossRef] [Green Version]
  40. Szałek, E. Paracetamol in the form of uncoated and effervescent tablets—similarities and differences. Farm. Wspólczesna 2018, 11, 127. (In Polish) [Google Scholar]
  41. Sevilla-Tirado, F.J.; González-Vallejo, E.B.; Leary, A.C.; Breedt, H.J.; Hyde, V.J.; Fernández-Hernando, N. Bioavailability of two new formulations of paracetamol, compared with three marketed formulations, in healthy volunteers. Methods Find Exp. Clin. Pharmacol. 2003, 25, 531. [Google Scholar] [CrossRef]
  42. Grattan, T.; Hickman, R.; Darby-Dowman, A.; Hayward, M.; Boyce, M.; Warrington, S. A five way crossover human volunteer study to compare the pharmacokinetics of paracetamol following oral administration of two commercially available paracetamol tablets and three development tablets containing paracetamol in combination with sodium bicarbonate or calcium carbonate. Eur. J. Pharm. Biopharm. 2000, 49, 225. [Google Scholar]
  43. Rostami-Hodjegan, A.; Shiran, M.R.; Ayesh, R.; Grattan, T.J.; Burnett, I.; Darby-Dowman, A.; Tucker, G.T. A new rapidly absorbed paracetamol tablet containing sodium bicarbonate. I. A four-way crossover study to compare the concentration-time profile of paracetamol from the new paracetamol/sodium bicarbonate tablet and a conventional paracetamol tablet in fed and fasted volunteers. Drug Dev. Ind. Pharm. 2002, 28, 523. [Google Scholar] [PubMed]
  44. Ottó, D.; Bicanic, D.; Ajtony, Z.; Koehorst, R. Determination of sunset yellow in multi-vitamin tablets by photoacoustic spectroscopy and a comparison with alternative methods. Food Addit. Contam. 2005, 22, 503. [Google Scholar] [CrossRef] [PubMed]
  45. Smith, M.R.; Jee, R.D.; Moffat, A.C. The transfer between instruments of a reflectance near-infrared assay for paracetamol in intact tablets. Analyst 2002, 127, 1682. [Google Scholar] [CrossRef] [PubMed]
  46. Thoke, S.B.; Sharma, Y.P.; Rawat, S.S.; Nangude, S.L. Formulation Development & Evaluation of Effervescent Tablet of Alendronate Sodium with Vitamin D3. J. Drug Deliv. Ther. 2013, 3, 65. [Google Scholar]
  47. Neuberger, S.; Jooß, K.; Flottmann, D.; Scriba, G.; Neusüß, C. Raman spectroscopy and capillary zone electrophoresis for the analysis of degradation processes in commercial effervescent tablets containing acetylsalicylic acid and ascorbic acid. J. Pharm. Biomed. Anal. 2017, 134, 122–129. [Google Scholar] [CrossRef]
  48. Chaiya, P.; Rojviriya, C.; Pichayakorn, W.; Phaechamud, T. New Insight into the Impact of Effervescence on Gel Layer Microstructure and Drug Release of Effervescent Matrices Using Combined Mechanical and Imaging Characterisation Techniques. Pharmaceutics 2022, 14, 2299. [Google Scholar] [CrossRef]
Figure 1. Arrangement of the effervescent tablets around the Micro-CT HA Phantom D32 (the 3D image is on the right).
Applsci 13 03171 g001
Figure 2. Exemplary region of interest (ROI) selected for brightness analysis (approximate area with visible pixels on the right). The number of pixels within the ROI is 5390, and the surface of the pixel is 625 μm2, thus the area of the ROI is approx. 3.330 cm2.
Applsci 13 03171 g002
Figure 3. Images of the effervescent tablets ((A)—unexpired; (B)—expired; (C)—unexpired tablet dried in a vacuum dryer; (D)—expired tablet dried in a vacuum dryer) under visible light.
Applsci 13 03171 g003
Figure 4. Mean values of total reflectance for unexpired and expired effervescent tablets containing magnesium and vitamin B6 in seven measured wavelength ranges (n = 24 of each tablet’s type). The standard deviation bars are presented in the chart. The highest SD value was observed in the range of 335–380 nm (0.083 for unexpired tablets and 0.118 for expired tablets). The remaining SDs had a value in the third decimal place, thus they may not be visible on the chart.
Applsci 13 03171 g004
Figure 5. Arrangement of two types of tablets during microtomographic analysis (A) and images from the microtomographic scans showing the surface of the analyzed types of effervescent tablets: (B) unexpired; (C) expired.
Applsci 13 03171 g005
Figure 6. Mean diameters of pores observed on the surface of the analyzed tablets evaluated with X-ray microtomography (n = 3 of each tablet’s type). Significant difference is in bold.
Applsci 13 03171 g006
Table 1. Parameters of the analyzed effervescent tablets.
Type of Effervescent TabletWeight (g)
N = 20
M ± SD
Thickness (mm)
N = 10
M ± SD
Diameter (mm)
N = 10
M ± SD
Unexpired4.014 ± 0.065.69 ± 0.0625.19 ± 0.04
Expired4.009 ± 0.055.71 ± 0.0525.18 ± 0.04
p0.8330.5520.879
M—mean; SD—standard deviation.
Table 2. Pharmacopeial parameters of both types of effervescent tablets, including hardness factor, force needed to crush the tablet, and disintegration time.
Type of Effervescent TabletForce Needed to Crush the Tablet (N) N = 10, M ± SD Hardness Factor (N/m2)
N = 10 M ± SD
Disintegration Time (s)
N = 6 M ± SD
Unexpired129.38 ± 13.249.12 × 105 ± 9.38 × 10482.67 ± 2.73
Expired138.72 ± 10.009.60 × 105 ± 6.73 × 10468.17 ± 11.92
p0.2430.4030.016
M—mean; SD—standard deviation. Significant difference is in bold.
Table 3. The mean density of the inner structure of the analyzed effervescent tablets.
Type of TabletDensity (g/cm3) N = 3, M ± SD
Unexpired1.268 ± 0.010
Expired1.261 ± 0.009
Unexpired tablets dried in a vacuum oven at 50 °C for 24 h 1.273 ± 0.009
Expired tablets dried in a vacuum oven at 50 °C for 24 h 1.269 ± 0.009
p<0.001
M—mean; SD—standard deviation; h—hours. Significant difference is in bold.
Table 4. Mean percentage porosity in the analyzed effervescent tablets.
Type of TabletPorosity (%) N = 3, M ± SD
Unexpired0.0042 ± 0.010
Expired0.0140 ± 0.015
Unexpired tablets dried in a vacuum oven at 50 °C for 24 h0.0060 ± 0.013
Expired tablets dried in a vacuum oven at 50 °C for 24 h0.0057 ± 0.014
p<0.001
M—mean; SD—standard deviation; h—hours. Significant difference is in bold.
Disclaimer/Publisher’s Note: The statements, opinions and data contained in all publications are solely those of the individual author(s) and contributor(s) and not of MDPI and/or the editor(s). MDPI and/or the editor(s) disclaim responsibility for any injury to people or property resulting from any ideas, methods, instructions or products referred to in the content.

