


Uncovering Bacterial Diversity during Mesophilic and Thermophilic Phases of Biowaste Composting through Next-Generation Sequencing

Abstract
:1. Introduction
2. Materials and Methods
2.1. Experimental Design and Sampling
2.2. Physicochemical and Microbiological Parameters
2.3. DNA Extraction
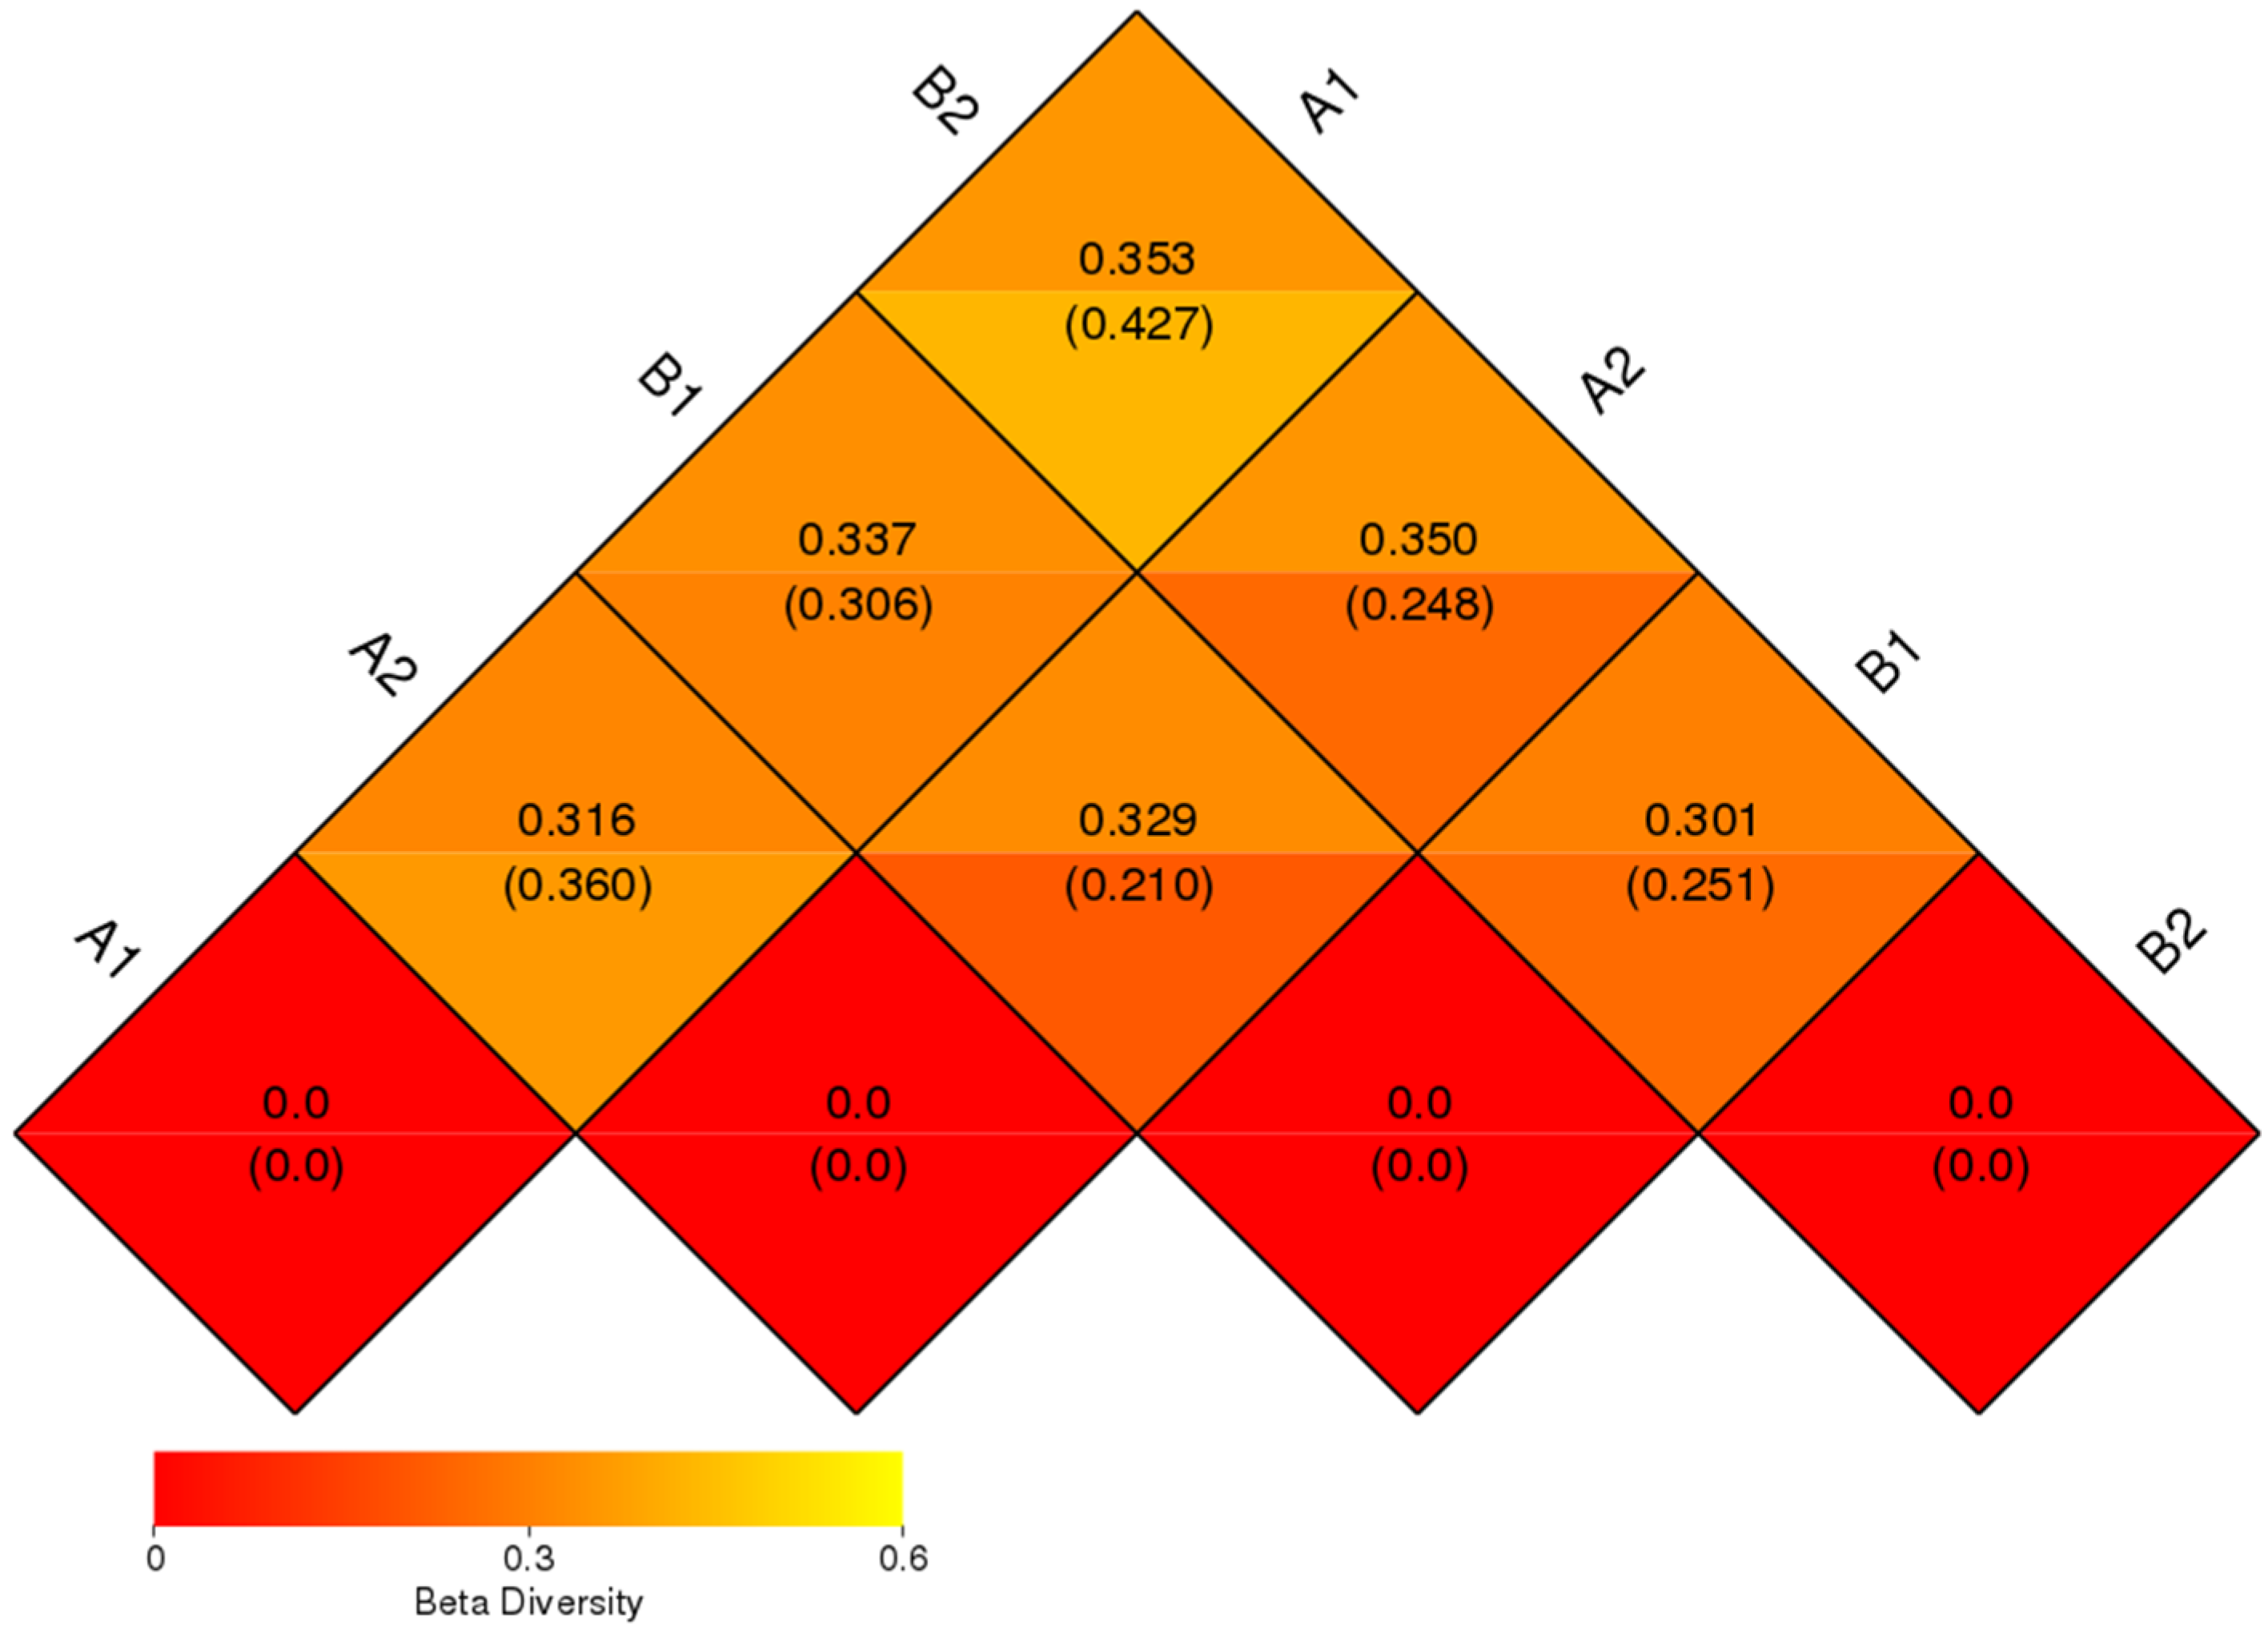
2.4. Beta Diversity
3. Results
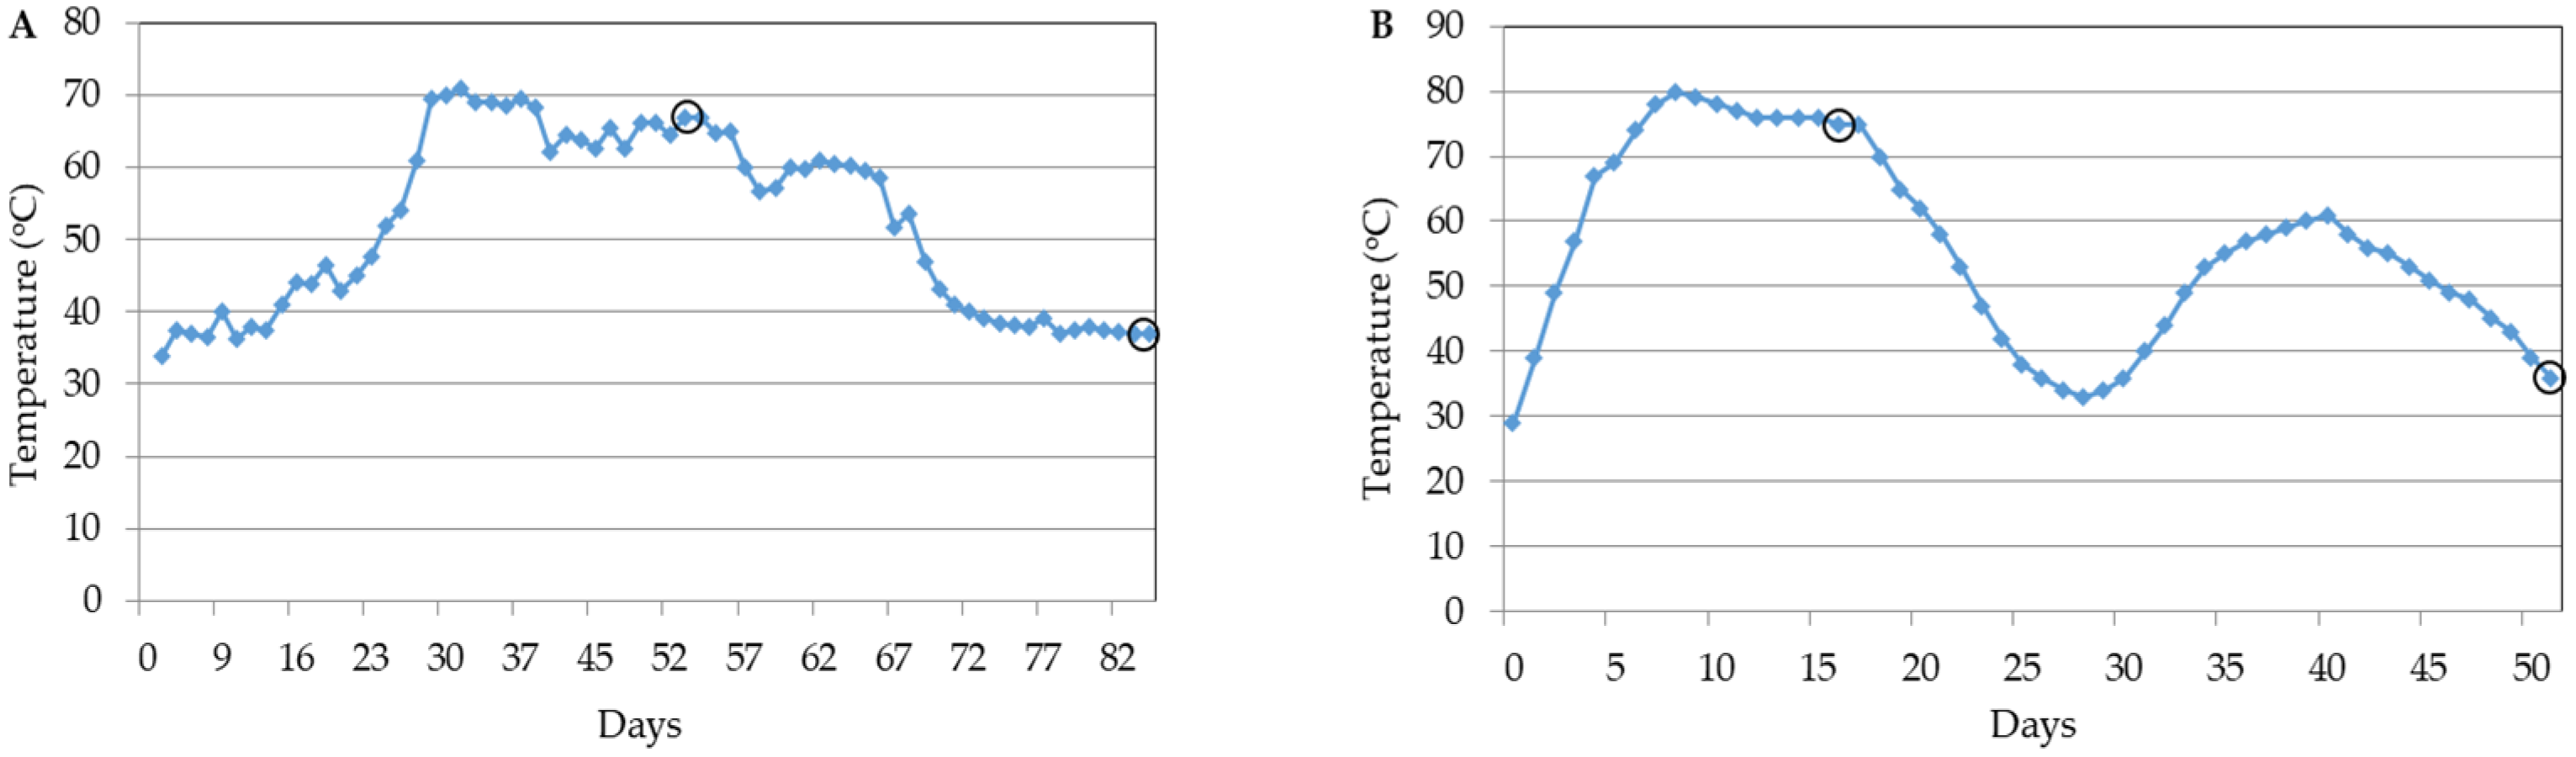
3.1. Physicochemical Properties of Compost
3.2. OTU Identification and Taxonomic Annotation
3.3. Composition of Microbial Community Analysis
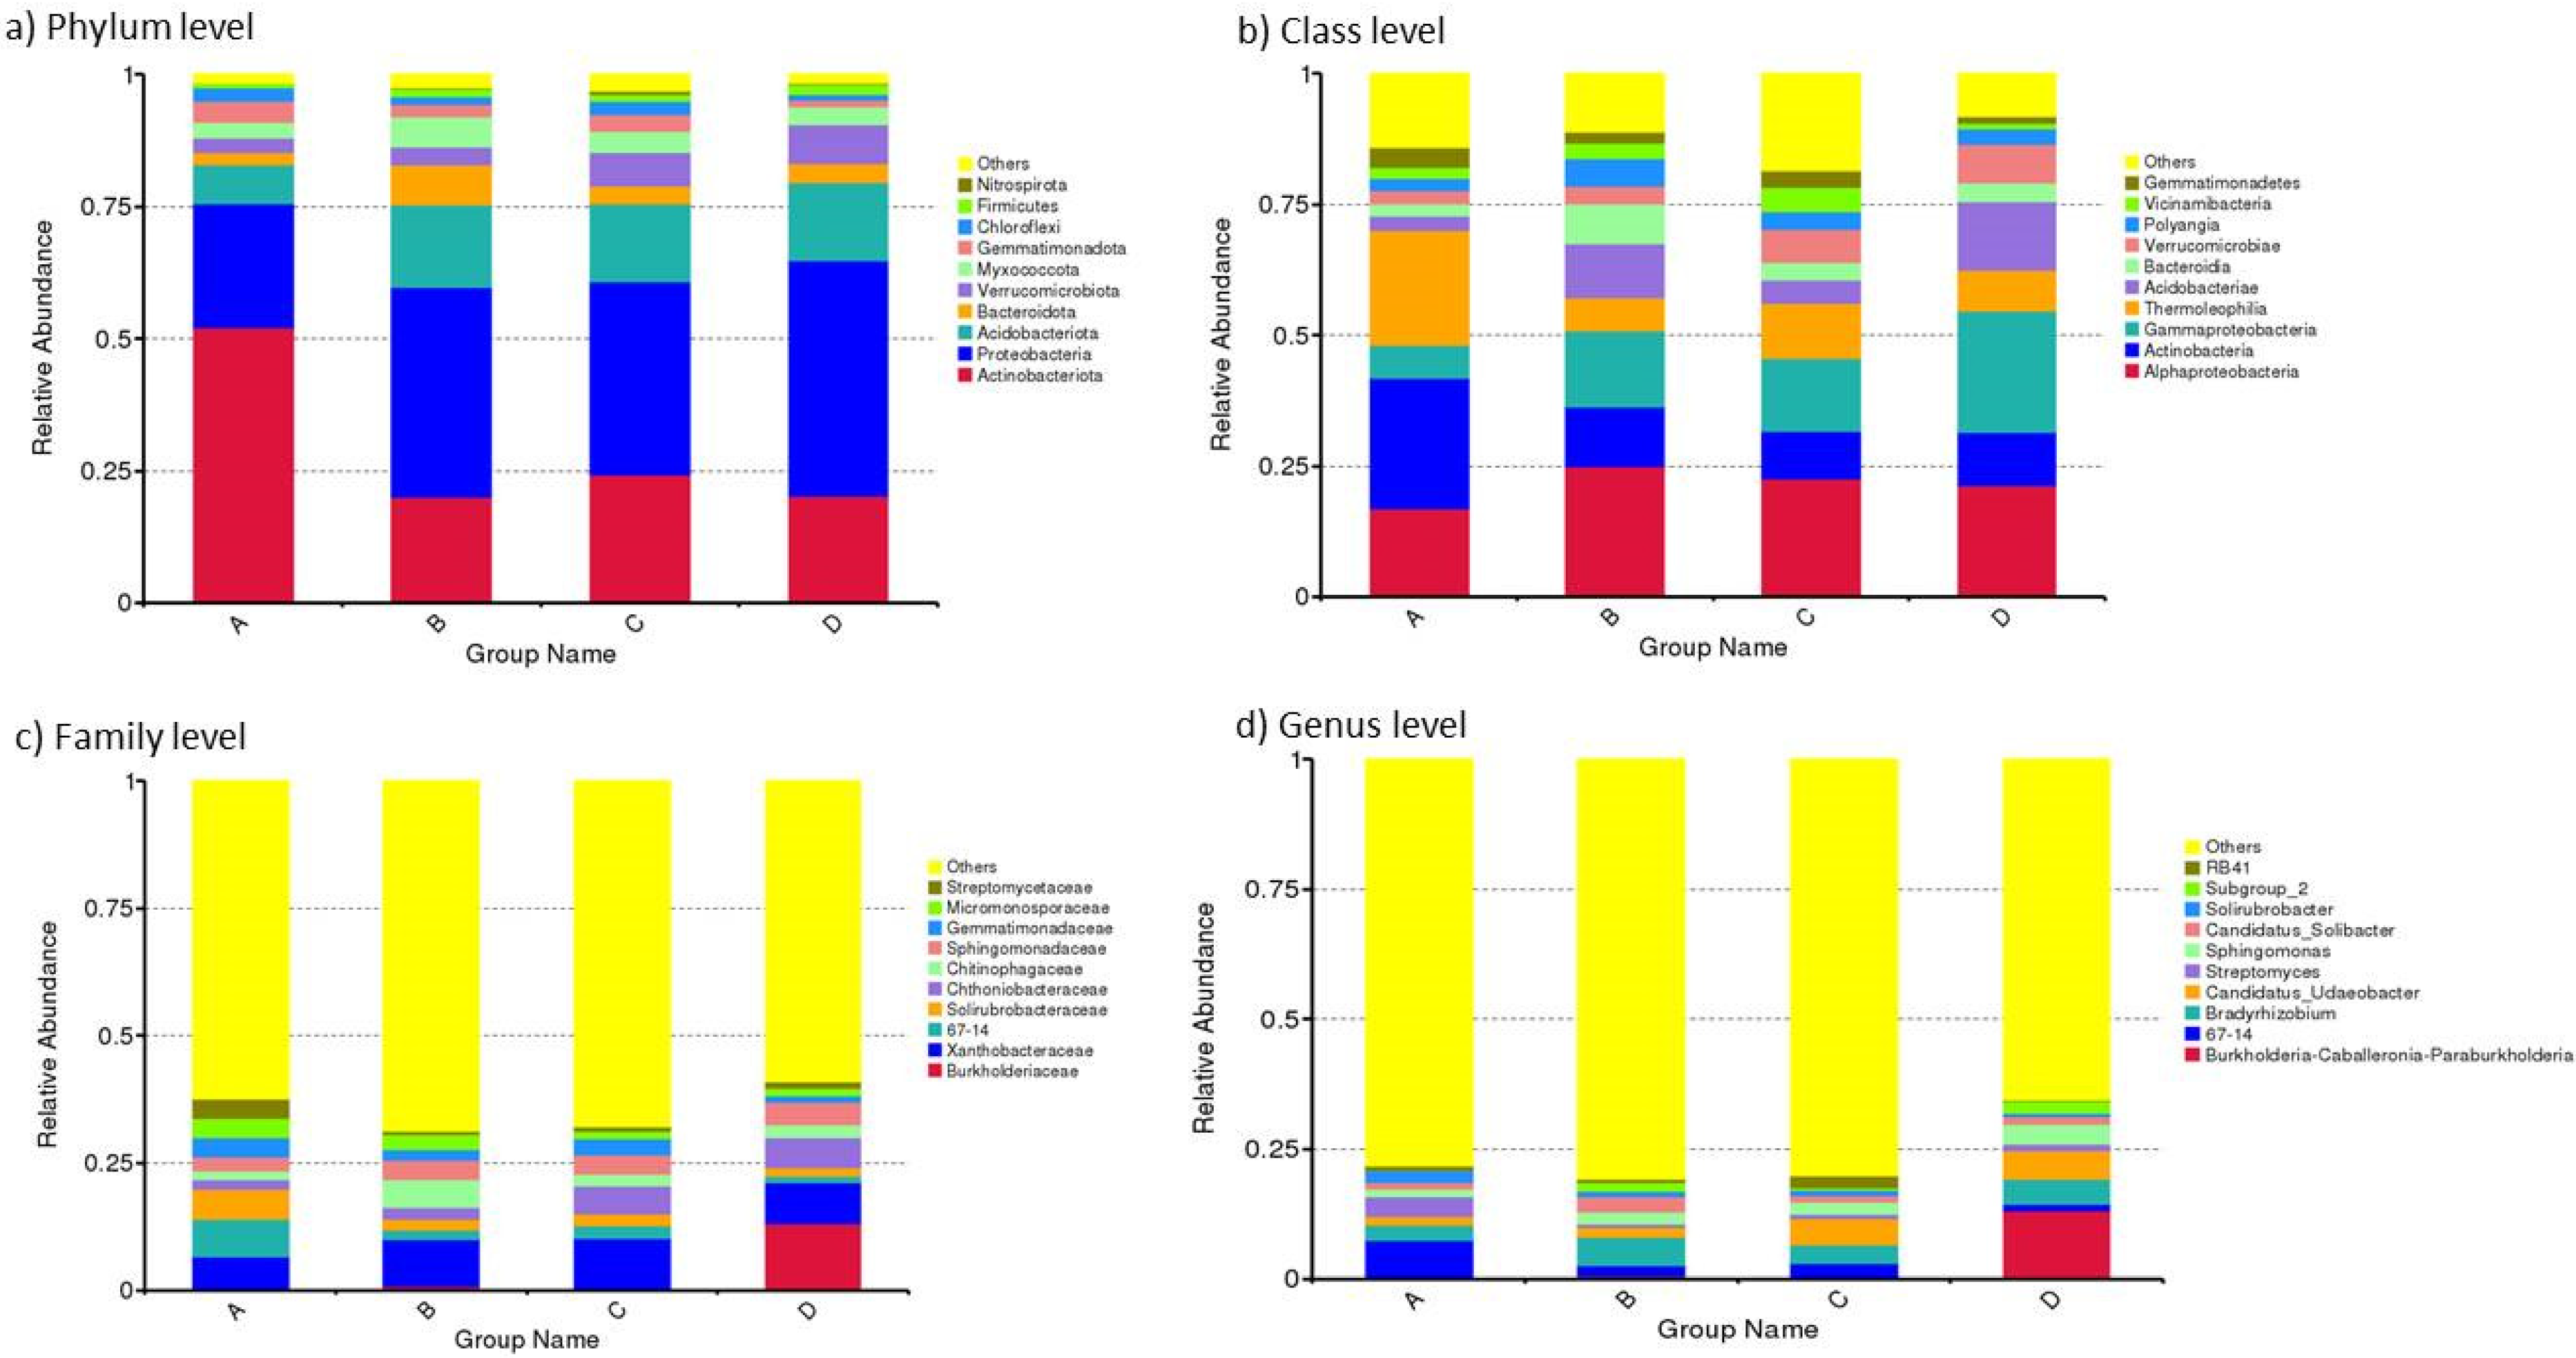
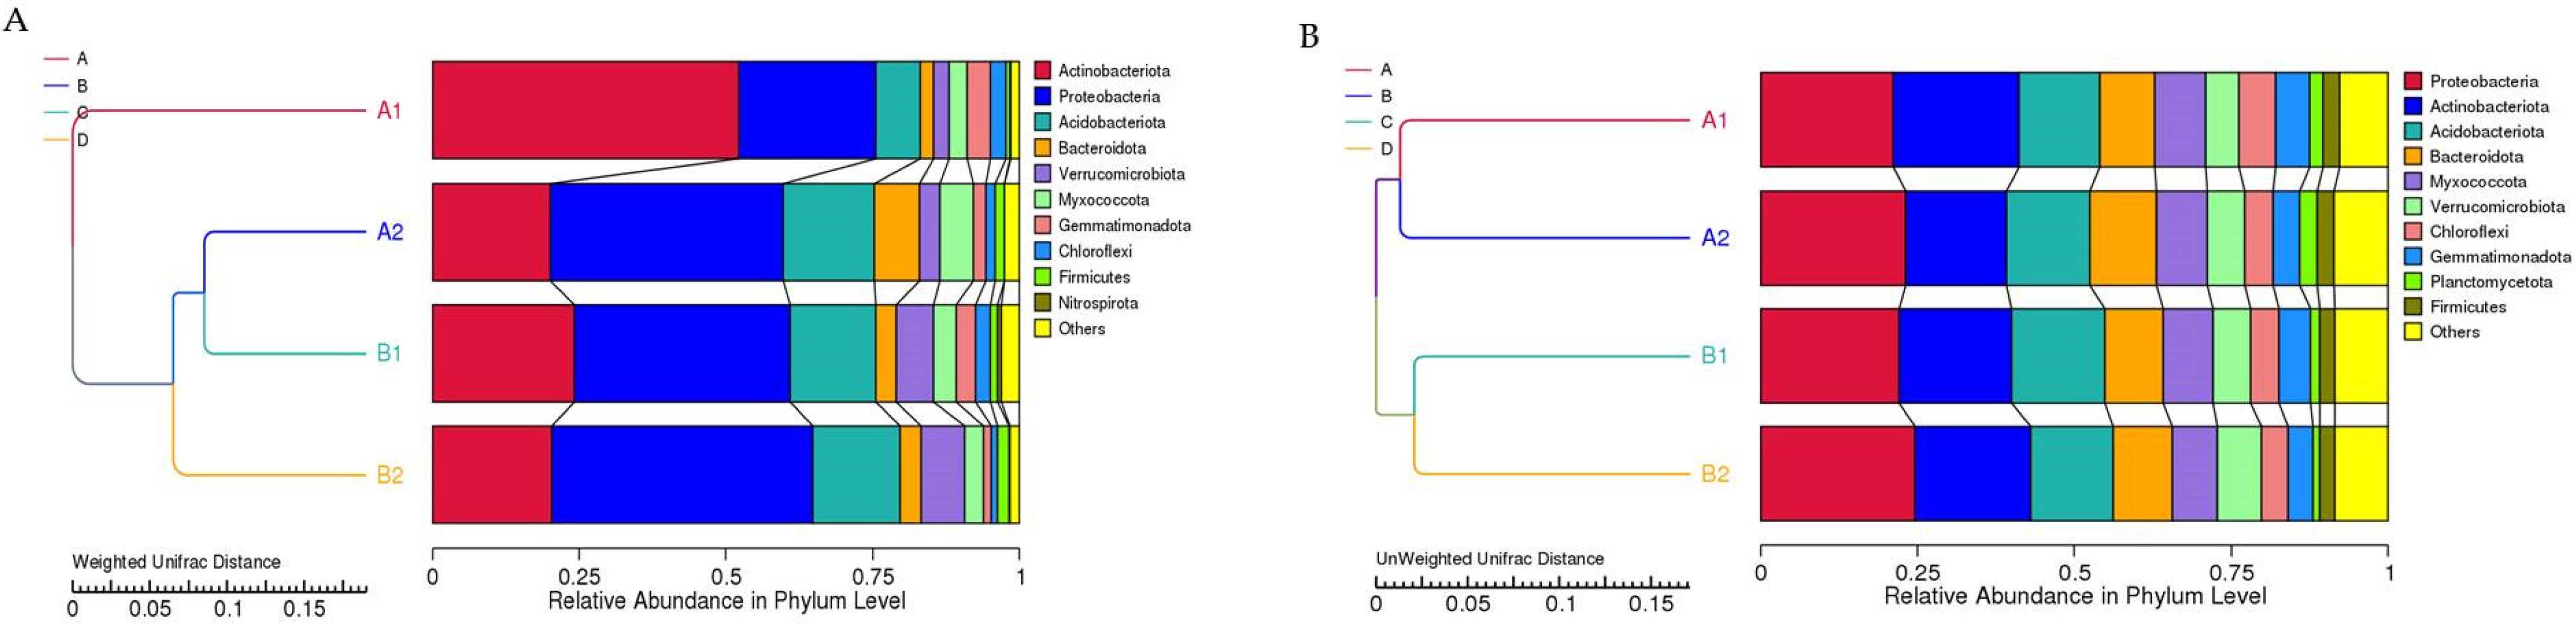
3.3.1. Relative Abundance
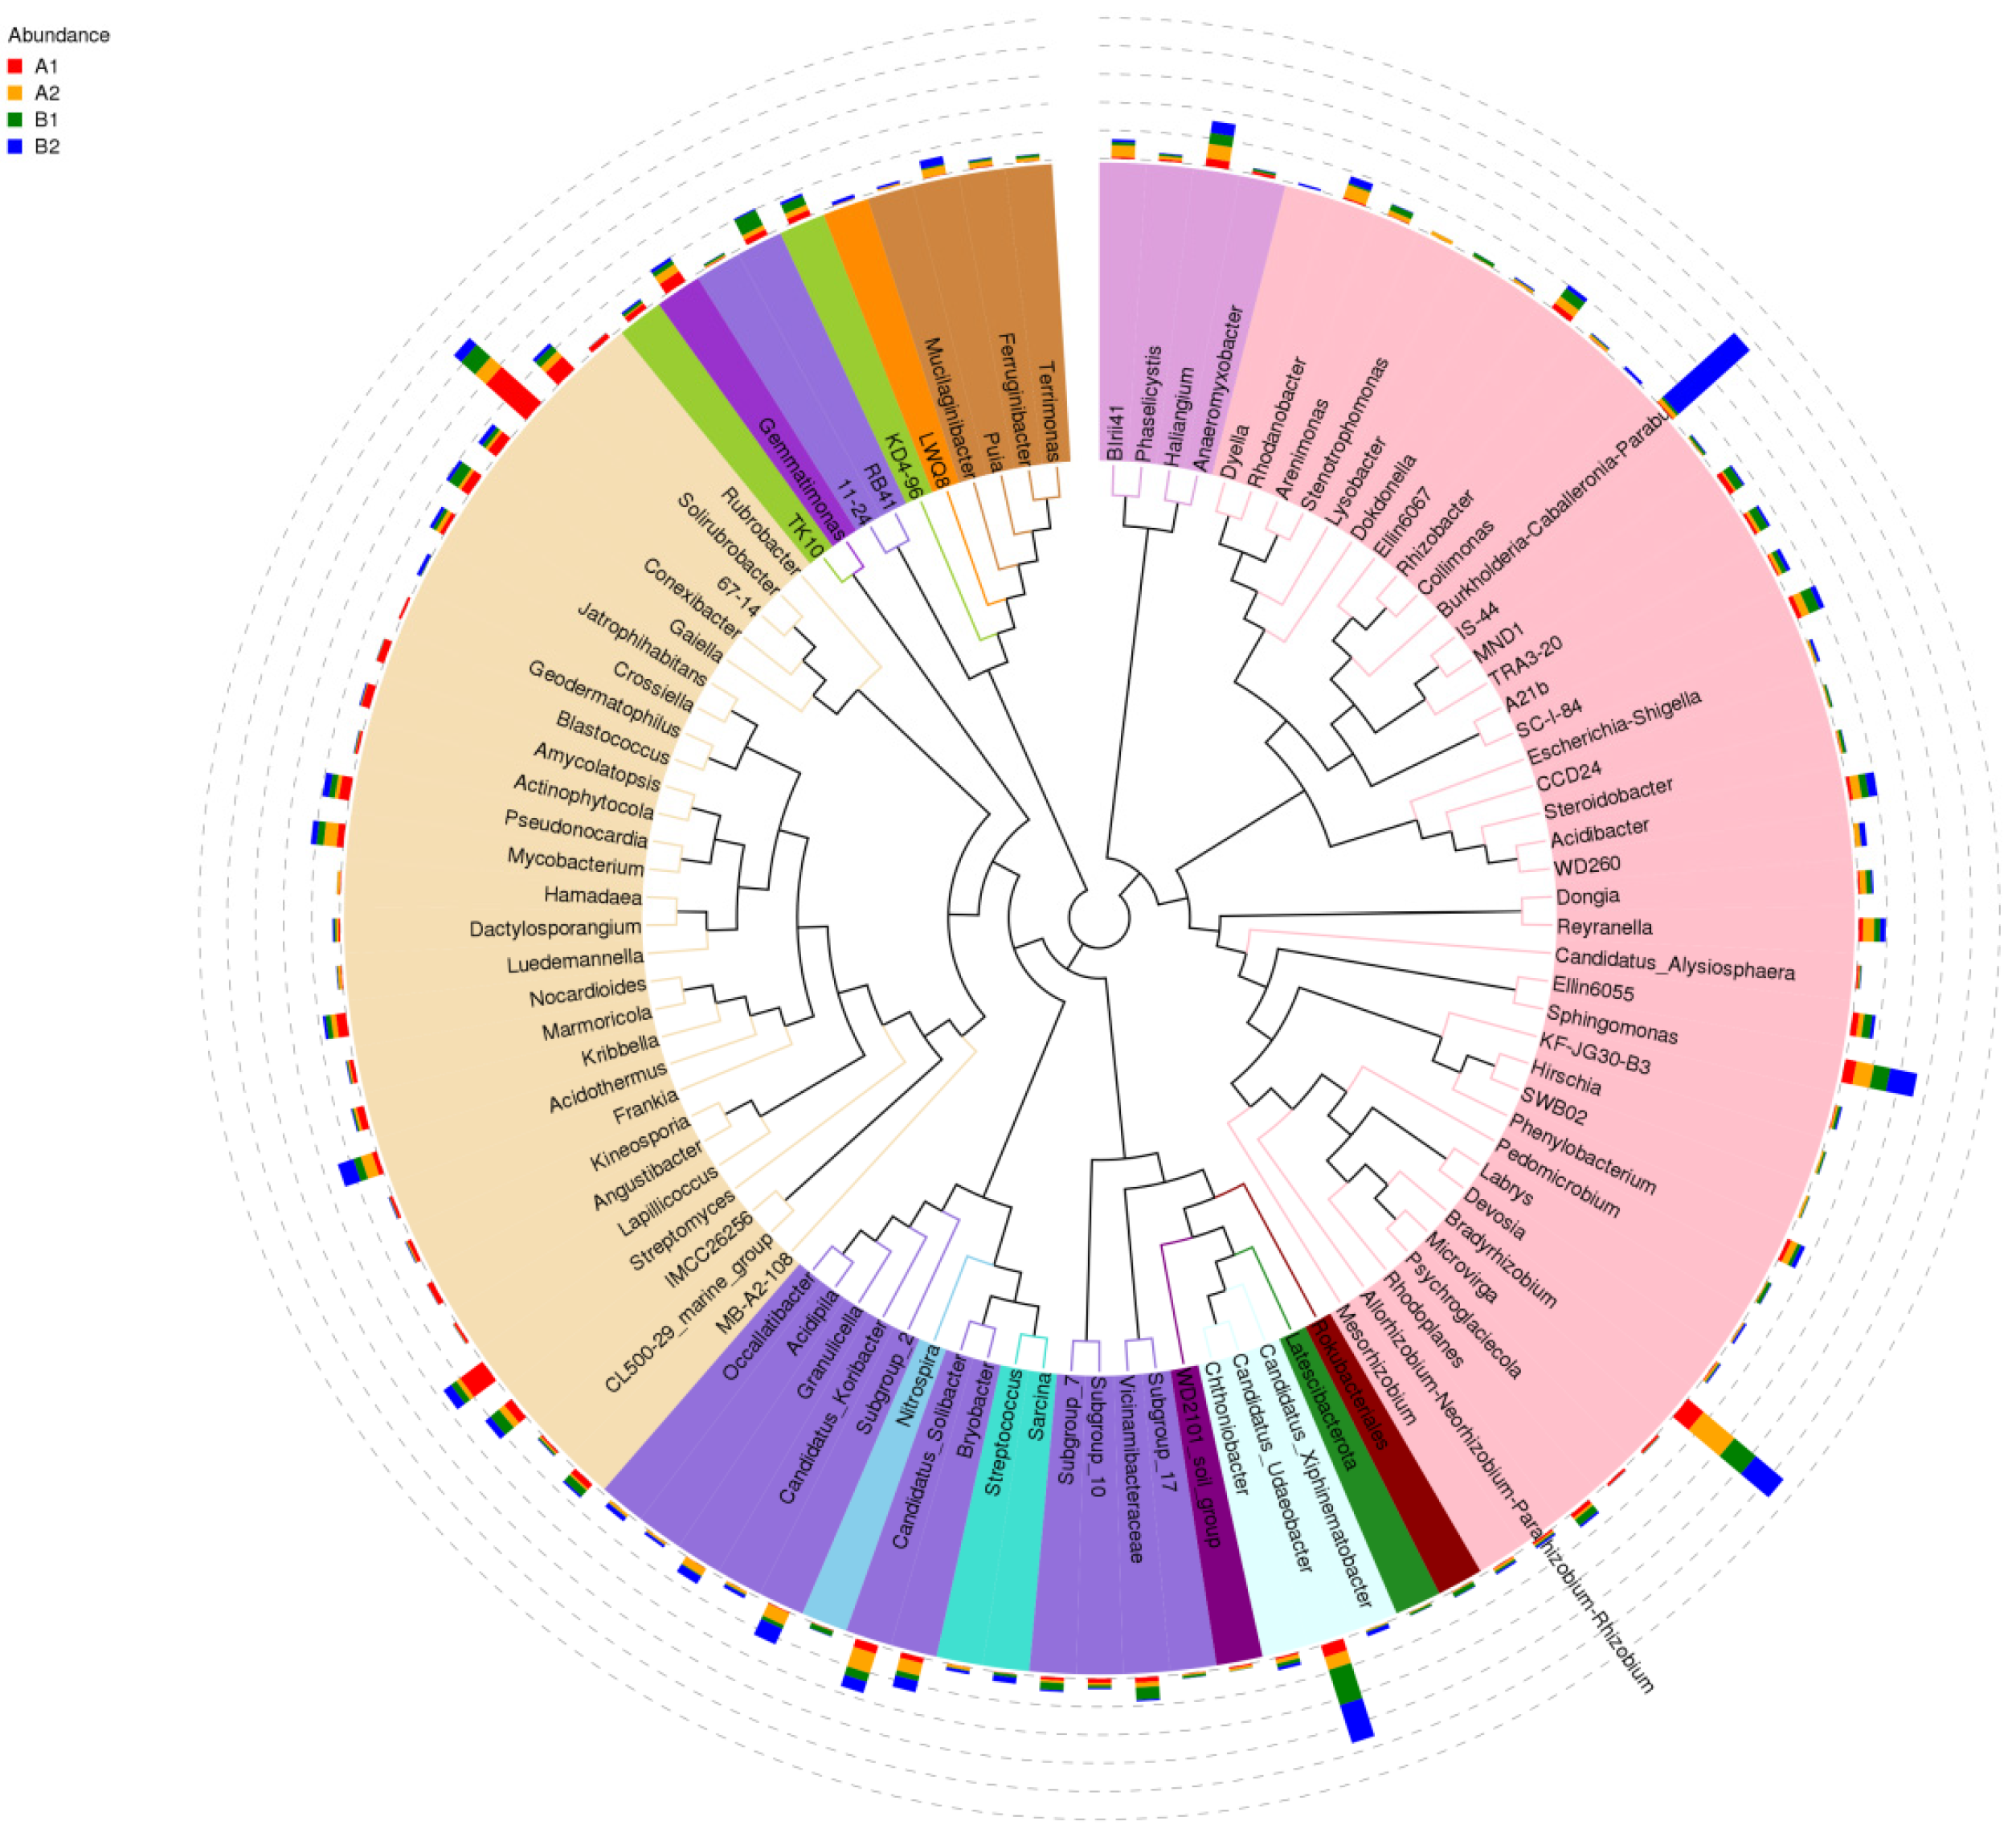
3.3.2. The Evolutionary Tree in Genus Level
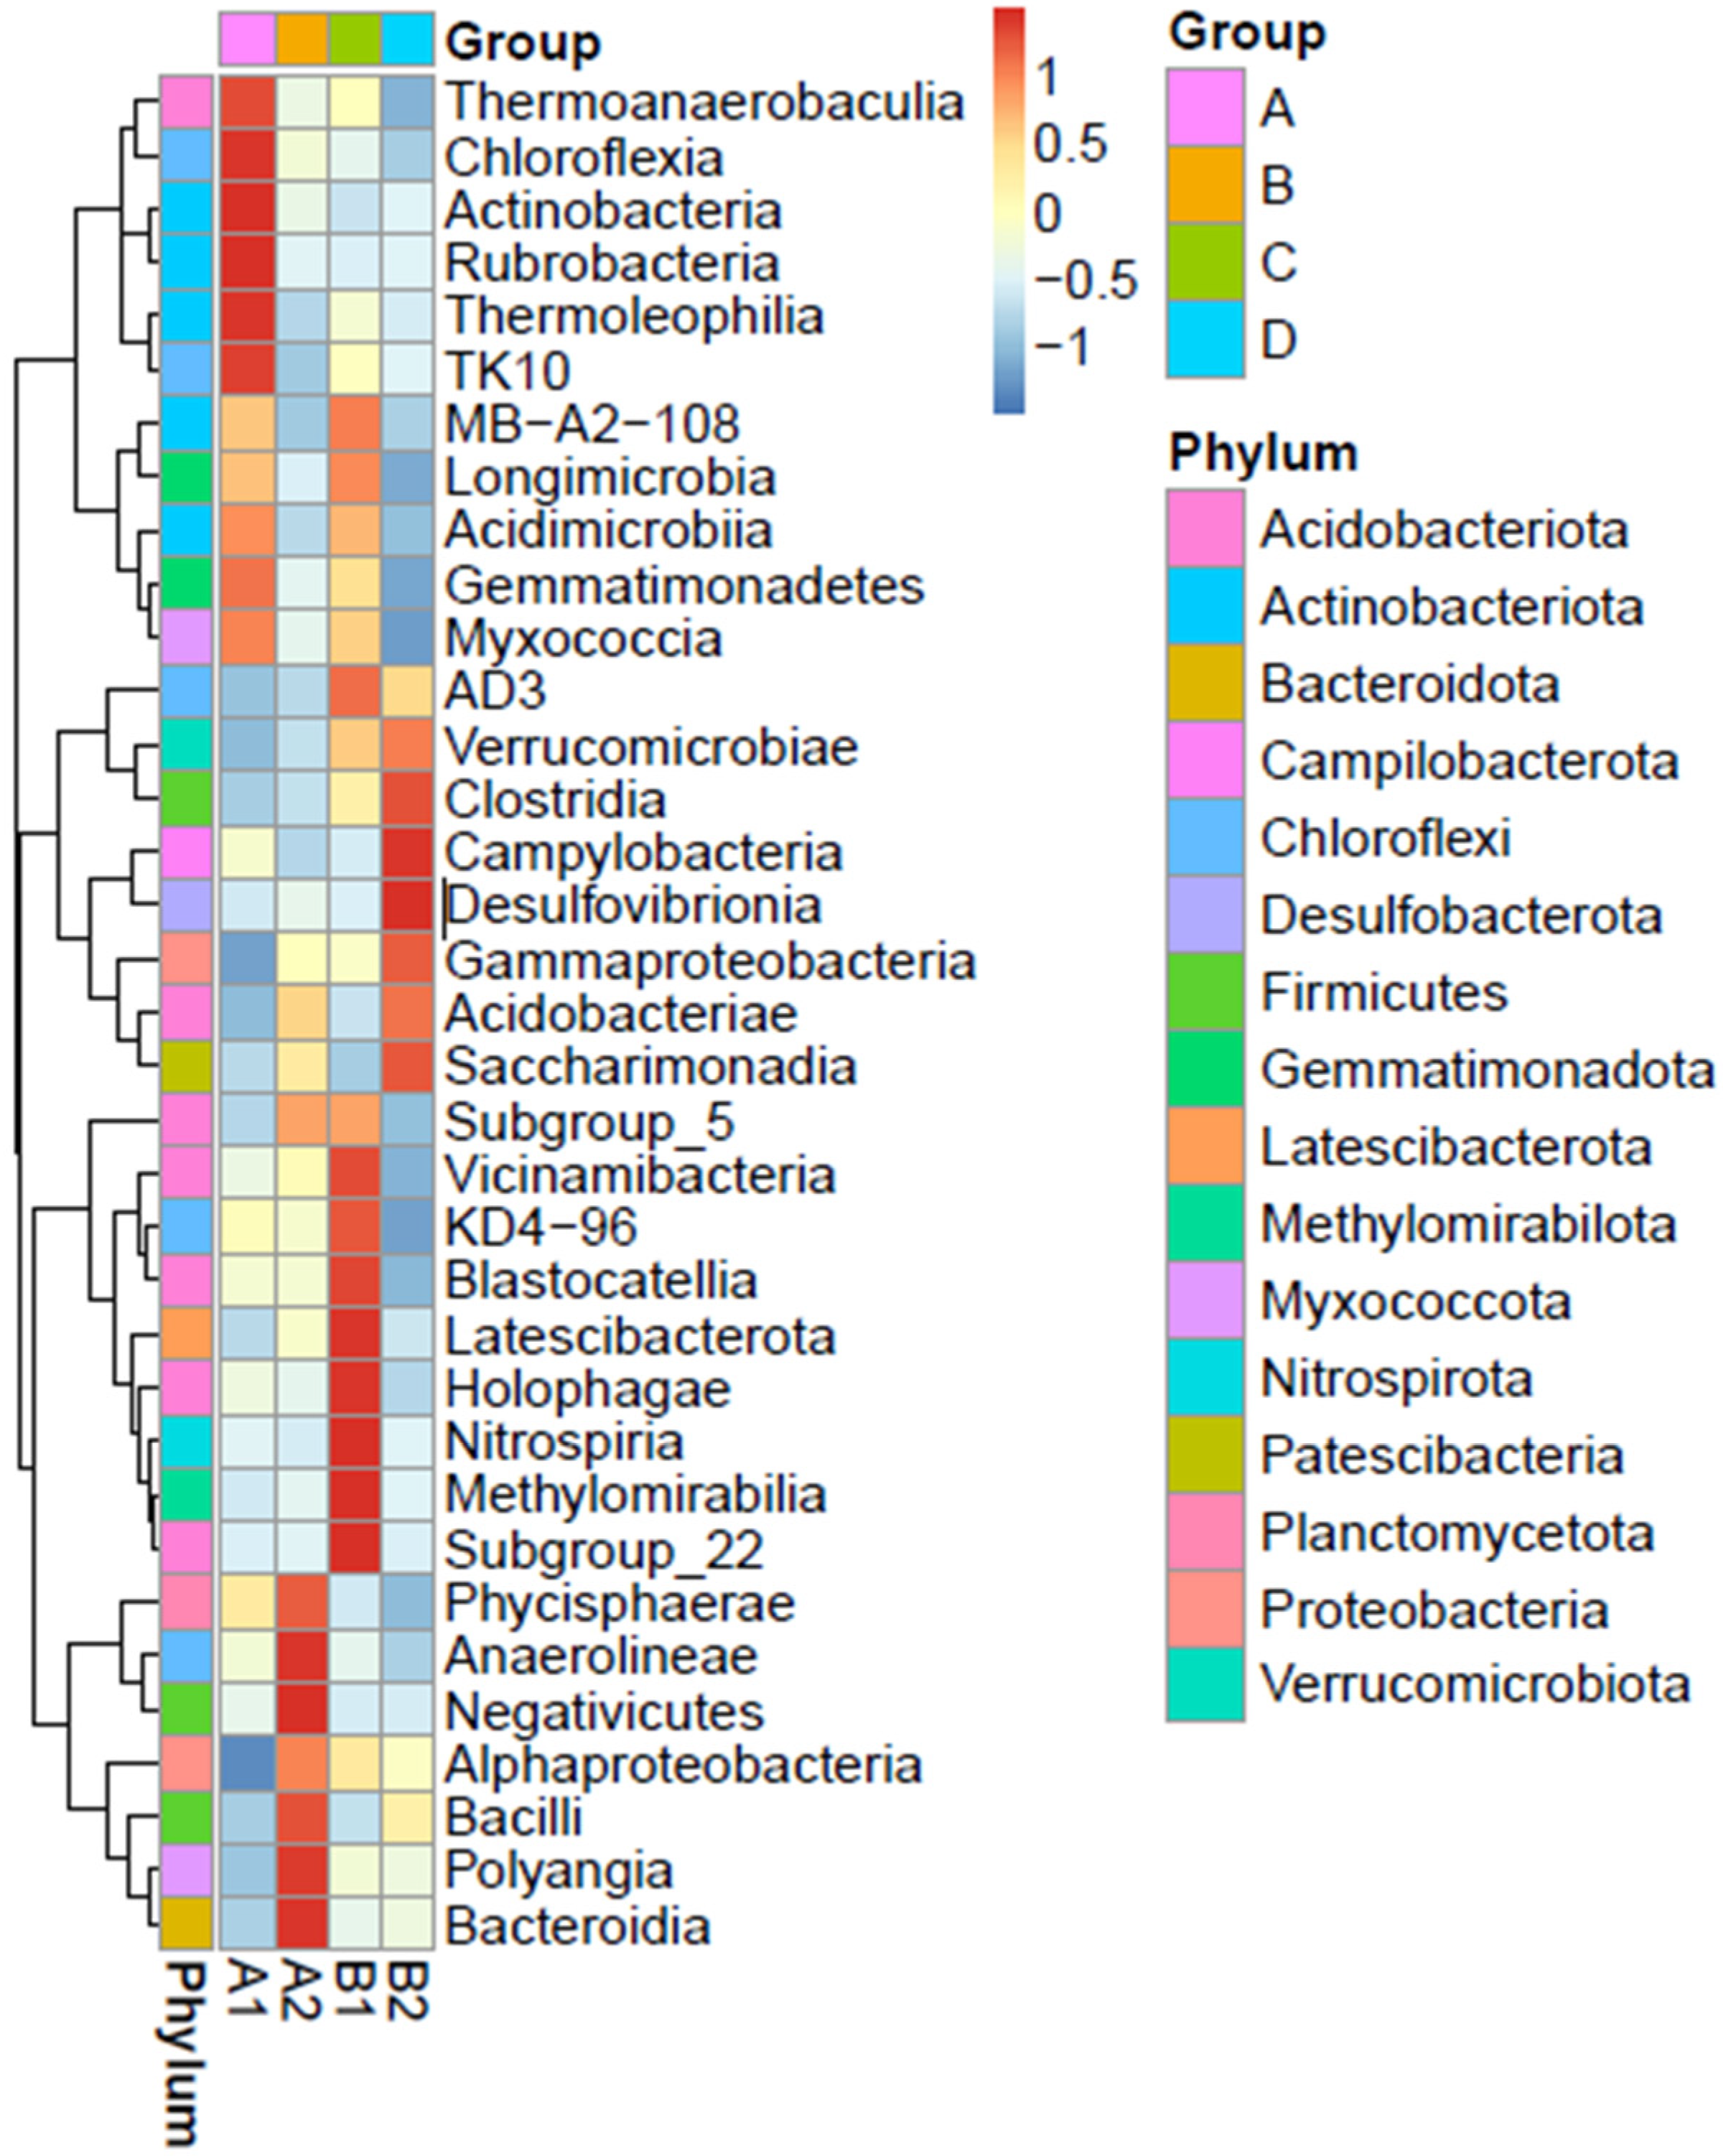
3.3.3. Taxonomic Abundance Cluster Heatmap
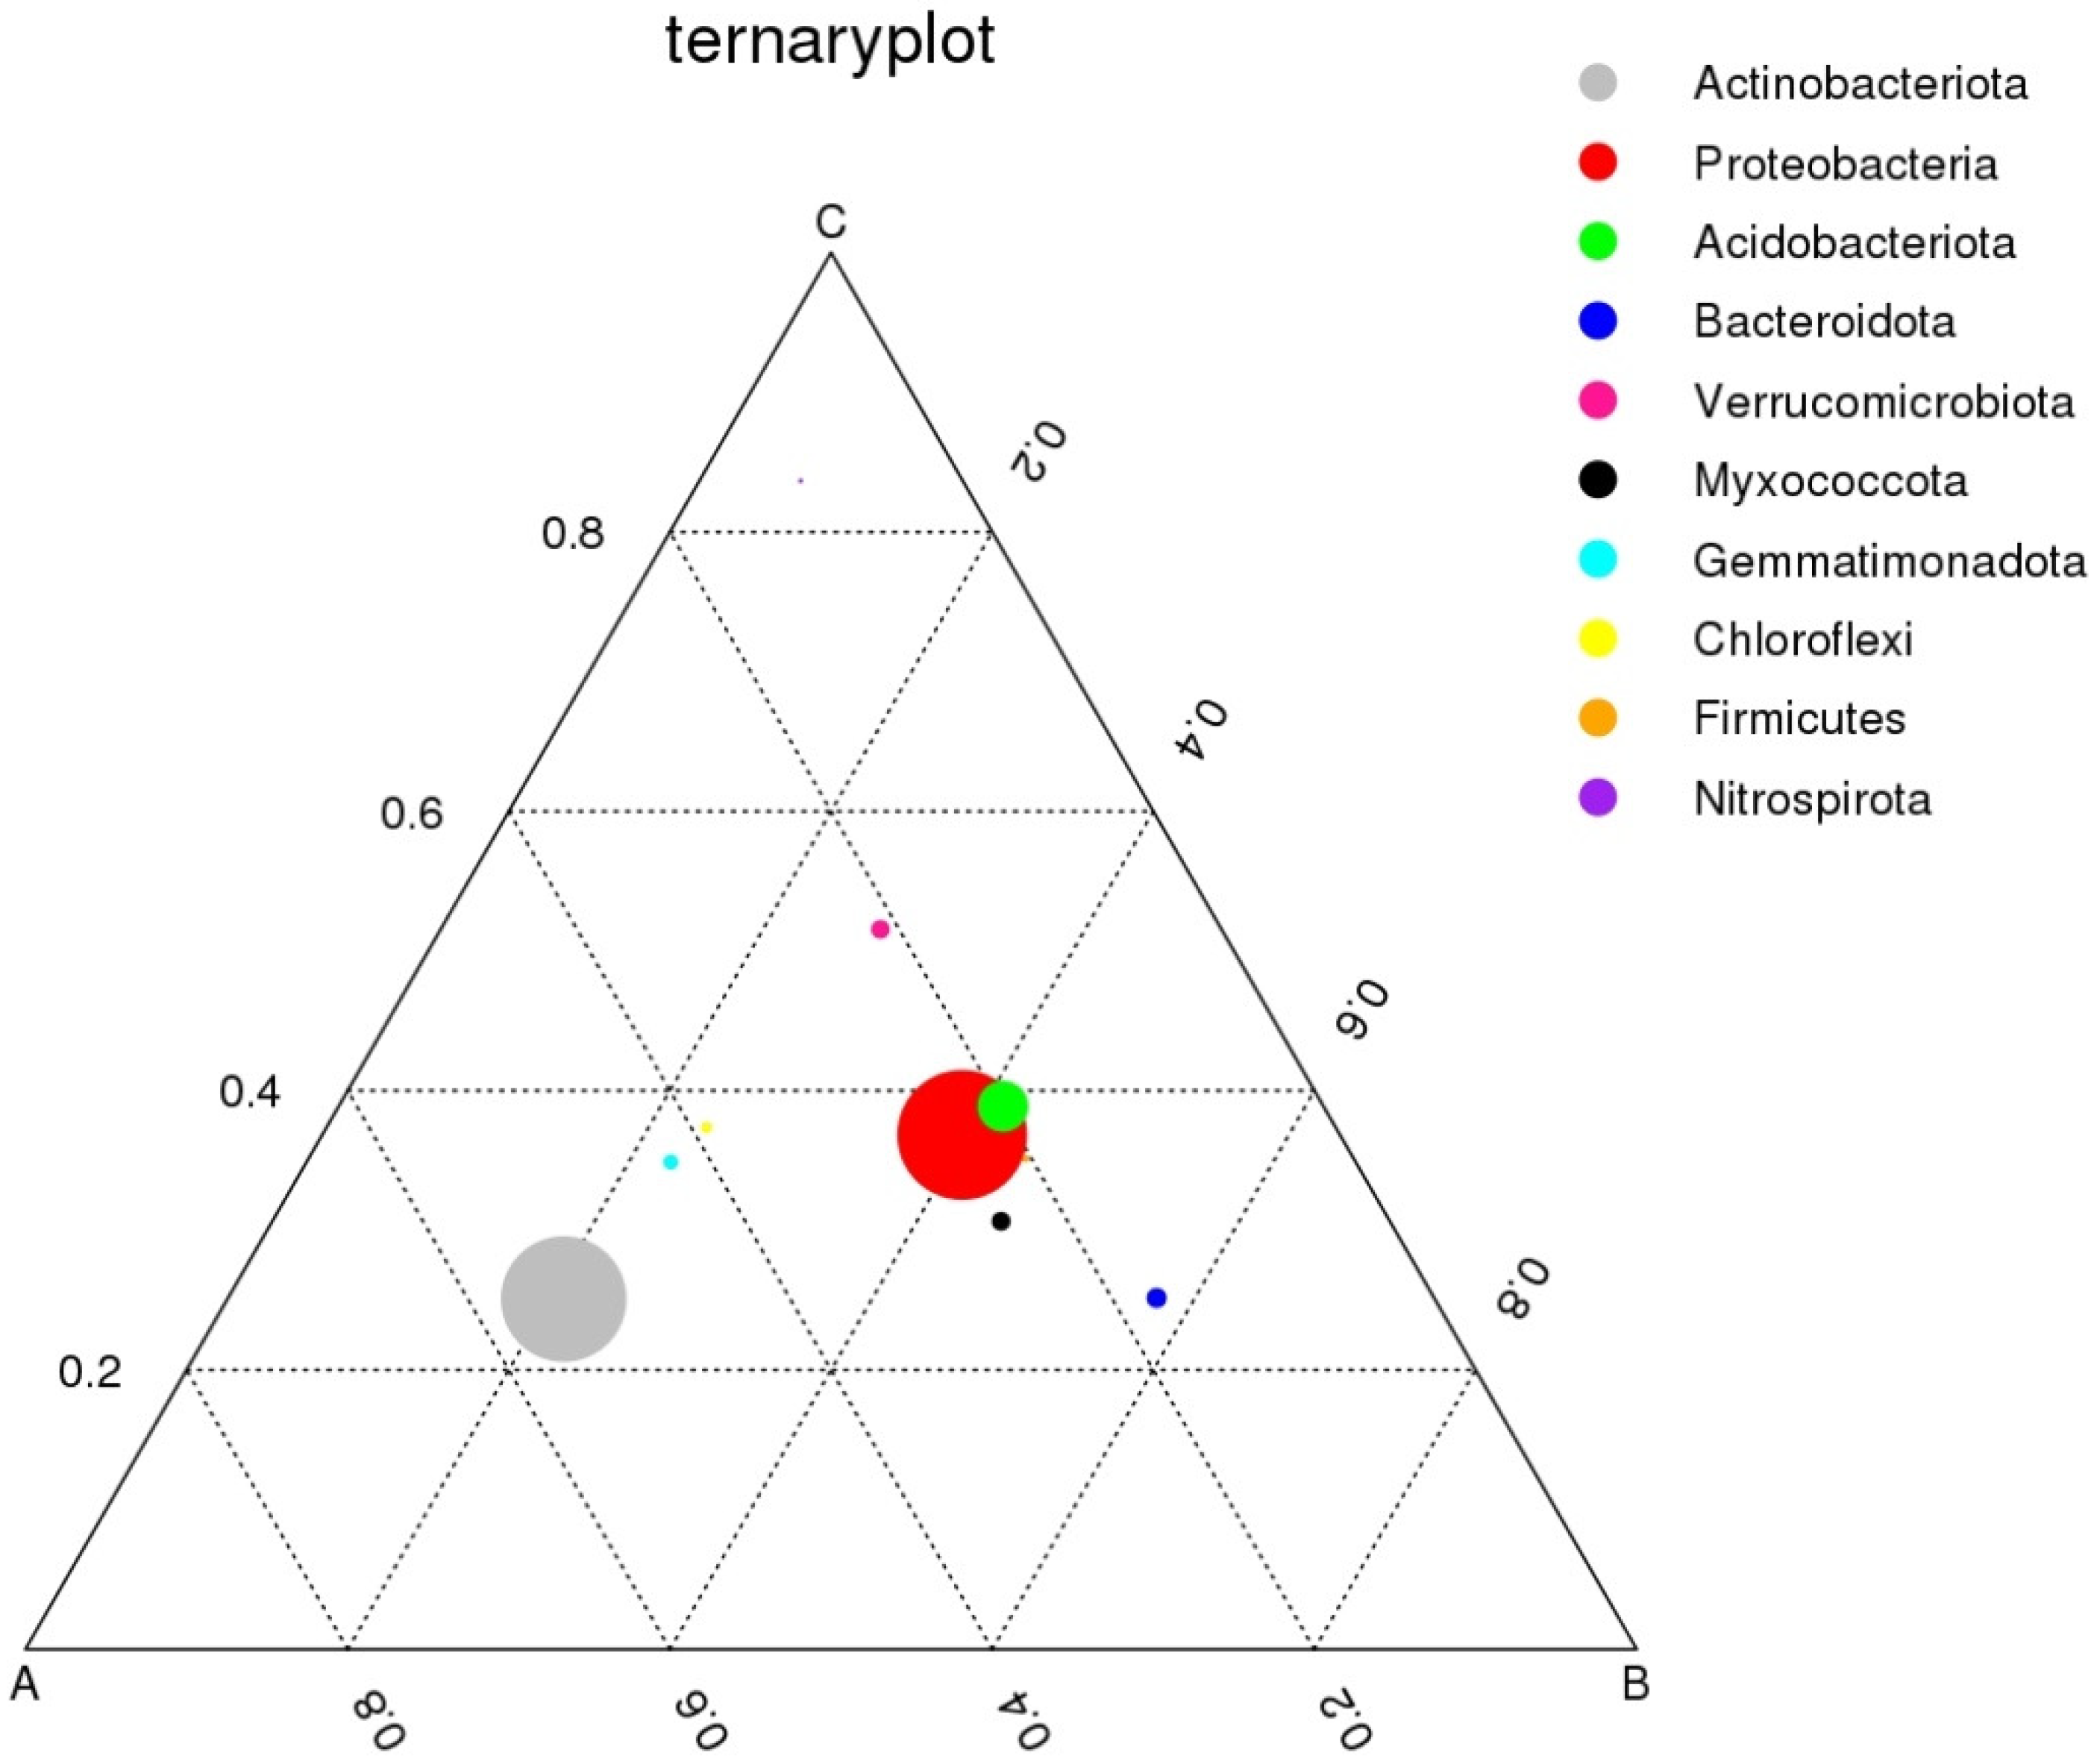
3.3.4. Ternary Plot
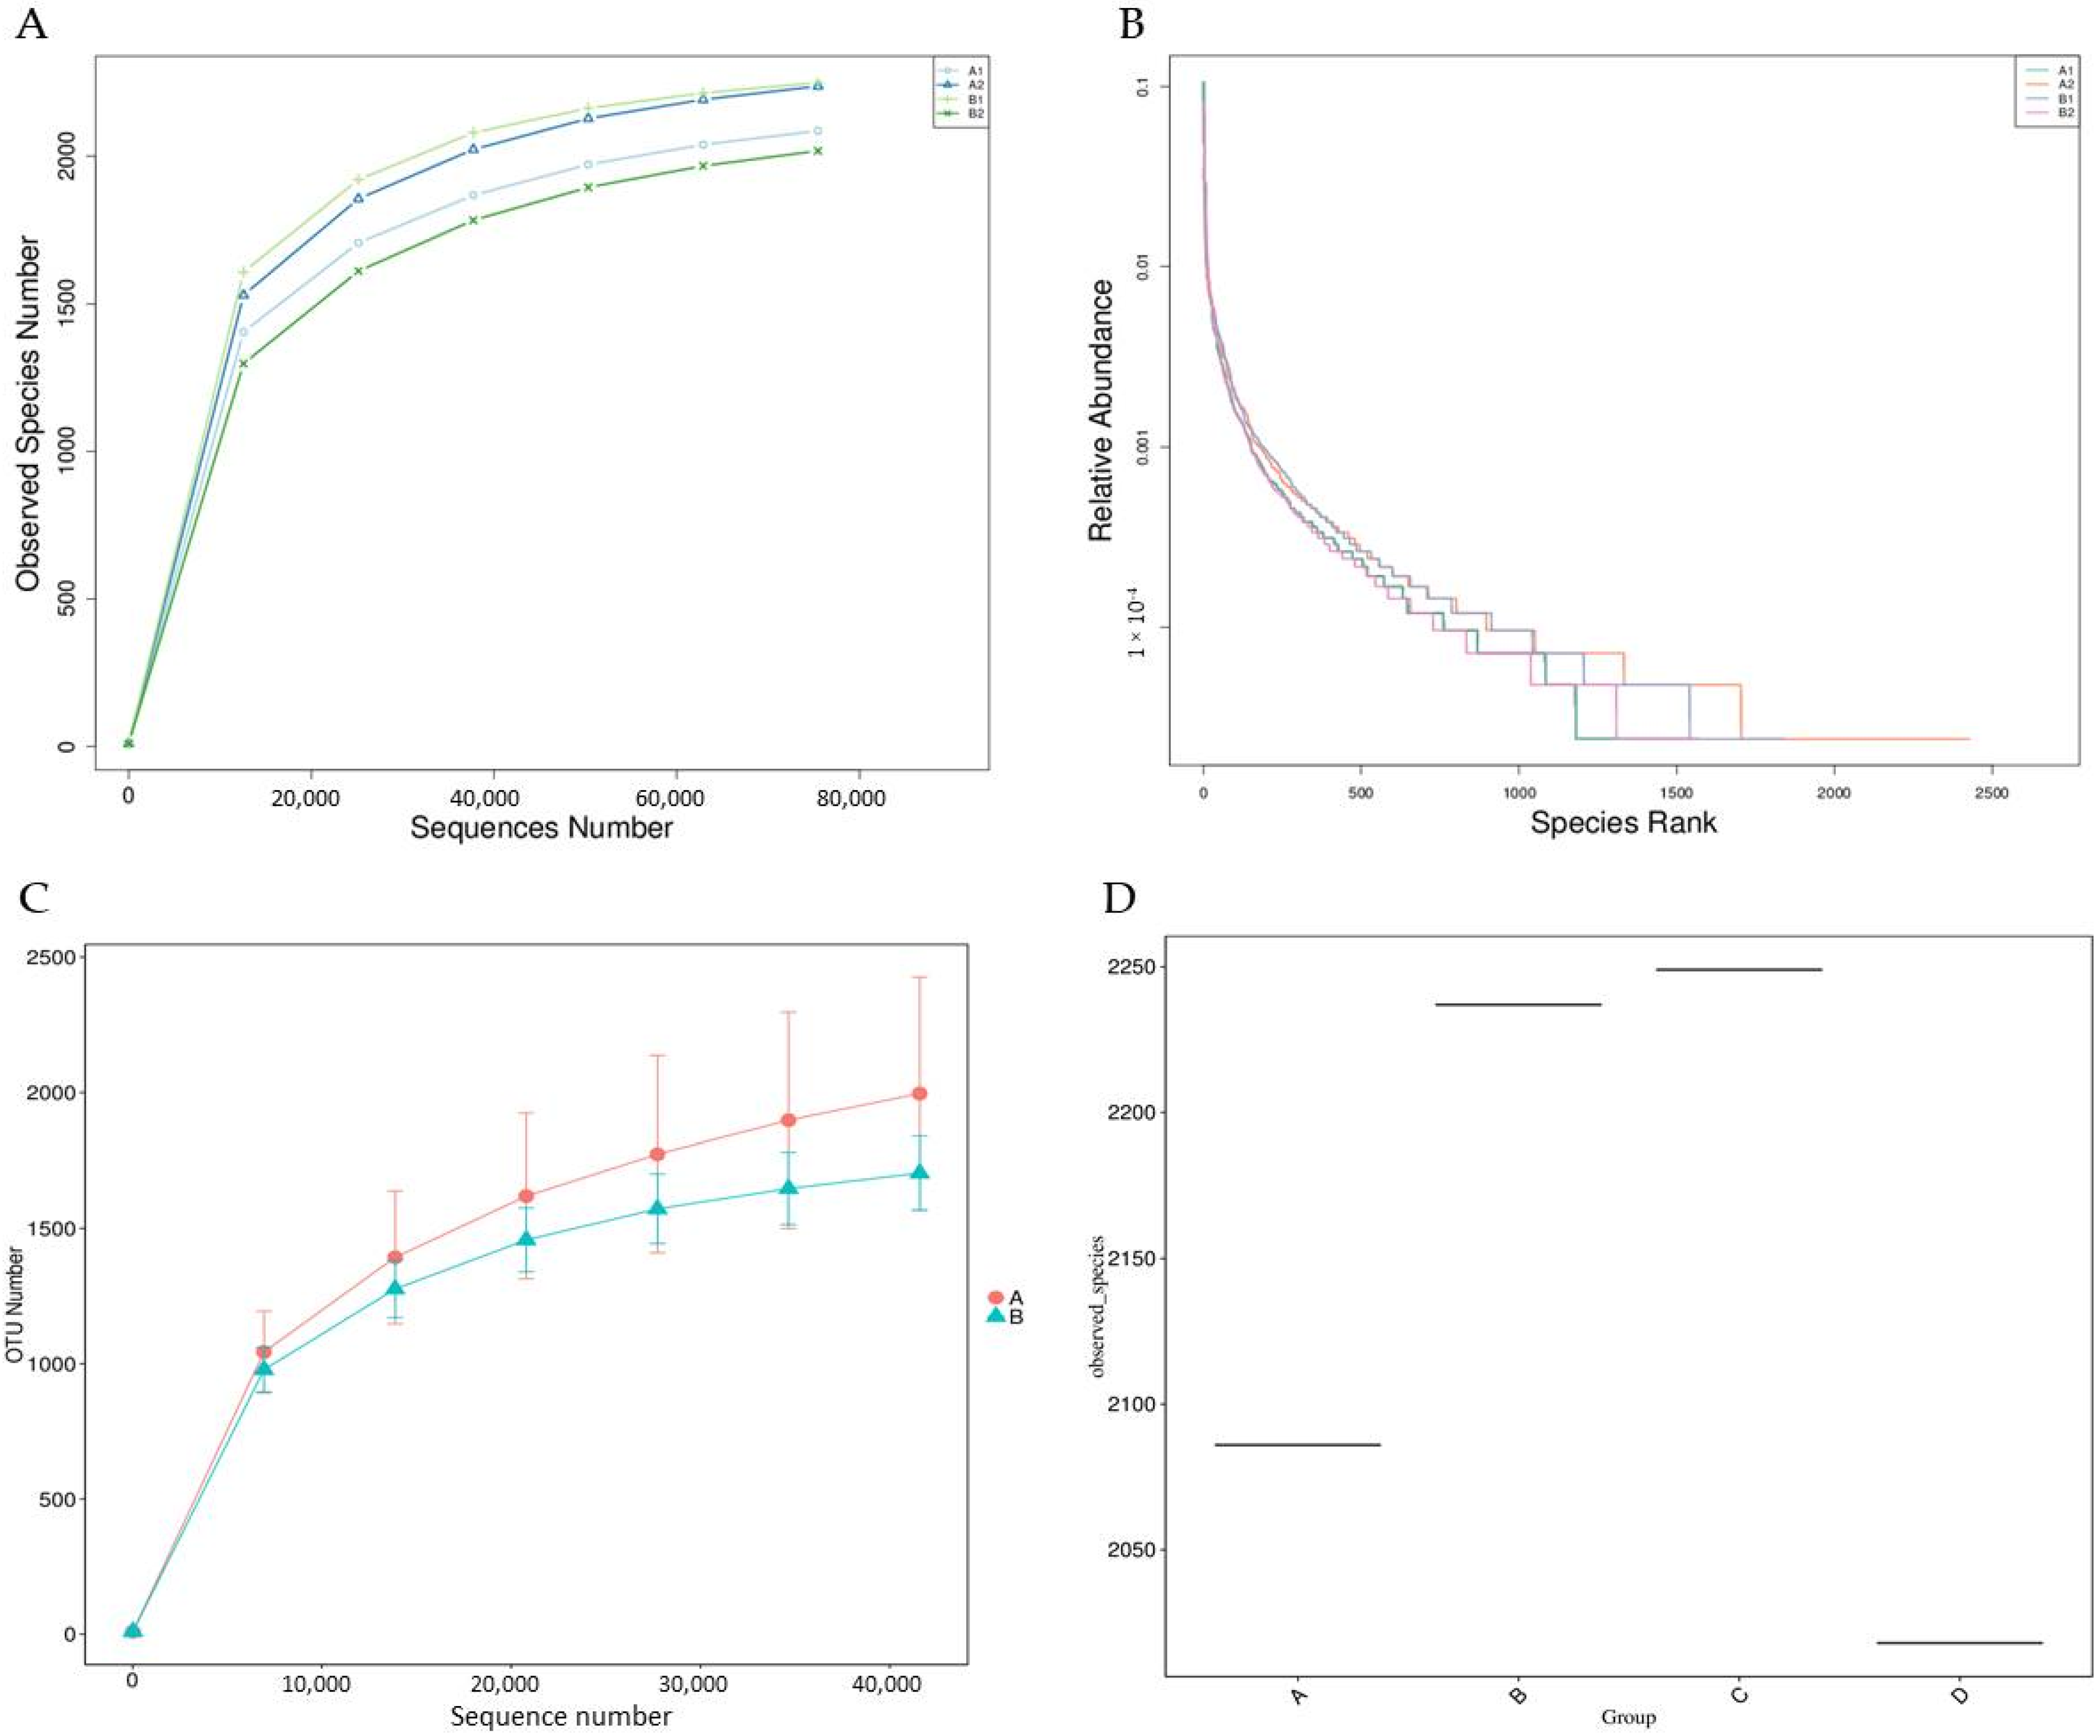
3.3.5. Biodiversity Curves
3.4. Alpha Diversity Analysis
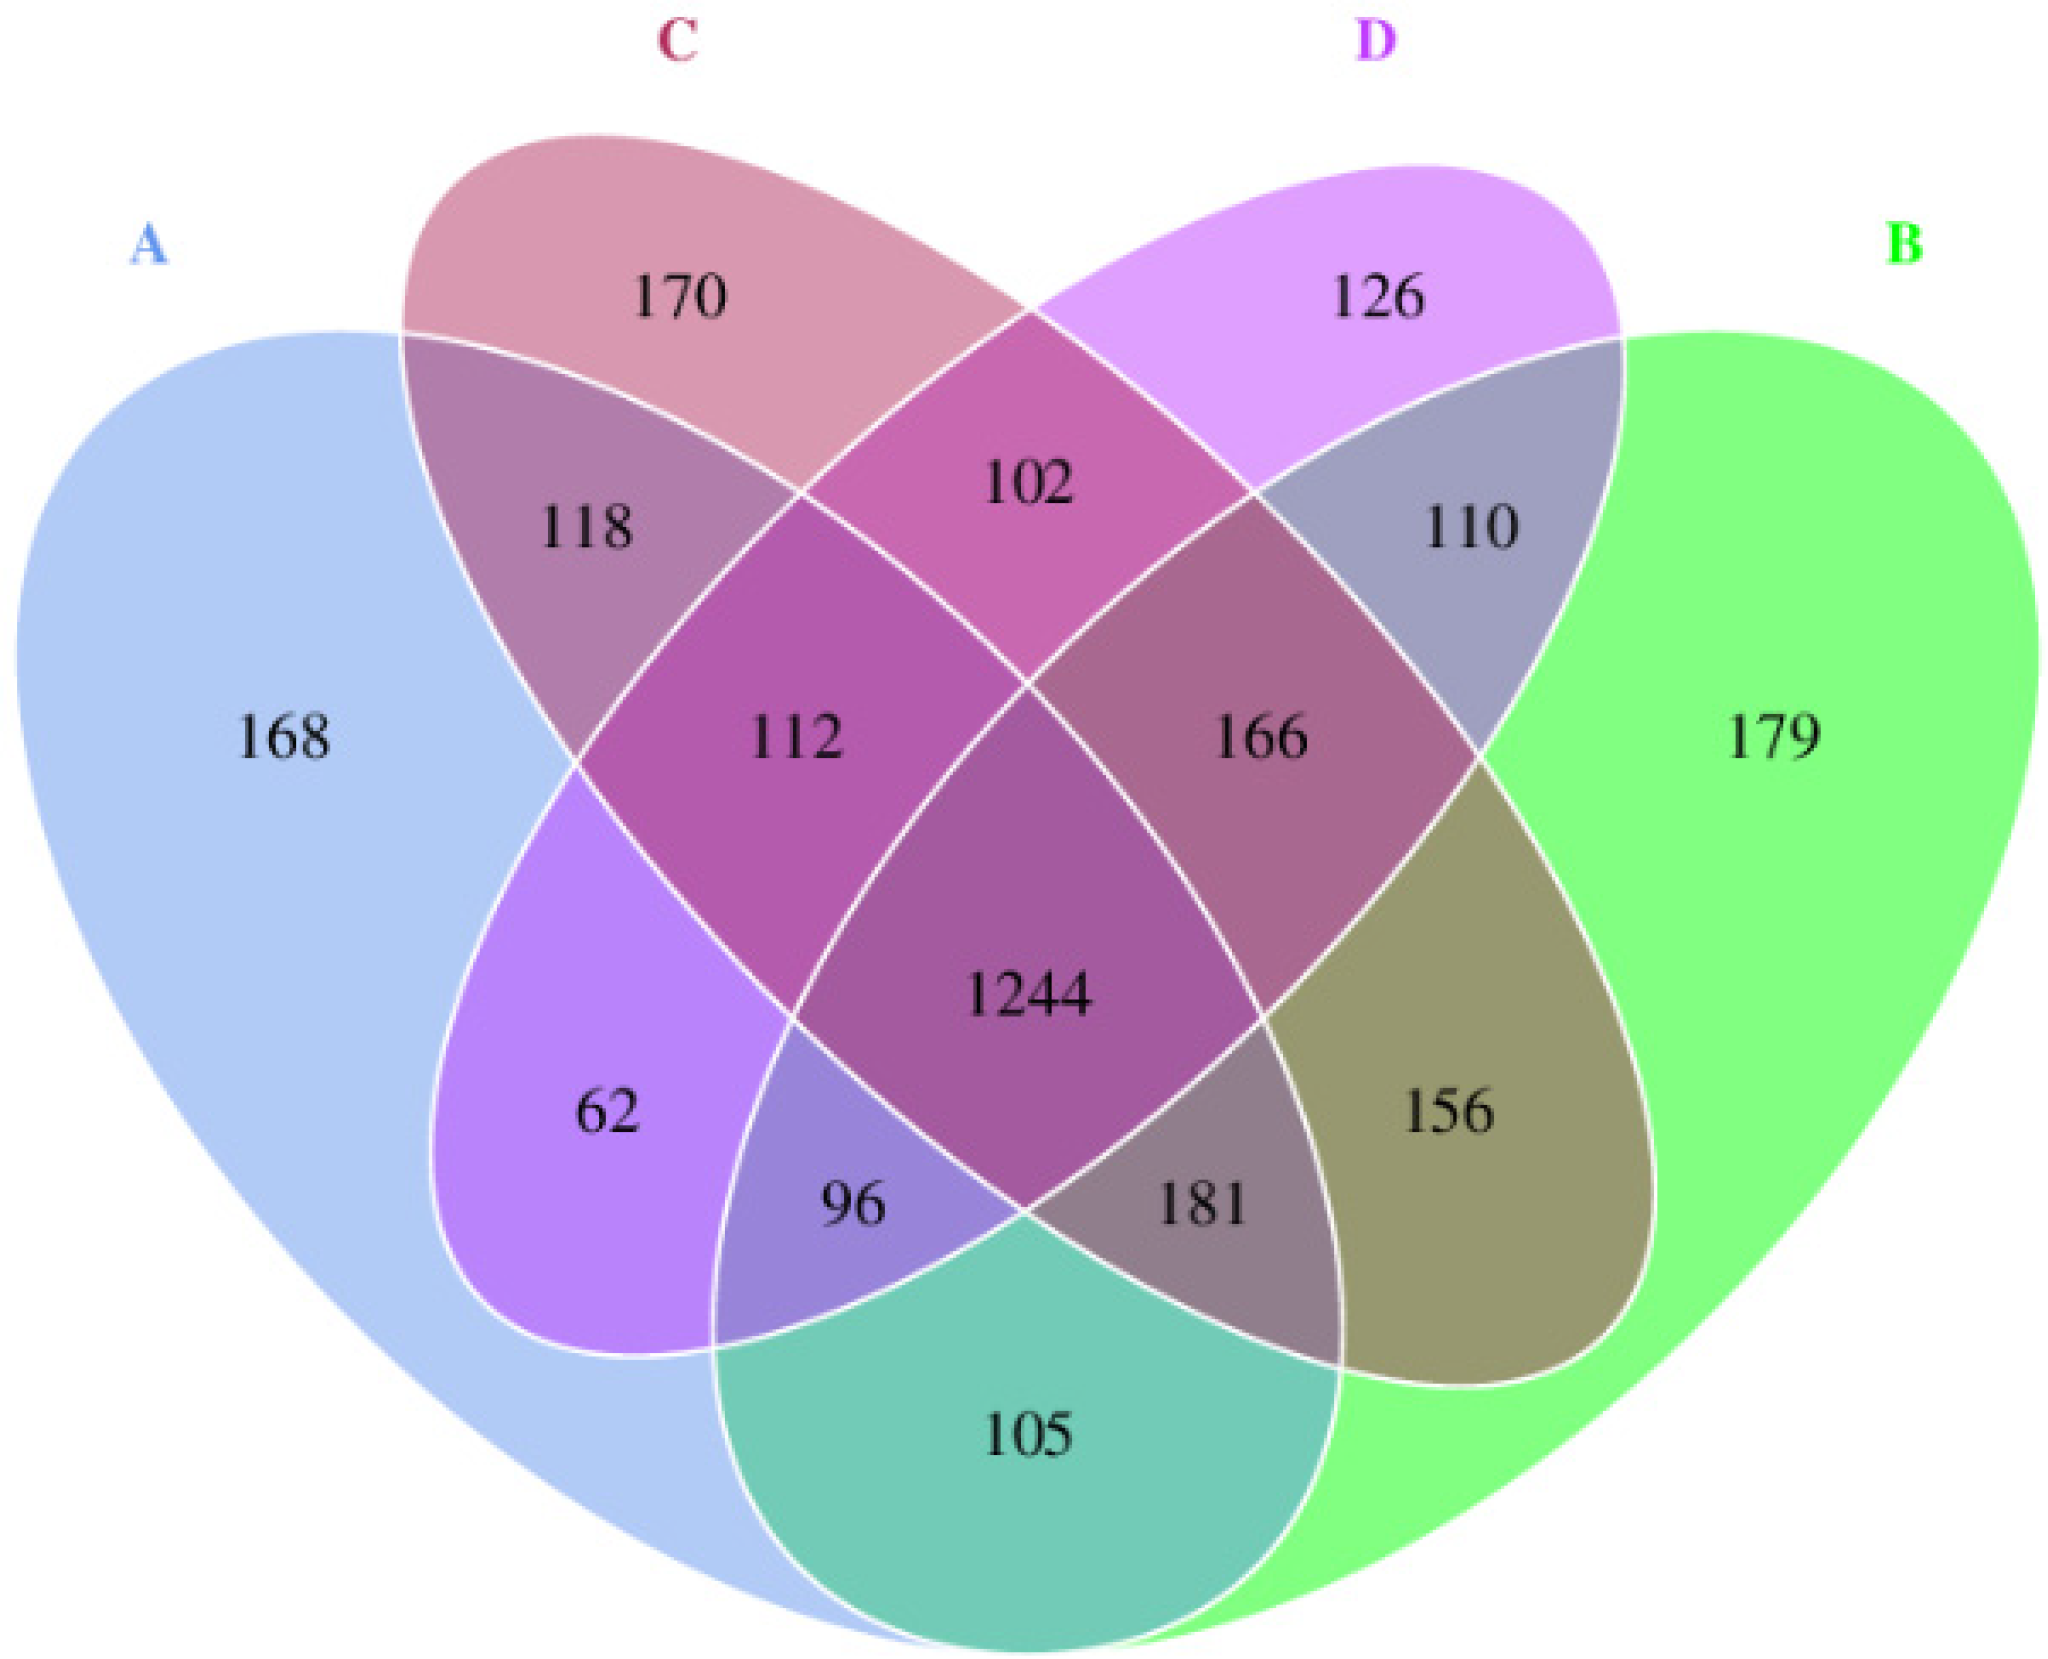
3.5. Venn Diagram
3.6. Beta Diversity Analysis
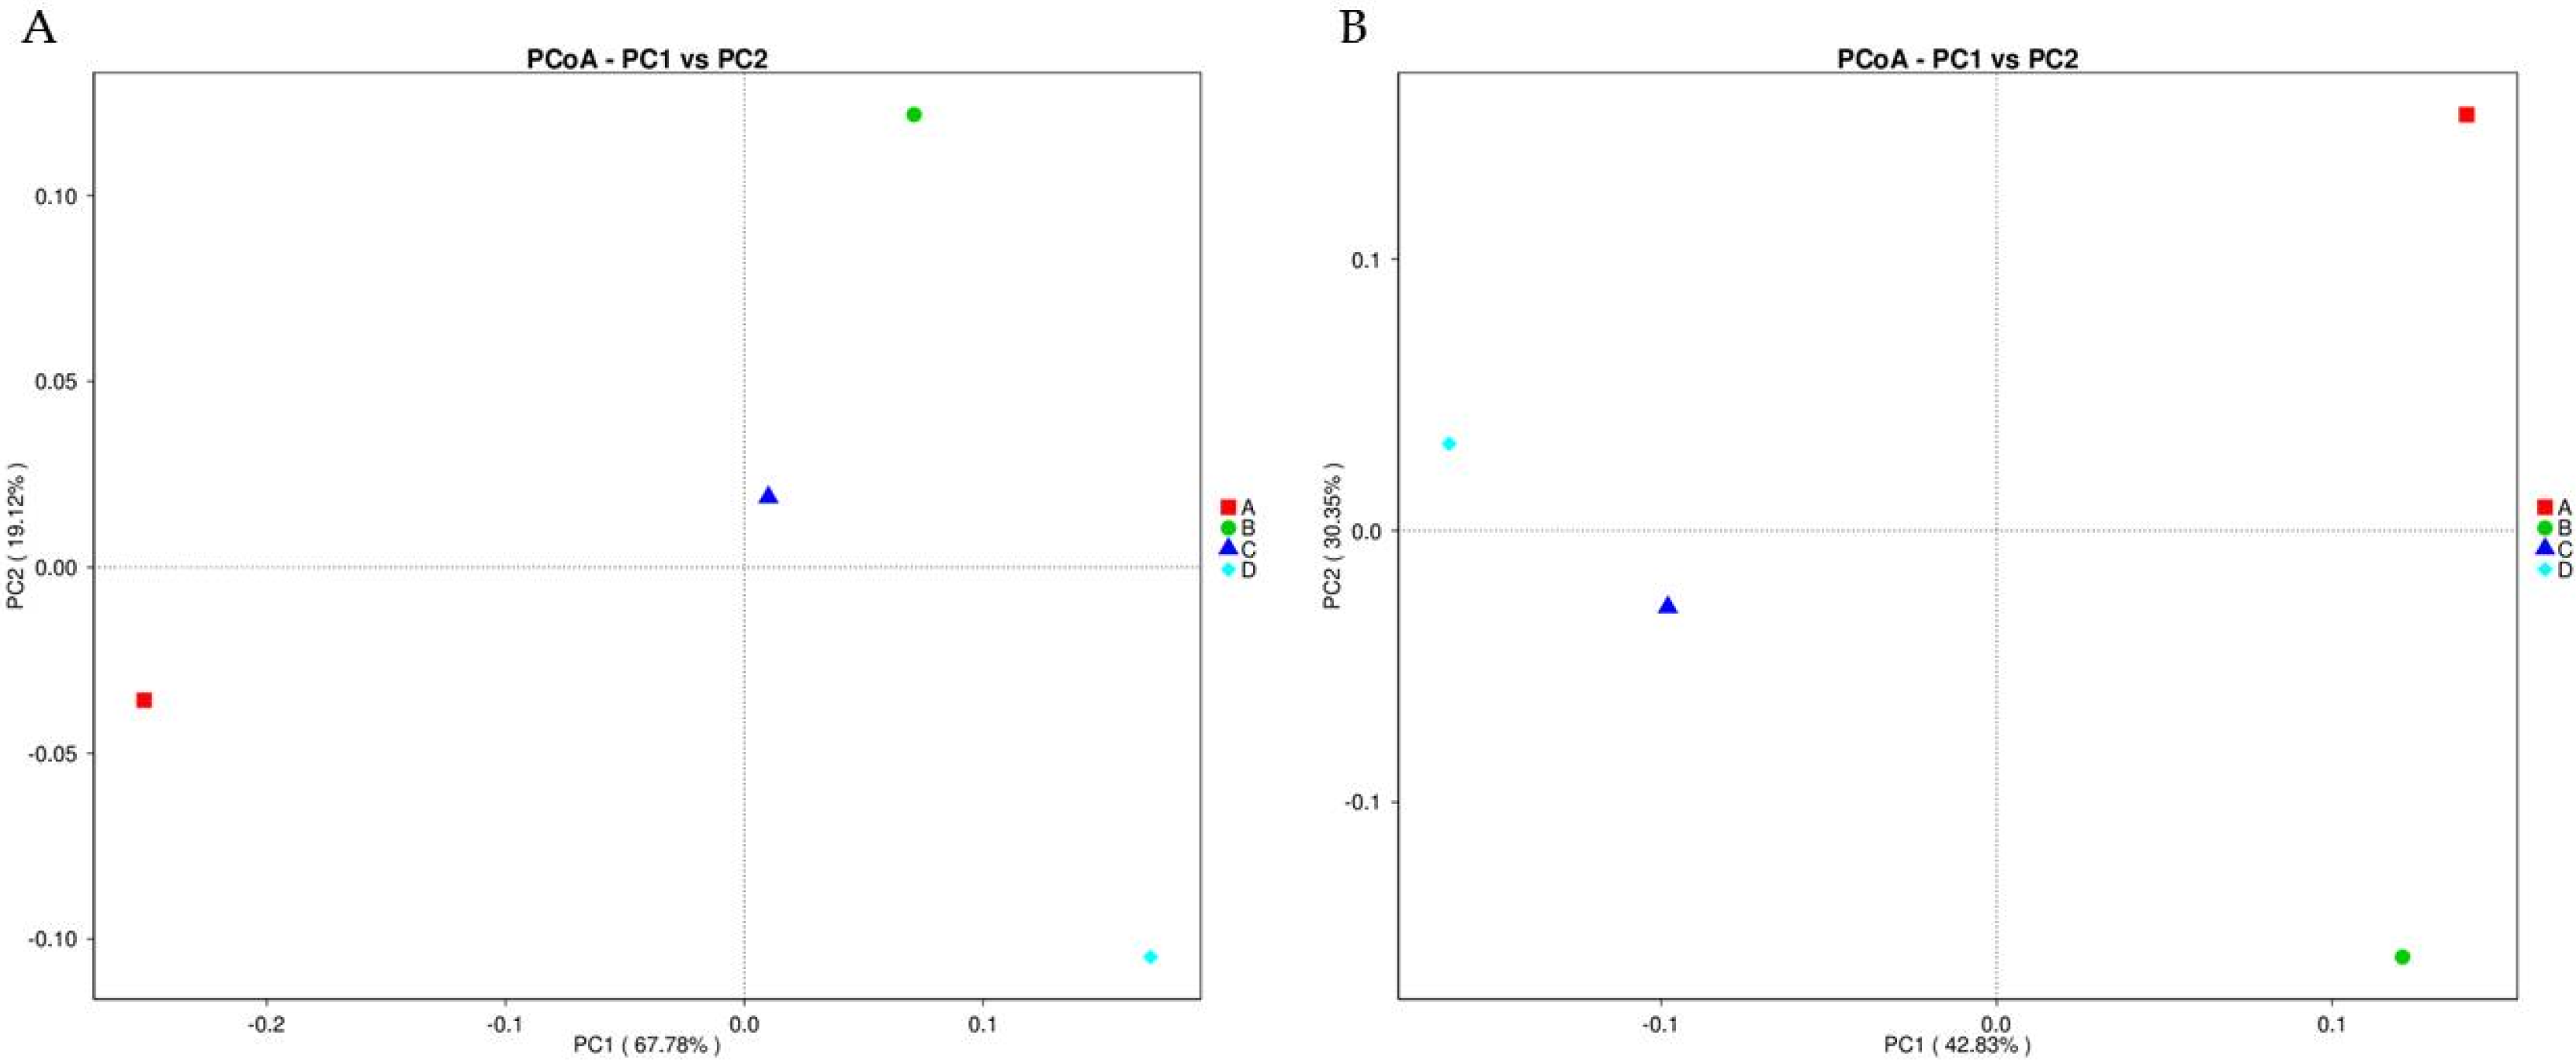
3.7. Principal Coordinates Analysis (PCoA)
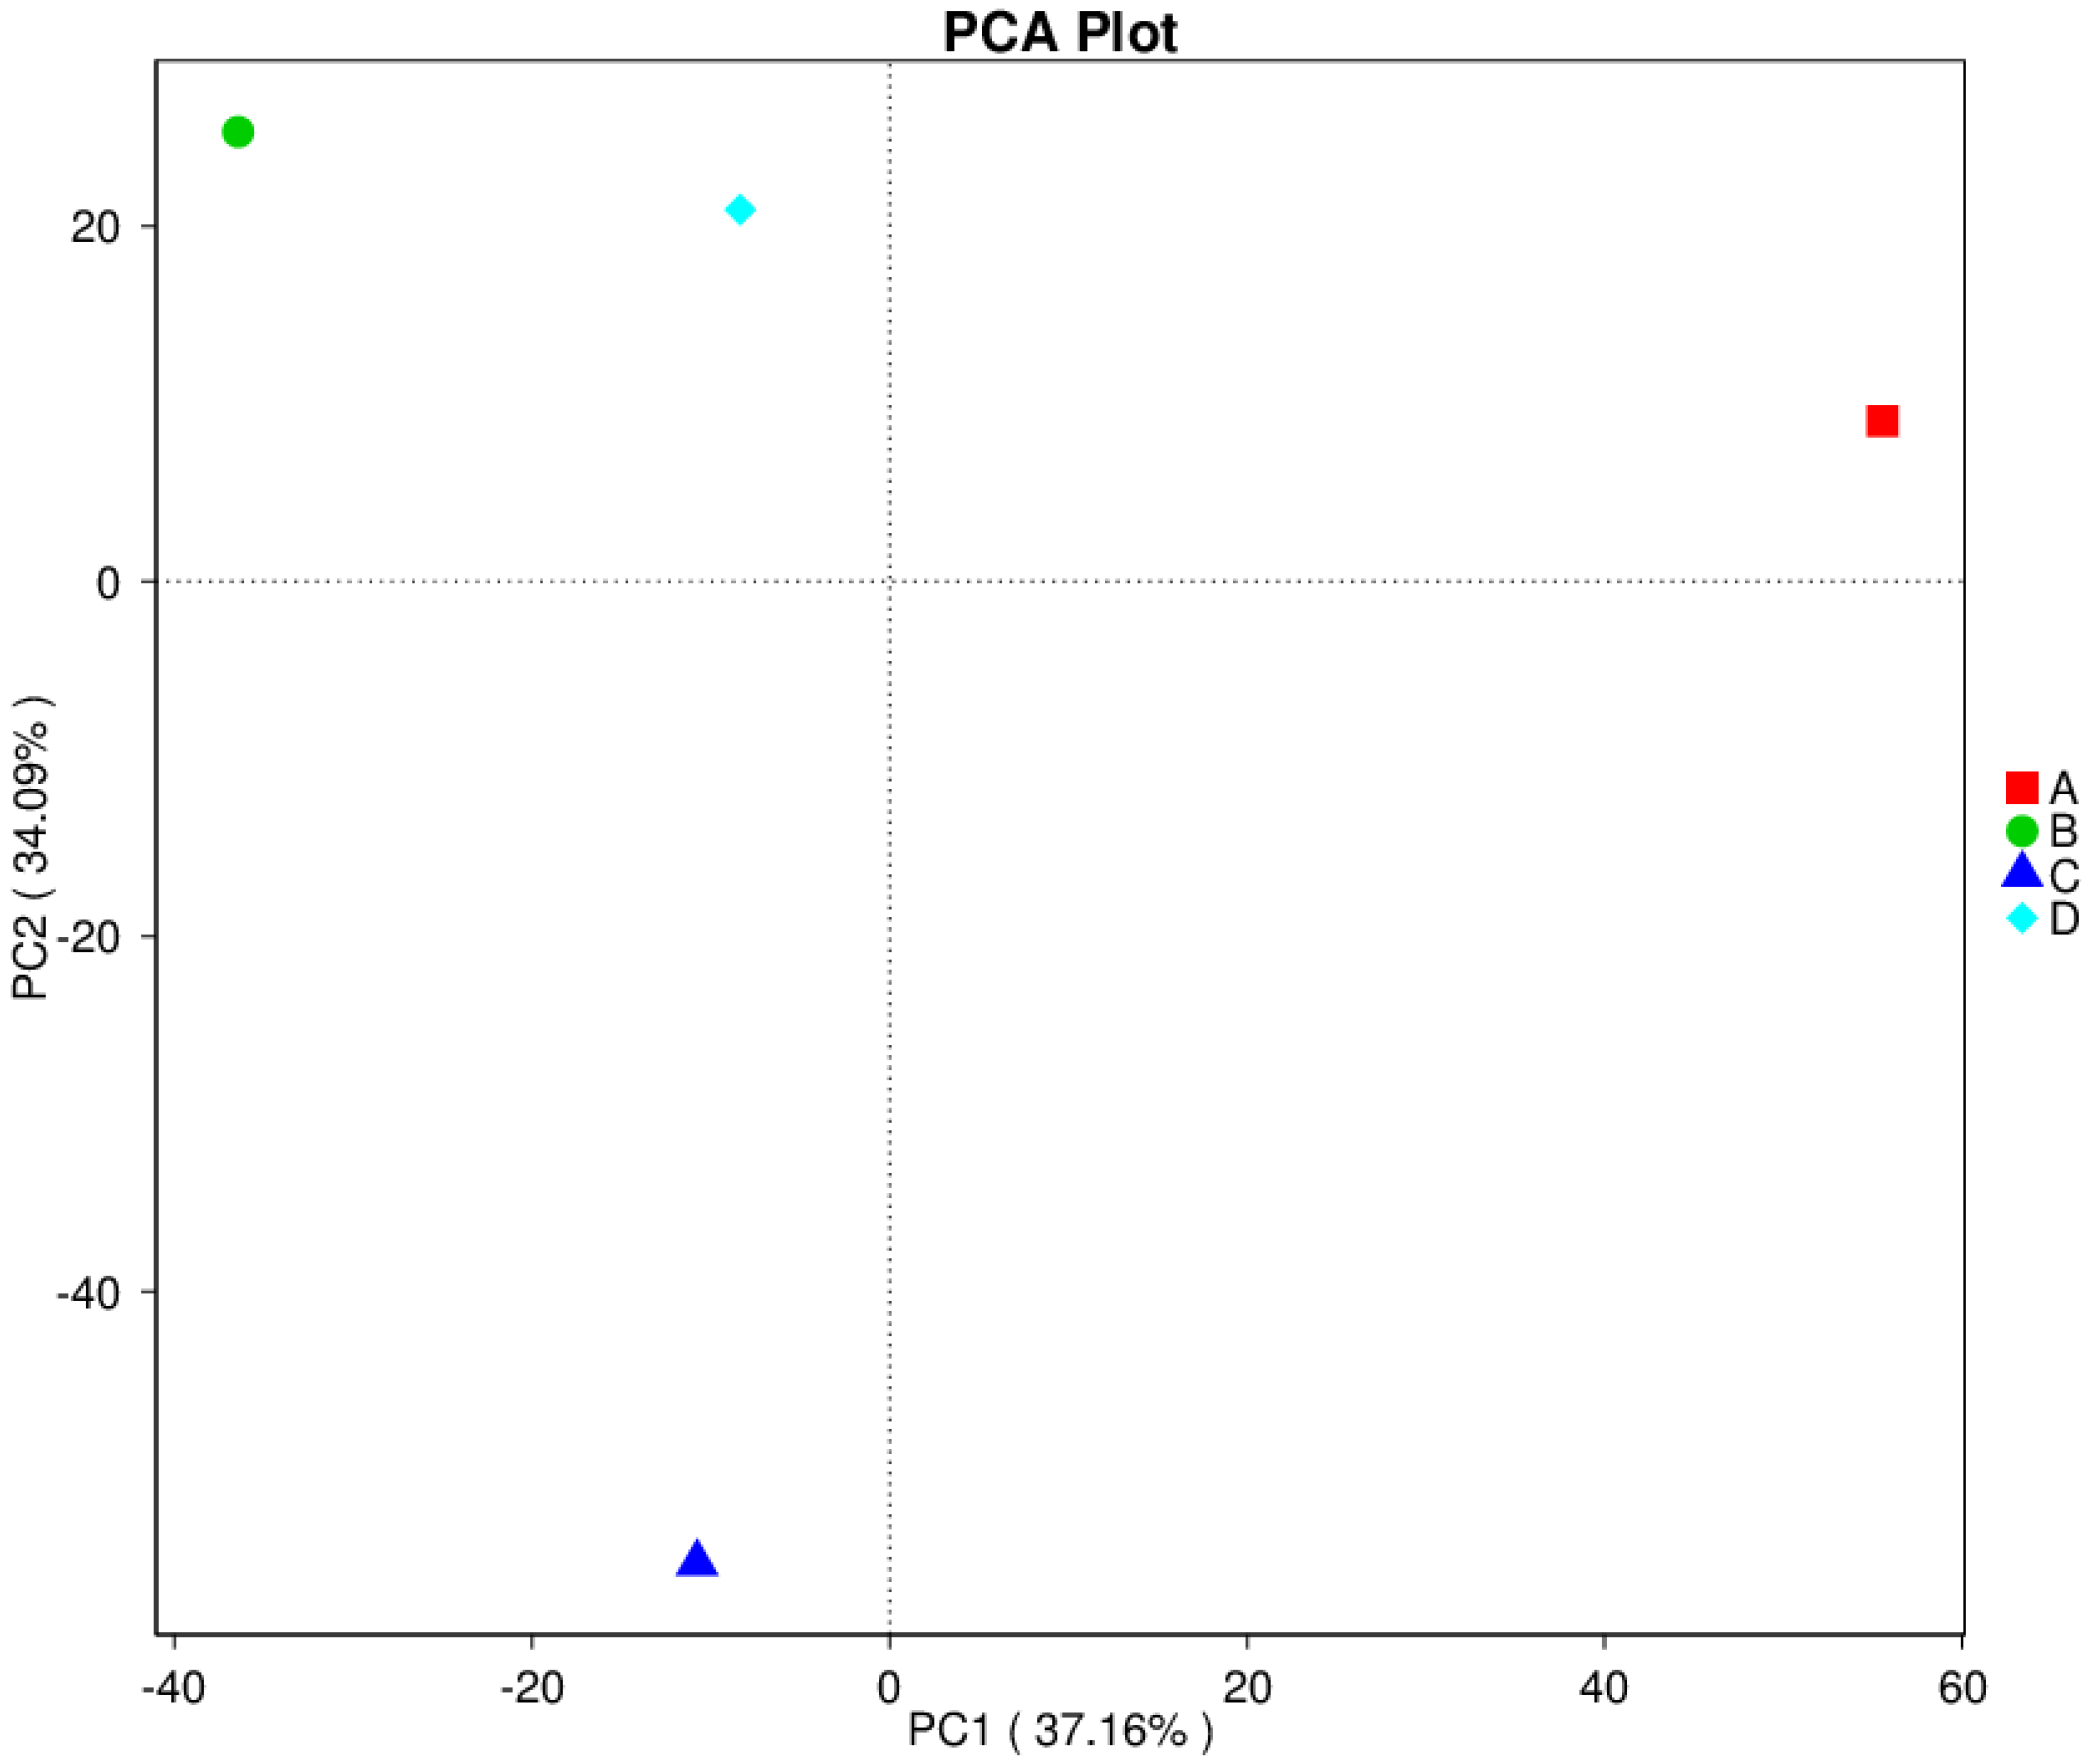
3.8. Principal Component Analysis (PCA)
4. Discussion
5. Conclusions
Supplementary Materials
Author Contributions
Funding
Institutional Review Board Statement
Informed Consent Statement
Data Availability Statement
Acknowledgments
Conflicts of Interest
References
- European Parliament and the Council, Directive 2008/98/EC on Waste and Repealing Certain Directives. 2008. Available online: http://data.europa.eu/eli/dir/2008/98/2018-07-05 (accessed on 29 January 2023).
- López-González, J.A.; Suárez-Estrella, F.; Vargas-García, M.C.; López, M.J.; Jurado, M.M.; Moreno, J. Dynamics of bacterial microbiota during lignocellulosic waste composting: Studies upon its Structure, functionality and biodiversity. Bioresour. Technol. 2015, 175, 406–416. [Google Scholar] [CrossRef] [PubMed]
- Meng, Q.; Han, Y.; Zhu, K.; Yang, W.; Bello, A.; Deng, L.; Jiang, X.; Wu, X.; Sheng, S.; Xu, Y.; et al. Differences in distribution of functional microorganism at DNA and cDNA levels in cow manure composting. Ecotoxicol. Environ. Saf. 2020, 191, 110161. [Google Scholar] [CrossRef]
- Varma, V.S. Characterization of bacterial community structure during in-vessel composting of agricultural waste by 16S rRNA sequencing. Biotechnology 2018, 8, 301. [Google Scholar] [CrossRef] [PubMed]
- Morales, A.B.; Bustamante, M.A.; Marhuenda-Egea, F.C.; Moral, R.; Ros, M.; Pascual, J.A. Agri-food sludge management using different co-composting strategies: Study of the added value of the composts obtained. J. Clean. Prod. 2016, 121, 186–197. [Google Scholar] [CrossRef] [Green Version]
- Angelova, D.; Shilev, S. Composting and vermicomposting of biosolids for utilization in agriculture. J. Environ. Prot. Ecol. 2021, 22, 1030–1039. [Google Scholar]
- Chen, Y.; Yu, F.; Liang, S.; Wang, Z.; Liu, Z.; Xiong, Y. Utilization of solar energy in sewage sludge composting: Fertilizer effect and application. Waste Manag. 2014, 34, 2014–2021. [Google Scholar] [CrossRef] [PubMed]
- Shilev, S.; Azaizeh, H.; Angelova, D. Biological treatment: A response to the accumulation of biosolids. In Microbial Interventions in Agriculture and Environment; Singh, D.P., Gupta, V.K., Prabha, R., Eds.; Rhizosphere, Microbiome and Agro-Ecology; Springer: Singapure, 2019; Volume 2, pp. 149–178. [Google Scholar]
- Bernal, M.P.; Alburquerque, J.A.; Moral, R. Composting of animal manures and chemical criteria for compost maturity assessment. A review. Bioresour. Technol. 2009, 100, 5444–5453. [Google Scholar] [CrossRef]
- Tiquia, S.M. Microbial community dynamics in manure composts based on 16S and 18S rDNA T-RFLP profiles. Environ. Technol. 2005, 26, 1101–1114. [Google Scholar] [CrossRef]
- Awasthi, M.K.; Wang, M.; Chen, H.; Wang, Q.; Zhao, J.; Ren, X.; Zhang, Z. Heterogeneity of biochar amendment to improve the carbon and nitrogen sequestration through reduce the greenhouse gases emissions during sewage sludge composting. Bioresour. Technol. 2017, 224, 428–438. [Google Scholar] [CrossRef]
- Malinowski, M.; Wolny-Koładka, K.; Vaverková, M.D. Effect of biochar addition on the OFMSW composting process under real conditions. Waste Manag. 2019, 84, 364–372. [Google Scholar] [CrossRef]
- Angelova, D.; Shilev, S.; Naydenov, M. Composting of sewage sludge at large scale for subsequent utilization in agriculture. In Proceedings of the 4th National Conference of Bulgarian Humic Substances Society, Sofia, Bulgaria, 8–10 September 2016; pp. 285–295. [Google Scholar]
- Hultman, J.; Kurola, J.; Rainisalo, A.; Kontro, M.; Romantschuk, M. Utility of molecular tools in monitoring large scale composting. In Microbes at Work; Springer: Berlin/Heidelberg, Germany, 2010; pp. 135–151. [Google Scholar]
- Wu, S.; He, H.; Inthapanya, X.; Yang, C.; Lu, L.; Zeng, G.; Han, Z. Role of biochar on composting of organic wastes and remediation of contaminated soils—A review. Environ. Sci. Pollut. Res. 2017, 24, 16560–16577. [Google Scholar] [CrossRef] [PubMed]
- Liu, Y.; Li, C.; Zhao, B.; Zhang, J.; Qiu, R. Inoculation of Prickly Pear Litter with Microbial Agents Promotes the Efficiency in Aerobic Composting. Sustainability 2022, 14, 4824. [Google Scholar] [CrossRef]
- Wang, X.; Cui, H.; Shi, J.; Zhao, X.; Zhao, Y.; Wei, Z. Relationship between bacterial diversity and environmental parameters during composting of different raw materials. Bioresour. Technol. 2015, 198, 395–402. [Google Scholar] [CrossRef] [PubMed]
- Hayat, R.; Sheirdil, R.A.; Iftikhar-ul-Hassan, M.; Ahmed, I. Characterization and identification of compost bacteria based on 16S rRNA gene sequencing. Ann. Microbiol. 2013, 63, 905–912. [Google Scholar] [CrossRef]
- Wei, J.; Guo, X.; Liu, H.; Chen, Y.; Wang, W. The variation profile of intestinal microbiota in blunt snout bream (Megalobrama amblycephala) during feeding habit transition. BMC Microbiol. 2018, 18, 99. [Google Scholar] [CrossRef]
- Meng, Q.; Yang, W.; Men, M.; Bello, A.; Xu, X.; Xu, B.; Deng, L.; Jiang, X.; Sheng, S.; Wu, X.; et al. Microbial Community Succession and Response to Environmental Variables During Cow Manure and Corn Straw Composting. Front. Microbiol. 2019, 10, 529. [Google Scholar] [CrossRef] [Green Version]
- Bao, S.D. Soil Agro-Chemistry Analysis; China Agriculture Press: Beijing, China, 1981; pp. 438–441. [Google Scholar]
- Angelova, V.R.; Akova, V.I.; Ivanov, K.I. Comparative study of the methods for the determination of organic carbon and organic matter in soils, compost and sludge. Bulg. Chem. Commun. 2019, 51, 342–347. [Google Scholar] [CrossRef]
- Alef, K.; Nannipieri, P. Methods in Applied Soil Microbiology and Biochemistry, 1st ed.; Academic Press: Cambridge, MA, USA, 1995; pp. 193–201. [Google Scholar]
- Caporaso, G.J.; Lauber, C.L.; Walters, W.A.; Berg-Lyons, D.; Lozupone, C.A.; Turnbaugh, P.J.; Fierer, N.; Knight, R. Global patterns of 16S rRNA diversity at a depth of millions of sequences per sample. Proc. Natl. Acad. Sci. USA 2011, 108 (Suppl. S1), 4516–4522. [Google Scholar] [CrossRef] [Green Version]
- Martin, M. Cutadapt removes adapter sequences from high-throughput sequencing reads. Embnet. J. 2011, 17, 10–12. [Google Scholar] [CrossRef]
- Haas, B.J.; Gevers, D.; Earl, A.M.; Feldgarden, M.; Ward, D.V.; Giannoukos, G.; Ciulla, D.; Tabbaa, D.; Highlander, S.K.; Sodergren, E.; et al. Chimeric 16S rRNA sequence formation and detection in Sanger and 454-pyrosequenced PCR amplicons. Genome Res. 2011, 21, 494–504. [Google Scholar] [CrossRef] [Green Version]
- Edgar, R.C. UPARSE: Highly accurate OTU sequences from microbial amplicon reads. Nat. Methods 2013, 10, 996–998. [Google Scholar] [CrossRef] [PubMed]
- Abell, G.C.; Bowman, J.P. Ecological and biogeographic relationships of class Flavobacteria in the Southern Ocean. FEMS Microbiol. Ecol. 2005, 51, 265–277. [Google Scholar] [CrossRef] [PubMed] [Green Version]
- Zhang, J.; Chen, M.; Huang, J.; Guo, X.; Zhang, Y.; Liu, D.; Wu, R.; He, H.; Wang, J. Diversity of the microbial community and cultivable protease-producing bacteria in the sediments of the Bohai Sea, Yellow Sea and South China Sea. PLoS ONE 2019, 14, e0215328. [Google Scholar] [CrossRef] [PubMed] [Green Version]
- Wei, H.; Wang, L.; Hassan, M.; Xie, B. Succession of the functional microbial communities and the metabolic functions in maize straw composting process. Bioresour. Technol. 2018, 256, 333–341. [Google Scholar] [CrossRef]
- Segata, N.; Izard, J.; Waldron, L.; Gevers, D.; Miropolsky, L.; Garrett, W.S.; Huttenhower, C. Metagenomic biomarker discovery and explanation. Genome Biol. 2011, 12, R60. [Google Scholar] [CrossRef] [Green Version]
- Lozupone, C.A.; Hamady, M.; Kelley, S.T.; Knight, R. Quantitative and qualitative β diversity measures lead to different insights into factors that structure microbial communities. Appl. Environ. Microbiol. 2007, 73, 1576–1585. [Google Scholar] [CrossRef] [Green Version]
- Avershina, E.; Frisli, T.; Rudi, K. De novo Semi-alignment of 16S rRNA Gene Sequences for Deep Phylogenetic Characterization of Next Generation Sequencing Data. Microbes Environ. 2013, 28, 211–216. [Google Scholar] [CrossRef] [Green Version]
- Lozupone, C.; Lladser, M.E.; Knights, D.; Stombaugh, J.; Knight, R. UniFrac: An effective distance metric for microbial community comparison. ISME J. 2011, 5, 169. [Google Scholar] [CrossRef] [Green Version]
- White, J.R.; Nagarajan, N.; Pop, M. Statistical methods for detecting differentially abundant features in clinical metagenomic samples. PLoS Comput. Biol. 2009, 5, e1000352. [Google Scholar] [CrossRef]
- Chang, R.; Guo, Q.; Chen, Q.; Bernal, M.P.; Wang, Q.; Li, Y. Effect of initial material bulk density and easily-degraded organic matter content on temperature changes during composting of cucumber stalk. J. Environ. Sci. 2019, 80, 306–315. [Google Scholar] [CrossRef]
- Council of Ministers. Regulation on the Separate Collection of Bio-Waste and Treatment of Biodegradable Waste. Ordinance No 20. 2017. State Gazette, 11/20172. 2017. Available online: https://moew.government.bg/static/media/ups/tiny/УООП/ЗАКОНОДАТЕЛСТВО%202021/Naredba_bio.pdf (accessed on 14 December 2022).
- Sánchez-Monedero, M.A.; Roig, A.; Paredes, C.; Bernal, M.P. Nitrogen transformation during organic waste composting by the Rutgers system and its effects on pH, EC and maturity of the composting mixtures. Bioresour. Technol. 2001, 78, 301–308. [Google Scholar] [CrossRef] [PubMed]
- Asnicar, F.; Weingart, G.; Tickle, T.L.; Huttenhower, C.; Segata, N. Compact graphical representation of phylogenetic data and metadata with GraPhlAn. PeerJ 2015, 3, e1029. [Google Scholar] [CrossRef] [PubMed]
- Ondov, B.D.; Bergman, N.H.; Phillippy, A.M. Interactive metagenomic visualization in a Web browser. BMC Bioinform. 2011, 12, 385. [Google Scholar] [CrossRef] [PubMed] [Green Version]
- Sun, W.; Dai, S.; Jiang, S.; Wang, G.; Liu, G.; Wu, H.; Li, X. Culture-dependent and culture-independent diversity of actinobacteria associated with the marine sponge Hymeniacidon perleve from the South China Sea. Antonie Leeuwenhoek 2010, 98, 65–75. [Google Scholar] [CrossRef] [PubMed]
- Chen, Q.; Wang, J.; Zhang, H.; Shi, H.; Liu, G.; Che, J.; Liu, B. Microbial community and function in nitrogen transformation of ectopic fermentation bed system for pig manure composting. Bioresour. Technol. 2021, 319, 124155. [Google Scholar] [CrossRef]
- Bulgarelli, D.; Garrido-Oter, R.; Münch, P.C.; Weiman, A.; Dröge, J.; Pan, Y.; McHardy, A.C.; Schulze-Lefert, P. Structure and function of the bacterial root microbiota in wild and domesticated barley. Cell Host Microbe 2015, 17, 392–403. [Google Scholar] [CrossRef] [Green Version]
- Lundberg, D.S.; Yourstone, S.; Mieczkowski, P.; Jones, C.D.; Dangl, J.L. Practical innovations for high-throughput amplicon sequencing. Nat. Methods 2013, 10, 999–1002. [Google Scholar] [CrossRef]
- Li, B.; Zhang, X.; Guo, F.; Wu, W.; Zhang, T. Characterization of tetracycline resistant bacterial community in saline activated sludge using batch stress incubation with high-throughput sequencing analysis. Water Res. 2013, 47, 4207–4216. [Google Scholar] [CrossRef]
- Chang, R.; Li, Y.; Li, N.; Wu, X.; Chen, Q. Effect of microbial transformation induced by metallic compound additives and temperature variations during composting on suppression of soil-borne pathogens. J. Environ. Manag. 2021, 279, 111816. [Google Scholar] [CrossRef]
- Antunes, L.P.; Martins, L.F.; Pereira, R.V.; Thomas, A.V.; Barbosa, D.; Lemos, L.N.; Silva, G.M.M.; Moura, L.M.S.; Epamino, G.W.C.; Digiampietri, L.A.; et al. Microbial community structure and dynamics in thermophilic composting viewed through metagenomics and metatranscriptomics. Sci. Rep. 2016, 6, 38915. [Google Scholar] [CrossRef] [Green Version]
- Neher, D.A.; Weicht, T.R.; Dunseith, P. Compost for Management of Weed Seeds, Pathogen, and Early Blight on Brassicas in Organic Farmer Fields. Agroecol. Sustain. Food Syst. 2015, 39, 3–18. [Google Scholar] [CrossRef]
- Zhang, J.; Zhang, T.; Ying, Y.; Yao, X. Effects of different additives on the chemical composition and microbial diversity during composting of Camellia oleifera shell. Bioresour. Technol. 2021, 330, 124990. [Google Scholar] [CrossRef]
- de Gannes, V.; Eudoxie, G.; Hickey, W.J. Prokaryotic successions and diversity in composts as revealed by 454-pyrosequencing. Bioresour. Technol. 2013, 133, 573–580. [Google Scholar] [CrossRef] [PubMed]
- Goodfellow, M.; Williams, S.T. Ecology of actinomycetes. Annu. Rev. Microbiol. 1983, 37, 189–216. [Google Scholar] [CrossRef] [PubMed]
- Steger, K.; Jarvis, Å.; Vasara, T.; Romantschuk, M.; Sundh, I. Effects of differing temperature management on development of Actinobacteria populations during composting. Res. Microbiol. 2007, 158, 617–624. [Google Scholar] [CrossRef] [PubMed]
- Eisenlord, S.D.; Zak, D.R. Simulated atmospheric nitrogen deposition alters actinobacterial community composition in forest soils. Soil Sci. Soc. Am. J. 2010, 74, 1157–1166. [Google Scholar] [CrossRef] [Green Version]
- Insam, H.K.M.C.; Amor, K.; Renner, M.; Crepaz, C. Changes in functional abilities of the microbial community during composting of manure. Microb. Ecol. 1996, 31, 77–87. [Google Scholar] [CrossRef] [PubMed]
- Yang, W.; Zheng, Y.; Sun, W.; Chen, S.; Liu, D.; Zhang, H.; Fang, H.; Tian, J.; Ye, X. Effect of extrusion processing on the microstructure and in vitro digestibility of broken rice. LWT 2020, 119, 108835. [Google Scholar] [CrossRef]
- Buzón-Durán, L.; Pérez-Lebeña, E.; Martín-Gil, J. Applications of Streptomyces spp. Enhanced Compost in Sustainable Agriculture. In Biology of Composts; Meghvansi, M.K., Varma, A., Eds.; Book series: Soil Biology; Springer Nature: Cham, Switzerland, 2020; pp. 257–291. [Google Scholar]
- Ramírez, P.; Coha, J.M. Enzymatic degradation of cellulose for thermophilic actinomycete: Isolation, characterization and cellulolytic activity determination. Rev. Peru. De Biol. 2003, 10, 67–77. [Google Scholar] [CrossRef] [Green Version]
- Jiang-Ming, Z. Effect of turning frequency on co-composting pig manure and fungus residue. J. Air Waste Manag. Assoc. 2017, 67, 313–321. [Google Scholar] [CrossRef] [Green Version]
- Ma, S.; Fang, C.; Sun, X.; Han, L.; He, X.; Huang, G. Bacterial community succession during pig manure and wheat straw aerobic composting covered with a semi-permeable membrane under slight positive pressure. Bioresour. Technol. 2018, 259, 221–227. [Google Scholar] [CrossRef] [PubMed]
- Storey, S.; Chualain, D.N.; Doyle, O.; Clipson, N.; Doyle, E. Comparison of bacterial succession in green waste composts amended with inorganic fertilizer and wastewater treatment plant sludge. Bioresour. Technol. 2015, 179, 71–77. [Google Scholar] [CrossRef] [PubMed]
- Awasthi, M.K.; Chen, H.; Wang, Q.; Liu, T.; Duan, Y.; Awasthi, S.K.; Zhang, Z. Succession of bacteria diversity in the poultry manure composted mixed with clay: Studies upon its dynamics and associations with physicochemical and gaseous parameters. Bioresour. Technol. 2018, 267, 618–625. [Google Scholar] [CrossRef] [PubMed]
- Song, C.; Li, M.; Jia, X.; Wei, Z.; Zhao, Y.; Xi, B.; Zhu, C.; Liu, D. Comparison of bacterial community structure and dynamics during the thermophilic composting of different types of solid wastes: Anaerobic digestion residue, pig manure and chicken manure. Microb. Biotechnol. 2014, 7, 424–433. [Google Scholar] [CrossRef]


| Harmanli | Yasno Pole | |||
|---|---|---|---|---|
| Thermophilic | Mesophilic | Thermophilic | Mesophilic | |
| Dry weight (%) | 56.35 | 62.57 | 70.43 | 61.01 |
| Total organic carbon (%) | 28.01 | 22.19 | 28.58 | 22.85 |
| pH | 8.24 | 8.64 | 7.8 | 7.97 |
| EC (mS·cm−1) | 1.363 | 1.516 | 0.972 | 1.02 |
| Total nitrogen (%) | 1.53 | 1.33 | 1.34 | 1.27 |
| N-NH4 (mg·kg−1) | 210.32 | 120.85 | 199.76 | 175.36 |
| N-NO3 (mg·kg−1) | 62.21 | 90.94 | 74.2 | 94.11 |
| C/N ratio | 18.31 | 16.68 | 21.33 | 17.99 |
| Respiration (μg CO2·g−1·h−1) | 163.10 | 79.32 | 175.73 | 22.82 |
| Sample Name | Raw PE | Raw Tags | Clean Tags | Effective Tags | Base | AvgLent | Q20 | Q30 | GC% | Effective% |
|---|---|---|---|---|---|---|---|---|---|---|
| A1 | 136,069 | 111,104 | 108,467 | 95,147 | 39,687,497 | 417 | 97.32 | 91.97 | 57.85 | 69.93 |
| A2 | 121,912 | 107,885 | 106,056 | 89,977 | 37,469,369 | 416 | 97.83 | 93.21 | 55.73 | 73.80 |
| B1 | 124,308 | 103,076 | 100,712 | 88,021 | 36,812,995 | 418 | 97.44 | 92.20 | 56.62 | 70.81 |
| B2 | 125,061 | 112,651 | 110,822 | 96,947 | 40,445,191 | 417 | 97.83 | 93.31 | 55.82 | 77.52 |
| Sample Name | Observed Species | Shannon | Simpson | Chao1 | ACE | Goods Coverage | PD Whole Tree |
|---|---|---|---|---|---|---|---|
| A1 | 2086 | 8.929 | 0.995 | 2184.821 | 2198.988 | 0.997 | 162.643 |
| A2 | 2237 | 9.130 | 0.994 | 2340.704 | 2348.650 | 0.997 | 173.377 |
| B1 | 2249 | 9.337 | 0.995 | 2355.469 | 2321.428 | 0.998 | 166.408 |
| B2 | 2018 | 8.322 | 0.998 | 2160.692 | 2171.487 | 0.996 | 153.686 |
Disclaimer/Publisher’s Note: The statements, opinions and data contained in all publications are solely those of the individual author(s) and contributor(s) and not of MDPI and/or the editor(s). MDPI and/or the editor(s) disclaim responsibility for any injury to people or property resulting from any ideas, methods, instructions or products referred to in the content. |
© 2023 by the authors. Licensee MDPI, Basel, Switzerland. This article is an open access article distributed under the terms and conditions of the Creative Commons Attribution (CC BY) license (https://creativecommons.org/licenses/by/4.0/).
Share and Cite
Chopkova, V.; Petkova, M.; Shilev, S. Uncovering Bacterial Diversity during Mesophilic and Thermophilic Phases of Biowaste Composting through Next-Generation Sequencing. Appl. Sci. 2023, 13, 3111. https://doi.org/10.3390/app13053111
Chopkova V, Petkova M, Shilev S. Uncovering Bacterial Diversity during Mesophilic and Thermophilic Phases of Biowaste Composting through Next-Generation Sequencing. Applied Sciences. 2023; 13(5):3111. https://doi.org/10.3390/app13053111
Chicago/Turabian StyleChopkova, Vasilka, Mariana Petkova, and Stefan Shilev. 2023. "Uncovering Bacterial Diversity during Mesophilic and Thermophilic Phases of Biowaste Composting through Next-Generation Sequencing" Applied Sciences 13, no. 5: 3111. https://doi.org/10.3390/app13053111