Article

A Strain Hardening and Softening Constitutive Model for Hard Brittle Rocks

School of Resources and Safety Engineering, Central South University, Changsha 410083, China
*
Author to whom correspondence should be addressed.
Appl. Sci. 2023, 13(5), 2764; https://doi.org/10.3390/app13052764
Submission received: 8 January 2023 / Revised: 9 February 2023 / Accepted: 15 February 2023 / Published: 21 February 2023

Abstract

:
To study the strain hardening and softening mechanism for hard brittle rocks, a strain hardening and softening constitutive model for hard brittle rocks is developed. First, the normalised hardening and softening factors are defined, which characterise the yield state of rock at the stages of pre-peak hardening and post-peak softening, respectively. Then, a unified strength parameter evolution model is established that can describe the nonlinear characteristics of cohesion and the internal friction angle under different confining pressures. Based on the Mohr–Coulomb criterion, a strain hardening and softening constitutive model is proposed. Finally, the proposed model was implemented in FLAC3D, and triaxial compression numerical tests of granite and diabase were conducted. The results show that the constitutive model can characterise the nonlinear mechanical behaviour of the pre-peak hardening stage and post-peak softening stage of hard brittle rock. The model was also able to satisfactorily capture the transition from brittle failure to plastic failure for hard brittle rock under high confining pressures.

1. Introduction

With the advancement of technology, human society’s demand for deep underground rock engineering construction has increased [1,2]. Many deep underground structures are built in hard brittle rock masses such as granite and diabase [3,4]. The fracture or even failure of hard brittle rock is the most important challenge in engineering construction. Hard brittle rocks often exhibit obvious nonlinear mechanical properties such as strain hardening/softening and plastic dilatation under high in situ stress [5]. Therefore, the in-depth study of the nonlinear mechanical behaviours of hard brittle rocks and the establishment of a hardening and softening constitutive model is of great significance for engineering design and engineering safety assessment [6].
The phenomenon in which a significant increase or decrease in stress accompanies increasing strain after a rock has yielded under compression conditions is known as strain hardening or strain softening of rocks. In view of this nonlinear mechanical behaviour, many constitutive models have been proposed. Based on the traditional strength yield criterion, the damage constitutive models have been proposed [7]. These models can describe the nonlinear behaviour of the rock under loading but do not consider the true changes in the subsequent yield surface of the rock at the strain hardening and strain softening stages [8]. In recent years, some scholars have used plastic parameters as independent variables to characterise the strain hardening/softening behaviour of rocks and represent the evolution of subsequent yield surfaces and have proposed elastic-plastic strain hardening and softening constitutive models [9,10]. Because the Mohr–Coulomb yield criterion can satisfactorily describe the shear failure mechanism, it has been widely adopted as the yield surface equation. The following two strength parameters are needed to determine the evolution law of the yield surface: cohesion and the internal friction angle [11]. Yielding occurs once the shear stress of the rock reaches a stress threshold.
Based on the Mohr–Coulomb yield criterion, various strength parameter evolution models are proposed. According to the strength parameters at peak stress and residual stress, the strength parameters decrease linearly with the increase in the plastic parameter [12,13]. Based on the degradation index concept proposed by Fang and Harrison [14], the cohesion and internal friction angle strength degradation index was proposed to describe the process of linear reduction of the post-peak strength parameters [15], and Alejano et al. [16] proposed three strain softening models by adopting the drop modulus variation. Lee and Pietruszczak [17] and Fahimifar and Zareifard [18] obtained a finite strain solution for circular underground tunnels in a Mohr–Coulomb elastoplastic coupling strain softening rock mass, assuming that cohesion and the internal friction angle decrease linearly with increasing plastic parameters.
The application of the linear reduction model of post-peak strength parameters is relatively simple, but the actual softening process of the post-peak stage is ignored. To accurately describe the post-peak mechanical behaviour of rock, Ranjbarnia et al. [19] used multiple piecewise linear functions to approximate the nonlinear softening behaviour after the peak stress was reached. Li et al. [20] proposed that the decreasing law of the internal friction angle conforms to a quadratic function and that cohesion decreases linearly after the peak stress is reached. Based on the triaxial test data of sandstone, mudstone and argillaceous sandstone, O. Pourhosseini et al. [21] proposed a strength parameter evolution model of constant friction and cohesion weakening, assuming the internal friction angle remains constant during the post-peak softening process. The studies mentioned above consider the peak point as the starting point of the softening process, simplify the pre-peak process to one of linear elasticity, ignore the pre-peak rock hardening process and only study the post-peak strength parameter evolution law [22].
To overcome the abovementioned shortcomings, relevant scholars took the initial yield point of rock as the starting point and established strength parameter evolution models to describe the strain hardening and softening process. V. Hajiabdolmajid et al. [23] proposed a linear CWFS model (cohesion weakening-friction strengthening) based on experimental data derived from granite and implemented this model in FLAC2D numerical software to analyse the “V” damage caused by tunnel excavation. Walton [24] and Rafiei and Martin [25] proposed a nonlinear CWFS model based on the results of triaxial compression tests performed on granite under different confining stresses, and their model curves were in good agreement with the test curves. Li et al. [26] analysed the results of triaxial cyclic loading and unloading of Beishan granite and found that the cohesion gradually decreased as an exponential function with the plastic parameter increasing after damage occurred in the rock, while the internal friction angle increased as a log-normal distribution function until the peak was reached and then gradually decreased. On the basis of Li’s [26] research, Min et al. [27] proposed a strain softening constitutive model considering the elastic modulus degradation effect. Meng et al. [28] revealed the relationship between the softening parameter, cohesion and the internal friction angle through triaxial cyclic loading and unloading tests. Wang et al. [29] established a two-dimensional strength parameter model considering the confining pressure and plastic parameters and revealed the relationship between the parameters, cohesion and the internal friction angle.
It is worth noting that by solving for cohesion and the internal friction angle based on the Mohr–Coulomb yield criterion [20,26,27,28,29], the rock was assumed to experience the same plastic deformation when reaching peak stress and residual stress under different confining stresses, and on this basis, the relationship between confining pressure and stress under the same plastic deformation was established, and then the cohesion and internal friction angle evolution was obtained. However, the experimental results show that the plastic deformation of the rock differs under different confining pressures when the stress value of the yield state (such as peak stress and residual stress) remains constant [30]. Therefore, the strength parameter evolution law that is based on the same plastic deformation will produce results inconsistent with the experimental results.
In summary, on the one hand, there are few methods to determine the stress value of the same yield state under different confining pressures; on the other hand, the current model cannot simultaneously calculate the cohesion and internal friction angle at the initial yield stress, peak stress and residual stress and reflect the evolution law of the strain hardening and softening process. Therefore, the main aim of this paper is to develop a strain hardening and softening constitutive model that can consider the nonlinear characteristics of rocks under different confining pressures. The constitutive model proposed in this paper differs from other models based on the following three characteristics:
(i) The normalised hardening factor and softening factor are defined to characterise the yield state of the rock at the initial yield stress point, peak stress point, residual stress point and any yield stress points.
(ii) A unified strength parameter evolution model is proposed, and it can reflect the variations in cohesion and the internal friction angle in the subsequent yield process.
(iii) The strain hardening and softening constitutive model can simultaneously capture the mechanical nonlinear behaviours of hard brittle rocks in the pre-peak hardening and post-peak softening stages under different confining pressures. The results show that the nonlinear characteristics of stress-strain curves can be reproduced well under different confining pressures.
In the following sections, the hardening and softening factors are defined based on the simplified stress-strain curve. Then, the relationship between the factors, the strength parameters and the axial plastic strain was analysed, and a unified strength parameter evolution model considering confining pressures was proposed. Then, the evolution model is implemented in FLAC3D to realise the secondary development of the strain hardening and softening constitutive model. Finally, numerical triaxial compression tests are conducted on granite and diabase, and the numerical results are verified with the test results.

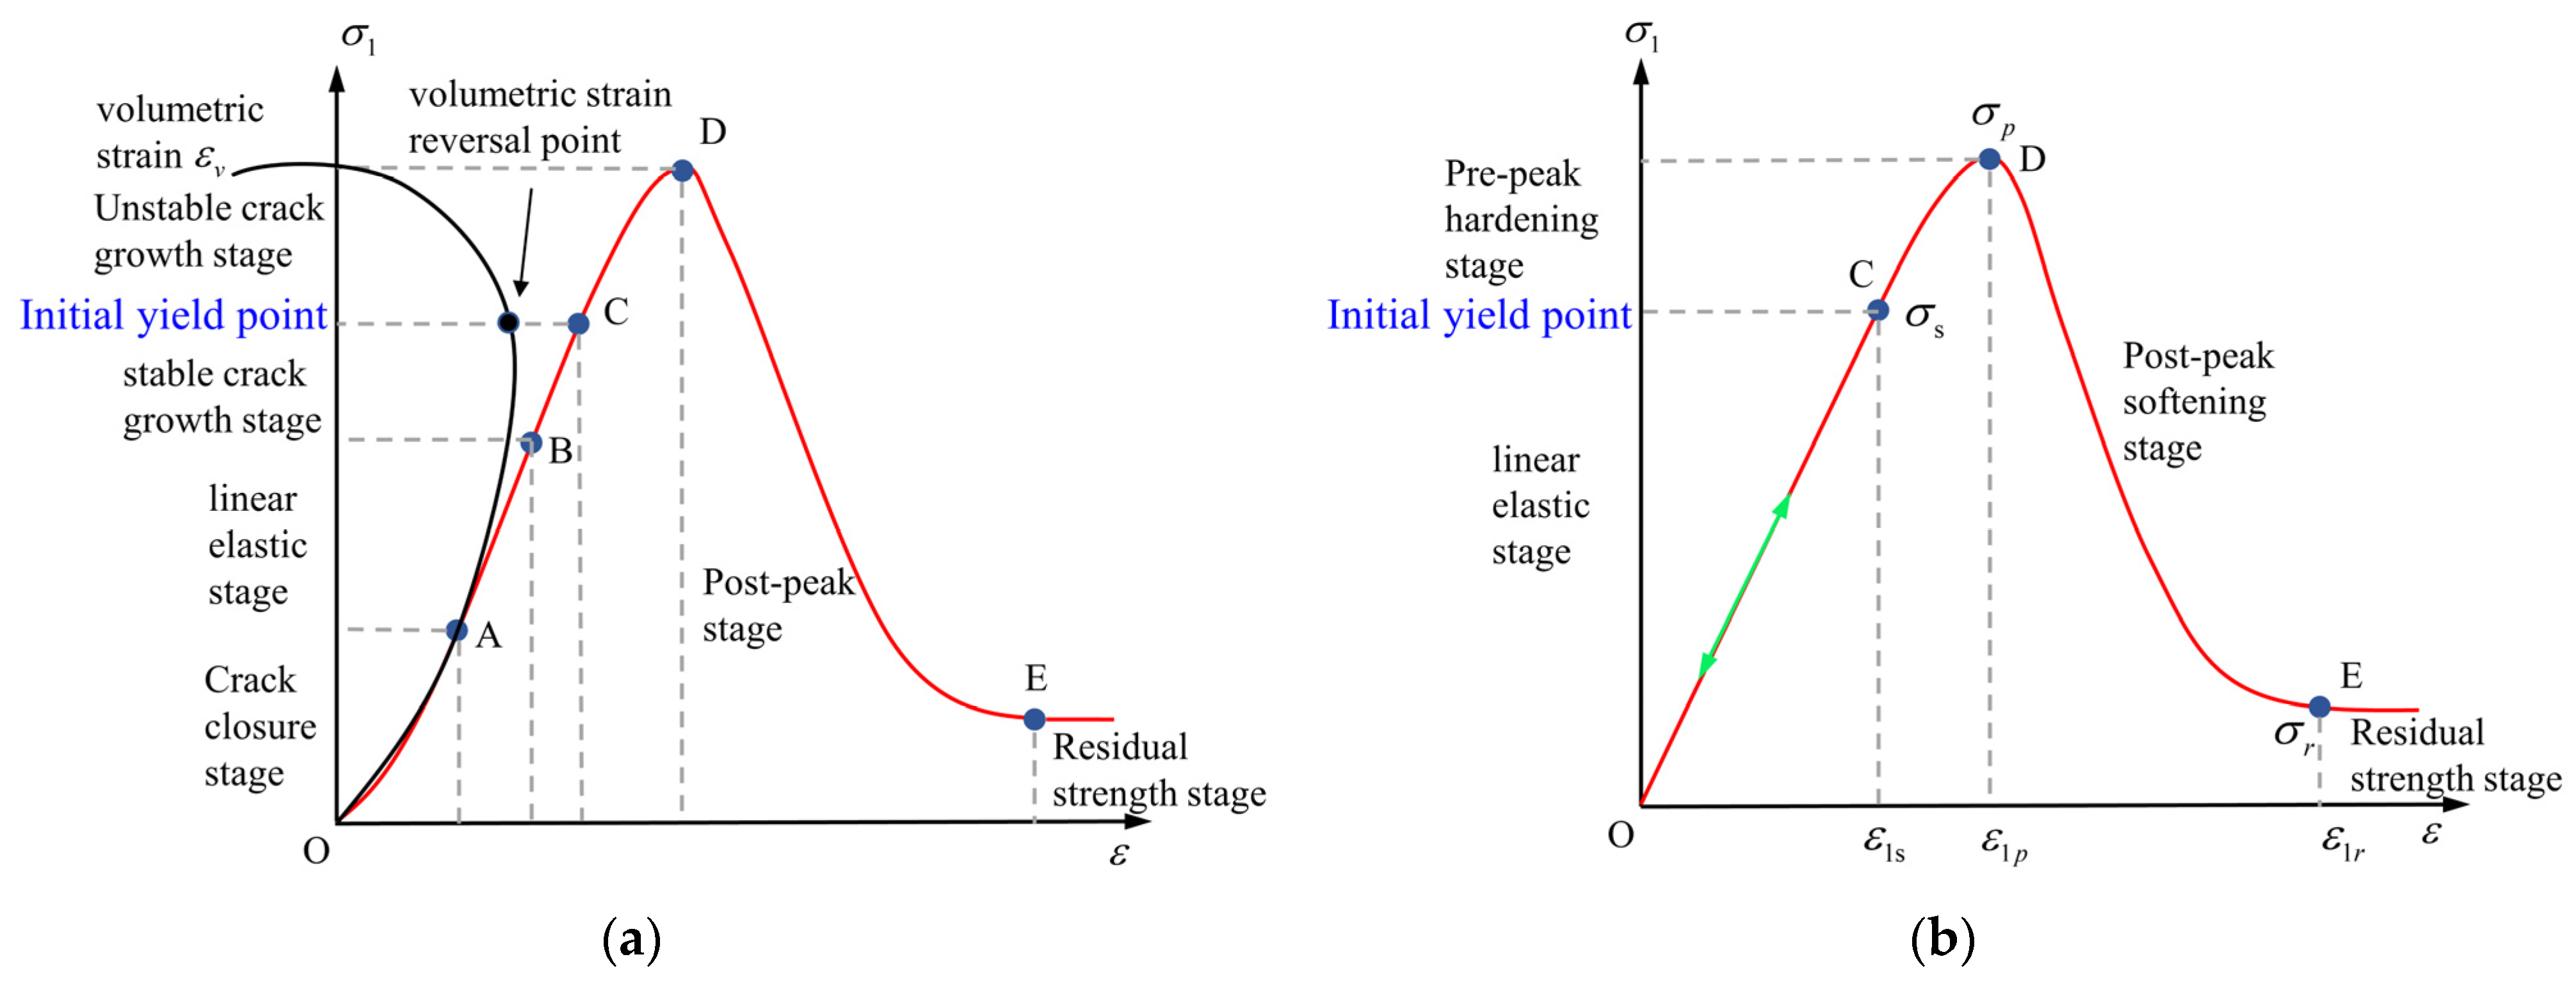
2. Simplification of the Complete Stress-Strain Curve

To analyse the strain hardening and softening characteristics of hard brittle rock before and after the peak, a reasonable simplification of the complete stress-strain curve for hard brittle rocks is needed. The characteristic stress at the reversal point of the volume–axial strain curve is taken as the initial yield point [31], as shown in Figure 1a, which is denoted by the initial yield stress σs. The initial yield stress σs, peak stress σp, and residual stress σr are regarded as segmentation points, and the typical complete stress-strain curve was idealised as a four-stage simplified complete stress-strain curve, which is a prerequisite for establishing a strain hardening and softening constitutive model. The simplified complete stress-strain curve covers the linear elastic stage, pre-peak hardening stage, post-peak softening stage and residual strength stage [32]. The simplified curve is shown in Figure 1b. Note that the OA-AB-BC segment of the curve in Figure 1a is simplified by a straight line (OC).
In addition, the following statement is made in this study:
The Mohr–Coulomb yield criterion, which has been widely adopted to describe the shear failure mechanism of rock [33,34,35,36], and based on this criterion, the strain hardening and softening constitutive model is studied. That is,
σ 1 = 1 + sin φ 1 sin φ σ 3 + 2 c cos φ 1 sin φ
where σ1 is the maximum principal stress; σ3 is the minimum principal stress; c is cohesion; and φ is the internal friction angle.

3. Mechanical Behaviour of Brittle Hard Rock

3.1. The Test Data of Granite and Diabase

The test data of granite and diabase are obtained from published references [26] and [37], respectively. The granite samples [26] were collected from the borehole of BS19 in Beishan of Gansu province, China, with a sampling depth of 450–455 m. Beishan granite has good uniformity and compactness. The mineral composition of the rock is analysed by an optical microscope. Its main components are quartz, alkali feldspar, plagioclase, and biotite, and the rock is named monzogranite. The average dry density is 2690 kg/m3, and the longitudinal wave velocity is 5019 m/s. According to the standard requirements of the ISRM, the samples were prepared into standard specimens with a diameter of 50 mm and a high of 100 mm. The experiments were carried out on the dry rock sample at room temperature. The triaxial compression test was carried out on the MTS-815 rock mechanics test machine, and six series of tests at confining pressures of 0.2 MPa, 1 MPa, 3.5 MPa, 10 MPa, 20 MPa and 40 MPa were performed.
The diabase rock samples [37] were collected from the fresh rock mass of Danjiangkou Reservoir in Central China. The dry density is 2970 kg/m3, and the average porosity is 0.37%. Meanwhile, the water content is 0.059%, and the sample dimensions are Φ = 50 mm × h = 100 mm. All parameters were obtained by standard methods recommended in ISRM. Triaxial compression tests were carried out on an MTS testing machine, and four series of tests at confining pressures of 5 MPa, 10 MPa, 20 MPa and 40 MPa were performed, and all the experiments were carried out on the dry rock sample at room temperature.

3.2. Young’s Modulus and Poisson’s Ratio

Young’s modulus E and Poisson’s ratio μ of the rock under different confining pressures can be formulated by Equations (2) and (3) according to the linear elastic stage of the simplified stress-strain curve.
E = σ s ε 1 s
μ = | ε 3 s ε 1 s |
where σs is the initial yield stress of the rock and ε1s and ε3s are the axial and radial strains of the initial yield stress of the rock.
For most hard brittle rocks such as granite and diabase, the elastic stage is less affected by the confining pressure. Therefore, the average Young’s modulus Em and the average Poisson’s ratio μm are usually used to characterise Young’s modulus and Poisson’s ratio of rock under various confining pressures [38], and the average values are shown in Table 1.

3.3. Plastic Parameter

In FLAC3D, the equivalent plastic strain increment Δεps is used as the plastic parameter to describe the evolution process of the strength parameters in the softening regime and is defined as follows:
Δ ε p s = 1 2 ( Δ ε 1 p s Δ ε m p s ) 2 + ( Δ ε m p s ) 2 + ( Δ ε 3 p s Δ ε m p s ) 2
where Δ ε 1 p s and Δ ε 3 p s are the maximum and minimum principal plastic strain increments, and
Δ ε m p s = 1 3 ( Δ ε 1 p s + Δ ε 3 p s )
The plastic potential function gs corresponds to the noncorrelated flow rule, which can be expressed as follows:
g s = σ 1 σ 3 N ψ
where
N ψ = 1 + sin ψ 1 sin ψ
and ψ is the dilation angle of the rock. The principal plastic strain increment Δ ε i p s can be calculated as follows:
Δ ε i p s = λ s g s σ i , i = 1 , 2 , 3
where λs is the plastic multiplier, which cannot be calculated in this process. Substituting Equation (6) into Equation (26), the principal plastic strain increment Δ ε i p s can be written as follows:
Δ ε 1 p s = λ s
Δ ε 3 p s = λ s N ψ
Δ ε 3 p s = N ψ Δ ε 1 p s
Using Equation (10) above, Equation (4) becomes the following:
Δ ε p s = 3 3 1 + N ψ + N ψ 2 Δ ε 1 p s
If dilation angle ψ is constant, Nψ is also constant, and relation between εps and ε 1 p s can be established in the following form:
ε p s = 3 3 1 + N ψ + N ψ 2 Δ ε 1 p s = 3 3 1 + N ψ + N ψ 2 ε 1 p s
According to Equation (13), the axial plastic strain ε 1 p s can be used as a plastic parameter in FlAC3D to control the strength parameter evolution process in the strain hardening and softening stages [31].

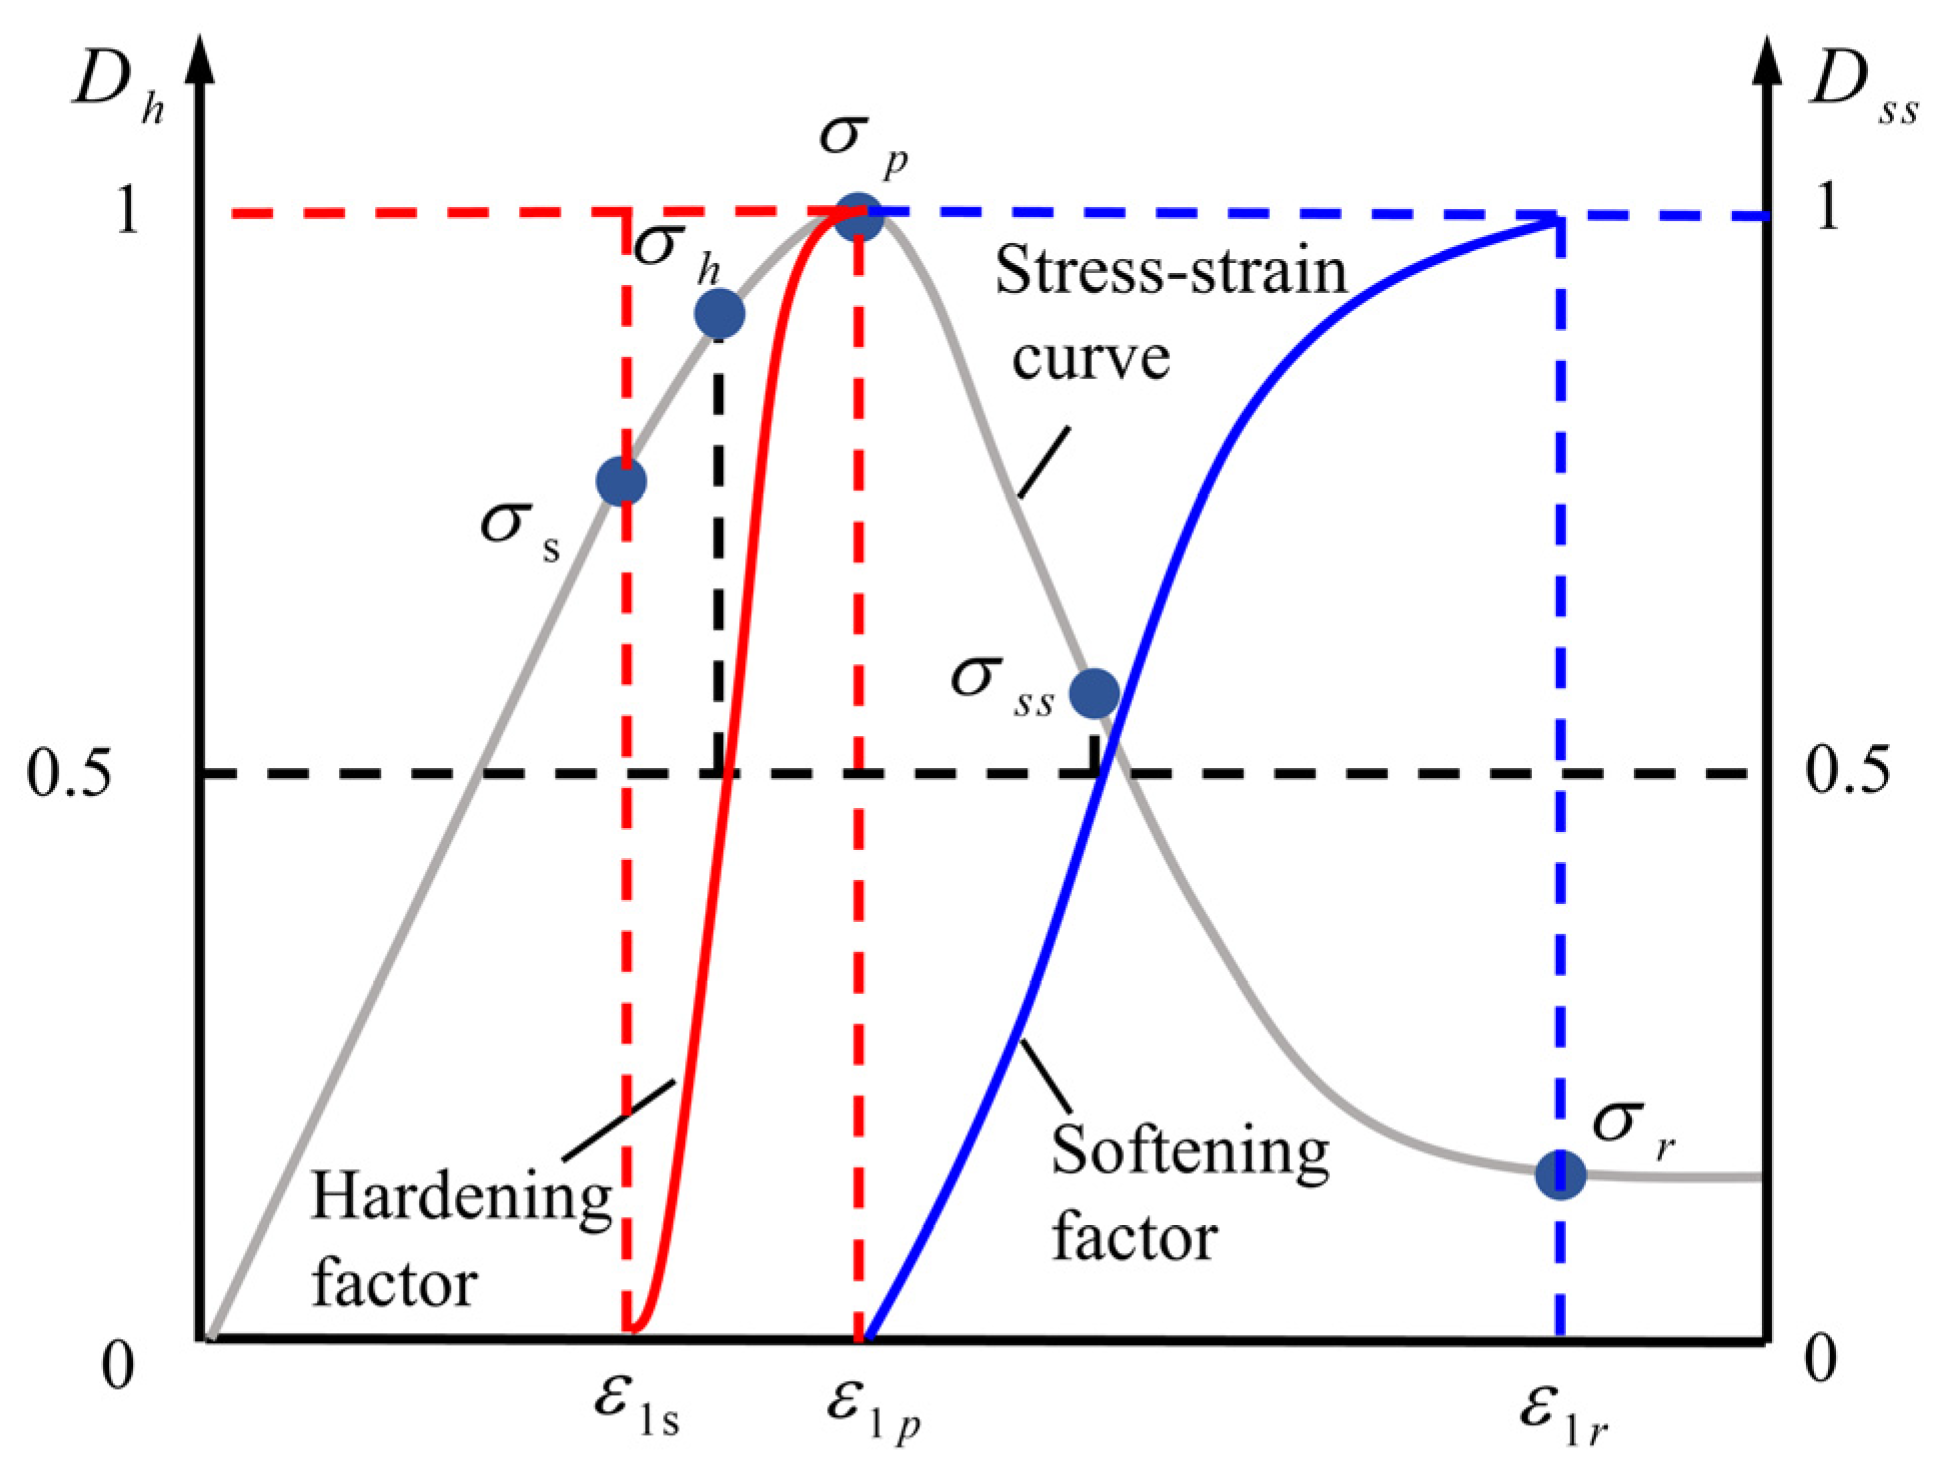
3.4. Normalised Hardening and Softening Factors

To obtain the stress value with the same yield state under each confining pressure and then discuss the relationship between the strength parameters and the axial plastic strain, the normalised hardening factor and softening factor are proposed to characterise a certain yield state corresponding to a certain stress value in the strain hardening and softening stages under different confining pressures. The initial yield stress, peak stress and residual stress are regarded as the stress values corresponding to the initial yield state, peak yield state and residual yield state, respectively. Then, a certain stress value of one yield point under each confining pressure can also be regarded as the stress value corresponding to a certain yield state. According to reference [11,39], the normalised hardening factor and softening factor are defined to describe the yield state.
The hardening factor Dh is defined as the ratio of the difference between certain axial stress and the initial yield stress to the difference between the peak stress and the initial yield stress in the strain hardening process, i.e.,
D h = σ h σ s σ p σ s
where σp is the peak stress and σh is a certain axial stress of the strain hardening stage, σs < σh < σp.
The softening factor Dss is defined as the ratio of the difference between the peak stress and a certain axial stress and the difference between the peak stress and residual stress in the strain softening process, i.e.,
D s s = σ p σ ss σ p σ r
where σr is the residual stress and σss is a certain axial stress of the strain softening stage, σr < σss < σp.
When Dh = 0, the rock reaches the initial yield stress σs, plastic yielding occurs, and subsequently, the rock enters the strain hardening stage. The hardening factor increases with increasing axial stress. When the rock reaches the peak stress, the strain hardening stage ends and then enters the strain softening stage. The peak stress point is both the endpoint of the strain hardening stage and the starting point of the strain softening stage, that is, Dh = 1 and Dss = 0. As the post-peak stress gradually decreases, the softening factor gradually increases until it reaches 1, that is, Dss = 1. This indicates the end of the strain softening stage, and then the rock enters the residual stress stage, as shown in Figure 2. If the initial yield, peak and residual stress under each confining pressure are determined, the stress value corresponding to any hardening and softening factor under each confining pressure can be calculated accurately by Equations (14) and (15).

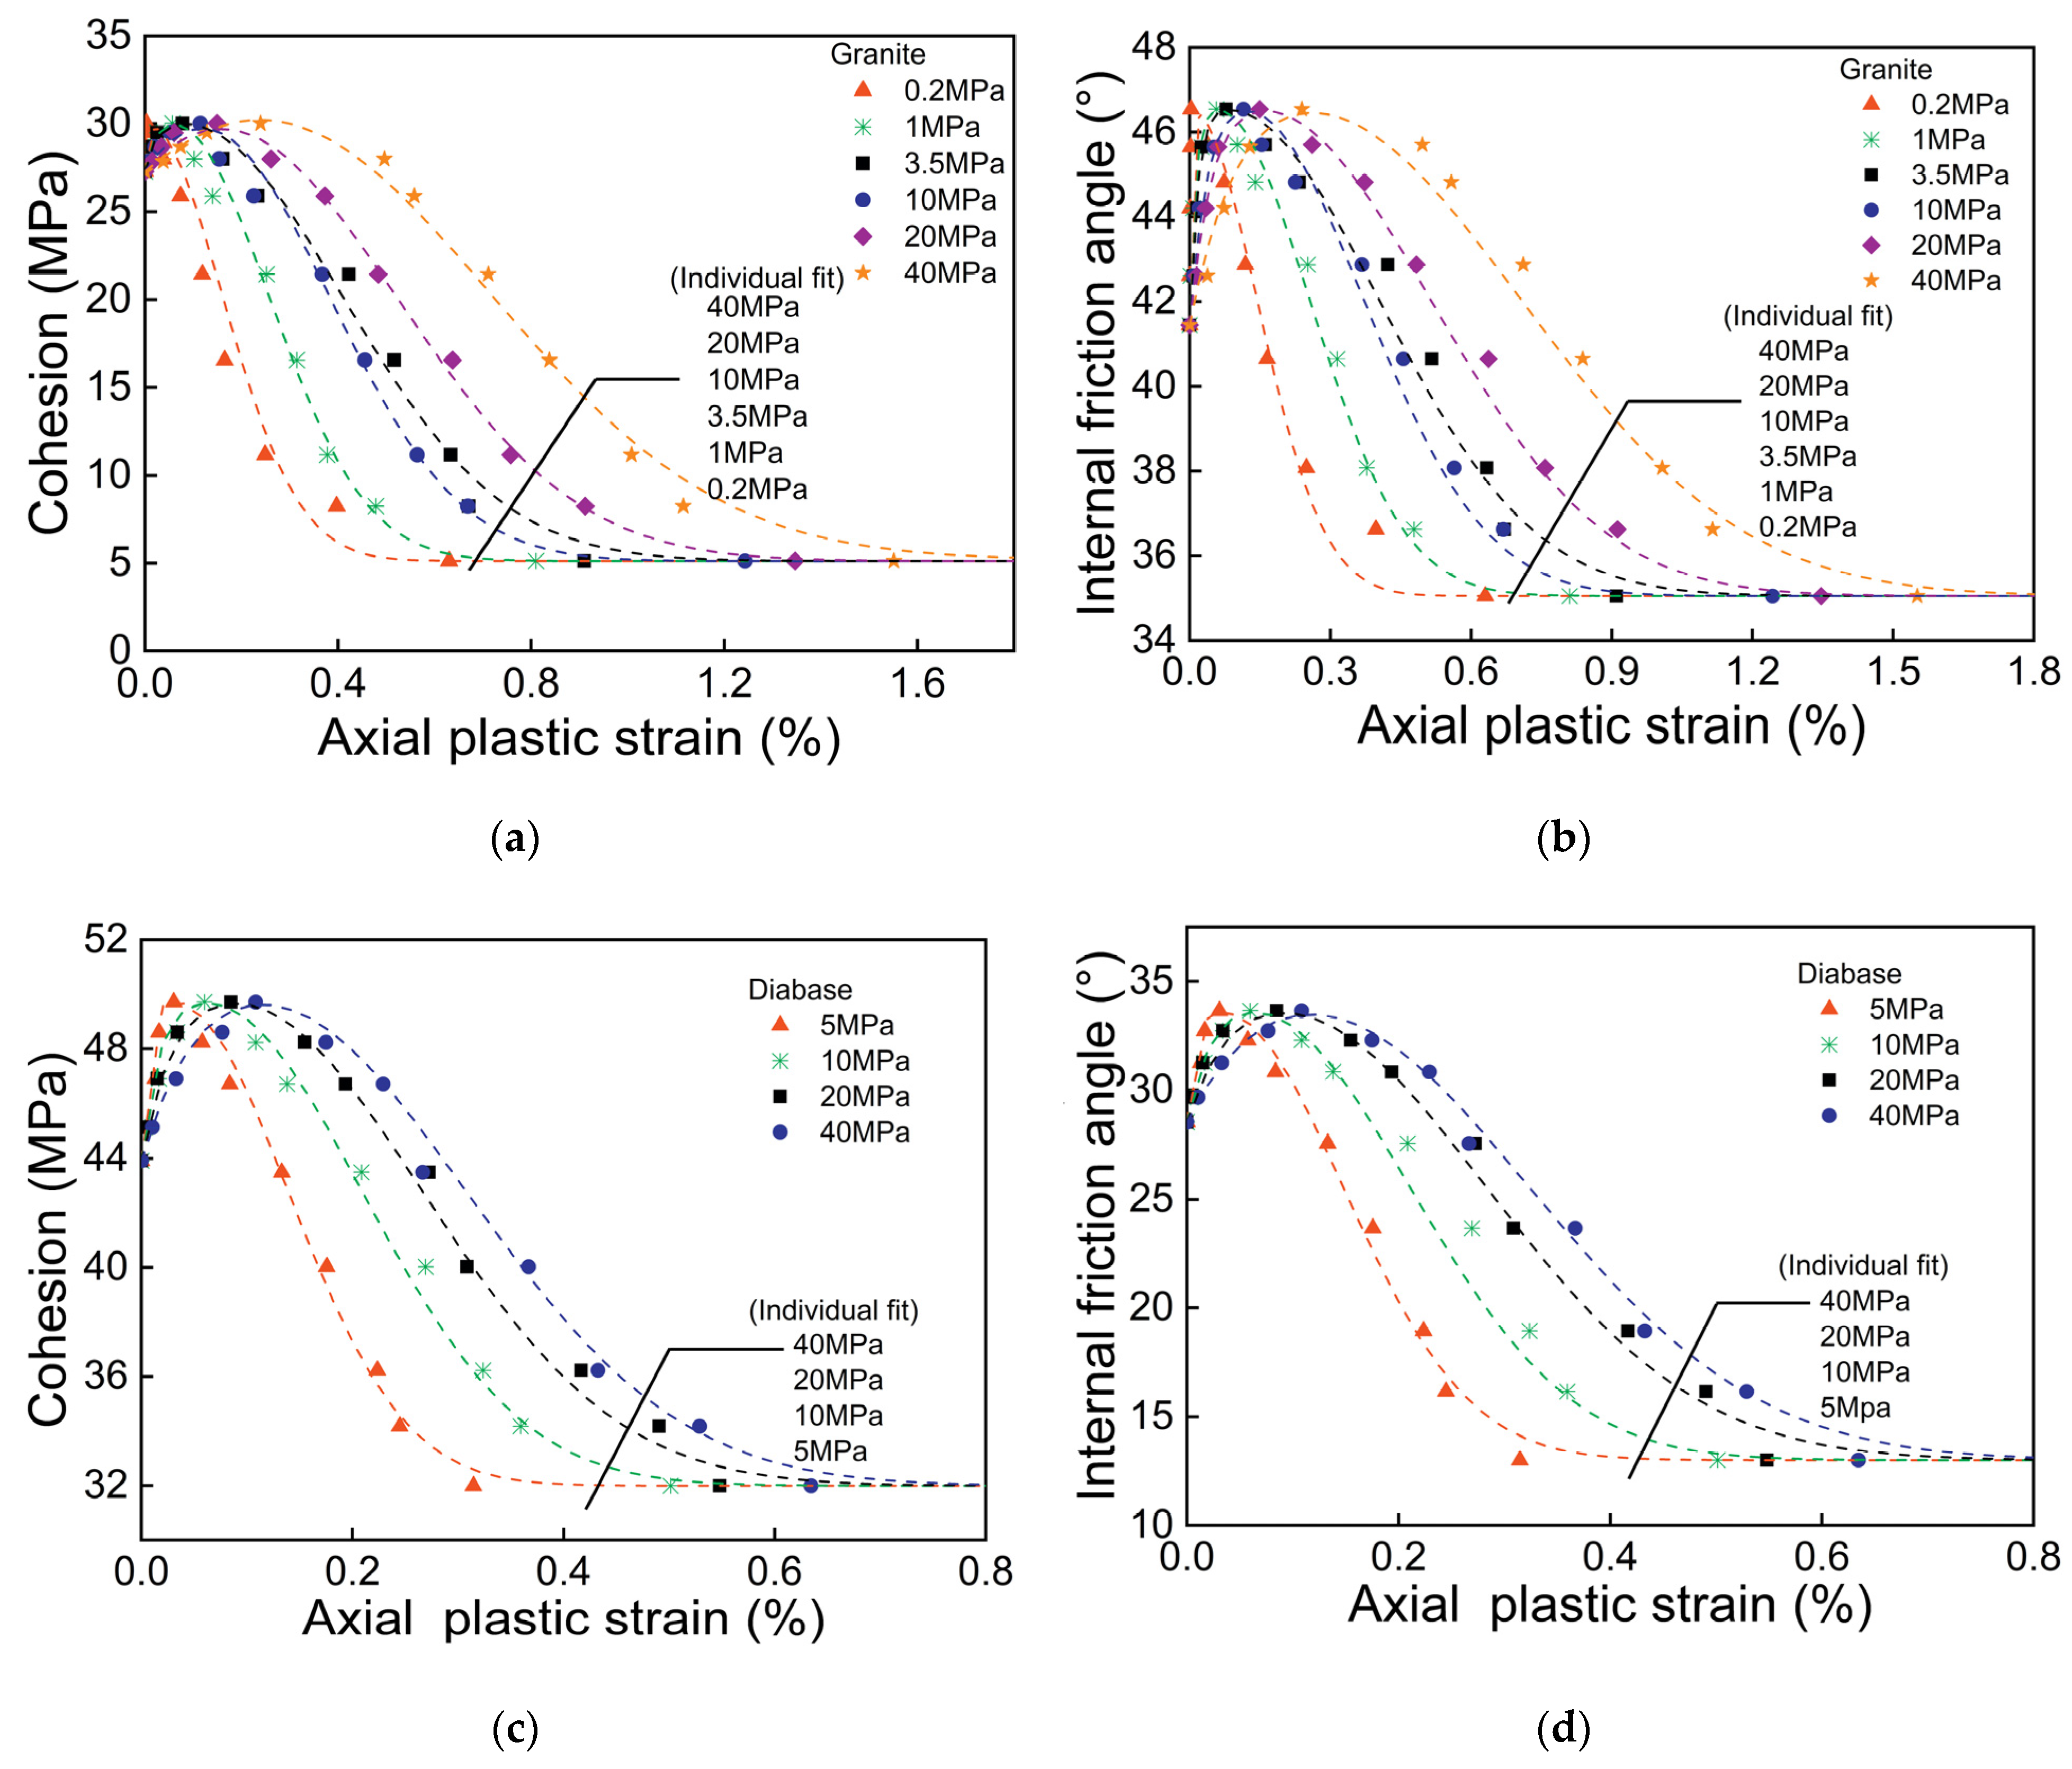
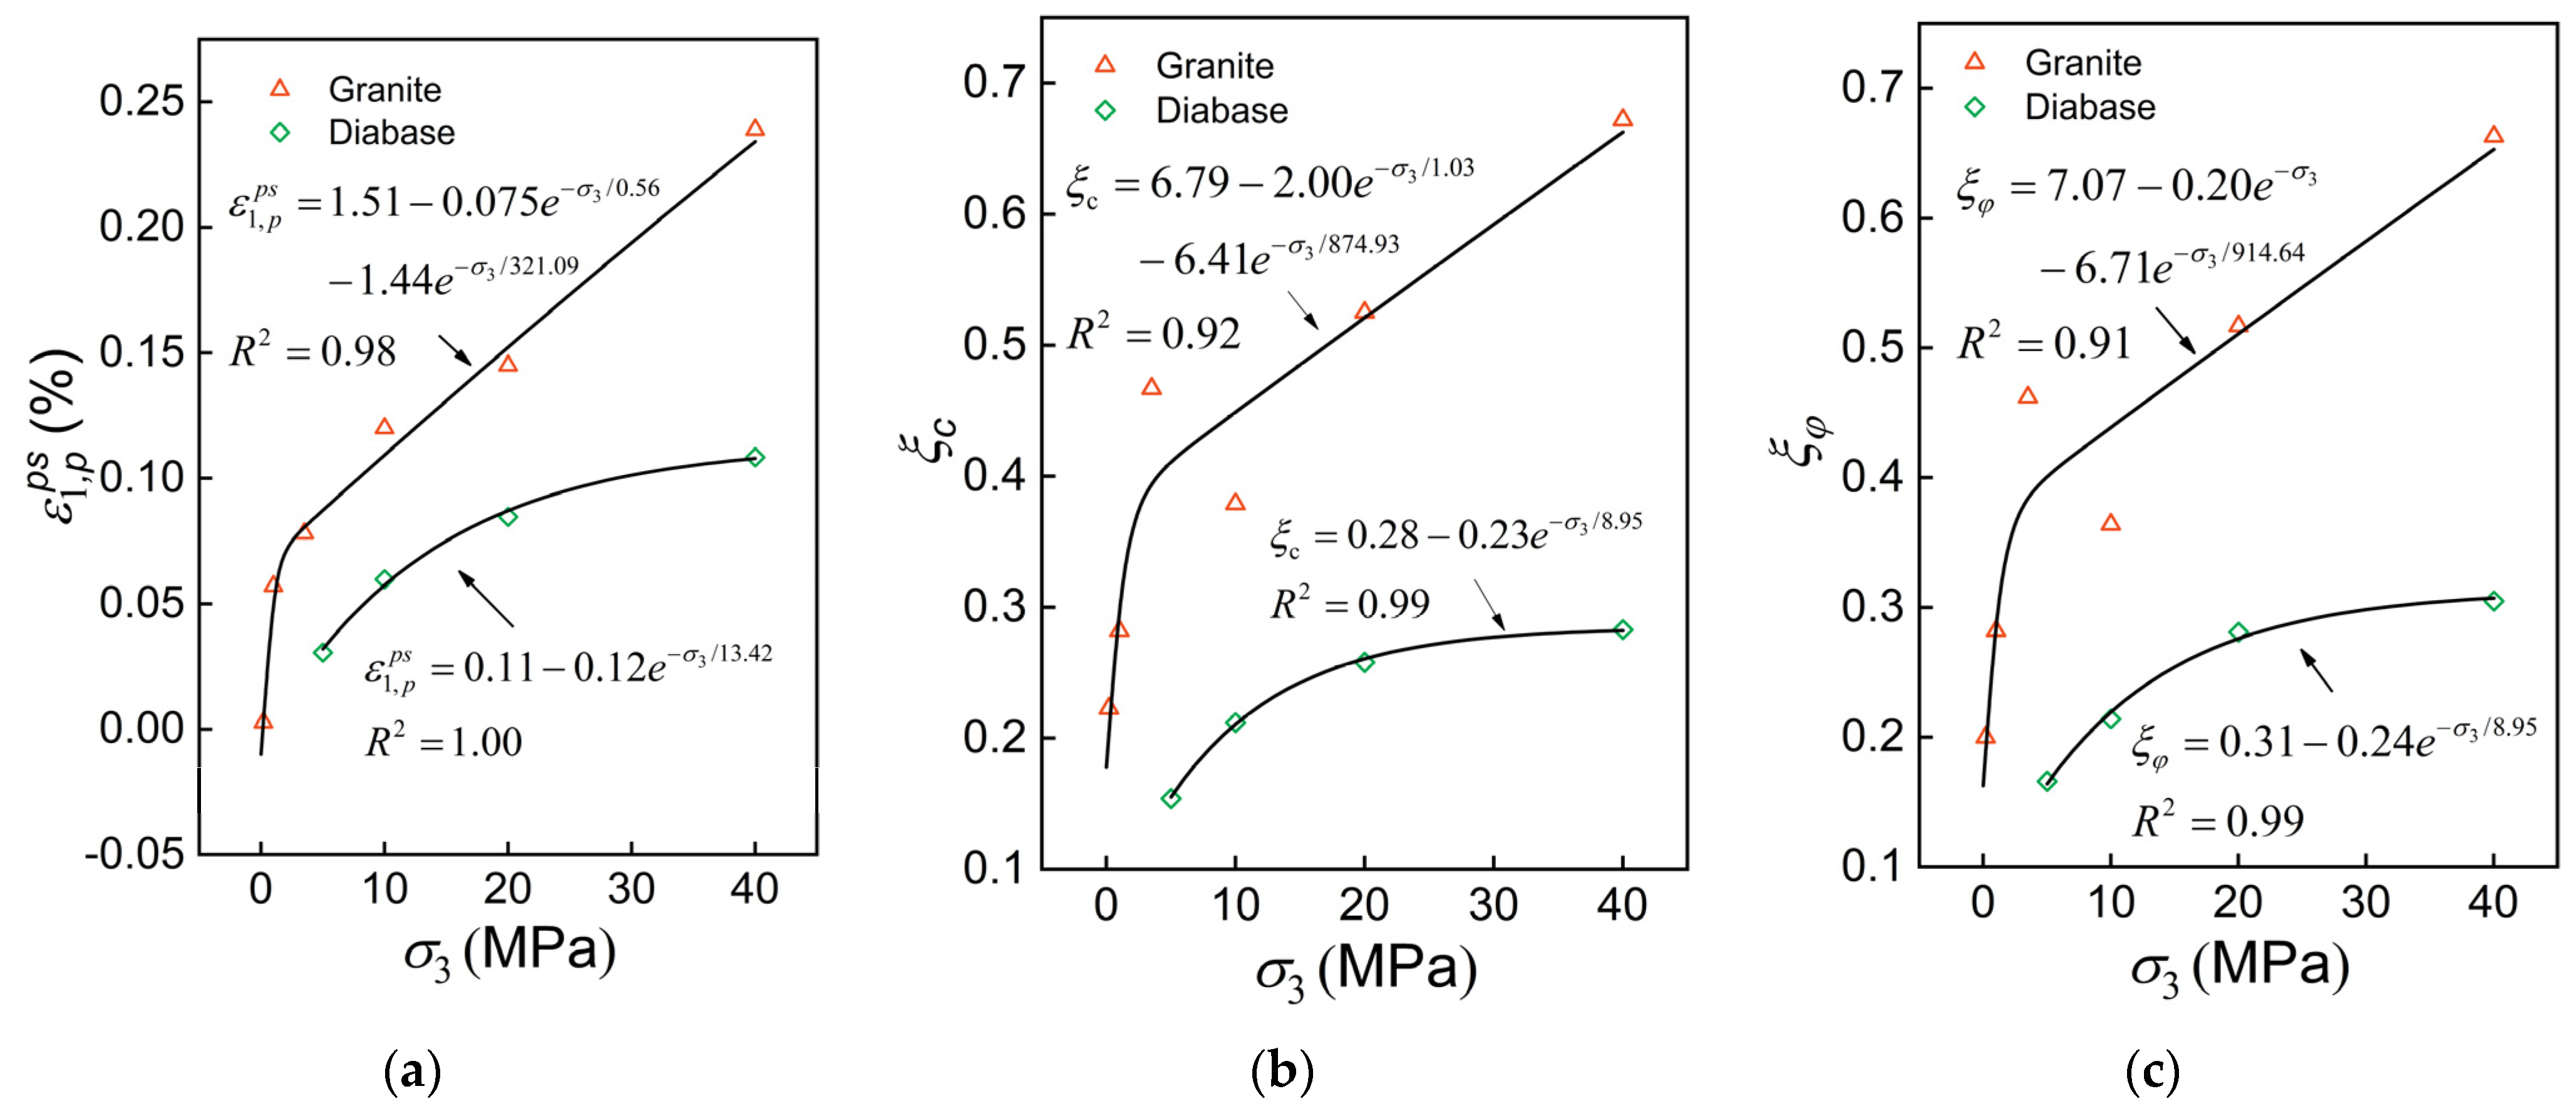
3.5. Strength Parameter Evolution Model

After the rock has reached the initial yield stress, plastic yielding begins to occur. Considering the axial strain ε1s at the initial yield stress as the zero point of the plastic parameter, the strength parameter and plastic parameter values under the same yield state are determined by the normalised hardening and softening factors based on the Mohr–Coulomb yield criterion. Then, a cohesion and internal friction angle evolution model under different confining pressures with respect to the axial plastic strain ε 1 p s is established. The modelling process is as follows:
(1) Establish the corresponding relationship between the hardening and softening factors and the axial plastic strain under different confining pressures.
Since the hardening and softening factors are defined by the ratio of the stress difference, it is appropriate to consider more points near the peak and residual stress where the stress changes less so that the points are more uniformly distributed on the stress curve. In this way, the evolution law of the strength parameters and axial plastic strain can be discussed better. Considering that less plastic deformation occurs in the strain hardening process than in the strain softening process, five hardening factors Dh = 0, 0.2, 0.5, 0.8, 1.0 and eight softening factors Dss = 0, 0.1, 0.2, 0.4, 0.6, 0.8, 0.9, 1.0 are selected and substituted into Equations (10) and (11), respectively, to obtain the twelve axial stresses under each confining pressure. The initial yield stress is taken as the starting point of the axial stress, and the relationship curve between the axial stress and axial plastic strain is established. The linear interpolation method is used for 12 axial stress values, and the data regarding the relationship between each hardening and softening factor and axial plastic strain under different confining pressures are approximately obtained. Beishan granite [26] data are shown as an example in Figure 3.
(2) Solve the cohesion c and internal friction angle φ corresponding to each hardening and softening factor under different confining pressures.
Based on the Mohr–Coulomb yield criterion, the axial stress and confining pressure of rock under different hardening and softening factors are substituted into the following equation as the maximum principal stress σ1 and the maximum principal stress σ3, respectively.
σ 1 = a σ 3 + b
where a is the slope and b is the intercept.
The coefficients a and b obtained by linear fitting can be substituted into Equations (17) and (18), as follows:
φ = arcsin ( a 1 a + 1 )
c = b 2 a
The cohesion c and internal friction angle φ of the rock under each hardening and softening factor can be calculated, as given in Table 2.
As Table 2 shows, the linear fitting results for axial stress and confining pressure under the same hardening and softening factors are good, and the fitting correlation coefficients are greater than 0.94, which conforms to the shear failure law of rock described by the Mohr–Coulomb yield criterion. It also shows that the hardening factor and softening factor can determine the stress values under the same yield state and different confining pressures.
(3) Strength parameter evolution model considering axial plastic strain and confining pressure.
After the above two steps, the one-to-one relationship between the strength parameters and the axial plastic strain for the same hardening and softening factors under different confining pressures can be obtained, so the relationship between the cohesion c and internal friction angle φ of two kinds of hard brittle rocks and the axial plastic strain considering the confining pressure can be captured. Figure 4a–d show the strength parameter relationship curves with both axial plastic strain and confining pressure for the granite and diabase samples.
As shown in Figure 4, the cohesion and internal friction angle evolution laws for granite and diabase are very similar under different confining pressures. On the one hand, with the increase in the axial plastic strain, the cohesion and internal friction angle values first increase and then decrease; on the other hand, with the increase in the confining pressure, the axial plastic strain at the peak and residual stress increase gradually. The reason is that the brittle failure of rock gradually transitions to plastic failure with increasing confining pressure. As far as one confining pressure is concerned, the cohesion and internal friction angle of both hard brittle rocks increase rapidly in the pre-peak hardening stage, decrease gradually in the post-peak strain softening stage and gradually become constant with increasing axial plastic strain. The reason is as follows: when the rock reaches the yield stress, unstable crack propagation occurs. Because the crack surface is rough and does not form a penetrating failure surface, the friction force and biting force between the cracks increase. At this time, the rock has not been damaged but continues to harden with the propagation of cracks [40]. As the load increases, more cracks form, grow, connect and slip in the rock sample; therefore, the cohesive strength and occlusal force between the cracks gradually decrease and finally tend to become stable [41].
According to the work of reference [42], a smooth and continuous Gaussian function can be adopted to describe the evolution law of the strength parameters of granite and diabase with respect to the axial plastic strain, as follows:
G ( ε 1 p s ) = ( c p c r ) exp [ ( ε 1 p s ε 1 , p p s ξ c ) 2 ] + c r
F ( ε 1 p s ) = ( φ p φ r ) exp [ ( ε 1 p s ε 1 , p p s ξ φ ) 2 ] + φ r
where cp and φp are the cohesion and internal friction angle at the peak stress of the rock and cr and φr are the cohesion and internal friction angle at the residual stress of the rock, respectively. ε 1 , p p s is the axial plastic strain at the peak stress of the rock under each confining pressure. ξc and ξφ are the cohesion and internal friction angle fitting parameters, which control the width of the model curve.
Although the Gaussian function can adequately describe the evolution process of the strength parameters in the strain softening and residual stages, there is still a considerable difference in the description of the evolution process of the strength parameters in the hardening stage. As shown in Figure 5, the difference between the value calculated by the Gaussian function and the experimental value decreases continuously with increasing axial plastic strain at the pre-peak hardening stage, and the difference value is zero at the peak stress. Therefore, Boltzmann’s sigmoid mathematical function is introduced to properly modify the Gaussian function to eliminate the difference in the Gaussian function at the strain hardening stage.
After the Gaussian function was modified, a unified strength parameter evolution model of cohesion/internal friction angle–axial plastic strain for two hard brittle rocks under different confining pressures can be expressed as follows:
c ( ε 1 p s ) = ( c p c r ) exp [ ( ε 1 p s ε 1 , p p s ξ c ) 2 ] 2 Δ X c 1 + exp ( | Δ X c | ε 1 p s / ε 1 , p p s ) 0.9 + c r
φ ( ε 1 p s ) = ( φ p φ r ) exp [ ( ε 1 p s ε 1 , p p s ξ φ ) 2 ] 2 Δ X φ 1 + exp ( | Δ X φ | ε 1 p s / ε 1 , p p s ) 0.9 + φ r
where:
Δ X c = G ( 0 ) c s
Δ X φ = F ( 0 ) φ s
where cs and φs are the cohesion and friction angle at the initial yield stress, respectively. G(0) and F(0) represent the initial cohesion and internal friction angle values calculated by Gaussian Equations (19) and (20). ΔXc and ΔXφ are temporary parameters, which represent the differences between the initial values calculated by Equations (19) and (20) and the experimental values.
The modified strength parameter evolution model has the following two advantages:
(i) It has fewer fitting parameters and a unified function form. The fitting parameters ξc and ξφ are obtained by Equations (19) and (20), respectively, and the temporary parameters ΔXc and ΔXφ can be calculated by entering the fitting parameters ξc and ξφ into Equations (23) and (24), respectively. The peak parameter ε 1 , p p s can be obtained from the axial plastic strain at the peak stress. cs and φs can be obtained by fitting the initial yield stress at each confining pressure. cp and φp can be obtained by fitting the peak stress at each confining pressure. cr and φr can be obtained by fitting the residual stress at each confining pressure. All fit coefficients for the cohesion/internal friction angle–axial plastic strain curves of granite and diabase are shown in Table 3.
(ii) The model can smoothly simulate the nonlinear cohesion and internal friction angle processes in the pre-peak hardening stage and the post-peak softening stage, as shown in Figure 4a–d. Compared with the Gaussian function before correction, the modified model can compensate for the disadvantage that the strength parameter evolution process in the pre-peak hardening stage cannot be accurately described, as shown in Figure 5. The fitting correlation coefficients of the strength parameter evolution model are mostly distributed in the range from 0.96 to 1.00 (Table 3), which illustrates that the established strength parameter evolution model is correct and reasonable.
As Table 3 shows, the peak parameter ε 1 , p p s and the fitting parameters ξc and ξφ gradually increase with increasing confining pressure. The reason is that the rock has more obvious plastic characteristics under high confining pressures, and more plastic deformation occurs after reaching the peak and residual stresses, so the peak parameter ε 1 , p p s becomes larger and the stress-strain curve appears wider, and the fitting parameters ξc and ξφ, which control the width of the model, also increase gradually with increasing confining pressure. The confining pressure dependence of ε 1 , p p s , ξc and ξφ can be observed in Figure 6. The variations in these parameters with confining pressures can be described by a unified empirical function, as follows:
P ( σ 3 ) = P 0 A 1 e σ 3 / t 1 A 2 e σ 3 / t 2
where P represents one of the parameters ε 1 , p p s , ξc or ξφ. P0, A1, A2, t1, and t2 are fitting coefficients, and all values are positive. In addition, P0 represents the range of the confining pressure function; A1 and A2 jointly control the increase in the amplitude of the confining pressure function; and t1 and t2 jointly control the growth rate of the confining pressure function. The fitting coefficients of each parameter are shown in Table 4, and their fitting curves are shown in Figure 6. The fitting correlation coefficients of each parameter are all greater than 0.9, which indicates that the confining pressure function Equation (25) can satisfactorily describe the relationship between parameters ε 1 , p p s , ξc and ξφ with various confining pressures.
According to Equations (21)−(25), an overall fit for granite and diabase is created to illustrate the strength parameter evolution model that considers both axial plastic strain and confining pressure simultaneously. As shown in Figure 7a–d, the results of the overall fit using the strength parameter evolution model are in good agreement with the individual fit results using the experimental data. With increasing confining pressure, the strength parameters first increase and then decrease, accurately describing the initial, peak and residual strength values. The strength parameters at the peak points gradually shift to the right, and the model curve tends to increase in width, which means that the failure mode of hard brittle rock transitions from brittle failure to plastic failure under high confining pressures.

4. Establishment and Verification of the Constitutive Model

4.1. Establishment of the Constitutive Model

In FLAC3D, the strain hardening and softening constitutive model considering confining pressures is coded by the C++ language. The new stress vector σN of the current step can be calculated from the stress vector σp of the previous step and the strain increment vector Δε of the current step.
First, the elastic guess stress σ i I is defined as follows:
σ i I = σ i p + S i Δ ε i , i = 1 , 2 , 3
S i = [ K + 4 3 G K 2 3 G K 2 3 G K 2 3 G K + 4 3 G K 2 3 G K 2 3 G K 2 3 G K + 4 3 G ]
where Si is the elastic stiffness matrix, K is the bulk modulus, and G is the shear modulus.
Δεi is the total principal strain increment, which can be calculated as the sum of the principal elastic strain increment Δ ε i e and the principal plastic strain increment Δ ε i p s , as follows:
Δ ε i = Δ ε i e + Δ ε i p s
For the elastic part, the principal elastic strain increment Δ ε i e and the principal stress increment Δσi follow Hooke’s law, as follows:
Δ σ i = S i ( Δ ε i e ) , i = 1 , 2 , 3
Second, judge whether the simulation element is yielded. The maximum principal guess stress σ 1 I and the minimum principal guess stress σ 3 N are substituted into the yield criterion to judge whether the element is yielded. In FLAC3D, the Mohr–Coulomb yield criterion is given as follows:
f s = σ 1 σ 3 1 + sin φ 1 sin φ + 2 c 1 + sin φ 1 sin φ
Third, if the element is yielded, then its stress should be updated. Substituting Equations (28) and (29) into Equation (8), the principal stress increment Δσi would be recalculated as follows:
Δ σ i = S i ( Δ ε i e ) = S i ( Δ ε i ) λ s S i ( g s σ i ) , i = 1 , 2 , 3
The principal stress σ i N of the current step can be expressed as follows:
σ i N = σ i p + Δ σ i , i = 1 , 2 , 3
Substituting Equations (26) and (31) into Equation (32), the principal stress σ i N of the current step can be written as follows:
σ i N = σ i I λ s S i ( g s σ i ) , i = 1 , 2 , 3
In FLAC3D, when the element yields, the position of the principal stress point of the current step is on the yield surface, which can be expressed as follows:
f s ( σ 1 N , σ 3 N ) = 0
where σ i N and σ 3 N are the maximum and minimum principal stresses of the current step, respectively. Substituting Equations (8), (26)–(30) and (33) into Equation (34), a formula for plastic multiplier λs can be written as follows:
λ s = f s ( σ 1 I , σ 3 I ) ( α 1 α 2 N ψ ) ( α 1 N ψ + α 2 ) N ψ
α 1 = K + 4 3 G
α 2 = K + 2 3 G  
According to Equation (12), the maximum principal plastic strain increment Δ ε 1 p s can be calculated. Meanwhile, the maximum principal plastic strain/axial plastic strain ε 1 p s can also be obtained as follows:
ε 1 p s = ε 1 p , p s + Δ ε 1 p s
Δ ε 1 p s = 3 Δ ε p s 1 + N ψ + N ψ 2
where ε 1 p , p s is the accumulated maximum principal plastic strain of the previous step. Substituting the accumulated maximum principal plastic strain ε 1 p s into Equations (21) and (22), we can update the strength parameter value and proceed to the next loop, as shown in Figure 8. To study the effect of the strength parameter evolution law of the strain hardening and softening constitutive model and to simplify the numerical calculation, a common consideration of the dilation angle results can be calculated by equation ψ = φ − 20° [43]. For the employed granite and diabase, the internal friction angle at peak stress can be used for calculation, and the dilation angle ψ = 26° and ψ = 13° is considered, respectively [27].
Finally, the prepared program file can be transformed into a dynamic link library file (.dll file) and copied to the FLAC3D installation directory, so the model file can be invoked from the command line.

4.2. Verification

To verify the rationality of the strain hardening and softening constitutive model for hard brittle rocks under different confining pressures, triaxial compression tests on granite and diabase are simulated using FLAC3D software. Because the numerical model carries a uniform load, the number of elements in the numerical model has little influence on the simulation results [44], and only a single-grid model (1 m3) is established, as shown in Figure 9. The boundary conditions are as follows:
(i) The displacement at the bottom boundary is restricted when the model runs;
(ii) A stress σx = σy is applied to the surface of the model to simulate the confining pressure;
(iii) A constant displacement velocity uz (10−8 m/step) is applied to the upper surface of the model to simulate axial displacement loading.
Numerical triaxial compression tests are performed on Beishan granite [26] under six confining pressures (σx = 0.2 MPa, 1.0 MPa, 3.5 MPa, 10 MPa, 20 MPa and 40 MPa) and on diabase [37] under four confining pressures (σx = 5 MPa, 10 MPa, 20 MPa and 40 MPa). The complete stress-strain curves of the two hard brittle rocks under different confining pressures are shown in Figure 10.
Figure 10 illustrates that the simulated results agree well with the test data. The initial yield stress, peak stress, peak strain and residual stress values at different confining pressures, especially at 0.2 MPa, 1.0 MPa, 20 MPa and 40 MPa for granite and 5 MPa, 10 MPa and 40 MPa for diabase are satisfactorily captured by the strain hardening and softening model, which demonstrates that the proposed constitutive model can describe the nonlinear behaviour of rock. The constitutive model can adequately capture the transition from brittle failure to plastic failure under high confining pressures and well describe the confining pressure-dependent characteristics of hard brittle rocks, which verifies the rationality and correctness of the strain hardening and softening constitutive model for hard brittle rocks under different confining pressures. It should be noted that the simulated peak stress for granite at 10 MPa in Figure 10a differs significantly from the experimental peak stress. This occurs due to the deviation in fitting the peak stress of each confining pressure with the Mohr–Coulomb linear yield criterion. In addition, the discrete experimental data may result in deviations when fitting the width parameters ξc and ξφ with the discrete data of the confining pressures, so the post-peak softening behaviours at a few confining pressure values (e.g., granite at 3.5 MPa, diabase at 20 MPa) are inconsistent with the true experimental curve.

5. Conclusions

According to the triaxial compression test data of hard brittle rocks such as granite and diabase, a strain hardening and softening constitutive model for hard brittle rocks is proposed. The normalised hardening factor and softening factor are defined, which can satisfactorily characterise the same yield state under different confining pressures. The relationship between the hardening and softening factors, cohesion, the internal friction angle and axial plastic strain can be easily obtained by linear interpolation. Based on the Mohr–Coulomb yield criterion, a strength parameter evolution model modified by the sigmoid function is proposed to consider the influence of various confining pressures, which can well describe the real evolution of the strength parameter during the process of rock from yield to failure.
The code of the strain hardening and softening constitutive model is written, and the secondary development of the constitutive model is implemented. Triaxial compression simulation tests are conducted on granite and diabase. The simulation results show that the constitutive model can satisfactorily capture the nonlinear behaviour of rocks, including the strain hardening behaviour before the peak stress and strain softening behaviour after peak stress, the tendency to change from brittle failure to plastic failure, and the effect of different confining pressures on stress-strain curves. The results presented in this study can provide preliminary guidance for determining the strength and strain of hard brittle rocks in the hardening and softening stages. In addition, to simplify the numerical calculation, the dilation angle ψ is assumed to be constant [36]. In future research, a mobilised dilation angle model will be considered to predict the deformation of the tunnel's working face.

Author Contributions

Methodology, J.C., L.C. and W.W.; software, J.C. and L.C.; validation, J.C. and L.C.; formal analysis, W.W. and L.C.; investigation, W.W.; data curation, J.C.; writing—original draft, J.C. and L.C.; writing—review and editing, J.C. and W.W. All authors have read and agreed to the published version of the manuscript.

Funding

This paper received its funding from Project (2022YFC2903901) supported by the National Key R&D Program of China; Projects (52074350) supported by the National Natural Science Foundation of China.

Institutional Review Board Statement

Not applicable.

Informed Consent Statement

Not applicable.

Data Availability Statement

The data used to support the findings of this study are available from the corresponding author upon request.

Conflicts of Interest

The authors declare no conflict of interest.

Abbreviations

cCohesion
φInternal friction angle
cs, cp and crCohesion of initial yield stress, peak stress and residual stress
φs, φp, and φrInternal friction angle of initial yield stress, peak stress and residual stress
EYoung’s modulus
EmAverage Young’s modulus
μPoisson’s ratio
μmAverage Poisson’s ratio
σiPrincipal stress (i = 1, 2, 3)
σhA certain axial stress of the strain hardening stage
σssA certain axial stress of the strain softening stage
σ i I Elastic guess stress (i = 1, 2, 3)
σNNew stress vector of the current step
σpStress vector of the previous step
σs, σp, and σrInitial yield stress, peak stress and residual stress
ε1pAxial strain of peak stress
ε1rAxial strain of residual stress
εpsEquivalent plastic strain
ε 1 , p p s Peak parameter (axial plastic strain of peak stress)
ε i p s Principal plastic strain (i = 1, 2, 3)
ε 1 p , p s Accumulated maximum principal plastic strain of the previous step (i = 1, 2, 3)
ε1s and ε3sAxial and radial strains of the initial yield stress
ΔσiPrincipal stress increment (i = 1, 2, 3)
ΔεpsEquivalent plastic strain increment
ΔεiTotal principal strain increment (i = 1, 2, 3)
Δ ε i e Principal elastic strain increment (i = 1, 2, 3)
Δ ε i p s Principal plastic strain increment (i = 1, 2, 3)
ΔεStrain increment vector of the current step
DhHardening factor
DssSoftening factor
G( ε 1 p s )Gaussian function associated with the cohesive
F( ε 1 p s )Gaussian function associated with the internal friction angle
c( ε 1 p s )Modified Gaussian function associated with the cohesive
φ( ε 1 p s )Modified Gaussian function associated with the internal friction angle
P(σ3)Function associated with the confining pressure
ΔXcTemporary parameter associated with the cohesive
ΔXφTemporary parameter associated with the internal friction angle
ξcFitting parameter associated with the cohesive
ξφFitting parameter associated with the internal friction angle
P0Fitting coefficient
A1Fitting coefficient
A2Fitting coefficient
t1Fitting coefficient
t2Fitting coefficient
aFitting parameter
bFitting parameter
R2Fitting correlation coefficients
SiElastic stiffness matrix
KBulk modulus
GShear modulus

References

  1. Brücker, C.; Preuße, A. The future of underground spatial planning and the resulting potential risks from the point of view of mining subsidence engineering. Int. J. Min. Sci. Technol. 2020, 30, 93–98. [Google Scholar] [CrossRef]
  2. Bewick, R.P. The strength of massive to moderately jointed rock and its application to cave mining. Rock Mech. Rock Eng. 2021, 54, 3629–3661. [Google Scholar] [CrossRef]
  3. Martino, J.B.; Chandler, N.A. Excavation-induced damage studies at the Underground Research Laboratory. Int. J. Rock Mech. Min. Sci. 2004, 41, 1413–1426. [Google Scholar] [CrossRef]
  4. Gurocak, Z. Analyses of stability and support design for a diversion tunnel at the Kapikaya dam site, Turkey. Bull. Eng. Geol. Environ. 2011, 70, 41–52. [Google Scholar] [CrossRef]
  5. Walton, G.; Hedayat, A.; Kim, E.; Labrie, D. Post-yield strength and dilatancy evolution across the brittle–ductile transition in indiana limestone. Rock Mech. Rock Eng. 2017, 50, 1691–1710. [Google Scholar] [CrossRef]
  6. Alonso, E.; Alejano, L.; Varas, F.; Fdez-Manin, G.; Carranza-Torres, C. Ground response curves for rock masses exhibiting strain-softening behavior. Int. J. Numer. Anal. Methods Geomech. 2003, 27, 1153–1185. [Google Scholar] [CrossRef]
  7. Wang, Z.; Li, Y.; Wang, J.G. A damage-softening statistical constitutive model considering rock residual strength. Comput. Geosci. 2007, 33, 1–9. [Google Scholar] [CrossRef]
  8. Huang, S.; Zhang, C.; Ding, X. Hardening-softening constitutive model of hard brittle rocks considering dilatant effects and safety evaluation index. Acta Mech. Solida Sin. 2020, 33, 121–140. [Google Scholar] [CrossRef]
  9. Vakili, A. An improved unified constitutive model for rock material and guidelines for its application in numerical modelling. Comput. Geotech. 2016, 80, 261–282. [Google Scholar] [CrossRef]
  10. Walton, G.; Diederichs, M.S. A new model for the dilation of brittle rocks based on laboratory compression test data with separate treatment of dilatancy mobilization and decay. Geotech. Geol. Eng. 2015, 33, 661–679. [Google Scholar] [CrossRef]
  11. Xiao, Y.; Qiao, Y.; He, M.; Li, H.; Cheng, T.; Tang, J. A unified strain-hardening and strain-softening elastoplastic constitutive model for intact rocks. Comput. Geotech. 2022, 148, 104772. [Google Scholar] [CrossRef]
  12. Zhao, X.G.; Cai, M. A mobilized dilation angle model for rocks. Int. J. Rock Mech. Min. 2010, 47, 368–384. [Google Scholar] [CrossRef]
  13. Zhang, K.; Zhou, H.; Shao, J. An experimental investigation and an elastoplastic constitutive model for a porous rock. Rock Mech. Rock Eng. 2013, 46, 1499–1511. [Google Scholar] [CrossRef]
  14. Fang, Z.; Harrison, J.P. A mechanical degradation index for rock. Int. J. Rock Mech. Min. 2001, 38, 1193–1199. [Google Scholar] [CrossRef]
  15. Zhang, C.H.; Zheng, X.M. Strain softening and permeability evolution model of loaded rock and experimental verification. Chin. J. Rock Mech. Eng. 2016, 38, 1125–1132. [Google Scholar]
  16. Alejano, L.R.; Rodriguez-Dono, A.; Alonso, E.; Manín, G.F. Ground reaction curves for tunnels excavated in different quality rock masses showing several types of post-failure behaviour. Tunn. Undergr. Space Technol. 2009, 24, 689–705. [Google Scholar] [CrossRef]
  17. Lee, Y.K.; Pietruszczak, S. A new numerical procedure for elasto-plastic analysis of a circular opening excavated in a strain-softening rock mass. Tunn. Undergr. Space Technol. 2008, 23, 588–599. [Google Scholar] [CrossRef]
  18. Fahimifar, A.; Zareifard, M.R. A new elasto-plastic solution for analysis of underwater tunnels considering strain-dependent permeability. Struct. Infrastruct. Eng. 2014, 10, 1432–1450. [Google Scholar] [CrossRef]
  19. Ranjbarnia, M.; Fahimifar, A.; Oreste, P. Analysis of non-linear strain-softening behaviour around tunnels. Proc. Inst. Civ. Eng.-Geotech. Eng. 2015, 168, 16–30. [Google Scholar] [CrossRef]
  20. Li, W.T.; Li, S.C.; Feng, X.D.; Li, S.C.; Yuan, C. Study on mechanical behavior of post-peak strain softening of rocks based on mohr-coulomb criterion. Chin. J. Rock Mech. Eng. 2011, 30, 1460–1466. [Google Scholar]
  21. Pourhosseini, O.; Shabanimashcool, M. Development of an elasto-plastic constitutive model for intact rocks. Int. J. Rock Mech. Min. Sci. 2014, 66, 1–12. [Google Scholar] [CrossRef]
  22. Sharan, S.K. Elastic–brittle–plastic analysis of circular openings in Hoek–Brown media. Int. J. Rock Mech. Min. Sci. 2003, 40, 817–824. [Google Scholar] [CrossRef]
  23. Hajiabdolmajid, V.; Kaiser, P.K.; Martin, C.D. Modelling brittle failure of rock. Int. J. Rock Mech. Min. 2002, 39, 731–741. [Google Scholar] [CrossRef]
  24. Walton, G. Initial guidelines for the selection of input parameters for Cohesion-Weakening-Friction-Strengthening (CWFS) analysis of excavations in brittle rock. Tunn. Undergr. Space Technol. 2019, 84, 189–200. [Google Scholar] [CrossRef]
  25. Rafiei Renani, H.; Martin, C.D. Cohesion degradation and friction mobilization in brittle failure of rocks. Int. J. Rock Mech. Min. Sci. 2018, 106, 1–13. [Google Scholar] [CrossRef]
  26. Li, P.F.; Zhao, X.G.; Guo, Z.; Ma, L.K.; Chen, L.; Wang, J. Variation of strength parameters of Beishan granite under triaxial compression. Chin. J. Rock Mech. Eng. 2017, 36, 1599–1610. [Google Scholar]
  27. Min, M.; Jiang, B.; Lu, M.; Long, J.; Zhang, Q. An improved strain-softening model for Beishan granite considering the degradation of elastic modulus. Arab. J. Geosci. 2020, 13, 244. [Google Scholar] [CrossRef]
  28. Meng, Q.B.; Liu, J.F.; Ren, L.; Pu, H.; Chen, Y.L. Experimental Study On Rock Strength And Deformation Charateristics Under Triaxial Cyclic Loading And Unloading Conditions. Rock Mech. Rock Eng. 2021, 54, 777–797. [Google Scholar] [CrossRef]
  29. Wang, Y.N.; Zhang, Q.; Li, Z.Y.; Jiang, B.S. Strain softening model considering elastic-plastic coupling effect. J. Chin. Coal Soci. 2020, 45, 4037–4051. [Google Scholar]
  30. Ma, L.; Xu, H.; Tong, Q.; Dong, L.; Zhang, N.; Li, J. Post-yield plastic frictional parameters of a rock salt using the concept of mobilized strength. Eng. Geol. 2014, 177, 25–31. [Google Scholar] [CrossRef]
  31. Cai, W.; Dou, L.M.; Ju, Y.; Cao, W.Z.; Yuan, S.S.; Si, G.Y. A plastic strain-based damage model for heterogeneous coal using cohesion and dilation angle. Int. J. Rock Mech. Min. Sci. 2018, 110, 151–160. [Google Scholar] [CrossRef]
  32. Wang, J.; Wang, Z.; Yang, S. A coupled macro- and meso-mechanical model for heterogeneous coal. Int. J. Rock Mech. Min. Sci. 2017, 94, 64–81. [Google Scholar] [CrossRef]
  33. Soldo, L.; Vendramini, M.; Eusebio, A. Tunnels design and geological studies. Tunn. Undergr. Space Technol. 2019, 84, 82–98. [Google Scholar] [CrossRef]
  34. Singh, A.; Ayothiraman, R.; Rao, K.S. Failure criteria for isotropic rocks using a smooth approximation of modified mohr–coulomb failure function. Geotech. Geol. Eng. 2020, 38, 4385–4404. [Google Scholar] [CrossRef]
  35. Galindo, R.A.; Serrano, A.; Olalla, C. Ultimate bearing capacity of rock masses based on modified Mohr-Coulomb strength criterion. Int. J. Rock Mech. Min. Sci. 2017, 93, 215–225. [Google Scholar] [CrossRef]
  36. Xie, S.J.; Lin, H.; Chen, Y.F.; Wang, Y.X. A new nonlinear empirical strength criterion for rocks under conventional triaxial compression. J. Cent. South Univ. 2021, 28, 1448–1458. [Google Scholar] [CrossRef]
  37. Xie, N.; Zhu, Q.Z.; Xu, L.H.; Shao, J.F. A micromechanics-based elastoplastic damage model for quasi-brittle rocks. Comput. Geotech. 2011, 38, 970–977. [Google Scholar] [CrossRef] [Green Version]
  38. Qu, P.; Zhu, Q.; Zhao, L.; Cao, Y. A micromechanics-based fractional frictional damage model for quasi-brittle rocks. Comput. Geotech. 2021, 139, 104391. [Google Scholar] [CrossRef]
  39. Xie, S.; Lin, H.; Chen, Y. New constitutive model based on disturbed state concept for shear deformation of rock joints. Arch. Civ. Mech. Eng. 2022, 23, 26. [Google Scholar] [CrossRef]
  40. Martin, C.D.; Chandler, N.A. The progressive fracture of Lac du Bonnet granite. Int. J. Rock Mech. Min. Sci. Geomech. Abstr. 1994, 31, 643–659. [Google Scholar] [CrossRef]
  41. Chen, J.; Li, J.; Wang, J.; Shi, Z.; Lin, H.; Zhang, X. Investigation on the characteristics of fracture process zone under cyclic loading: Insights from macro-mesoscopic analysis. Theor. Appl. Fract. Mech. 2022, 122, 103616. [Google Scholar] [CrossRef]
  42. Jin, J.C.; She, X.C.; Shang, P.Y. Study on strength parameters and dilation angle evolution models in hard rock elasto-plastic deformation and failure process. Rock Soil Mech. 2019, 40, 4401–4411. [Google Scholar]
  43. Alejano, L.R.; Alonso, E. Considerations of the dilatancy angle in rocks and rock masses. Int. J. Rock Mech. Min. Sci. 2005, 42, 481–507. [Google Scholar] [CrossRef]
  44. Yi, K.; Kang, H.; Ju, W.; Liu, Y.; Lu, Z. Synergistic effect of strain softening and dilatancy in deep tunnel analysis. Tunn. Undergr. Space Technol. 2020, 97, 103280. [Google Scholar] [CrossRef]
Figure 1. Complete stress-strain curve. (a) typical [31], (b) simplified.
Applsci 13 02764 g001
Figure 2. Evolution schematic of normalised strain hardening and softening factors.
Applsci 13 02764 g002
Figure 3. Relationship between hardening factors and softening factors and axial plastic strain under different confining pressures.
Applsci 13 02764 g003
Figure 4. Cohesion/internal friction angle–axial plastic strain relationships of two hard brittle rock types under different confining pressures and their best fits. Data of (a,b) are for Beishan granite [26] and those of (c,d) are for Danjiangkou diabase [37].
Applsci 13 02764 g004
Figure 5. The fitting results of the Gaussian function before and after modification (the internal friction angle of Beishan granite [26] under 40 MPa).
Applsci 13 02764 g005
Figure 6. Fitting curves of parameters for two hard brittle rocks at different confining pressures: (a) ε 1 , p p s , (b) ξc, (c) ξφ.
Applsci 13 02764 g006
Figure 7. Comparison of the overall fit using the cohesion and internal friction angle and the individual fit of two hard brittle rocks at different confining pressures: (a,b) are for Beishan granite [26], and (c,d) are for Danjiangkou diabase [37].
Applsci 13 02764 g007
Figure 8. Flow chart of the secondary development of the constitutive model.
Applsci 13 02764 g008
Figure 9. Numerical model of the triaxial compression test in FLAC3D.
Applsci 13 02764 g009
Figure 10. Comparison of the test curves and model curves: (a) Beishan granite [26]; (b) Danjiangkou diabase [37].
Applsci 13 02764 g010
Table 1. Average values of Young’s modulus and Poisson’s ratio for Beishan granite [26] and Danjiangkou diabase [37].
Rock TypeEm/GPaμm
Granite65.470.26
Diabase50.280.24
Table 2. The cohesion c and internal friction angle φ values corresponding to each hardening and softening factor (Beishan granite [26] and Danjiangkou diabase [37]).
Dh/DssGraniteDiabase
c/MPaφR2c/MPaφR2
Dh = 027.2941.440.9443.9128.540.97
Dh = 0.227.8642.610.9445.1329.670.97
Dh = 0.528.6944.200.9446.9131.260.96
Dh = 0.829.5045.650.9448.6132.730.95
Dh = 1.0 (Dss = 0)30.0346.540.9449.7233.640.94
Dss = 0.128.0045.700.9548.2432.290.95
Dss = 0.225.9044.820.9546.7130.840.95
Dss = 0.421.4442.870.9743.527.570.96
Dss = 0.516.5640.650.9840.0323.680.98
Dss = 0.811.1738.070.9936.2318.940.99
Dss = 0.98.2436.631.0034.1816.161.00
Dss = 1.05.1235.051.0031.9913.001.00
Table 3. Fit coefficients for cohesion/internal friction angle–axial plastic strain curves of two hard brittle rock types at different confining pressures.
Rock Typeσ3/MPa ε 1 , p p s /%cφ
ξccs/MPacp/MPacr/MPaR2ξφφsφpφrR2
Granite0.20.0030.22327.2930.035.120.980.20041.4446.5435.050.91
10.0570.28227.2930.035.120.990.28241.4446.5435.050.98
3.50.0780.46727.2930.035.120.990.46241.4446.5435.050.97
100.1200.37927.2930.035.120.990.36441.4446.5435.050.98
200.1490.52527.2930.035.121.000.51741.4446.5435.050.99
400.2390.67227.2930.035.120.990.66341.4446.5435.050.98
Diabase50.0310.15443.9149.7232.000.960.16628.5433.6413.000.98
100.0600.21243.9149.7232.000.990.21428.5433.6413.000.98
200.0850.25843.9149.7232.000.970.28128.5433.6413.000.97
400.1080.28343.9149.7232.000.990.30528.5433.6413.000.97
Table 4. Fitting coefficient of parameters ε 1 , p p s , ξc and ξφ of two hard brittle rocks with the confining pressure function.
ParameterGraniteDiabse
P0A1A2t1t2R2P0A1A2t1t2R2
ε 1 , p p s 1.5100.0751.4450.565321.0940.990.1140.119013.422-1.00
ξc6.7900.1986.4141.027874.9290.920.2850.22708.947-0.99
ξφ7.0750.2036.7091.006914.6350.910.3130.237010.757-0.99
Disclaimer/Publisher’s Note: The statements, opinions and data contained in all publications are solely those of the individual author(s) and contributor(s) and not of MDPI and/or the editor(s). MDPI and/or the editor(s) disclaim responsibility for any injury to people or property resulting from any ideas, methods, instructions or products referred to in the content.

