Article

Method and Experimental Study of Zeolite Crystal Manipulation Based in Hydrodynamic Forces for Single Crystal Assessment

by
Dann De la Torre
1,*,
Veneranda Garcés-Chávez
2,
Juan De Dios Sanchez-Lopez
1,*,
Kevin A. O’Donnell
3,
Juan Ivan Nieto-Hipólito
1 and
Rosario Isidro Yocupicio-Gaxiola
4
1
Facultad de Ingeniería Arquitectura y Diseño, Universidad Autónoma de Baja California No. 3917, Ensenada 22860, Baja California, Mexico
2
Pacifica Photonics, Carretera Tijuana-Ensenada, El Sauzal 22760, Baja California, Mexico
3
División de Física Aplicada, Centro de Investigación Científica y de Educación Superior de Ensenada, Carretera Ensenada-Tijuana No. 3918, Zona Playitas, Ensenada 22860, Baja California, Mexico
4
Instituto Tecnológico Superior de Guasave, Carretera Internacional Entronque a La Brecha sn, Ejido Burrioncito 81149, Sinaloa, Mexico
*
Authors to whom correspondence should be addressed.
Appl. Sci. 2023, 13(4), 2699; https://doi.org/10.3390/app13042699
Submission received: 29 December 2022 / Revised: 16 February 2023 / Accepted: 17 February 2023 / Published: 20 February 2023
(This article belongs to the Special Issue Applied Hydrodynamics)

Abstract

:
In this work, we report an optofluidic system for manipulation of orientation of zeolite crystals near the bottom of a rectangular cross-sectional, straight, quartz microfluidic channel. Manipulation is accomplished by using two computer-controlled syringe pumps that generate adequate hydrodynamic forces for translation and rotation of crystals. Rotation of a crystal around its longitudinal axis allows us to inspect its four major faces for defects. Coffin-shaped zeolite crystals have been studied by several authors by fixing them to a substrate, using two different crystals to assess the roof and gable orientations. The proposed system permits complete assessment of a single crystal by shifting it between roof and gable orientations; moreover the medium can be controlled. Computational fluid dynamics simulations show that crystals in free motion near the bottom of the channel should move faster than the velocity estimated from video. An opposing force, which prevents the crystals from moving freely, has been calculated in order to match translation velocities from simulations and experiments for three given flow rates. The reported optofluidic system is proposed as a novel tool that we believe will open new possibilities for individual zeolite crystal assessment by manipulation of its orientation and medium control.

1. Introduction

Zeolites are crystalline microporous materials constructed of a network of silica and alumina tetrahedra. They are widely used in the chemical industry, in major petrochemical processes and, more recently, in biomass conversion [1]. Fluorescence microscopy is capable of monitoring chemical transformation of organic molecules at ambient temperature and pressure in liquid phase in zeolite crystals [2]. The aforementioned monitoring tool provides adequate measurements of catalytic activity for a rational and efficient catalyst design [3]. Due to the absence of control on the orientation of the particles, their monitoring method requires two crystals to assess the full three-dimensional catalytic activity. In this report, we propose an optofluidic system to manipulate the orientation of a ZSM-5 zeolite crystal along with medium control in order to use a single crystal for its complete assessment. The crystallization process and crystal morphology design is beyond the scope of this work. Optofluidics refers to the field of research involving the integration of microfluidics and optics in the same platform, where fluid and light are driven to interact [4]. Molecular fluorescence is an example of an optofluidic system [5]. Microfluidics technology, originally developed for ink jet printing [6], is a multidisciplinary research field that integrates technologies and principles from fluid dynamics, physics, biology, microtechnology, material science, and chemistry [7]. A manipulation method based on hydrodynamic forces developed in a microchannel for imaging cells in three-dimensions by cell rotation was proposed in [8]. The basis of their work is the fact that the parabolic velocity profile formed in a microfluidic channel at low Reynolds numbers (Re 1 ) will expose two opposite sides of a cell near a wall to two different velocities, the one close to the wall slower, and the one close to the center faster. As a consequence, a torque will act on the cell and a rotation will be induced. By using computational fluid dynamics (CFD), an analysis of particle translation and rolling near surfaces was carried out by [9]. In their work, they use the three-dimensional numerical solution of the Navier–Stokes equations computed by CFD to estimate the hydrodynamic drag force and torque exerted on a microsphere which induces the translation and rotation of the body. A study of detachment and motion of a glass microsphere in a cylindrical PDMS microfluidic channel has been carried out [10]. They used a nonionic surfactant (Tween 80) to minimize the adhesion forces, because the particle motion was not possible without surfactant due to strong interactions between the channel and particle. Acoustic viscous torque has been used to trap and rotate spherical and elongated microparticles with an acoustic field of two orthogonal standing waves [11]. Their approach is used for rotation of suspended particles around a vertical axis at the pressure node. In this work, we describe an optofluidic system that uses two computer-controlled syringe pumps to manipulate heavy particles in one dimension near a quartz microchannel’s bottom wall. A straight-channel geometry has been chosen for two reasons: (1) maintaining the manipulation capability through the full length of the channel and (2) keeping the crystal far from lateral walls where would get stuck. The two syringe pumps and the microfluidic channel design produced hydrodynamic forces that the authors used to translate and rotate ZSM-5 zeolite crystals. Fluid structure interaction (2D) simulations with COMSOL demonstrate that a zeolite-like item toward the bottom of the microchannel travels more quickly than the crystals shown on video. A negative volumetric force was utilized in the COMSOL simulation to reduce the velocity of the moving item in order to match the simulated and experimental velocities. Three-dimensional (3D) imaging at the micrometer scale is important for a variety of applications, including materials science, biology, and medicine. In materials science, 3D imaging at the micrometer scale can be used to study the microstructure of materials and how it affects their properties. This can be important for developing new materials or optimizing the properties of existing materials. Zeolites are microporous, aluminosilicate minerals that have a wide range of applications, being used in catalysis, separation, and adsorption. The structure of zeolite crystals can have a significant impact on their properties and performance, so being able to observe them in 3D can be important for understanding and optimizing their behavior. This paper is organized as follows. Section 2 describes the microfluidic channel, sample preparation, placement of crystals in the microchannel, experimental setup, parabolic velocity profile, and the force balance model. Section 3 describes the estimation of the required volumetric force to match the observed crystal velocity to that obtained from COMSOL simulations. Section 4 discusses the results presented in this report. Finally, Section 5 concludes the paper.

2. Materials and Methods

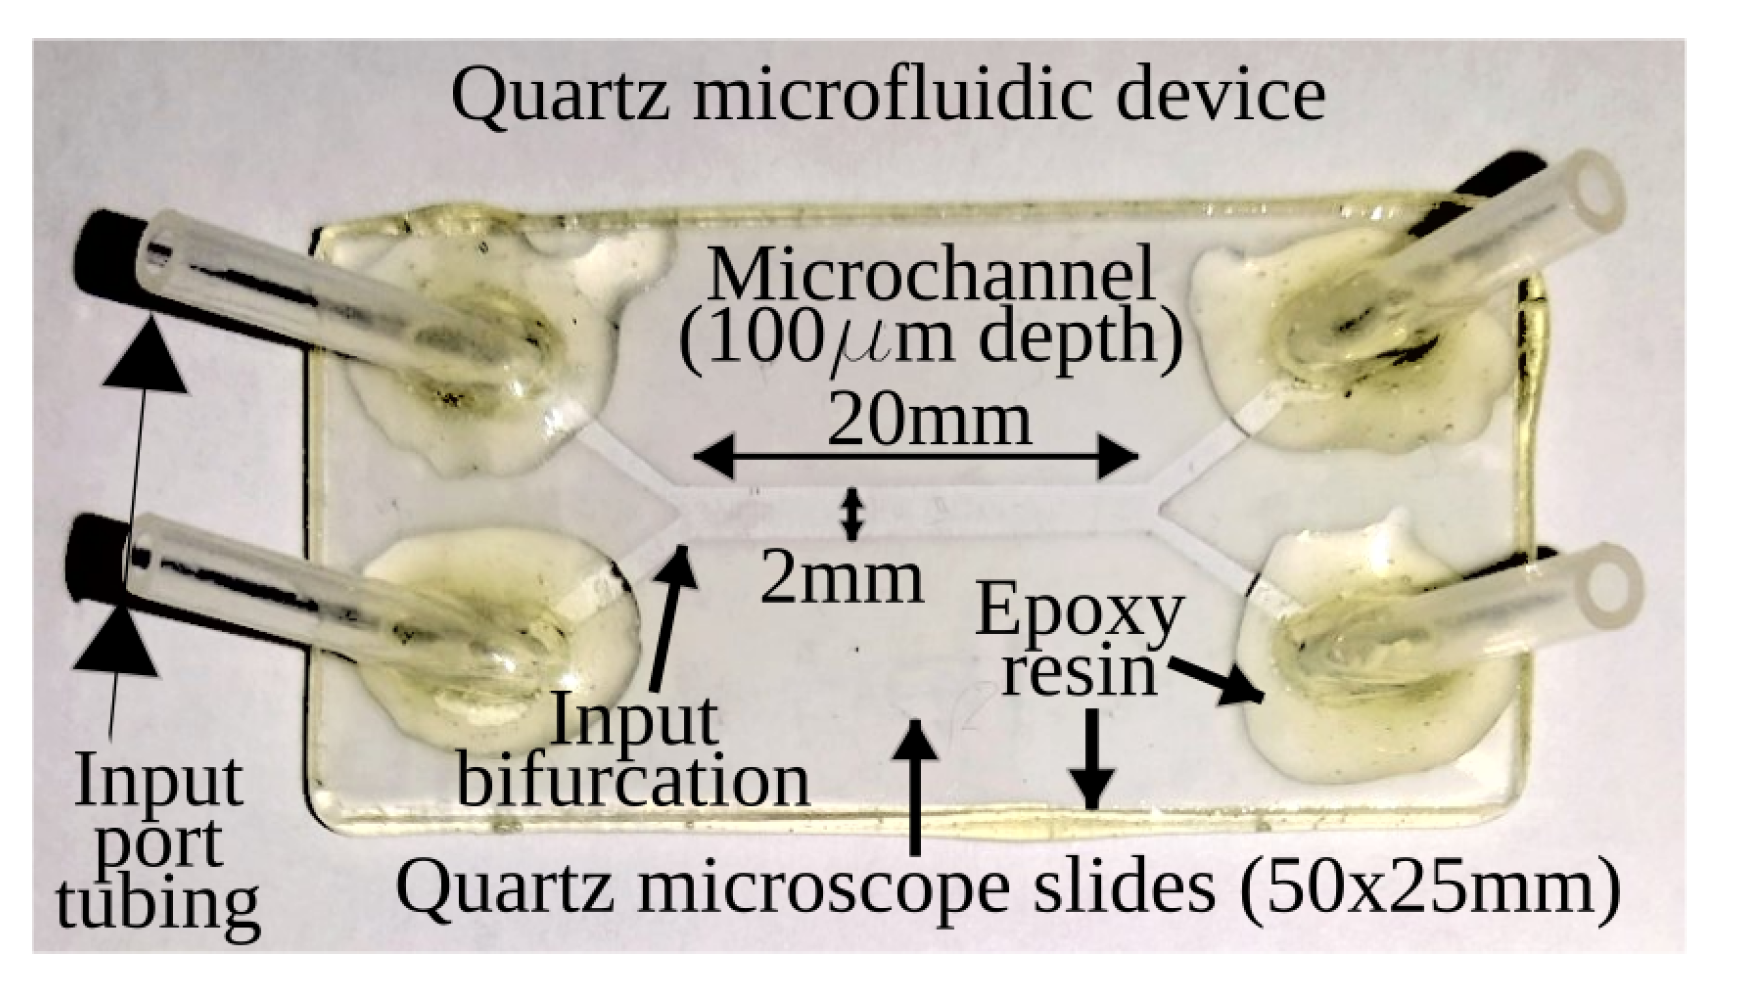
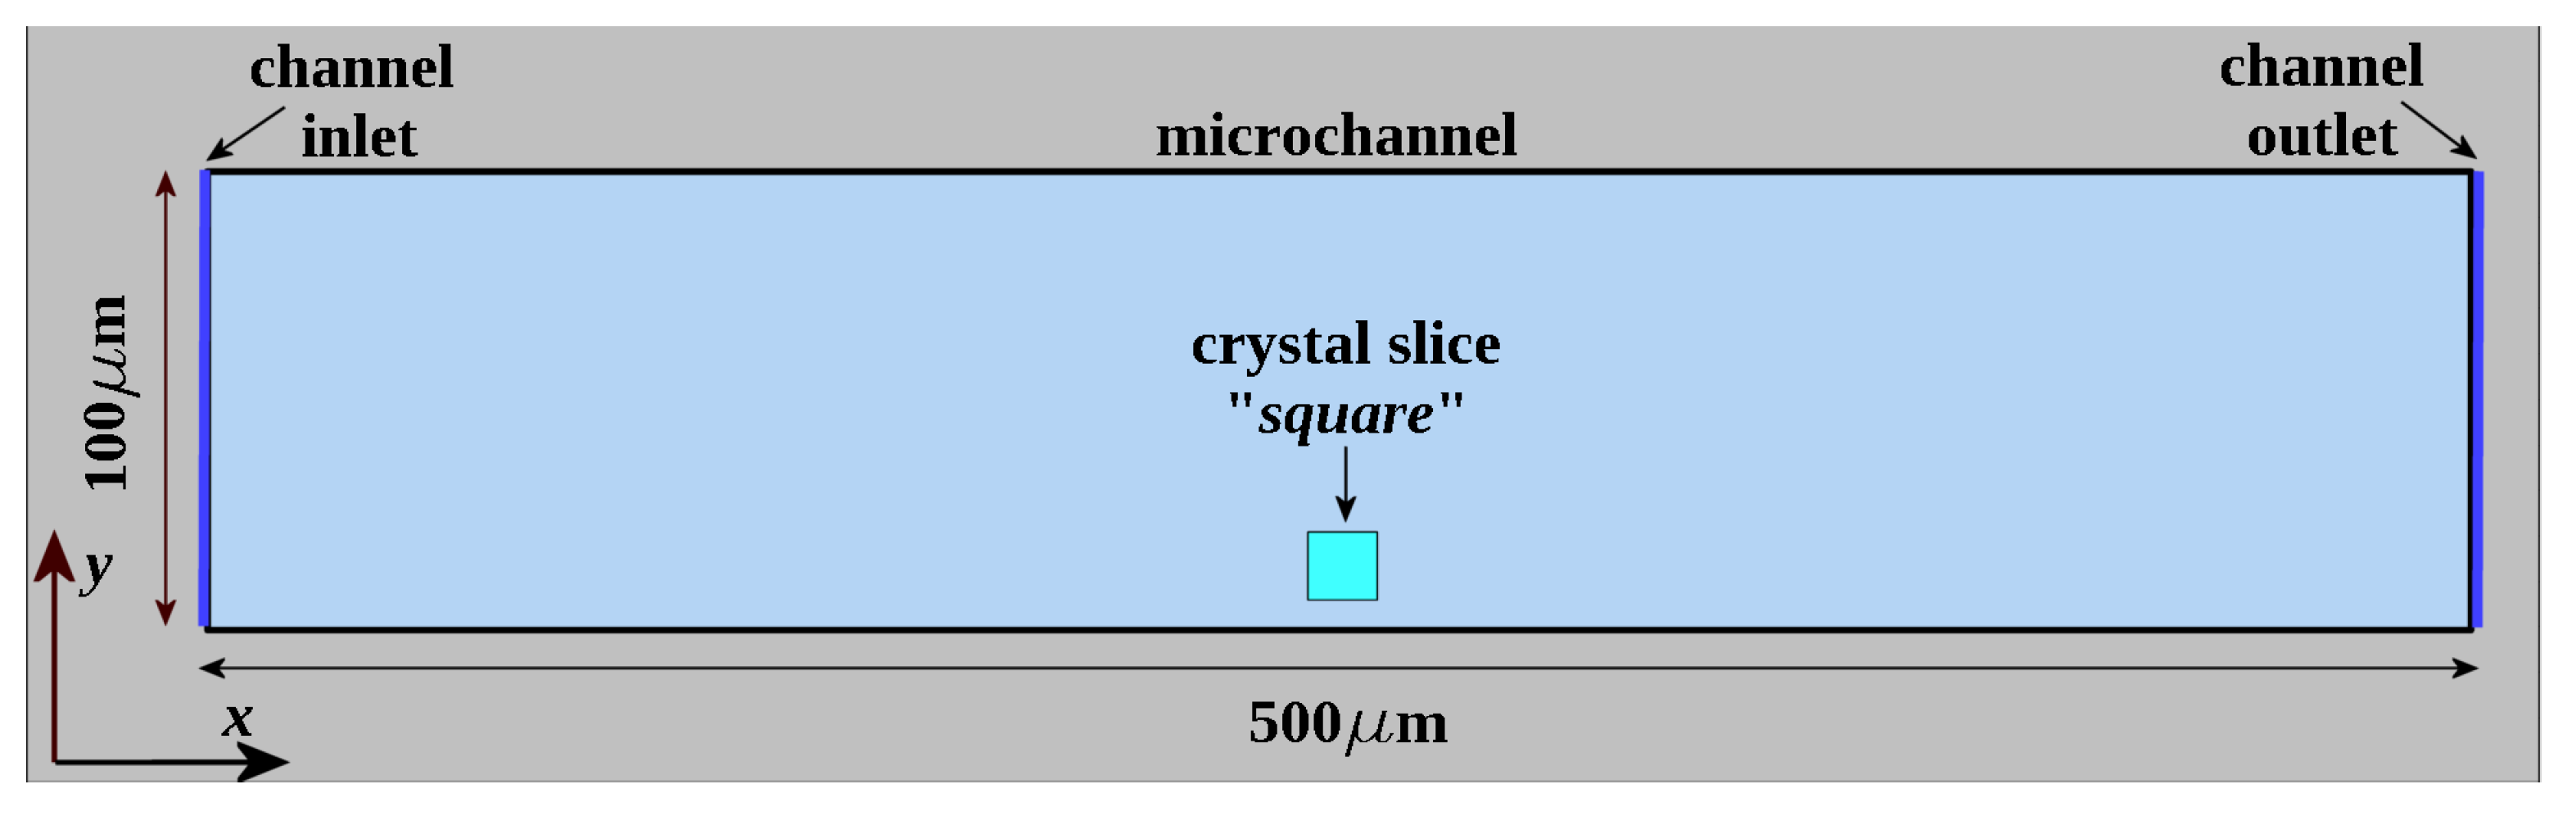
2.1. Microfluidic Channel

We carried out experiments in a custom-built microchannel. A straight channel with a rectangular cross-section was built by using two quartz microscope slides of 50 mm × 25 mm, 1 mm thick, with parafilm between them as a 100- μ m thick spacer. Two input and two output fluid flow ports were drilled in the top quartz slide. The edges and the port-tubing interface were sealed with epoxy resin. The device is shown in Figure 1. Dimensions of the quartz microchannel are (L × W × H): 20 mm × 2 mm × 100 μ m.
A powder sample of ZSM-5, Si/Al = 95 zeolite crystals (approx. 1 mm 3 ) was mixed with 400 μ L of deionized water in a 1.5-mL microcentrifuge tube. Deionized water was previously boiled for 1 min to eliminate swimming microalgae observed in previous experiments. A sample of this mixture was observed in the microscope and many crystal fragments and unusual particles were found. The sample was hand agitated and supernatant material was removed three times to keep the fast sedimenting whole crystals and remove slower sedimenting fragments and particles. The sample was refilled with deionized water every time supernatant material was removed. The resulting sample was found to be rich in whole zeolite crystals. A single crystal viewed from gable and roof orientations is shown in Figure 2.
Placement of zeolite crystals in the microchannel was difficult, but we found the following procedure to give excellent results, as follows.
  • The microchannel is prefilled with deionized water, leaving room for the sample of zeolite crystals in the selected input tubing.
  • The sample of zeolite crystals/deionized water in the microcentrifuge tube is agitated.
  • By using a 3-mL syringe 21 G × 32 mm (0.8 mm) (1-1/4”), 100 μ L of the sample is taken from the microcentrifugue tube, bringing down the needle to about 1 4 of the fluid height.
  • The needle of the syringe is inserted in the selected input tubing until it reaches the bottom wall of the microchannel, and the input tubing is filled with the syringe contents.
  • The microchannel is rotated to vertical position, with the sample filled tubing upward, so gravity and drag forces convey the crystals in the channel.
  • Immediately after the previous step, the microfluidic device is gently tapped on a soft surface and returned to original horizontal orientation.
  • The microchannel is observed with the microscope looking for crystals. If they are not found, the previous step is repeated.
  • Once the crystals are found in the microchannel, the two inputs are gently filled with deionized water in order to connect the microfluidic device with the syringe pump tubing.

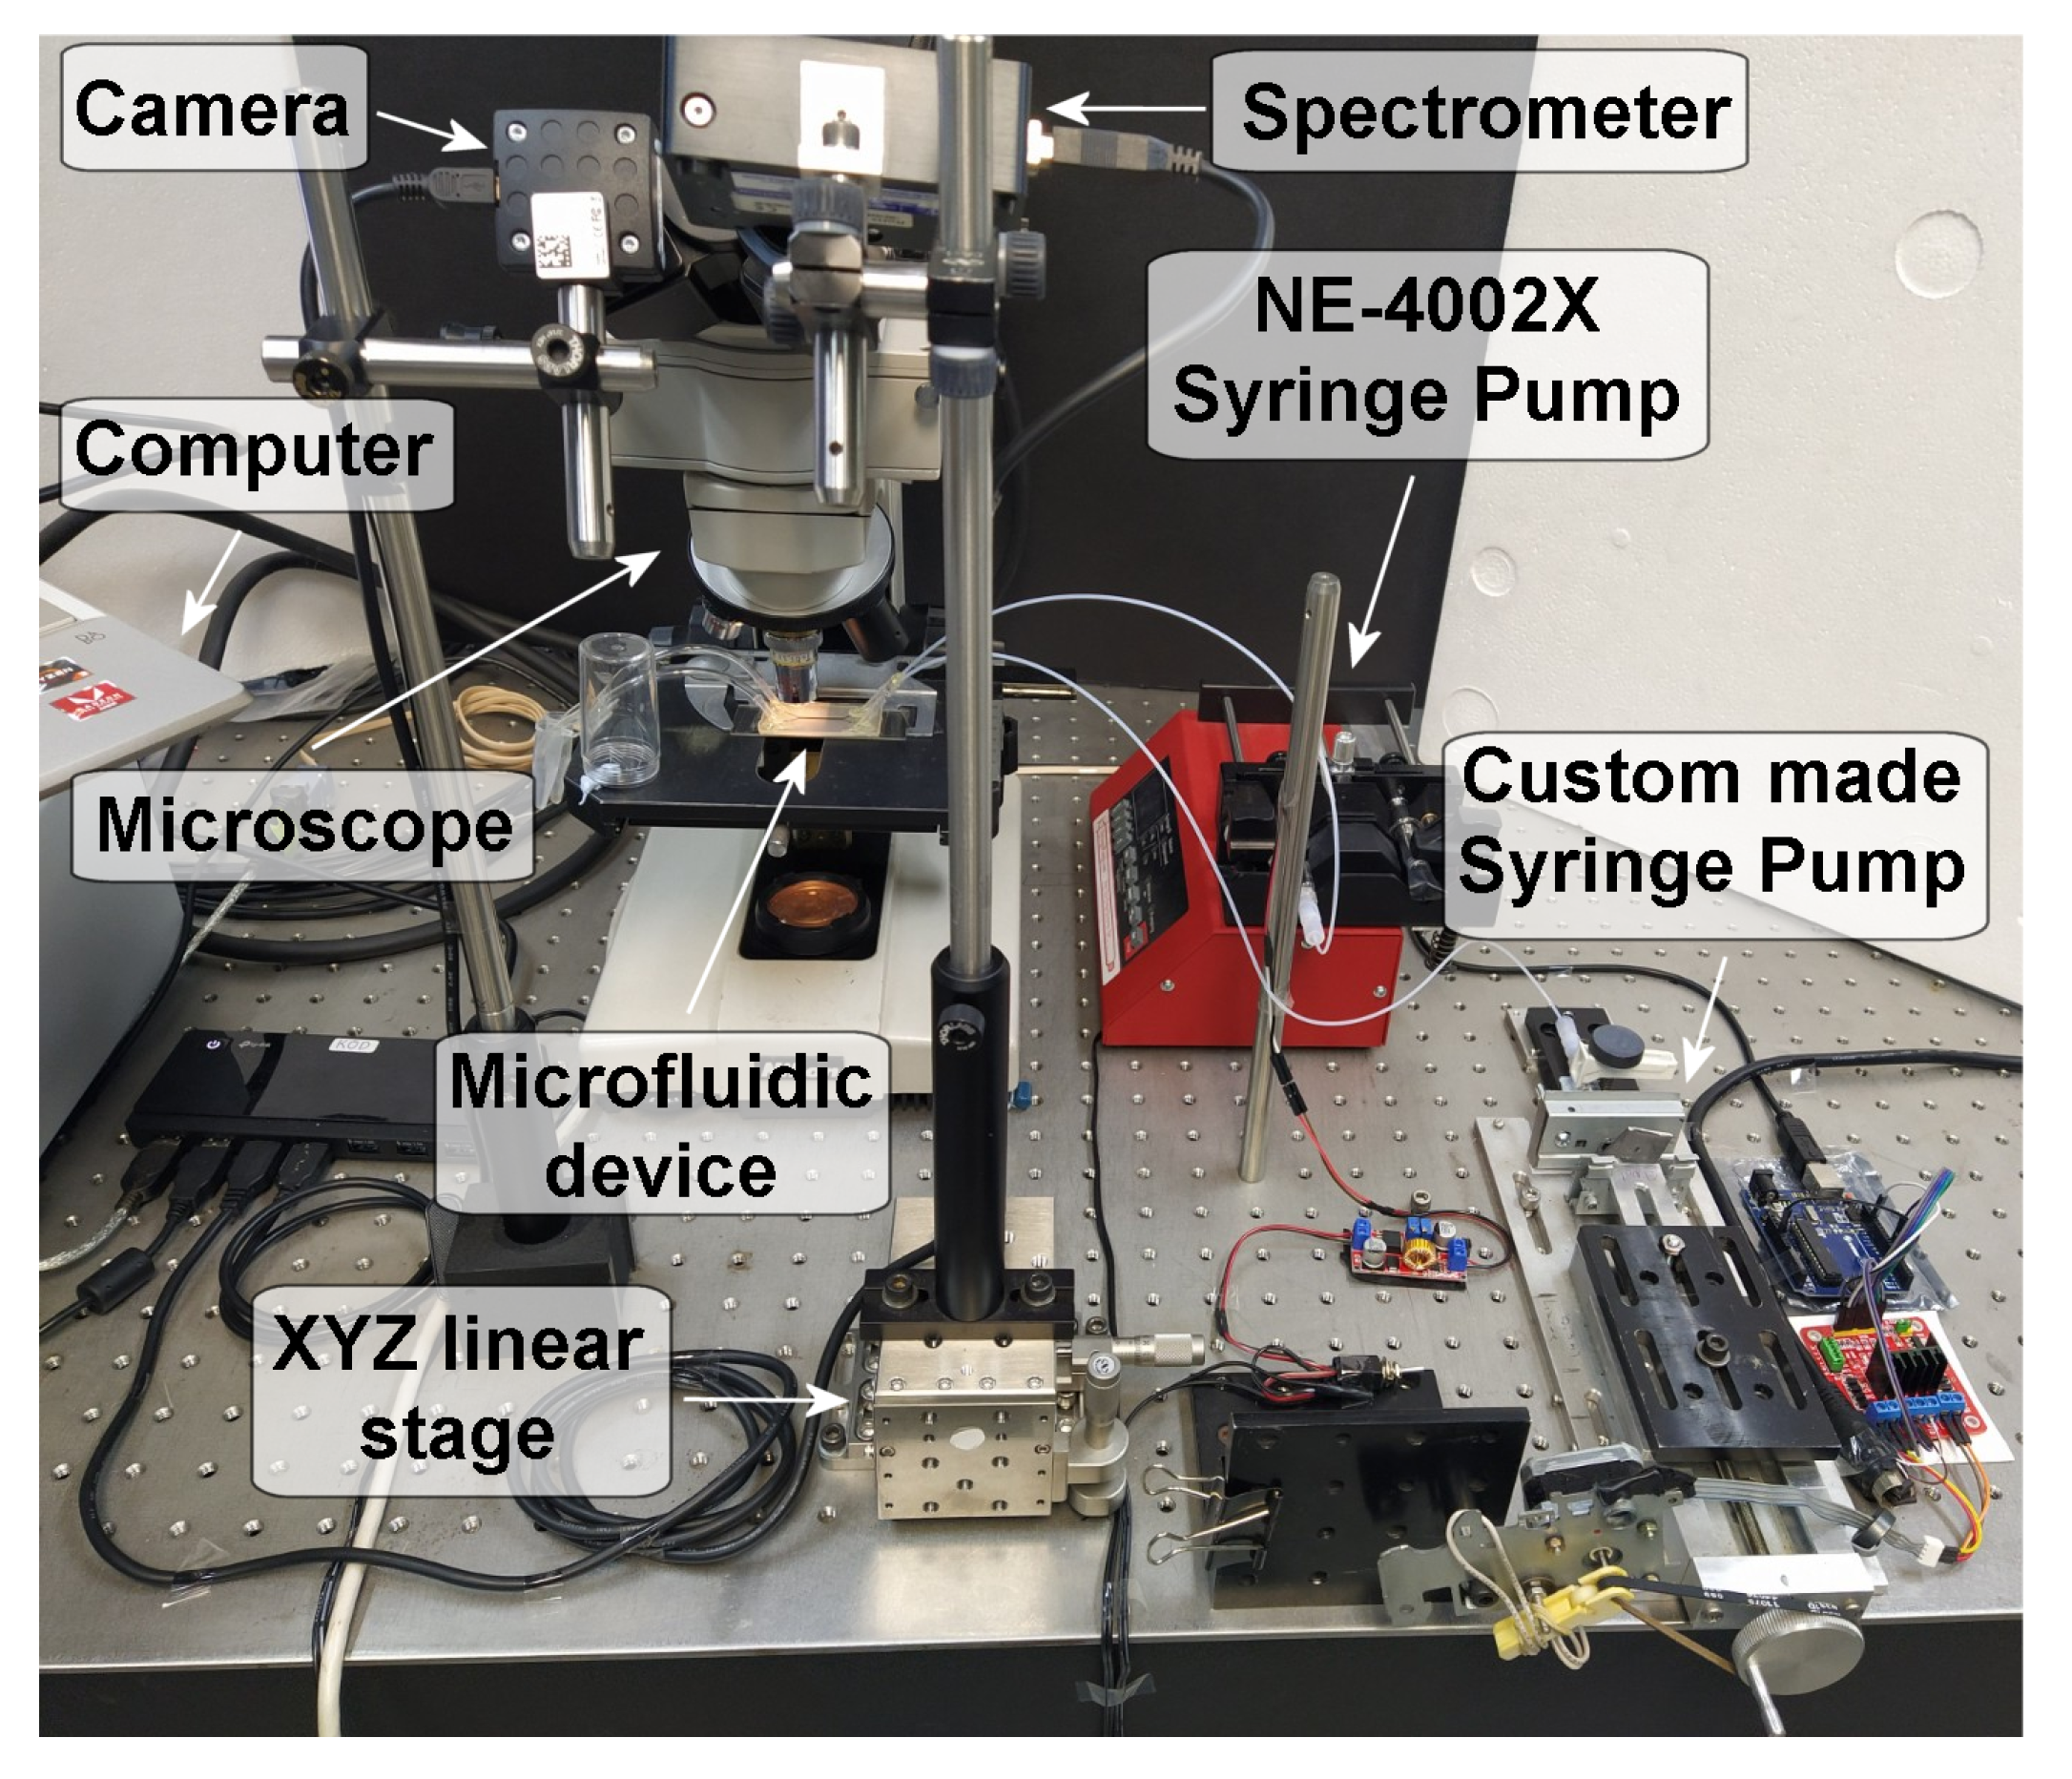
2.2. Experimental Setup

The optofluidic system developed in this work is shown in Figure 3. It is based on a compound (bright field illumination upright) microscope Nikon Labophot with the fluorescence module installed. A 10× microscope objective was used to capture bright field in transmission and fluorescence in reflection images of the zeolite crystals or particles in the microchannel. Digital images and video were recorded by using a Thorlabs DCC1545M CMOS camera located in place of the left eyepiece. The fluorescence spectrum of reflected light was measured with an Ocean Optics USB4000 Spectrometer located close to the right eyepiece. The spectrometer was mounted on a Newport XYZ linear stage platform. Two computer-controlled syringe pumps with 2.25 mL borosilicate glass syringes, pumped the fluid into the microfluidic device through PTFE tubing of 1/16” OD and 1/32” ID. The first syringe pump is a NE-4002X from New Era Pump Systems Inc. This pump is connected to the computer via a RS-232 serial port and a USB-Serial adapter. The second pump is a custom-built syringe pump. It was assembled by using a manual linear stage UniSlide Series A2500 from Velmex Inc driven by an EM-483 stepper motor with 200 steps per revolution, which rotates the 1.75” diameter screw drive knob of the UniSlide platform by using a toothed belt. The stepper motor is controlled by the computer with an Arduino UNO microcontroller connected to an H-bridge. A microstepping technique was implemented to smooth rotation velocity at low flow rates.

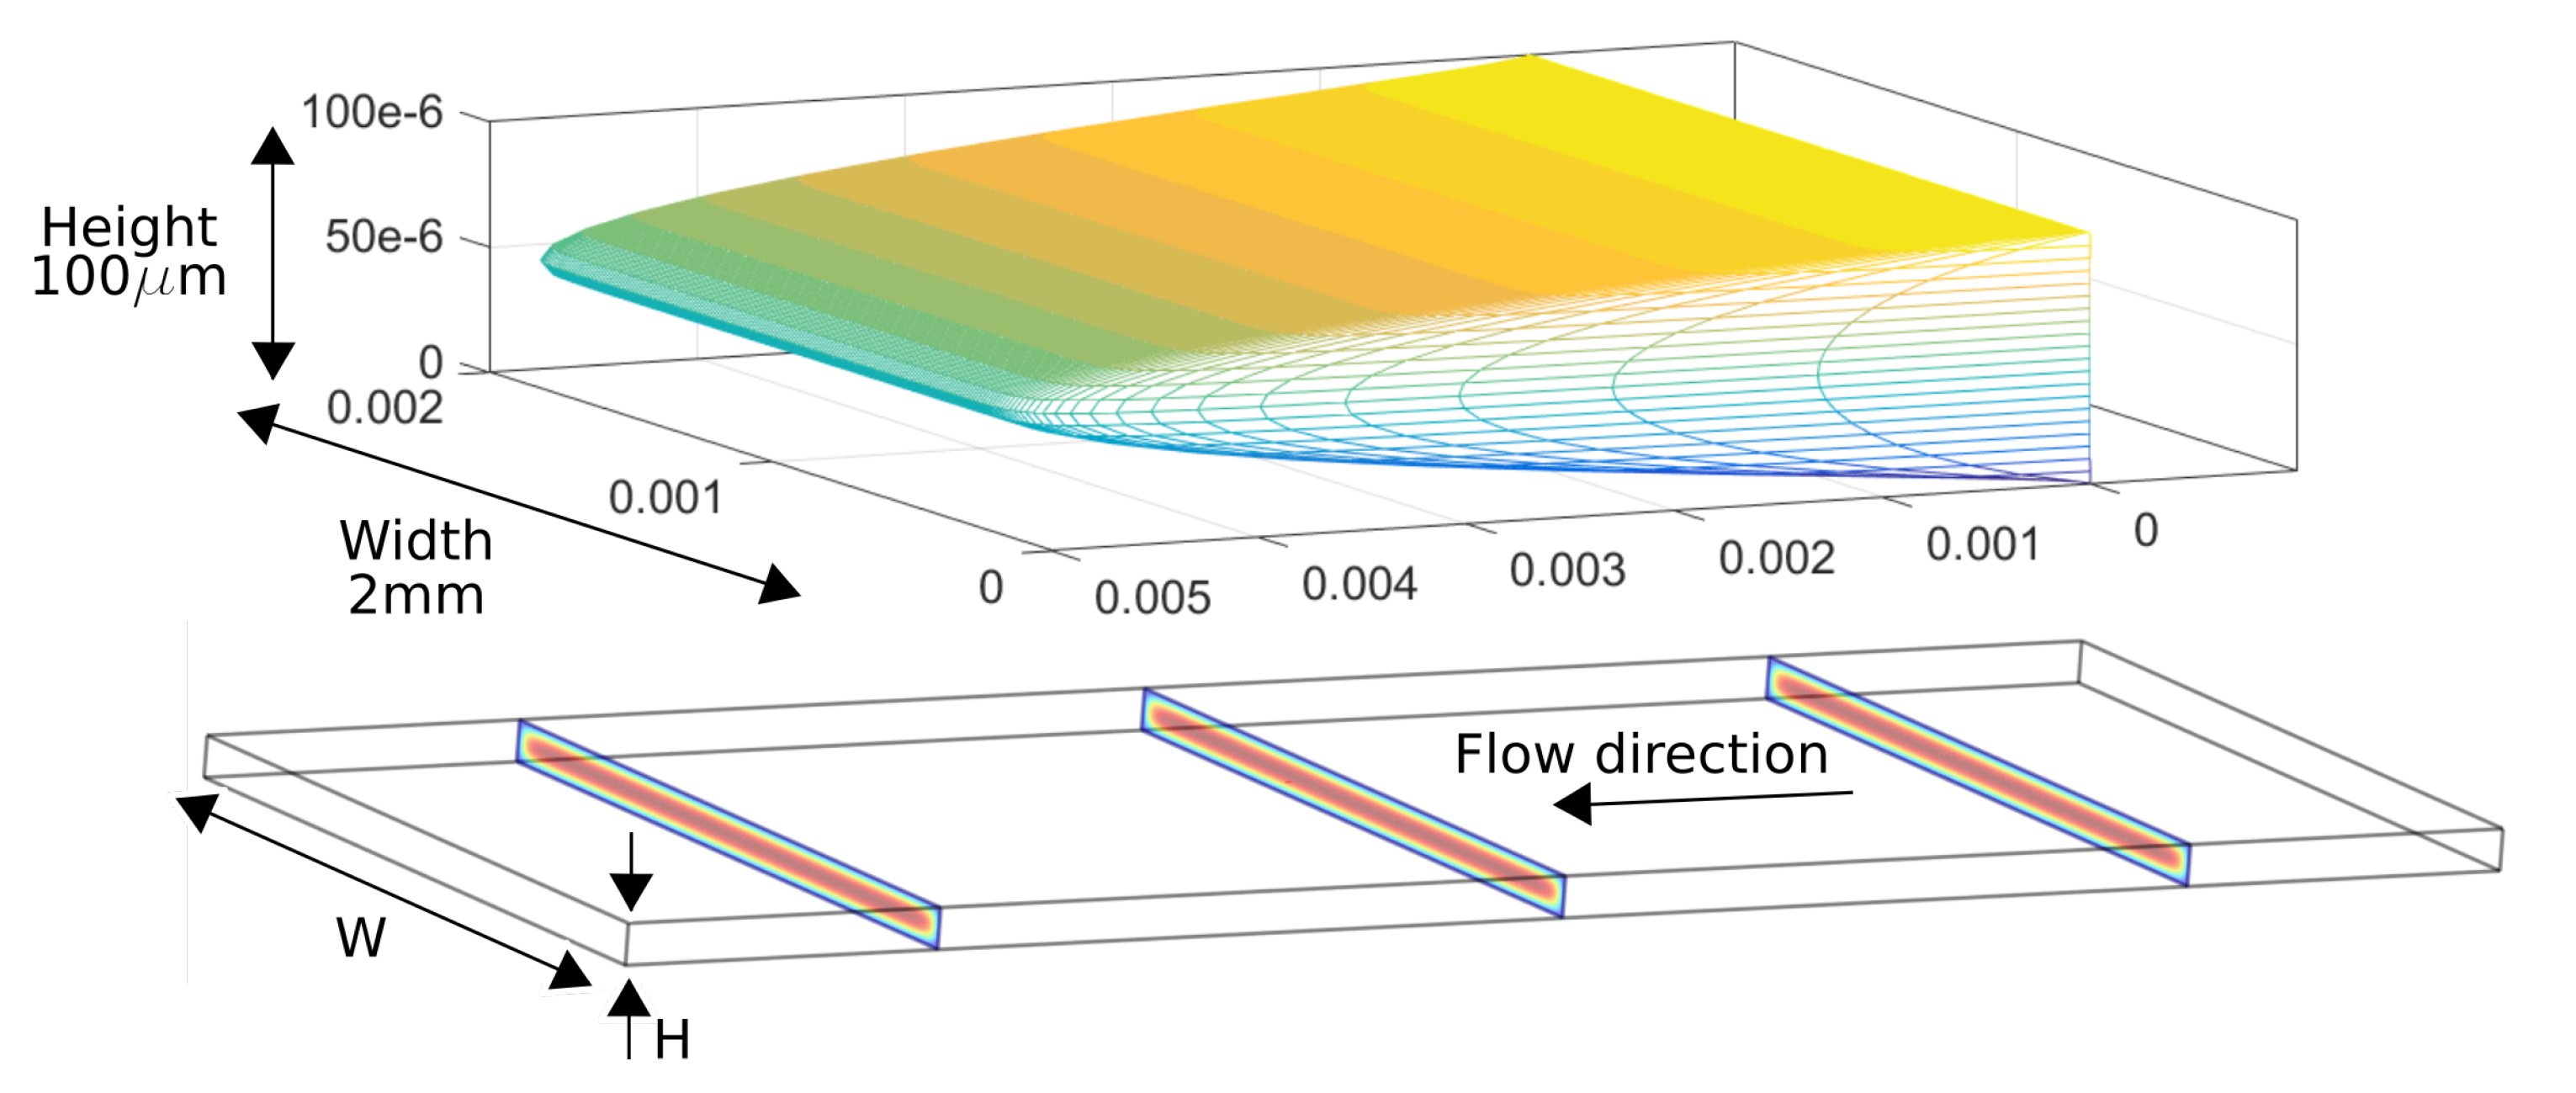
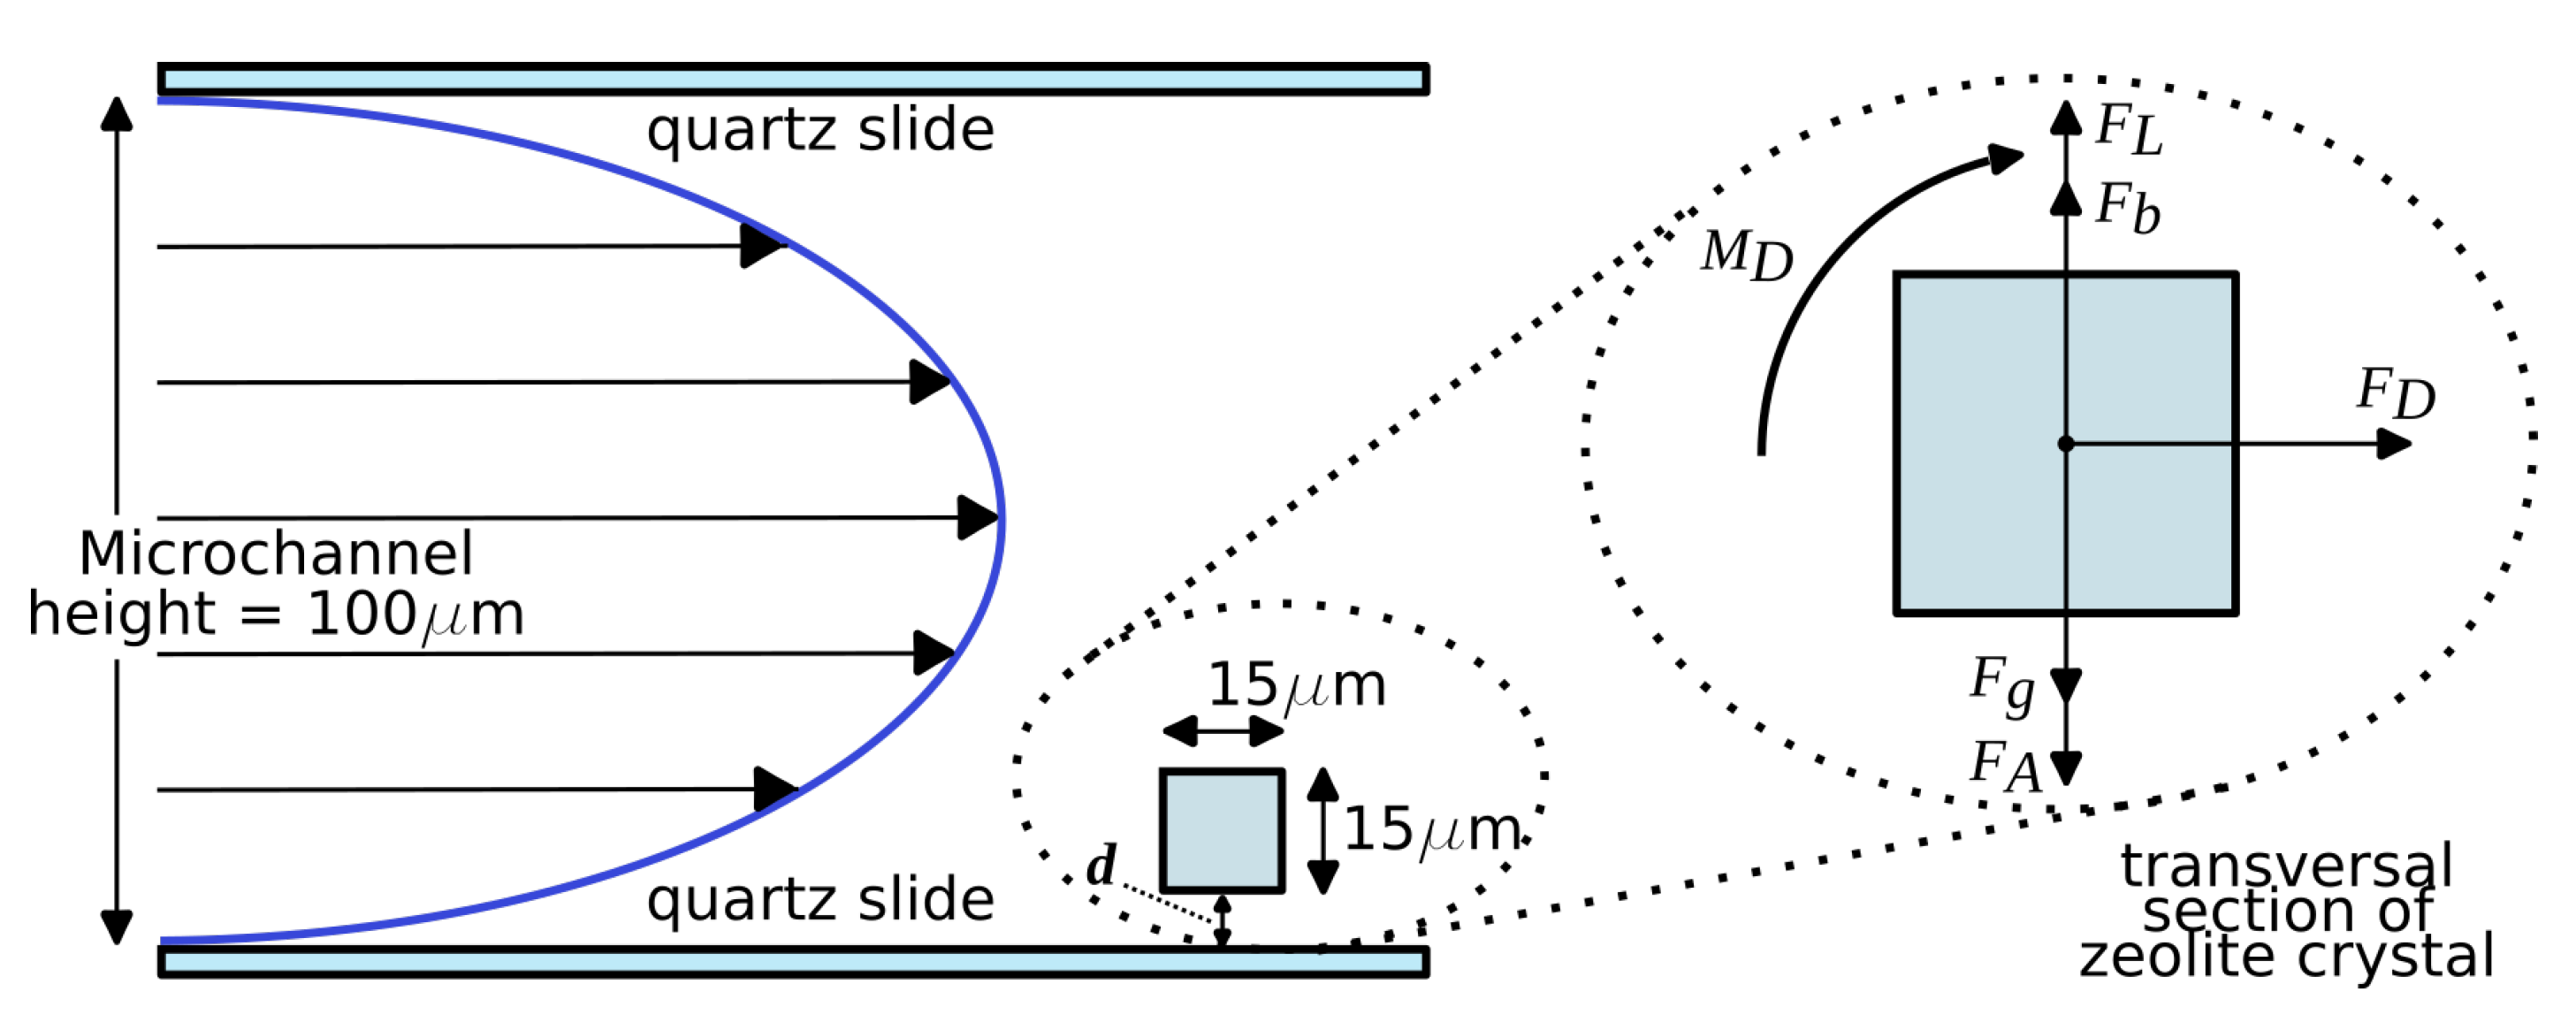
2.3. Velocity Profile in the Microchannel

It is well known [5,12] that the velocity profile in a rectangular cross-section, straight microfluidic channel has a parabolic shape along the shortest dimension, near the center vertical slice. This shape is achieved when the flow is fully developed, i.e., the velocity profile remains constant as a function of the distance in the flow direction (see Figure 4). The analytical function in Equation (1) describes the axial velocity in the cross-sectional (x, y) plane of a fully developed flow [12] or Poiseuille flow in the microfluidic channel. Near the entrance of the microfluidic channel, the velocity profile changes with distance. This distance is called the entrance length [13]. Simulations in COMSOL Multiphysics software were carried out to estimate the entrance length in two cases, when flow enters the channel through one input, and two inputs. Experiments were performed outside the entrance length region. Information on the velocity profile in the microfluidic channel is used to estimate the drag forces applied on the particles along the channel. Simulations of the velocity profile and the analytical function of the fully developed flow were compared, and they were found in close agreement. We have
u ( x , y ) = Δ p 2 μ L H 2 2 y 2 n = 0 a n cos λ n y h 2 cosh λ n x h 2
where λ n = ( 2 n + 1 ) π 2 , a n = H 2 ( 1 ) n ( λ n ) 3 cosh λ n W H , λ p 12 μ L Q W H 3 ( 1 6 ( 2 ) 5 H / [ W π 5 ] ) .
H is the channel height, W is the channel width, y the vertical axis, x the horizontal axis, L is the channel length, Δ p the pressure drop, and μ the viscosity of the fluid.

2.4. Force Balance Model

In order to move a zeolite crystal close to the bottom of a microfluidic channel in Poiseuille flow, it is essential to understand and model the forces and moments acting on it. Inspired by the models proposed by [9,14], a description of the significant forces and moments acting on the zeolite crystal is shown in Figure 5. They include the buoyancy F b , gravity F g , adhesion F A , lift F L , drag F D forces, and the moment M D due to hydrodynamic viscous stress and pressure. Lift force is neglected, because its value is very small at low Reynolds number, compared to vertical forces. We chose the orthogonal orientation of the crystal relative to the flow direction, with the purpose of describing the preferred orientation of the crystal observed in experiments.

3. Results

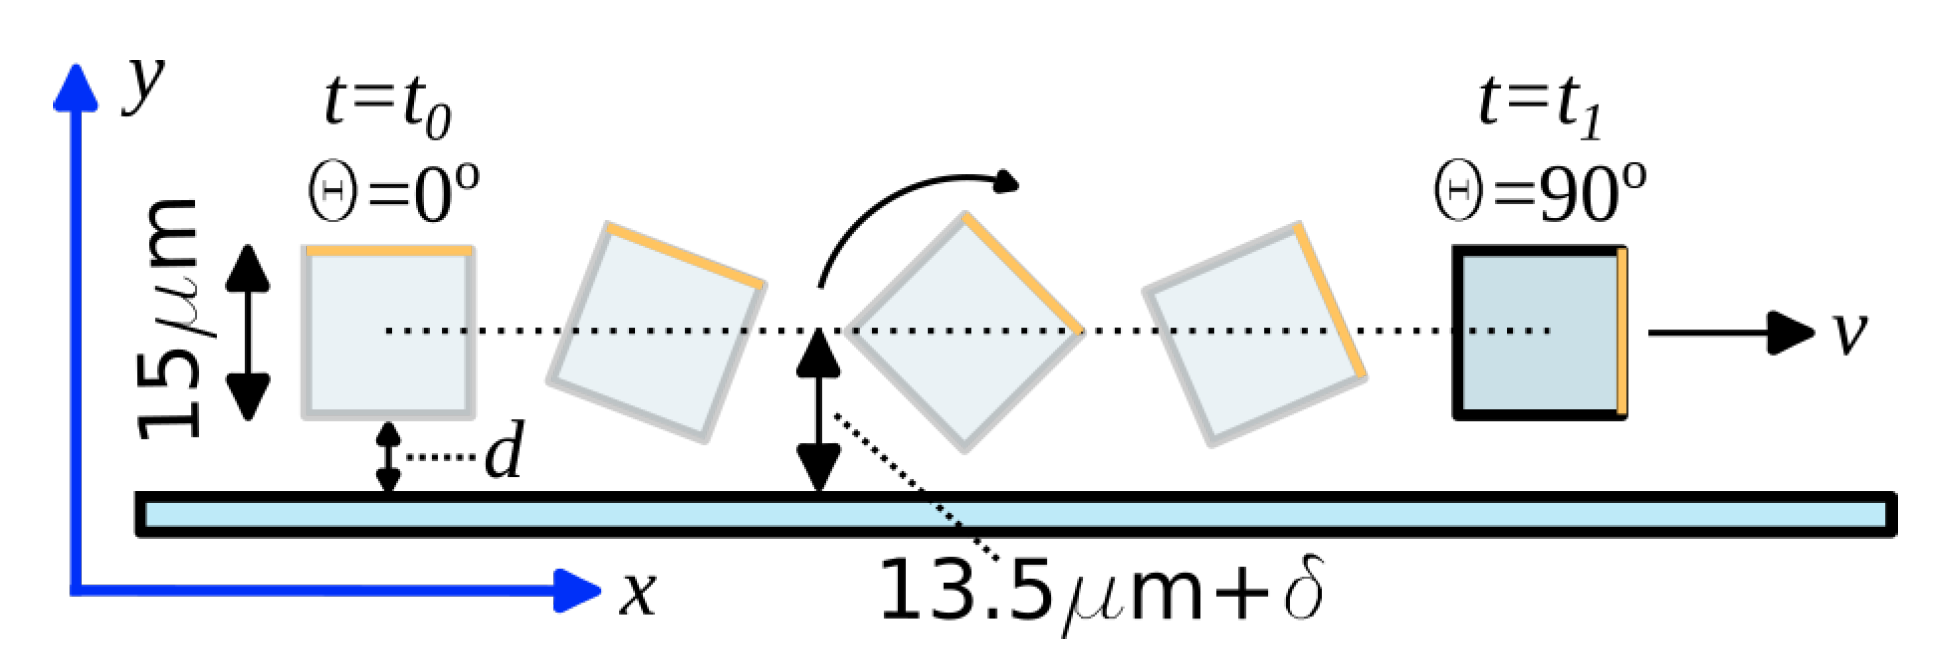
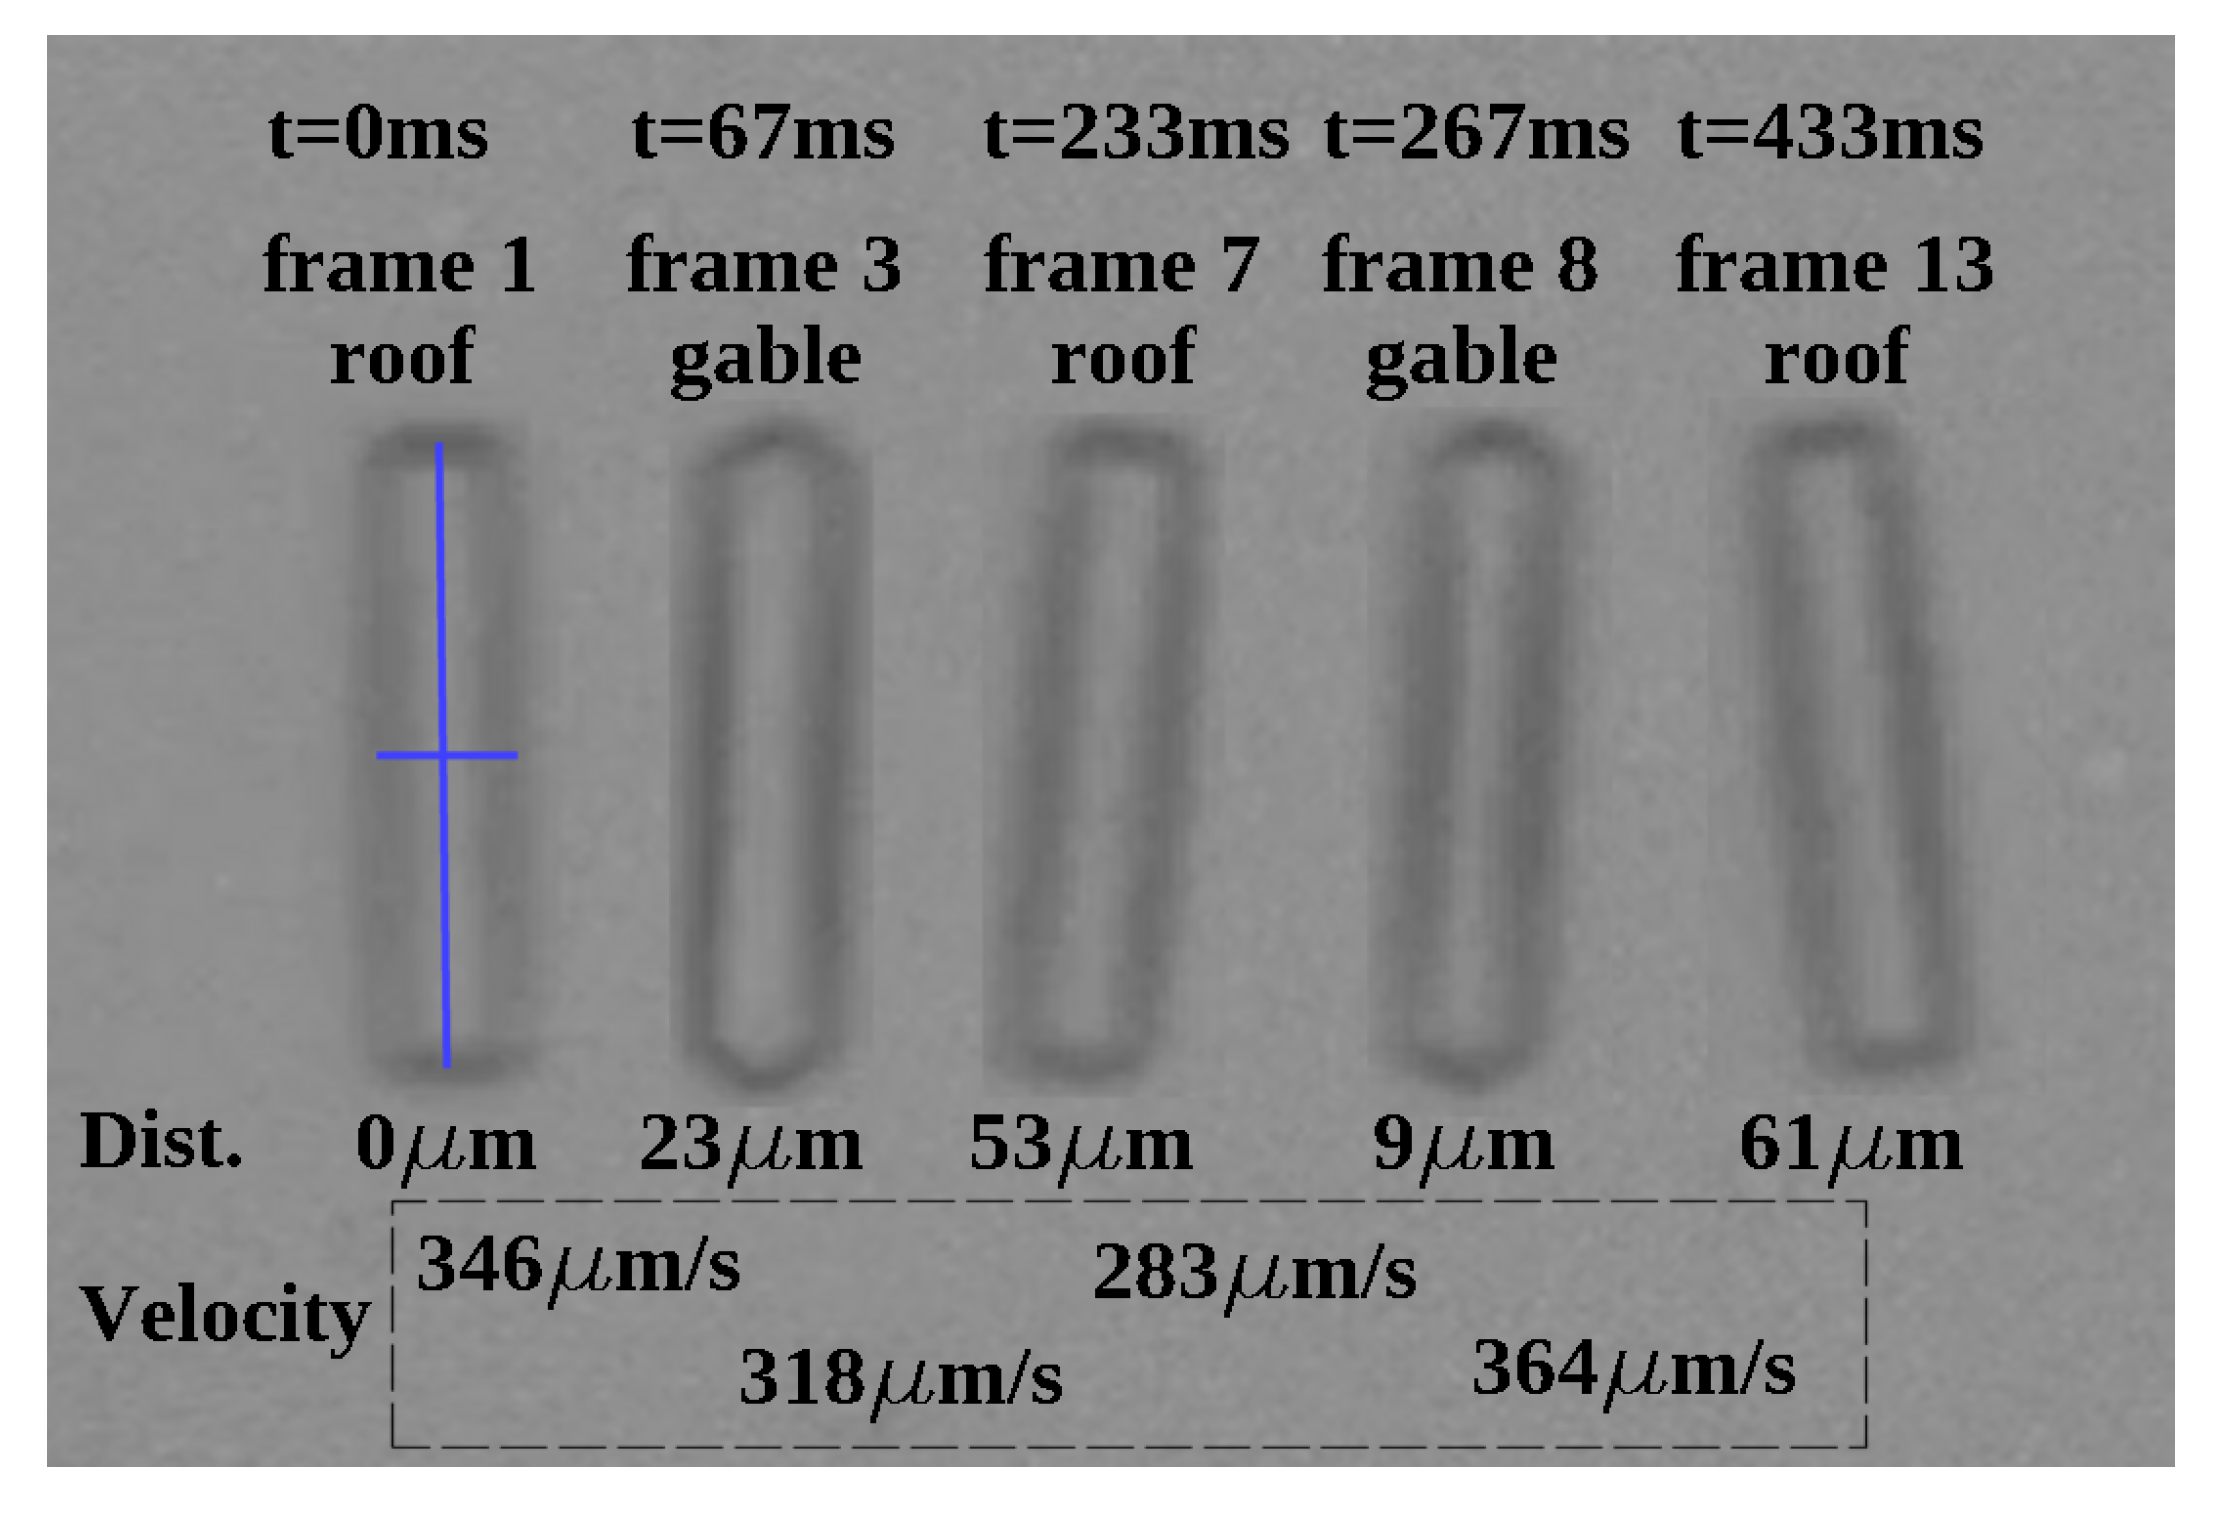
3.1. Time-Dependent Study

In order to gain understanding of the physical phenomena developed in the microfluidic channel, (namely the flow field, movement and forces exerted on the crystal), numerical simulations were performed on COMSOL Multiphysics software in two-dimensional space. Two reference coordinate systems are of special interest in the description of the governing equations. Those are the material frame (reference, initial) and the spatial frame (present, actual). They are used to describe initial geometry, and deformed geometry respectively. Computational fluid dynamic simulation coupled with solid mechanics [15] allows study of the unconstrained movement of the zeolite crystal inside the microfluidic channel. The flow in the channel, if assumed incompressible (constant ρ ), for low Reynolds number (Re 1 , the inertial term is neglected) is described in the spatial frame by the simplified Navier–Stokes equations,
ρ f u f t = · p f I + μ f u f + ( u f ) T + F ,
and ρ f · u f = 0 ,
where ρ f is the density of the fluid [kg/m 3 ], u f is the fluid velocity field [m/s, m/s] in the spatial (deformed) frame, p f is the pressure [Pa], · ( ) is the divergence operator, ( ) is the gradient operator, μ f is the fluid dynamic viscosity [Pa·s], and F is the volumetric force [N/m 3 ].
The governing equation for solids
ρ s 2 u s t 2 = · σ s + F s ,
where ρ s denotes the solid density [kg/m 3 ], u s is the solid displacement field [m, m], σ s is the Cauchy stress tensor defined in the spatial frame, and F s is the volumetric force [N/m 3 ].
The force generated by the fluid on the solid and the solid displacement affecting the fluid velocity is
F s = n · p f I + μ f u f + ( u f ) T ,
where u f = u s t ,
where n is the outward normal to the boundary and F s is the volumetric force on the solid boundary in the spatial (deformed) frame.
The time-dependent simulation of Equations (2)–(6) allowed study of the free motion of the crystal in the channel. The three-dimensional zeolite crystal (15 μ m × 15 μ m × 75 μ m) orthogonal to the flow direction, was represented in two-dimensional space as a central transversal slice, by a square which is free to translate and rotate in the plane, with side length of 15 μ m and a separation d = 6 μ m between a side parallel to the channel floor. This separation d allowed the square to translate and rotate without touching the floor, with a minimum distance of about 1.8 μ m between a downward- pointing corner and the floor. The distance between the centroid of the square and the floor (y axis direction) of 13.5 μ m remained nearly constant as the square translated (along the x axis) and rotated, with variations | δ | < 1 μ m. Narrowing the aforementioned separation leaded to errors in simulations or prohibitively large computation time. Figure 6 depicts a crystal slice near the bottom of the microchannel translating and rotating from 0 to 90 from time t 0 to t 1 , with velocity v.
The geometry of the simulated microchannel and crystal consisted of a segment of a vertical slice of the microchannel of (L × H = 500 μ m × 100 μ m) located at the center of the 2-mm channel width. The input was located at the left side and output at the right side, so hydrodynamic forces moved the square horizontally to the right (positive x axis). An image of the simulated microchannel geometry is shown in Figure 7.
Analysis of data from this time-dependent simulation allowed us to calculate translational and rotational velocities of the square as well as hydrodynamic drag force and torque as a function of time. Once the simulation was computed, by using line integration of the four lines of the square representing the crystal slice, the drag force was calculated by multiplying the negative of total stress in the flow direction times the crystal length. The torque τ was calculated by the line integral of the cross-product τ = ( r × F ) · 75 μ m where r is the vector from the center of the square to the ith element on the contour line and the force F is the total stress vector and 75 μ m is the crystal length. The negative sign produces a positive torque in a clockwise direction. Results of this time-dependent study are shown in Table 1.
Results shown in Table 1 represent the average values of computed velocities, forces, and torques applied on the crystal for at least 90 degrees of rotation. Simulated data was stored every millisecond (the first value was a peak and was discarded). We found that the simulated crystal moved faster (translational and rotational velocities) than the video-recorded crystals. A possible explanation for this behavior is an unmodeled opposing force due to contact forces between the crystal and the floor as it translates and rotates along the channel. In order to reach an agreement with the experimental crystal velocities, an opposing force was included in the simulation as a volumetric force in the negative x axis direction. The volumetric force is calculated from the drag force (N) divided by the crystal volume. An attempt to apply an opposing torque was made, to reduce the rotational velocity, but it caused errors in the simulation and it was omitted in this study.

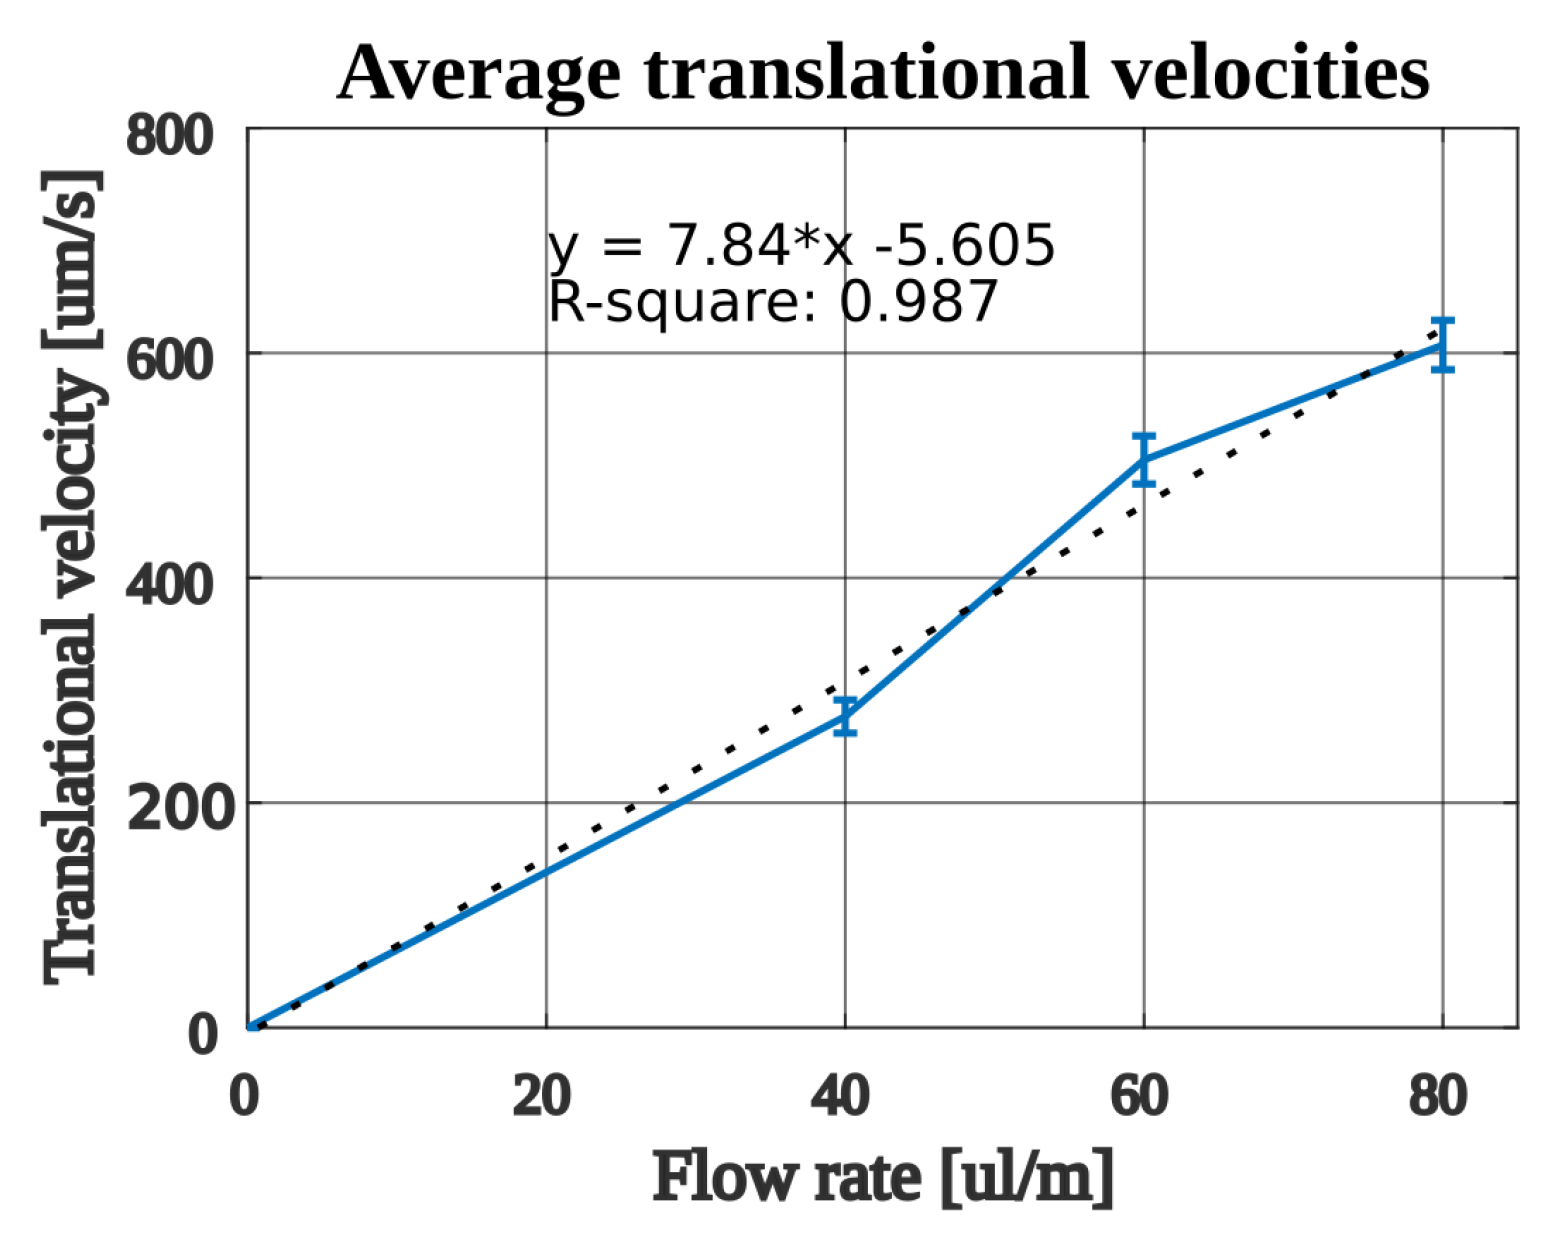
3.2. Stationary Study

The stationary study was used to calculate the drag force and torque applied by hydrodynamic forces in a static crystal. In this study, only the simplified Navier–Stokes equations were used. Normal flow to the entering the inlet of the channel segment was provided. The average flow velocity (m/s), calculated from the flow rate (m 3 /s) divided by channel cross section area (m 2 ), was used as the inlet flow velocity. Geometry representing the channel and the fixed crystal was the same one used in the time-dependent study subsection. Table 2 summarizes the results of this study.
We verified that the simulated translational velocity of the crystal in the time dependent study was slowed down to zero when we applied the volumetric force calculated from the stationary study (fixed square).

3.3. Volumetric Force Estimation

Thanks to the linear behavior of the simulated crystal translational velocity as a function of the volumetric force [9], a linear regression was able to estimate a good approximation of the required volumetric force which generated the experimentally observed crystal velocities. In order to calculate the straight-line equation y = m x + b , we used two points. The first point is obtained from the static simulation, where the drag force for a static body (zero velocity) is obtained. The second point comes from the time-dependent simulation, where drag force is minimum and velocity is maximum. The dependent variable is the drag force, and the independent variable the velocity of the body. In this way, we can calculate the required drag force from a given velocity (e.g., estimated from video). For a flow rate of 40 μ L/min, the first point is ( v 1 , F D 1 ) = (0 μ m/s, 2.13× 10 9 N) and the second point ( v 2 , F D 2 ) = (1717.7 μ m/s, 457.6× 10 15 N). The straight line equation yields
F D = 1.24× 10 12 Ns μ m v + 2.13× 10 9 [ N ] .
From recorded video (described in Section 3.4), we take one of the nine recorded events, and a translational velocity of 324.8 μ m/s is estimated. Substituting this velocity in Equation (7) yields an opposing force of 1.73× 10 9 [N], or equivalently a volumetric force of 102,359.98 [N/m 3 ] = 1.73× 10 9 [ N ] 15 × 15 × 75 × 10 18 m 3 . When this volumetric force is applied in the time-dependent simulation, it should decrease the free body velocity from 1717.7 μ m/s down to 324.8 μ m/s. Using this volumetric force estimation resulted in a slightly slower velocity of 287.9 μ m/s. A few attempts with smaller values of opposing force yields a value closer to the desired velocity. We found that a volumetric force of 100,500 [N/m 3 ] reduced the velocity to 318 μ m/s. The results obtained for the different flow rates are summarized in Table 3.
Drag forces for flow rates of 60 μ L/min and 80 μ L/min can be estimated by Equations (8) and (9), respectively.
F D = 1.2× 10 12 Ns μ m v + 3.2× 10 9 [ N ]
F D = 1.24× 10 12 Ns μ m v + 4.27× 10 9 [ N ]

3.4. Experimental Crystal Manipulation

The optofluidic system is capable of crystal transport in the microchannel. Translation and rotation of a ZSM-5 crystal of dimensions of 15 μ m × 15 μ m × 75 μ m was achieved. The preferred orientation of zeolite crystals, as they are translated, is orthogonal to the flow direction, assuming the crystals are far (200 μ m for our 2-mm-wide channel) from lateral walls. Near these walls (less than 200 μ m), caused by the nonslip condition and parabolic shape of the velocity profile, the orientation of the crystal gradually tends to be parallel to the flow direction. According to simulations, we have found that the presence of a crystal disturbs the flow profile in the longitudinal and transversal channel axes (also in the vertical axis, but all of the observed crystals are close to the floor plane). In the transversal direction of the microchannel, a disturbance of the flow profile, 0.5 mm from both sides of the crystal, and 1 mm before and after the crystal position in the longitudinal direction were observed in simulations. This is important in the sense that crystals in the study should be far enough from each other that they have a good agreement between simulations (where only one crystal is studied) and experiments (multiple crystals in the microchannel). If crystals are very close, flow profile will be disturbed and consequently hydrodynamic forces will be altered. Entrance length for only one active input was found to be 3 mm which means that the flow is fully developed 3 mm after the input and 3 mm before the output. When two inputs of the same flow rate are used, this distance is greatly reduced, however only one input was used in the experimental results reported in this work. Crystal velocity and distance were estimated from the recorded video (30FPS, 640 × 512 ). The distance was estimated by extracting images from video of initial and end frames, with a scale factor of 0.428 μ m/pixel, when using the 10× microscope objective. The crystal position was estimated from its centroid. Time reference was estimated from video frame rate. Flow rates (Q) of 40, 60, and 80 μ L/min were used to impart the hydrodynamic forces to start the crystal motion. Once the sample was prepared, the first experiment was carried out with Q = 40 μ L/min on 15 April 2021 19:55 and nine events were recorded. In the second experiment, Q = 60 μ L/min on 16 April 2021 13:52 and 10 events were recorded. The last experiment consisted of 10 events, recorded on 16 April 2021 14:48, with Q = 80 μ L/min. In Figure 8, an extract from the first video (Q = 40 μ L/min) is shown. Horizontal distances are not scaled because of overlapping between consecutive crystal orientation shifts.
It is worth mentioning that for every flow rate, some of the events reported initiated with a stuck crystal, then a finger tap on one of the input hoses caused a sudden flow in the microchannel, which detached the crystal. After the finger tap, the crystal settled, then the microfluidic pump was activated with the programmed flow rate. For Q = 40 μ L/min, in five out of nine events, the crystal was detached with a hose finger tap prior to the pump activation. For Q = 60 μ L/min and 80 μ L/min, the crystal was detached by finger taps, six times in a total of 10 events. In this work, we provide a method to estimate the opposing force experienced by a zeolite crystal near the bottom of a quartz microchannel, analyzing data from stationary and time-dependent simulations and the image velocimetry. Replacing the average translational velocity of the crystals in Equations (7)–(9), we calculate the aforementioned opposing force for the three flow rates. This opposing force is directly related to the adhesion forces between crystal and quartz slide and is a key parameter in the design of a closed loop control system for positioning or rotation of a crystal on the image coordinate system. A summary of the crystal average translational velocities and estimated opposing forces is shown in Table 4. Figure 9 shows a plot of the data in columns 1–3 of Table 4. Error bars of the figure represent the standard error in the mean, dotted line is a plot of the best fit line, which equation is displayed in the figure.

4. Discussion

We have proposed a method by which to manipulate and study zeolite crystals in a microfluidic channel by means of hydrodynamic forces produced by using syringe pumps in an optofluidic system. With this system, an individual zeolite crystal can be studied in a dynamically changing medium. Estimated opposing forces capture unmodelled dynamics in simulation, closely matching experimental measurements. We hope the results of this research will help to study single zeolite crystals, allowing for a better rational catalyst design. Experience gained in this work show that the best time to manipulate crystals is just after the sample has been placed in the microchannel. The reason is that the behavior of the crystals changes just a day after the initial experiment. The crystals start to stick at the tips, which causes erratic rolling behavior on translational movement by adding oscillating angles respective to the transversal direction and intermittent halting or strong attachment to the bottom of the channel. We found it extremely difficult to achieve a single shift from gable to roof orientation or vice versa by using only syringe pumps from a resting position, due to interaction forces. However, it is possible with the aid of a sudden pulsatile flow before the activation of the pump. An automated mechanism of generation of this kind of flow would significantly improve our method in order to achieve repeatable single orientation shifts. An atypical sample displayed a preferential sliding mechanism, in which very little rotation was observed along with the translational movement. A possible explanation for this behavior is the growth of organic material in the medium. The authors consider that more experiments and research are required to accurately model friction and adhesion forces on zeolite crystals immersed in deionized water in a quartz microchannel.

5. Conclusions

This paper proposed a method for alternating between gable and roof orientations of a zeolite crystal in a microfluidic channel. It is assumed that opposing forces experimented by zeolite crystals as they are transported in the channel under the influence of gravity, occur due to friction forces caused by interactions between the channel and crystals. The main focus on this paper was on the study of the movement of the crystal.

Author Contributions

Conceptualization, D.D.l.T. and V.G.-C.; methodology, J.D.D.S.-L.; validation, K.A.O.; formal analysis, D.D.l.T.; investigation, D.D.l.T.; resources, V.G.-C. and R.I.Y.-G.; data curation, D.D.l.T.; writing—original draft preparation, D.D.l.T.; writing—review and editing, J.D.D.S.-L. and J.I.N.-H. All authors have read and agreed to the published version of the manuscript.

Funding

This research received financial support from Universidad Autónoma de Baja California, MYDCI graduate program and CONACYT.

Institutional Review Board Statement

Not applicable.

Informed Consent Statement

Not applicable.

Data Availability Statement

Not applicable.

Acknowledgments

We acknowledge the financial support from Universidad Autónoma de Baja California, MYDCI graduate program, CONACYT and the access to the Laboratorio de Biofotónica facilities at CICESE research center.

Conflicts of Interest

The authors declare no conflict of interest.

Abbreviations

The following abbreviations are used in this manuscript:
ZSM-5Zeolite Socony Mobil-5
CFDComputational Fluid Dynamics
PDMSpolydimethylsiloxane
FSIFluid-Solid Interaction
PTFEPolytetrafluoroethylene
ODOuter Diameter
IDInner Diameter

References

  1. Hendriks, F.C.; Schmidt, J.E.; Rombouts, J.A.; Lammertsma, K.; Bruijnincx, P.C.A.; Weckhuysen, B.M. Probing Zeolite Crystal Architecture and Structural Imperfections Using Differently Sized Fluorescent Organic Probe Molecules. Chem. Eur. J. 2017, 23, 6305–6314. [Google Scholar] [CrossRef] [PubMed]
  2. Roeffaers, M.B.J.; Sels, B.F.; Uji-i, H.; De Schryver, F.C.; Jacobs, P.A.; De Vos, D.E.; Hofkens, J. Spatially Resolved Observation of Crystal-Face-Dependent Catalysis by Single Turnover Counting. Nature 2006, 439, 572–575. [Google Scholar] [CrossRef] [PubMed]
  3. Roeffaers, M.B.J.; Hofkens, J.; De Cremer, G.; De Schryver, F.C.; Jacobs, P.A.; De Vos, D.E.; Sels, B.F. Fluorescence Microscopy: Bridging the Phase Gap in Catalysis. Catal. Today 2007, 126, 44–53. [Google Scholar] [CrossRef]
  4. Kayani, A.A.; Khoshmanesh, K.; Ward, S.A.; Mitchell, A.; Kalantar-zadeh, K. Optofluidics Incorporating Actively Controlled Micro- and Nano-Particles. Biomicrofluidics 2012, 6, 031501. [Google Scholar] [CrossRef] [PubMed]
  5. Bruus, H. Theoretical Microfluidics; OUP: Oxford, UK, 2008; 346p, ISBN 9780199235087. [Google Scholar]
  6. Monat, C.; Domachuk, P.; Grillet, C.; Collins, M.; Eggleton, B.J.; Cronin-Golomb, M.; Mutzenich, S.; Mahmud, T.; Rosengarten, G.; Mitchell, A. Optofluidics: A Novel Generation of Reconfigurable and Adaptive Compact Architectures. Microfluid. Nanofluidics 2008, 4, 81–95. [Google Scholar] [CrossRef]
  7. Hamdallah, S.I.; Zoqlam, R.; Erfle, P.; Blyth, M.; Alkilany, A.M.; Dietzel, A.; Qi, S. Microfluidics for Pharmaceutical Nanoparticle Fabrication: The Truth and the Myth. Int. J. Pharm. 2020, 584, 119408. [Google Scholar] [CrossRef] [PubMed]
  8. Torino, S.; Iodice, M.; Rendina, I.; Coppola, G.; Schonbrun, E. A Microfluidic Approach for Inducing Cell Rotation by Means of Hydrodynamic Forces. Sensors 2016, 16, 1326. [Google Scholar] [CrossRef] [PubMed]
  9. Suo, J.; Edwards, E.E.; Anilkumar, A.; Sulchek, T.; Giddens, D.P.; Thomas, S.N. Force and Torque on Spherical Particles in Micro-Channel Flows Using Computational Fluid Dynamics. R. Soc. Open Sci. 2016, 3, 160298. [Google Scholar] [CrossRef] [PubMed]
  10. Shukla, N.; Henthorn, K.H. Effect of Relative Particle Size on Large Particle Detachment from a Microchannel. Microfluid. Nanofluidics 2009, 6, 521–527. [Google Scholar] [CrossRef]
  11. Hahn, P.; Lamprecht, A.; Dual, J. Numerical Simulation of Micro-Particle Rotation by the Acoustic Viscous Torque. Lab Chip 2016, 16, 4581–4594. [Google Scholar] [CrossRef] [PubMed]
  12. Stone, H.A. Introduction to Fluid Dynamics for Microfluidic Flows. In CMOS Biotechnology; Lee, H., Westervelt, R.M., Ham, D., Eds.; Series on Integrated Circuits and Systems; Springer: New York, NY, USA, 2007; ISBN 978-0-387-68913-5. [Google Scholar]
  13. Ahmad, T.; Hassan, I. Experimental Analysis of Microchannel Entrance Length Characteristics Using Microparticle Image Velocimetry. J. Fluids Eng. Trans. ASME 2010, 132, 0411021–04110213. [Google Scholar] [CrossRef]
  14. Burdick, G.M.; Berman, N.S.; Beaudoin, S.P. Describing Hydrodynamic Particle Removal from Surfaces Using the Particle Reynolds Number. J. Nanopart. Res. 2001, 3, 455–467. [Google Scholar] [CrossRef]
  15. Xu, X.; Li, Z.; Nehorai, A. Finite Element Simulations of Hydrodynamic Trapping in Microfluidic Particle-Trap Array Systems. Biomicrofluidics 2013, 7, 054108. [Google Scholar] [CrossRef] [PubMed]
Figure 1. Microfluidic device.
Applsci 13 02699 g001
Figure 2. Image of the zeolite crystal in the microchannel.
Applsci 13 02699 g002
Figure 3. Optofluidic system.
Applsci 13 02699 g003
Figure 4. Parabolic velocity profile.
Applsci 13 02699 g004
Figure 5. Forces acting on a zeolite crystal in a parabolic velocity profile.
Applsci 13 02699 g005
Figure 6. Crystal slice near the bottom of the microchannel.
Applsci 13 02699 g006
Figure 7. Geometry of channel and crystal.
Applsci 13 02699 g007
Figure 8. Experimental crystal translation/rotation for Q = 40 μ L/min.
Applsci 13 02699 g008
Figure 9. Average crystal translational velocities.
Applsci 13 02699 g009
Table 1. Results of FSI simulation of crystal in free motion.
Flow Rate Q [ μ L/min]Translational Velocity [ μ m/s]Drag Force [N]Angular Velocity [ /s]Torque [Nm]
401717.7457.6  × 10 15 3400177.1  × 10 18
602591.164.9  × 10 12 5045530.5  × 10 18
803428.94.2  × 10 12 6624−156.6  × 10 18
Table 2. Results of the fixed crystal simulation.
Flow Rate Q ( μ L/min)Flow Velocity (m/s)Drag Force (N)Torque (Nm)
403.33  × 10 3 2.13  × 10 9 6.49  × 10 15
60 × 10 3 3.2  × 10 9 9.75  × 10 15
806.67  × 10 3 4.27  × 10 9 13.01  × 10 15
Table 3. Simulated velocities with opposing force vs. experimental data.
Simulation1 Event of Experimental Data
Flow Rate Q [ μ L/min]Velocity [ μ m/s]Opposing Force 1 [N]Est. Opposing Force 2 [N]Force Error 3 [%]Velocity [ μ m/s]Velocity Error 4 [%]Angular Velocity [ /s]
40318 1.69× 10 9 1.73× 10 9 −2.16324.8−2.9900
60411.9 2.62× 10 9 2.7× 10 9 −2.85415−1.151351
80589.7 3.37× 10 9 3.52× 10 9 −4.38599.4−1.611621
1 The force that caused the simulated velocity shown in second column of Table 3. 2 The estimated force from Equation (7). 3 Percentage error between (1) and (2). 4 Percentage error between experimental and simulated velocities.
Table 4. Experimental results of crystal transport.
Flow Rate [ μ L/min]Average Velocity [ μ m/s]Standard Error of the Mean σ m [ μ m/s]Estimated Opposing Force [nN]
40276.714.81.79
60504.921.372.59
80607.121.983.51
Disclaimer/Publisher’s Note: The statements, opinions and data contained in all publications are solely those of the individual author(s) and contributor(s) and not of MDPI and/or the editor(s). MDPI and/or the editor(s) disclaim responsibility for any injury to people or property resulting from any ideas, methods, instructions or products referred to in the content.

