Article

Characteristics of the Contingent Negative Variation during Lower Limb Functional Movement with an Audio-Visual Cue

1
Rehabilitation Innovation Centre, Health and Rehabilitation Research Institute, Auckland University of Technology, Auckland 0627, New Zealand
2
Centre for Chiropractic Research, New Zealand College of Chiropractic, Auckland 1060, New Zealand
3
Department of Health Science and Technology, Aalborg University, 9220 Aalborg, Denmark
*
Author to whom correspondence should be addressed.
Appl. Sci. 2023, 13(4), 2621; https://doi.org/10.3390/app13042621
Submission received: 5 December 2022 / Revised: 17 January 2023 / Accepted: 13 February 2023 / Published: 17 February 2023

Abstract

:
Background: The contingent negative variation (CNV) is a negative shift in electroencephalography (EEG) related to the planning and execution of an externally cued movement task. The CNV has the potential to be applied within stroke rehabilitation; however, there is insufficient knowledge about the CNV characteristics under movement conditions relevant to rehabilitation. This study explores the CNV characteristics during a functional movement task (versus a simple movement task) and when using an audio-visual cue that has been previously evaluated for its usability in stroke rehabilitation (versus a simple visual cue). Methods: Thirty healthy participants performed five randomized movement tasks: simple ankle dorsiflexion with a visual cue (1), audio-visual cue (2), and auditory-only cue (3), and sit-to-stand with a visual (4) and audio-visual cue (5). Fifty repetitions of each movement were performed while continuous EEG was recorded. The band-passed and Laplacian-filtered (Cz) EEG was averaged for each condition and the peak negativity (PN) latency and amplitude were identified. Results: PN latency was significantly later during sit-to-stand with the audio-visual cue versus the visual cue (p = 0.027). PN amplitude was significantly larger during sit-to-stand versus ankle dorsiflexion, with both visual and audio-visual cues (p < 0.0001). Conclusion: The CNV changes under more complex movement conditions. Assumptions about the MRCP from simple laboratory recordings should not be generalized to the rehabilitation setting.

1. Introduction

The contingent negative variation (CNV) is a measure of the electrical activity of the brain; specifically, it is an event-related potential (ERP) associated with motor preparation and attention [1,2]. It is typically measured using electroencephalography (EEG) and is characterized by a negative slope beginning approximately 1–1.5 s prior to movement onset, a point of peak negativity around the time of movement onset, and then a positive slope [2]. The CNV has been used in a variety of research contexts, including studies of cognitive processes such as attention and decision-making [3], and studies of motor planning in populations with neurological [4] and psychiatric disorders [5]. Research on the CNV has found that it can provide valuable information about the integrity of cortical areas that connect with the corticospinal tract, which is the neural pathway that connects the cerebral cortex to the spinal cord and is responsible for voluntary movement [6]. In recent years, researchers have used the CNV to evaluate people with conditions such as locked-in syndrome [7], amyotrophic lateral sclerosis [8], stroke [9], and cerebral palsy [10]. Research has also shown that the CNV can be used to evaluate the efficacy of rehabilitation interventions such as physical therapy [3,11].
The CNV is a potential tool in the field of stroke rehabilitation and neuromodulatory interventions. Studies in people with stroke have shown that movements, both attempted and executed, can be detected in the electroencephalogram up to 2 s before they occur [12,13]. This makes the CNV useful as a control signal in brain–computer interface (BCI) applications that rely on early detection of movement intentions [14]. The CNV can be used to monitor the intention to move before the movement begins, as well as during the actual movement. Factors such as fatigue, level of attention, and movement type can all modulate the CNV [15,16,17]. One of the main benefits of using the CNV in stroke rehabilitation is the ability to detect movement intentions early, which may improve the effectiveness of BCI-based therapies. For example, if a patient with a stroke is able to generate a CNV signal indicating their intention to move a limb, a BCI system could provide feedback or assistance to help them execute the movement. This could be particularly useful for patients with severe motor impairments, who may have difficulty initiating or completing movements on their own.
Recently, the CNV has been used to drive the delivery of an endogenous paired associative stimulation (ePAS) intervention, where peripheral electrical stimulation is timed to coincide with the peak negativity (PN) of the CNV [13,18,19]. The CNV is recorded as the participant performs a movement and the timing of the PN of the CNV is determined in relation to the onset of the CNV or the onset of movement [20,21]. This timing is used to drive the delivery of electrical stimulation to the common peroneal nerve and is essential to the efficacy of the intervention [21]. This ePAS intervention has been shown to increase corticomotor excitability and improve lower limb impairment in people with stroke [13] and therefore has the potential to improve the long-term recovery of this population. The next phase of research should involve testing the effectiveness of the ePAS intervention within a stroke rehabilitation context; however, limited knowledge about the characteristics of the CNV is hindering the progression of this intervention towards clinical trials.
The first limitation with applying ePAS into a stroke rehabilitation context is the movement task in which the CNV is recorded. To date, the ePAS intervention has largely been delivered using single-joint movements [13,18,19,22]. These single-joint movements, also known as isolation exercises, focus on the movement of a single muscle group [23]. Examples include bicep curls at the elbow joint, leg extensions at the knee joint, and the most widely-used with ePAS, dorsiflexion of the ankle joint [13,18,19,22]. These single-joint movements may be considered boring and monotonous by some people during rehabilitation, as they may not relate to meaningful tasks [24]. Functional movements, on the other hand, involve multiple joints and muscle groups and are designed to mimic everyday movements and activities. Examples include throwing, reaching for objects, and walking [3]. In rehabilitation, functional movement training is preferred as it improves the ability to perform daily tasks and enhances recovery after stroke [25]. Furthermore, single-joint movement training during ePAS delivery has been shown to limit engagement and acceptability [26]. Therefore, for ePAS to be applied within a stroke rehabilitation setting, it needs to be incorporated into the functional movement tasks used in clinical practice, such as sit-to-stand and stepping [25], rather than being restricted to single-joint movements. The ePAS intervention has the potential to be applied during functional movements; however, there is limited knowledge about how the timing of the CNV might change under different movement conditions and how this might alter intervention efficacy. Thus, there is a need to investigate the characteristics of the CNV during functional movement tasks in preparation for testing the ePAS intervention within a stroke rehabilitation setting. In this study, the characteristics of the CNV are examined for two movement types: (1) single-joint movement (ankle dorsiflexion), and (2) functional movement (sit-to-stand).
The second limitation of the clinical translation of ePAS is the visual cue used to prompt the participant to perform the required movement (e.g., ankle dorsiflexion). The current cue is entirely visual, designed for laboratory-based studies, and requires the participant’s continuous attention. Although such visual cues are helpful in guiding and improving the execution of exercises during rehabilitation, some individuals may find visual cues dull and tedious if they are the only form of instruction provided. Furthermore, in our experience, many people with stroke find it challenging to focus on the visual cue for an extended period. Therefore, a more user-friendly audio-visual cue has been developed following iterative usability testing with physiotherapists and people with stroke [27]. This audio-visual cue provides multiple sources of information, and can help to keep an individual engaged and motivated during the exercise. However, the characteristics of the CNV elicited in response to this novel audio-visual cue are unknown. Thus, there is a need to quantify the properties of the CNV in relation to this novel audio-visual cue so that it can be used in future investigations of the ePAS intervention.
Based on the above-mentioned limitations, further research is needed to understand how the CNV might change under different movement conditions relevant to rehabilitation. Therefore, this study aimed to investigate the characteristics of the CNV during (i) a functional sit-to-stand movement compared with a simple ankle dorsiflexion movement, and (ii) using a novel audio-visual cue compared with a simple visual cue.

2. Materials and Methods

This was a cross-sectional study. Participants attended a single session where their CNV was recorded during five different movement conditions.

2.1. Participants

Participants were 30 healthy adults over 20 years of age. Volunteers were interviewed and excluded if they had medical conditions that might influence the EEG recordings, such as neurological disorders or metal implants in the head, or any conditions that might limit their ability to engage with the testing, such as lower limb pain or cognitive, perceptual, or communication impairments. Participants were asked to refrain from consuming caffeine or exercising prior to the testing session. All participants provided written informed consent and the study received ethical approval from the Auckland University of Technology Ethics Committee (19/431).

2.2. Equipment Set Up
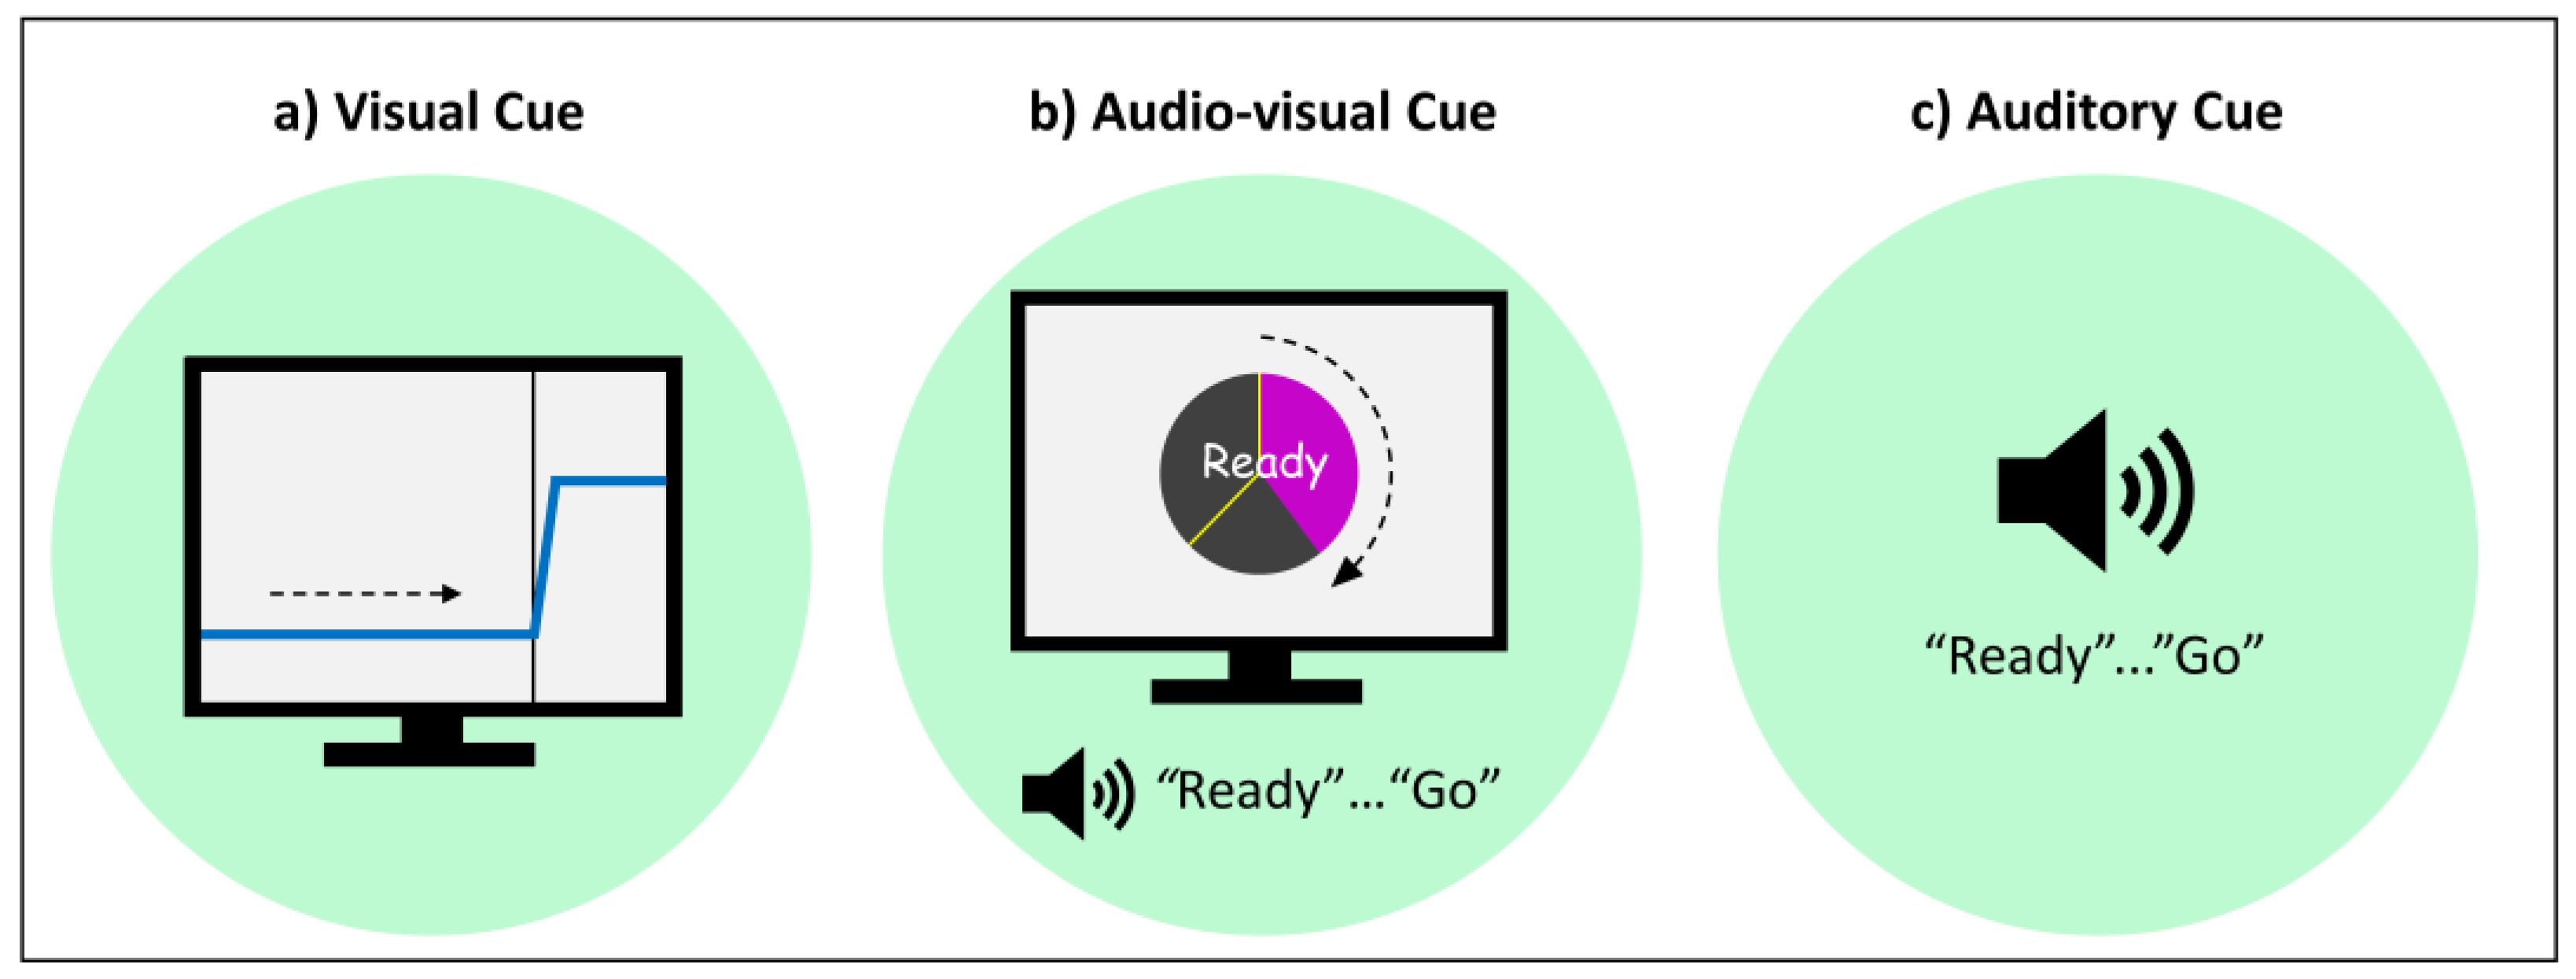
Participants sat in a chair without armrests. An EEG cap (40 channel Quik-cap, Ag/AgCl electrodes; Compumedics Neuroscan) was mounted with the Cz electrode placed midway between the nasion and the inion in the sagittal plane, and midway between each tragus in the coronal plane. A sterile blunt needle was used to abrade the skin and apply conductive gel to the FP1, FP2, F3, Fz, F4, FC3, FCZ, FC4, C3, Cz, C4, CP3, CPZ, CP4, P3, Pz, P4, O1, O2, and ground electrodes (impedance < 5 kΩ). The reference electrode was secured to the right mastoid process with elasticated adhesive tape.

2.3. Movement Cues

Three different cues were used to prompt the timing of voluntary movements. The standard visual cue (Figure 1a) has been described in previous studies [18,28] and was presented on a computer screen positioned approximately 1.2 m in front of the participant. This cue prompted participants to (i) bring their attention to the screen (2–3 seconds (s)); (ii) prepare for movement by watching a moving horizontal line (3 s); iii) execute the movement when the line ramps upwards (1.5 s); and then (iv) rest (6–8 s). Participants were asked to focus their eyes on the point of the screen where the line ramps up to limit eye movements. The audio-visual cue (Figure 1b) was presented on the same computer screen in front of the participant. This cue prompted participants to (i) prepare for movement on the word READY (3 s), and (ii) execute the movement on the word GO (1.5 s). The visual aspect of the cue represents the moving hand of a clock, with different colored sections for the READY and GO phases. Participants were asked to focus their eyes on the line representing the start of the GO phase. The auditory-only cue (Figure 1c) involved just the auditory aspects of the auditory cue with the prompts READY (3 s) and GO (1.5 s).

2.4. Procedures

EEG was recorded during five different movement conditions. Each movement condition required the participant to perform 50 repetitions (2 sets of 25 repetitions) of either voluntary ankle dorsiflexion or sit-to-stand. Movements were performed briskly. The five movement conditions were: ankle dorsiflexion while sitting, with either the visual cue (Condition 1), audio-visual cue (Condition 2), or auditory-only cue (Condition 3); and sit-to-stand with either the visual cue (Condition 4) or audio-visual cue (Condition 5). The auditory cue was only used with one movement (ankle dorsiflexion) to enable the determination of any EEG characteristics associated with the auditory aspect of the audio-visual cue. Movement conditions were pseudo-randomized to balance the order of conditions. An amplifier recorded continuous EEG data with a sampling frequency of 500 Hz and 32 bits accuracy (NuAmps 40 channel digital EEG and ERP amplifier and SCAN 4.5 software; Compumedics Neuroscan, United States).

2.5. Data Processing

The raw EEG from the amplifier data was preprocessed offline using EEGLAB (version 14.1.1) [29] and ERPLAB (version 6.1.4) [30] running on MATLAB 2021b (The MathWorks, Inc, Natick, MA, USA.). The raw data were first bandpass-filtered at (0.1 Hz–10 Hz) using a 2nd order IIR Butterworth. A high-pass cutoff of 0.1 Hz was used to remove the DC drift which corrupts these low-frequency signals, and a low-pass cutoff of 10 Hz removed colored noise components from the signal. This provided a noise-free clean signal to use for signal detection.

2.5.1. Surrogate Channel

The Laplacian filter is a spatial filtering technique used to enhance the spatial resolution of the EEG signals by emphasizing the difference between the signal at one electrode and the average of the signals at its neighboring electrodes. In this study, a large Laplacian filter was applied to nine channels (Fz, Cz, Pz, F3, C3, P3, F4, C4, P4) to create a surrogate channel centered around the Cz electrode [12]. This was executed using the equation provided below, where Nch is the number of channels and xi is the ith channel, which in this case is Cz.
x i =         1                                                               i = 1 1 N c h 1                                                 i 1
The purpose of applying the Laplacian filter is to increase the spatial resolution of the EEG signals and to focus on the activity at the Cz electrode.

2.5.2. Epoch Extraction

Following preprocessing, epochs were extracted from 2000 ms before to 1000 ms after the cue for all five conditions. Each epoch contained a 2000 ms “movement preparation phase” that ended with the cue to move, followed by a 1000 ms “movement phase.” The epochs obtained were then subjected to the ERPLAB artifact detection algorithm of simple voltage threshold [30]. A threshold of ±125 µV was set [31,32] and the epochs in which the signal exceeded ±125 µV on any channel were rejected.
The average CNV waveform for each movement condition was calculated for each subject, and a 1000 ms latency window was placed ±500 ms from the cue (shaded area in plots in Figure 2). The PN was then selected and marked between the defined latency window using a custom ERPLAB routine. The latency and amplitude of the PN of the CNV for each condition for all participants was saved for further analysis.

2.6. Data Analysis

The variation in PN latency and PN amplitude across movement and cue types was analyzed using a linear mixed-effects models in R using the lme4 package [33,34]. The main effects of movement and cue type along with their interaction were evaluated with likelihood ratio tests on the mixed models. In the case of significant main effects or interactions, appropriate pair-wise mean differences and their statistical significance were also reported. The statistical significance level was set at 0.05. Tukey’s HSD method was used to correct for multiple comparisons.

3. Results

3.1. Sample

Data were collected from 30 participants. For three subjects, the signal exceeded the threshold value of ±125 µV and therefore the data for 27 participants for each condition were analyzed.

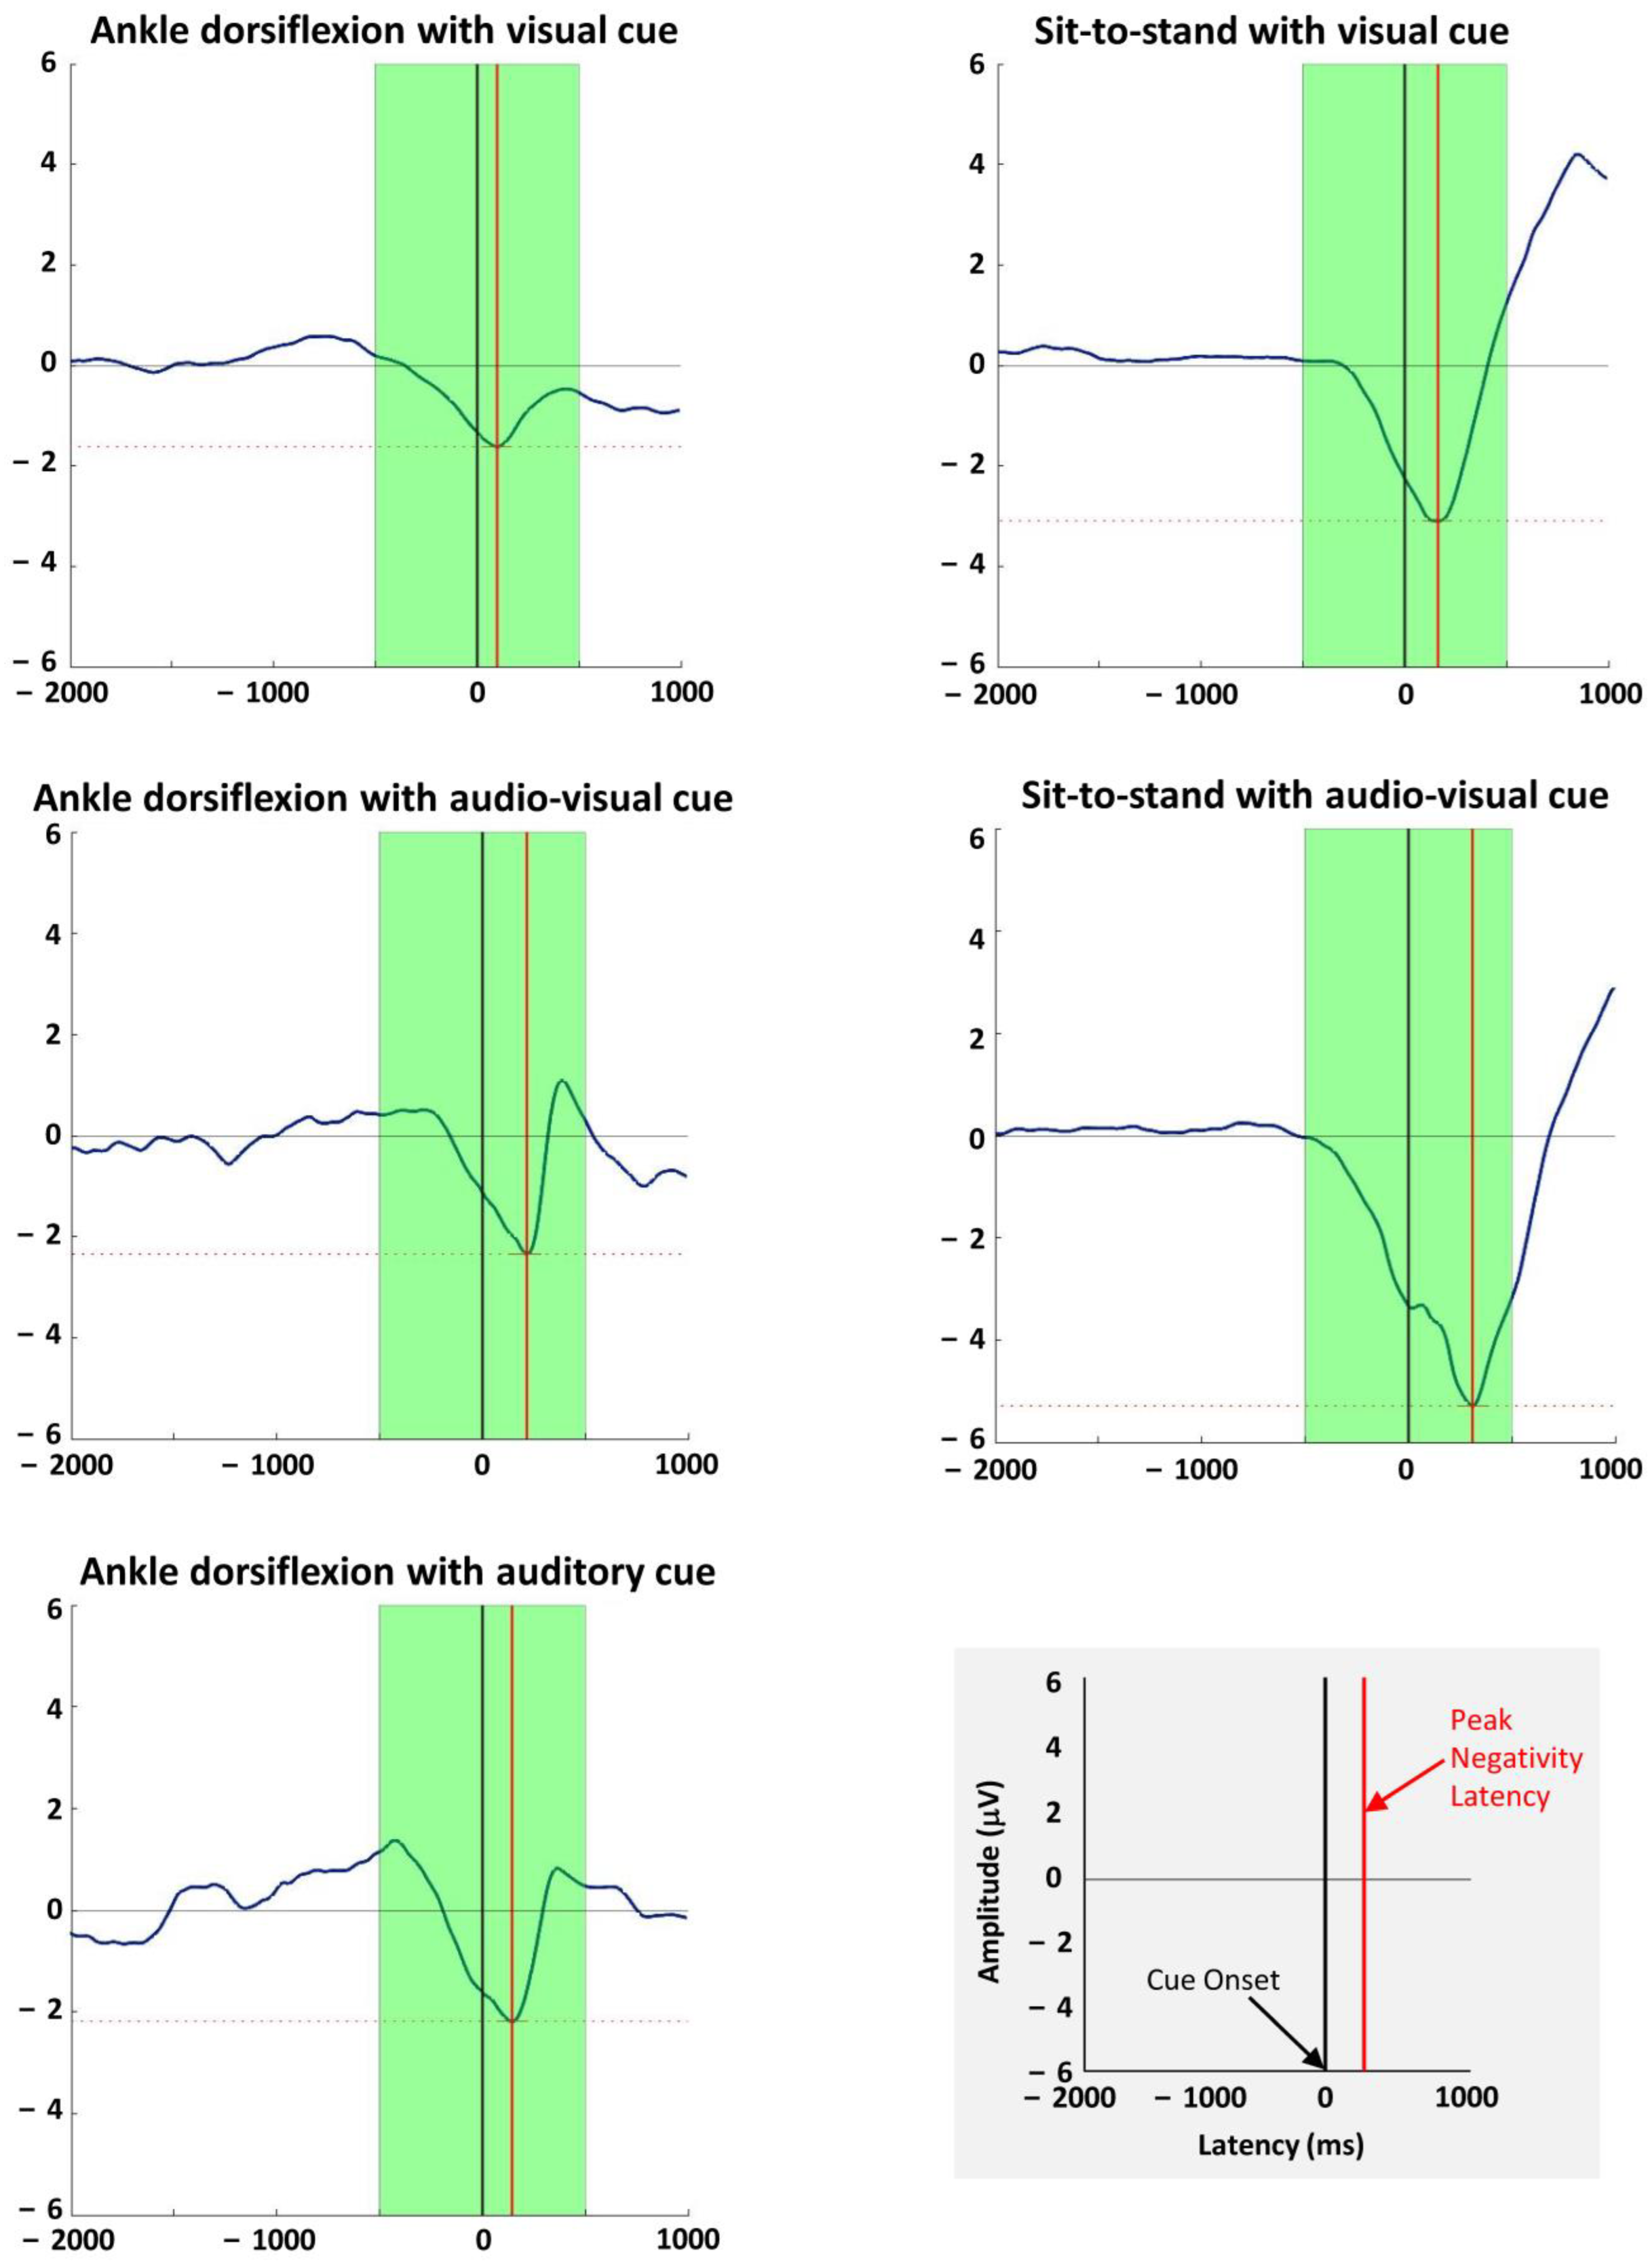
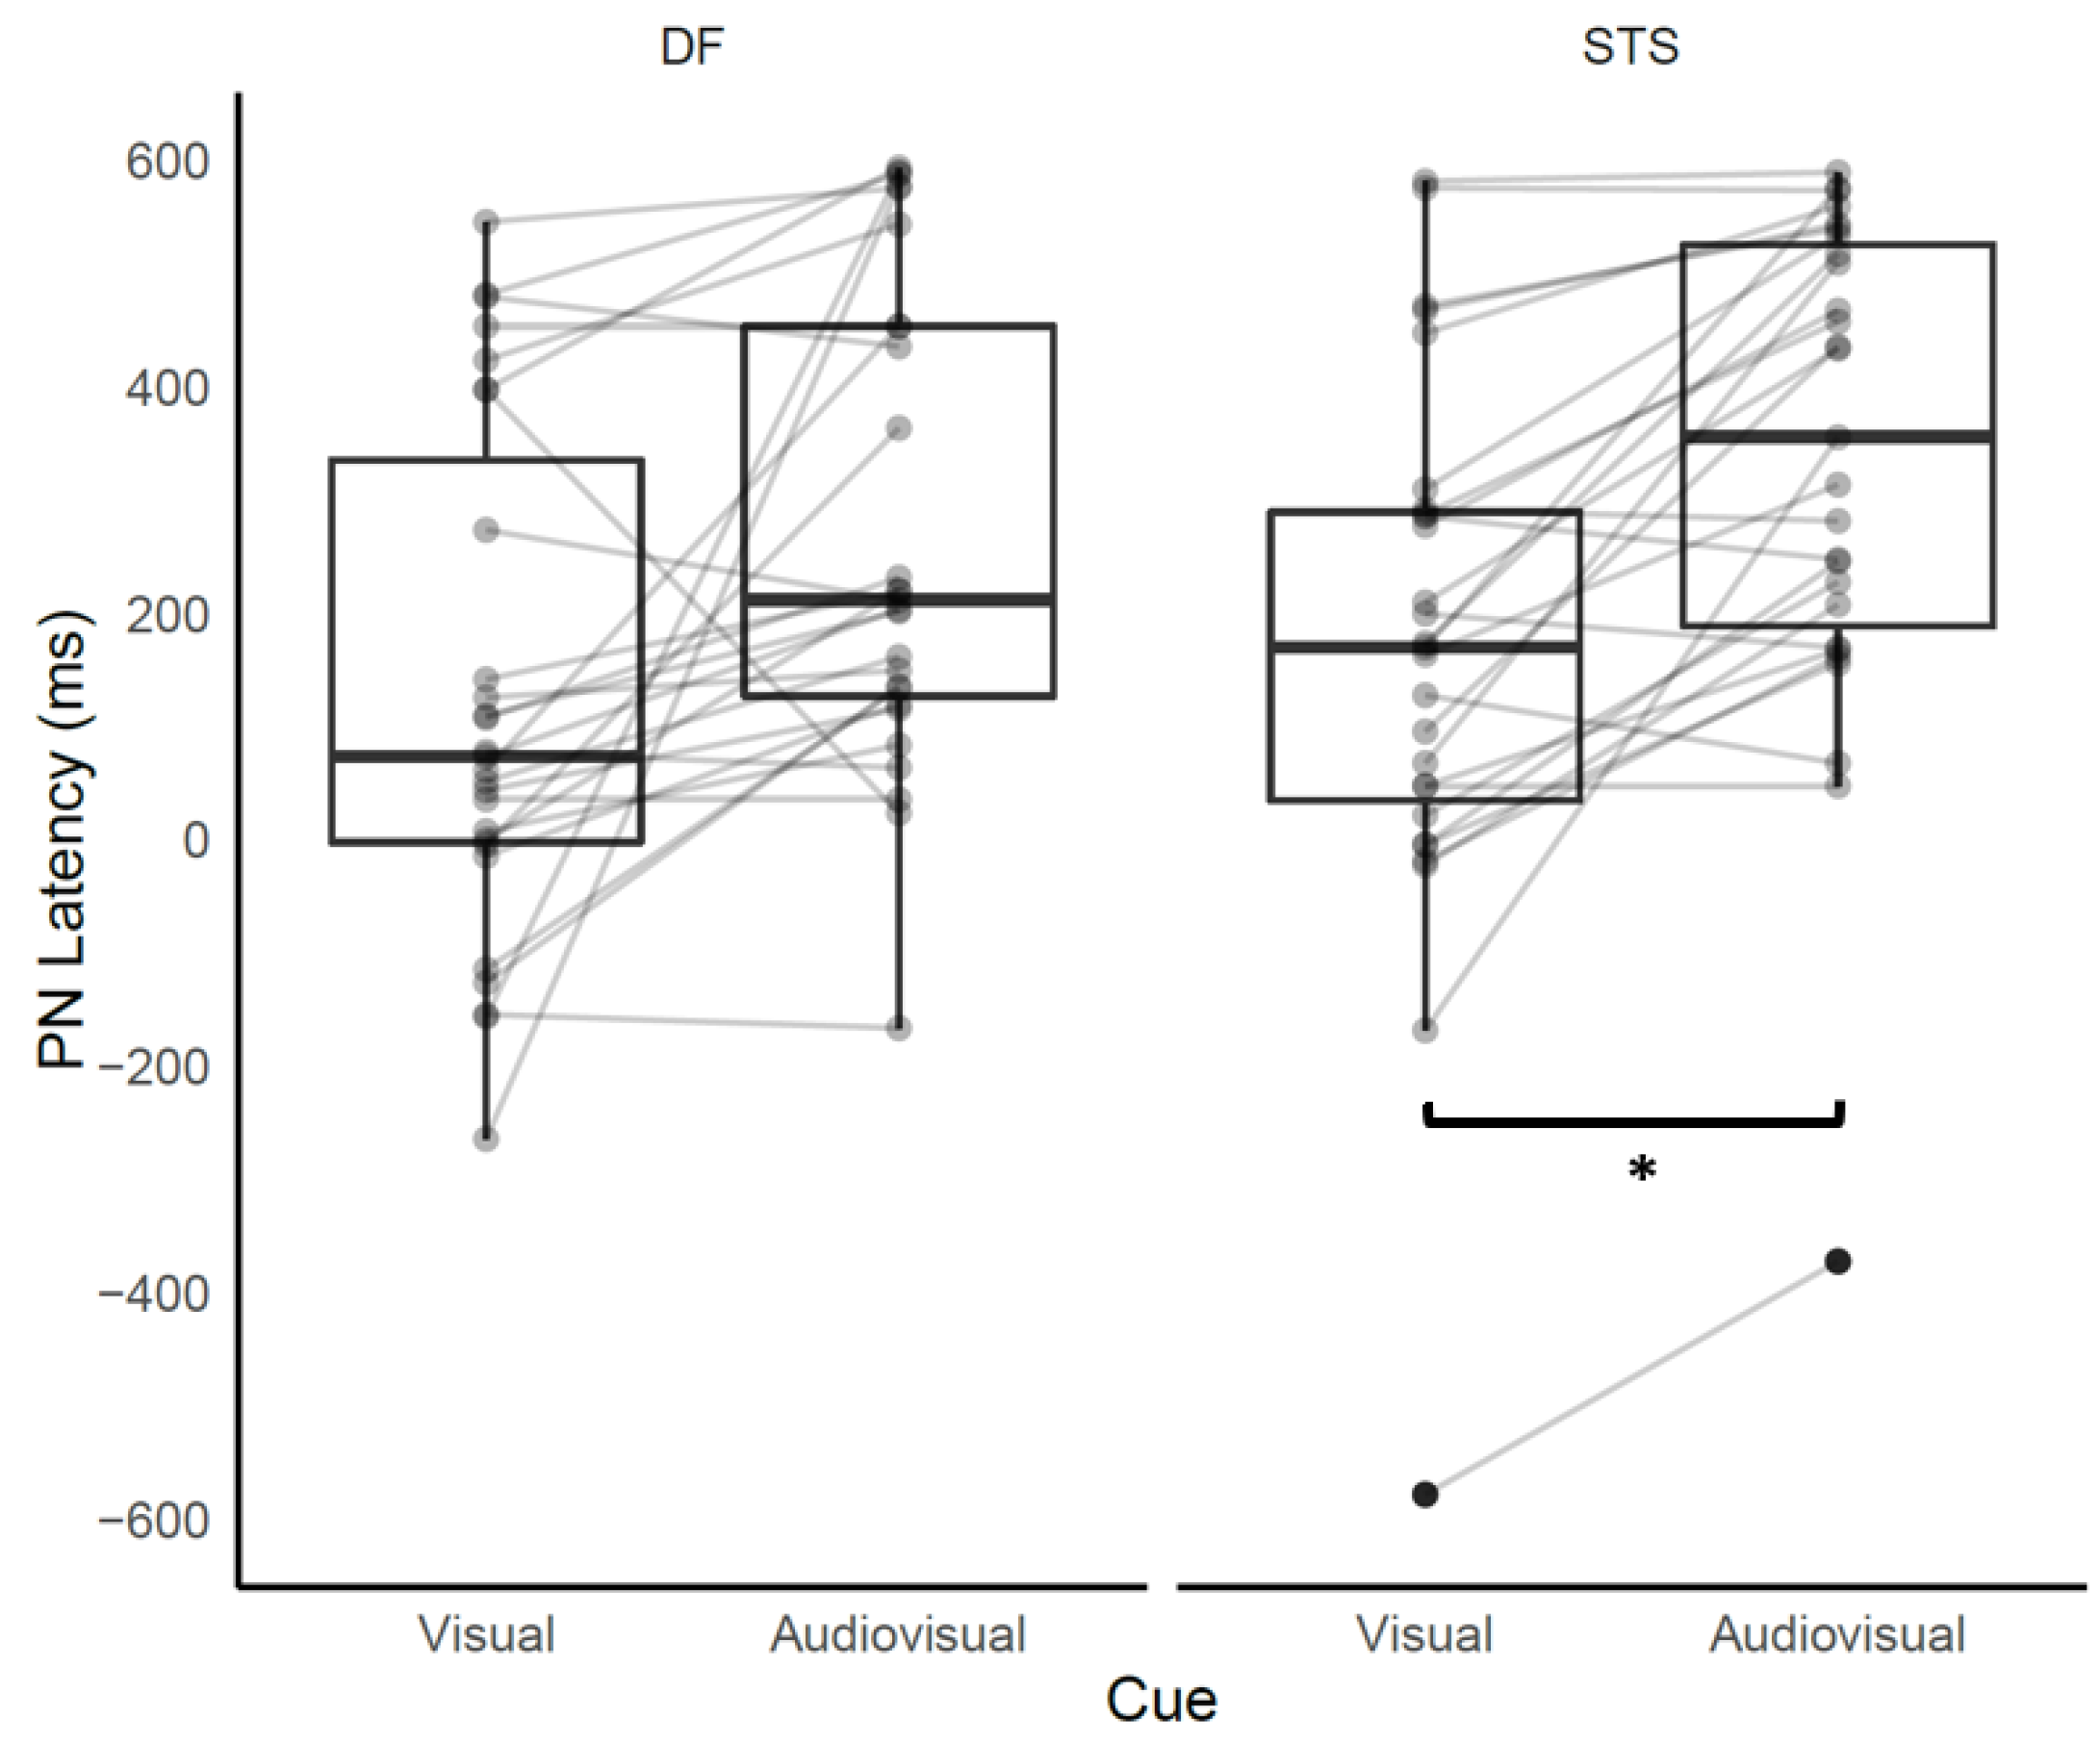
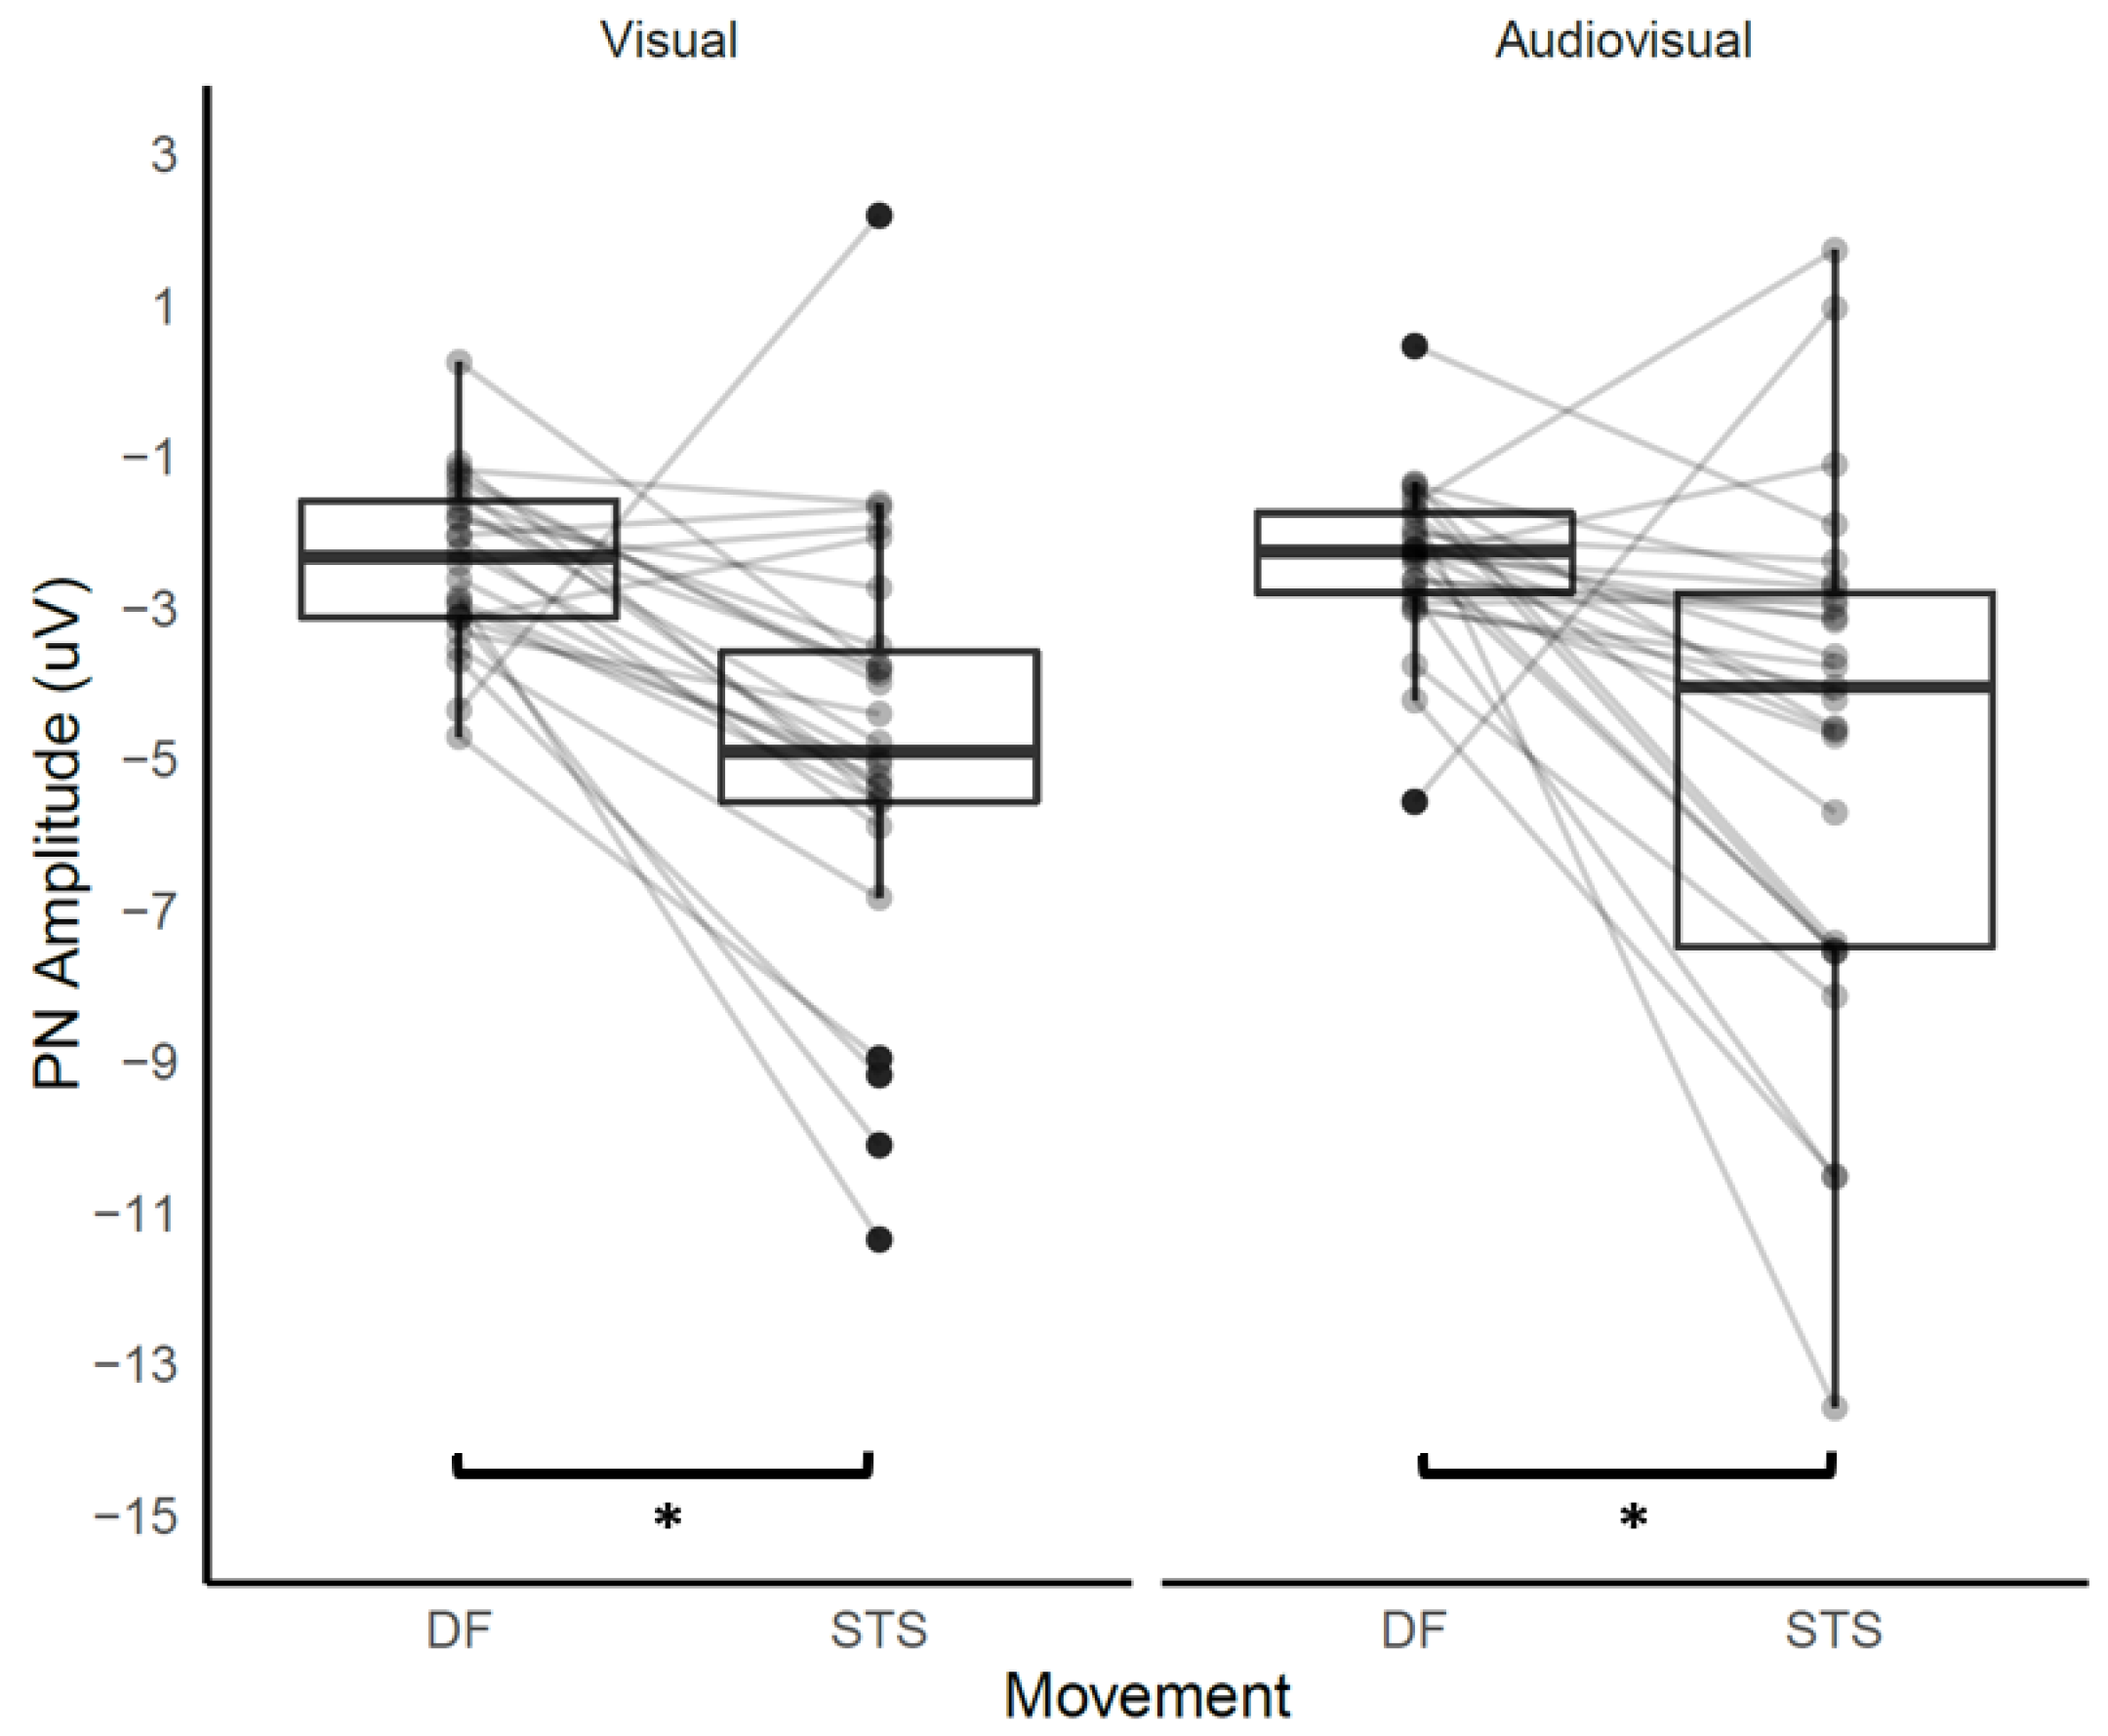
3.2. CNV Characteristics under Different Movement Conditions

The grand-average CNV for each condition is shown in Figure 2. For PN latency (Table 1), there was a significant main effect of ‘cue’ (p = 0.002). Post-hoc tests revealed that PN latency during sit-to-stand was significantly later with the audio-visual cue compared with the visual cue (p = 0.027). This is illustrated in Figure 3. PN latency during ankle dorsiflexion was also later with the audio-visual cue compared with the visual cue, but this was not statistically significant (p = 0.067).
For PN amplitude (Table 2), there was a main effect of “movement type” (p = 0.000). Post-hoc tests revealed that the PN amplitude was significantly larger during sit-to-stand compared to ankle dorsiflexion, for both audio-visual and visual cues (p < 0.0001). See Table 2 and Figure 4.

4. Discussion

To our knowledge, this is the first study to establish differences in the CNV characteristics when using an audio-visual cue compared with a standard visual cue during functional lower limb movements. Our findings demonstrated that during sit-to-stand movements, the PN of the CNV was significantly delayed by an estimated mean of 166 ms (95% CI 15, 317) when using the audio-visual cue compared with a simple visual cue. This delay could be explained by the increased attentional and processing demands required for integration of both the auditory and visual components of the audio-visual cue [35]. Furthermore, the visual components of the audio-visual cue were more complex than the standard visual cue, requiring the participant to estimate timing from a rotating line rather than a line moving horizontally, and to process three different colors compared to the simple blue and black lines in the visual cue (see Figure 1). These factors are likely to have required more central processing and delayed the time to movement execution. Previous CNV research has shown that adding complexity to the visual cue or the upper limb movement sequence being cued delays the PN of the CNV in healthy participants [36]. Thus, the additional attentional demands of the cue appear to delay the CNV. This has implications for the delivery of the ePAS neuromodulatory intervention in which the PN latency is thought to be vital to the efficacy of the intervention [21]. In the ePAS intervention, peripheral electrical stimulation is delivered just prior to the PN in order to generate an afferent volley that arrives in the motor cortex to coincide with the PN; this pairing of afferent stimulation with endogenous motor activation increases corticomotor plasticity [21] and voluntary neuromuscular activation [18]. Changes in the timing of the PN may alter the efficacy of the intervention [21,22] and researchers should be aware that the PN latency could be altered when movement preparation is guided by a more complex cue or when additional sensory stimuli are present.
It is noted that the audio-visual cue altered PN latency during sit-to-stand, but not ankle dorsiflexion (p = 0.067). As shown in Figure 3, there was more variability in PN latency across the sample in the ankle dorsiflexion condition, which may have influenced the lack of significant findings for PN latency in this task. This may relate to participants being more distractable during this very simple task, as effort level is known to alter CNV characteristics [37].
The audio-visual cue did not alter the amplitude of the CNV. Therefore, regardless of the delay in motor planning described above for sit-to-stand tasks, the magnitude of cortical activation appeared unaffected. Previous studies have shown that increased complexity of the cue and movement sequence [36], or the addition of a secondary movement task [38], reduces the CNV amplitude. Thus, it is promising that the audio-visual cue in the present study was not complex enough to reduce the magnitude of neural activation for the target movement. However, it may also be important to consider the effect of the audio-visual cue when performing different types of movements or tasks. For example, it may have a different effect on upper-limb movements compared to lower-limb movements, or on complex tasks requiring increased attention compared to simple tasks. Moreover, it should be emphasized that our study was limited to healthy adults, and that the effect of different movement cues on the CNV may be different in the stroke population and may vary according to the stroke-related impairments. For example, in an individual with sensory or perceptual issues, the attentional demands of the audio-visual cue may be more significant. Thus, further research is required to establish if these findings hold in the stroke population.
When comparing simple versus functional movements, our findings demonstrated that sit-to-stand movements resulted in larger PN amplitudes compared to simple ankle dorsiflexion. This is consistent with previous observational literature demonstrating that CNV amplitudes increase with greater movement complexity [3]. Our findings showed that PN latency was not significantly altered by more complex movement, which is consistent with the findings of Rashid et al. 2018 [31] comparing simple ankle dorsiflexion versus step-ups. This suggests the PN latency may be similar across other movement types, although this needs to be determined in the stroke population.

5. Conclusions

This research set out to determine if the CNV characteristics would change under movement conditions relevant to rehabilitation; specifically, when performing functional lower limb movements, and when using a novel audio-visual cue. The study demonstrated that the characteristics of the CNV in healthy people changed under more complex movement conditions. The PN latency was delayed with an audio-visual cue versus a visual cue, and the PN amplitude was larger with a functional movement versus a simple, single-joint lower limb movement. Thus, assumptions about the MRCP from laboratory recordings during single-joint movements should not be generalized to the functional movements used in rehabilitation. Future research should explore the characteristics of the CNV in the stroke population.

Author Contributions

Conceptualization, G.A., U.R., S.O., N.S., D.T. and I.K.N.; Methodology, S.O., G.A., U.R., U.G. and I.K.N.; Data collection, S.O. and N.B.; Software, U.R. and I.K.N.; Validation, S.O., U.R., U.G. and N.B.; Formal Analysis, U.G. and U.R.; Investigation, S.O., G.A., U.R., U.G., N.S., D.T. and I.K.N.; Resources, N.S., D.T. and I.K.N.; Data Curation, S.O., N.B. and U.G.; Writing—Original Draft Preparation, S.O.; Writing—Review and Editing, S.O., G.A., U.R., U.G., N.B., N.S., D.T. and I.K.N.; Visualization, S.O., U.R., U.G. and I.K.N.; Supervision, N.S., D.T. and I.K.N.; Project Administration, S.O. and I.K.N.; Funding Acquisition, S.O. and I.K.N. All authors have read and agreed to the published version of the manuscript.

Funding

This research was supported by a summer studentship funded by the Neurology Special Interest Group of Physiotherapy New Zealand. The APC was funded by the NZ College of Chiropractic.

Institutional Review Board Statement

The study was conducted in accordance with the Declaration of Helsinki, and approved by the Auckland University of Technology Ethics Committee (19/431, 11 December 2019).

Informed Consent Statement

Informed consent was obtained from all participants involved in the study.

Data Availability Statement

Ethical approval did not include data sharing.

Conflicts of Interest

The authors declare no conflict of interest.

References

  1. Walter, W.G.; Cooper, R.; Aldridge, V.J.; McCallum, W.C.; Winter, A.L. Contingent negative variation: An electric sign of sensori-motor association and expectancy in the human brain. Nature 1964, 203, 380–384. [Google Scholar] [CrossRef]
  2. Shakeel, A.; Navid, M.S.; Anwar, M.N.; Mazhar, S.; Jochumsen, M.; Niazi, I.K. A review of techniques for detection of movement intention using movement-related cortical potentials. Comput. Math. Methods Med. 2015, 2015, 346217. [Google Scholar] [CrossRef] [Green Version]
  3. Olsen, S.; Alder, G.; Williams, M.; Chambers, S.; Jochumsen, M.; Signal, N.; Rashid, U.; Niazi, I.K.; Taylor, D. Electroencephalographic recording of the movement-related cortical potential in ecologically valid movements: A scoping review. Front. Neurosci. 2021, 15, 721387. [Google Scholar] [CrossRef]
  4. Monge-Pereira, E.; Molina-Rueda, F.; Rivas-Montero, F.M.; Ibanez, J.; Serrano, J.I.; Alguacil-Diego, I.M.; Miangolarra-Page, J.C. Electroencephalography as a post-stroke assessment method: An updated review. Neurologia 2017, 32, 40–49. [Google Scholar] [CrossRef]
  5. Osborne, K.J.; Kraus, B.; Lam, P.H.; Vargas, T.; Mittal, V.A. Contingent negative variation blunting and psychomotor dysfunction in schizophrenia: A systematic review. Schizophr. Bull. 2020, 46, 1144–1154. [Google Scholar] [CrossRef]
  6. Bai, O.; Vorbach, S.; Hallett, M.; Floeter, M.K. Movement-related cortical potentials in primary lateral sclerosis. Ann. Neurol. Off. J. Am. Neurol. Assoc. Child Neurol. Soc. 2006, 59, 682–690. [Google Scholar] [CrossRef]
  7. Guger, C.; Spataro, R.; Allison, B.Z.; Heilinger, A.; Ortner, R.; Cho, W.; La Bella, V. Complete locked-in and locked-in patients: Command following assessment and communication with vibro-tactile P300 and motor imagery brain-computer interface tools. Front. Neurosci. 2017, 11, 251. [Google Scholar] [CrossRef]
  8. Bizovicar, N.; Zidar, I.; Koritnik, B.; Zidar, J. Inspiratory- and finger-flexion-related cortical potentials in patients with amyotrophic lateral sclerosis--an exploratory study. Clin. Neurol. Neurosurg. 2012, 114, 455–459. [Google Scholar] [CrossRef]
  9. Peters, S.; Ivanova, T.D.; Lakhani, B.; Boyd, L.A.; Staines, W.R.; Handy, T.C.; Garland, S.J. Symmetry of cortical planning for initiating stepping in sub-acute stroke. Clin. Neurophysiol. 2018, 129, 787–796. [Google Scholar] [CrossRef]
  10. Jochumsen, M.; Shafique, M.; Hassan, A.; Niazi, I.K. Movement intention detection in adolescents with cerebral palsy from single-trial EEG. J. Neural Eng. 2018, 15, 066030. [Google Scholar] [CrossRef] [Green Version]
  11. Bae, S.H.; Lee, J.H.; Oh, K.A.; Kim, K.Y. The effects of kinesio taping on potential in chronic low back pain patients anticipatory postural control and cerebral cortex. J. Phys. Ther. Sci. 2013, 25, 1367–1371. [Google Scholar] [CrossRef] [Green Version]
  12. Jochumsen, M.; Niazi, I.K.; Mrachacz-Kersting, N.; Jiang, N.; Farina, D.; Dremstrup, K. Comparison of spatial filters and features for the detection and classification of movement-related cortical potentials in healthy individuals and stroke patients. J. Neural Eng. 2015, 12, 056003. [Google Scholar] [CrossRef]
  13. Mrachacz-Kersting, N.; Stevenson, A.J.T.; Jorgensen, H.R.M.; Severinsen, K.E.; Aliakbaryhosseinabadi, S.; Jiang, N.; Farina, D. Brain state-dependent stimulation boosts functional recovery following stroke. Ann. Neurol. 2019, 85, 84–95. [Google Scholar] [CrossRef]
  14. Millan, J.D.; Rupp, R.; Muller-Putz, G.R.; Murray-Smith, R.; Giugliemma, C.; Tangermann, M.; Vidaurre, C.; Cincotti, F.; Kubler, A.; Leeb, R.; et al. Combining brain-computer interfaces and assistive technologies: State-of-the-art and challenges. Front. Neurosci. 2010, 4, 161. [Google Scholar] [CrossRef]
  15. Guo, F.; Wang, J.Y.; Sun, Y.J.; Yang, A.L.; Zhang, R.H. Movement-related cortical potentials during muscle fatigue induced by upper limb submaximal isometric contractions. Neuroreport 2014, 25, 1136–1143. [Google Scholar] [CrossRef]
  16. Aliakbaryhosseinabadi, S.; Kostic, V.; Pavlovic, A.; Radovanovic, S.; Nlandu Kamavuako, E.; Jiang, N.; Petrini, L.; Dremstrup, K.; Farina, D.; Mrachacz-Kersting, N. Influence of attention alternation on movement-related cortical potentials in healthy individuals and stroke patients. Clin. Neurophysiol. 2017, 128, 165–175. [Google Scholar] [CrossRef] [Green Version]
  17. do Nascimento, O.F.; Nielsen, K.D.; Voigt, M. Relationship between plantar-flexor torque generation and the magnitude of the movement-related potentials. Exp. Brain Res. 2005, 160, 154–165. [Google Scholar] [CrossRef]
  18. Olsen, S.; Signal, N.; Niazi, I.K.; Rashid, U.; Alder, G.; Mawston, G.; Nedergaard, R.W.; Jochumsen, M.; Taylor, D. Peripheral electrical stimulation paired with movement-related cortical potentials improves isometric muscle strength and voluntary activation following stroke. Front. Hum. Neurosci. 2020, 14, 156. [Google Scholar] [CrossRef]
  19. Mrachacz-Kersting, N.; Jiang, N.; Stevenson, A.J.T.; Niazi, I.K.; Kostic, V.; Pavlovic, A.; Radovanovic, S.; Djuric-Jovicic, M.; Agosta, F.; Dremstrup, K.; et al. Efficient neuroplasticity induction in chronic stroke patients by an associative brain-computer interface. J. Neurophysiol. 2016, 115, 1410–1421. [Google Scholar] [CrossRef] [Green Version]
  20. Niazi, I.K.; Mrachacz-Kersting, N.; Jiang, N.; Demstrup, K.; Farina, D. Peripheral electrical stimulation triggered by self-paced detection of motor intention enhances motor evoked potentials. IEEE Trans. Neural Syst. Rehabil. Eng. 2012, 20, 595–604. [Google Scholar] [CrossRef]
  21. Mrachacz-Kersting, N.; Kristensen, S.R.; Niazi, I.K.; Farina, D. Precise temporal association between cortical potentials evoked by motor imagination and afference induces cortical plasticity. J. Physiol. 2012, 590, 1669–1682. [Google Scholar] [CrossRef] [Green Version]
  22. Niazi, I.K.; Navid, M.S.; Rashid, U.; Amjad, I.; Olsen, S.; Haavik, H.; Alder, G.; Kumari, N.; Signal, N.; Taylor, D.; et al. Associative cued asynchronous BCI induces cortical plasticity in stroke patients. Ann. Clin. Transl. Neurol. 2022, 9, 722–733. [Google Scholar] [CrossRef]
  23. Suchomel, T.J.; Nimphius, S.; Bellon, C.R.; Stone, M.H. The importance of muscular strength: Training considerations. Sports Med. 2018, 48, 765–785. [Google Scholar] [CrossRef]
  24. Luker, J.; Lynch, E.; Bernhardsson, S.; Bennett, L.; Bernhardt, J. Stroke survivors’ experiences of physical rehabilitation: A systematic review of qualitative studies. Arch. Phys. Med. Rehabil. 2015, 96, 1698–1708.e10. [Google Scholar] [CrossRef]
  25. Scrivener, K.; Dorsch, S.; McCluskey, A.; Schurr, K.; Graham, P.L.; Cao, Z.; Shepherd, R.; Tyson, S. Bobath therapy is inferior to task-specific training and not superior to other interventions in improving lower limb activities after stroke: A systematic review. J. Physiother. 2020, 66, 225–235. [Google Scholar] [CrossRef]
  26. Olsen, S. Rewiring the Brain after Stroke. A Novel Neuromodulatory Intervention to Improve Neuromuscular Control; Auckland University of Technology: Auckland, New Zealand, 2019. [Google Scholar]
  27. Callaghan Innovation. C Prize Finalist’s Journal: Rehabilitation Innovation Team; Callaghan Innovation: Auckland, New Zealand, 2017. Available online: https://www.callaghaninnovation.govt.nz/sites/all/files/cprize-2017-team-notebooks-web.pdf (accessed on 8 November 2022).
  28. Alder, G.; Signal, N.; Vandal, A.C.; Olsen, S.; Jochumsen, M.; Niazi, I.K.; Taylor, D. Investigating the intervention parameters of endogenous paired associative stimulation (ePAS). Brain Sci. 2021, 11, 224. [Google Scholar] [CrossRef]
  29. Delorme, A.; Makeig, S. EEGLAB: An open source toolbox for analysis of single-trial eeg dynamics including independent component analysis. J. Neurosci. Methods 2004, 134, 9–21. [Google Scholar] [CrossRef] [Green Version]
  30. Lopez-Calderon, J.; Luck, S.J. ERPLAB: An open-source toolbox for the analysis of event-related potentials. Front. Hum. Neurosci. 2014, 8, 213. [Google Scholar] [CrossRef] [Green Version]
  31. Rashid, U.; Niazi, I.K.; Signal, N.; Taylor, D. An EEG experimental study evaluating the performance of Texas Instruments ADS1299. Sensors 2018, 18, 3721. [Google Scholar] [CrossRef] [Green Version]
  32. Oliveira, A.S.; Schlink, B.R.; Hairston, W.D.; König, P.; Ferris, D.P. Proposing metrics for benchmarking novel EEG technologies towards real-world measurements. Front. Hum. Neurosci. 2016, 10, 188. [Google Scholar] [CrossRef] [Green Version]
  33. Bates, D.; Mächler, M.; Bolker, B.; Walker, S. Fitting linear mixed-effects models using lme4. J. Stat. Softw. 2015, 67, 1–48. [Google Scholar] [CrossRef]
  34. R Core Team. R: A Language and Environment for Statistical Computing; R Foundation for Statistical Computing: Vienna, Austria, 2022. [Google Scholar]
  35. Degerman, A.; Rinne, T.; Pekkola, J.; Autti, T.; Jaaskelainen, I.P.; Sams, M.; Alho, K. Human brain activity associated with audiovisual perception and attention. Neuroimage 2007, 34, 1683–1691. [Google Scholar] [CrossRef]
  36. Euler, M.J.; Niermeyer, M.A.; Suchy, Y. Neurocognitive and neurophysiological correlates of motor planning during familiar and novel contexts. Neuropsychology 2016, 30, 109–119. [Google Scholar] [CrossRef]
  37. de Morree, H.M.; Klein, C.; Marcora, S.M. Perception of effort reflects central motor command during movement execution. Psychophysiology 2012, 49, 1242–1253. [Google Scholar] [CrossRef]
  38. Reiser, J.E.; Wascher, E.; Rinkenauer, G.; Arnau, S. Cognitive-motor interference in the wild: Assessing the effects of movement complexity on task switching using mobile EEG. Eur. J. Neurosci. 2020, 54, 8175–8195. [Google Scholar] [CrossRef]
Figure 1. Movement cues.
Applsci 13 02621 g001
Figure 2. Grand-average CNV waveforms for each movement condition for all participants (n = 27).
Applsci 13 02621 g002
Figure 3. Box and whisker plots showing comparison of CNV PN latency with visual versus audio-visual cues during ankle dorsiflexion (DF) and sit-to-stand (STS) movements. Individual datapoints are linked with light grey lines. * represents statistically significant differences (p < 0.05).
Applsci 13 02621 g003
Figure 4. Box and whisker plots showing comparison of CNV PN amplitude during ankle dorsiflexion (DF) versus sit-to-stand (STS) movements, with visual and audio-visual cues. Individual datapoints are linked with light grey lines. * represents statistically significant differences (p < 0.0001).
Applsci 13 02621 g004
Table 1. Descriptive statistics and pairwise comparisons for PN latency.
Movement ConditionGroup Mean (SD)
ms
Post-Hoc TestsEstimated Difference
Mean (95% CI)
DFvisual128 (226)
DFaudiovisual271 (214)DFaudiovisual – DFvisual143 (−8, 294)
DFauditory205 (336)
STSvisual168 (244)
STSaudiovisual334 (223)STSaudiovisual – STSvisual166 (15, 317) *
* p < 0.05. Group mean = mean of the mean PN latency from each participant’s averaged CNV.
Table 2. Descriptive statistics and pairwise comparisons for PN amplitude.
Movement ConditionGroup Mean (SD)
µV
Post-Hoc TestEstimated Difference
Mean (95% CI)
DFvisual1.24 (18.83)
STSvisual−2.33 (13.27)STSvisual − DFvisual2.44 (1.31, 3.58) **
DFaudiovisual−2.35 (1.09)
STSaudiovisual−4.75 (3.47)STSaudiovisual − DFaudiovisual2.40 (1.29, 3.52) **
DFauditory−2.25 (2.11)
** p < 0.0001. Group mean = mean of the mean PN amplitude from each participant’s averaged CNV.
Disclaimer/Publisher’s Note: The statements, opinions and data contained in all publications are solely those of the individual author(s) and contributor(s) and not of MDPI and/or the editor(s). MDPI and/or the editor(s) disclaim responsibility for any injury to people or property resulting from any ideas, methods, instructions or products referred to in the content.

