Article

Evaluation of Cutting Performance of a TBM Disc Cutter and Cerchar Abrasivity Index Based on the Brittleness and Properties of Rock

1
Department of Energy Resources Engineering, Pukyong National University, Busan 48513, Republic of Korea
2
Disposal Safety Evaluation R&D Division, Korea Atomic Energy Research Institute (KAERI), Daejeon 34057, Republic of Korea
3
Disposal Performance Demonstration R&D Division, Korea Atomic Energy Research Institute (KAERI), Daejeon 34057, Republic of Korea
*
Author to whom correspondence should be addressed.
Appl. Sci. 2023, 13(4), 2612; https://doi.org/10.3390/app13042612
Submission received: 19 January 2023 / Revised: 13 February 2023 / Accepted: 16 February 2023 / Published: 17 February 2023
(This article belongs to the Special Issue Advances in Failure Behavior of Rocks)

Abstract

:
The brittleness of rock is known to be an important property that affects the fragmentation characteristics of rock in mechanized rock cutting. As the interaction between the cutting tool and the rock (i.e., cutter forces, cutting efficiency, s/p ratio, and abrasivity) during mechanical rock cutting is strongly influenced by the characteristics of rock fragmentation, the cutting tools (i.e., disc cutter and pick cutter) experience different cutting behaviors depending on the rock brittleness. In this study, the relationships between the rock brittleness and the abrasivity of rock, and the cutting efficiency of a Tunnel Boring Machine (TBM) disc cutter were investigated for Korean rock types. The brittleness was calculated by the mathematical relations between the uniaxial compressive and Brazilian tensile strengths of the rock. The cutting efficiency and abrasivity were evaluated by the cutter forces and specific energy from the linear cutting machine (LCM) test and the Cerchar abrasivity index (CAI) test, respectively. The results show that rock brittleness is significantly correlated with cutting efficiency and CAI values. Consequently, some prediction models for cutter forces, specific energy, and the CAI were proposed as functions of the rock brittleness.

1. Introduction

In mechanical excavation projects for civil and mining applications, it is important to select appropriate excavation methods to evaluate cutting performances and costs. It is well established that the cutting performance and construction cost in mechanical excavation are affected by the rock properties. Among the different rock properties, rock brittleness is known to be an important factor affecting the characteristics of rock cutting [1,2,3,4,5]. Although rock brittleness is an important property that determines the failure characteristics of rocks upon loading and unloading conditions [5], there has been no universal agreement on the measurement and definition of rock brittleness. In many previous studies, numerous concepts of rock brittleness indices have been proposed and discussed based on different parameters, such as strength parameters [1,6,7,8,9,10], stress–strain (SS) curves [5,7], and force–penetration curves from indentation tests [3,4], etc. Of the brittleness indices, strength-based concepts expressed by the mathematical relationship between the uniaxial compressive strength (UCS) and the Brazilian tensile strength (BTS) of rock are generally adopted to measure the rock brittleness; these are summarized in Table 1. The other brittleness index concepts have been well-summarized in previous studies [5,6].
To evaluate the cutting performance and efficiency of mechanized rock excavation, the specific energy (SE) has been widely used. This is defined as the energy required to excavate a unit volume of rock mass; thus, it is a representative index for identifying the cutting efficiency of a cutting tool and mechanical excavators under given cutting conditions [11]. The optimum cutting condition (s/p ratio) is usually expressed by the ratio of cutter spacing (s) to penetration depth (p), and it provides minimal specific energy under a given rock type. Meanwhile, SE under the optimum cutting condition can be used to simply estimate the excavation rate of a TBM as the following equation:
ICR = k × P SE
where ICR is the instantaneous cutting rate (m3/h), k is the energy transfer ratio, which is typically between 0.7 and 0.8, P is the power consumed during the excavation, and SE is the specific energy under the optimum cutting condition, which is obtained from the rock cutting tests or empirical equations. Therefore, identifying the optimum specific energy for a given rock formation and cutting condition is one of the most important tasks in the preliminary design phase of TBM tunneling.
Furthermore, cutter wear is important for the estimation of the excavation performance of the mechanical excavator. The cutter wear is difficult to predict because many influencing factors involve the wear process. It has been shown that the cutter wear is affected by several factors, such as the operational parameters of the machine (e.g., thrust, torque, and RPM), geological properties of intact rock and rock mass (e.g., mechanical properties, mineralogical properties, abrasivity, and discontinuities), and features of cutting tools (e.g., diameter, tip angle, installation angle, and material). Previous extensive studies have investigated the effect of these influencing factors on the cutter wear by using several approaches, such as empirical, numerical, and soft-computing methods [12,13,14,15,16,17,18].
Of the rock properties, the rock abrasivity is an important property that is directly related to cutter wear and consumption during tunnel excavation work. There are many suggested methods to determine the abrasiveness of rock, with the Cerchar abrasivity index (CAI) test being one of the most common methods used. The CAI is known as a good indicator for cutter wear, and it is used to understand the effect of geomechanical parameters (i.e., mineral composition, rock hardness, grain size, rock strength, and brittleness) on the cutter wear [19,20,21,22,23,24]. Due to the simplicity and economic advantages of the test, it is increasingly being used to estimate the cutter consumption in many mining and tunneling machines [12,13,14,15,16,25].
Previous research has attempted to determine the relationships between the parameters (i.e., cutter force, specific energy, and wear index/abrasiveness of rock) and the brittleness of rock. It has been found that the brittleness indices (e.g., B1, B2, and B3) have fine relationships with specific energy; however, in some cases, no significant relationship has been found between the brittleness of rock and the rock-cutting parameters. Overall, it may be accepted that the rock-cutting parameters are correlated with the brittleness of rock; however, conflicting results have been found when the different brittleness indices have been used [1,2,8,26,27,28]. While it is believed that the relationships between the parameters and the rock brittleness depend on the rock types, cutting tools, and machine type, the research database needs to be extended for better understanding of these relationships to be obtained.
To contribute to the literature, this study summarized the linear cutting machine tests and Cerchar abrasiveness tests that have been conducted for the Korean rock type. Using the research database, the study attempted to find empirical correlations between the rock brittleness and cutting performance (i.e., cutter force and specific energy) and the abrasivity of rock. In particular, the study investigated the relationships between the different rock brittleness concepts, cutter force, specific energy, s/p ratio, and CAI, which are importation design parameters in TBM tunneling. Finally, some prediction models for cutter forces, specific energy, and CAI were proposed as a function of the brittleness of rock.

2. Material and Methodology

2.1. Linear Cutting Machine (LCM) Test

The full-scale cutting test is known as the linear cutting machine (LCM) test [29]. A large rock specimen is required to carry out the LCM test with real size disc cutters (usually 12–20 inches in diameter). Because a real disc cutter is used in the test, forces acting (i.e., normal, rolling, and side forces) on the disc cutter during excavation, as well as the optimum cutter spacing (s/p ratio), cutting efficiency, and other operational parameters, can be directly determined from the test. In Korea, the LCM system was built with 200 tons of loading capacity and consists of a three-directional servo-controlled loading system (Figure 1).
The test data included in this study consisted of that of previously published studies [4,30,31] over the past decade involving full-scale LCM tests with Korean rock types. Table 2 shows the mechanical rock properties and brittleness indices of Korean rock types in these previous studies. We selected four brittleness indices among those listed in Table 1. Because B4 and B5 share the same mathematical expression (see Table 1), we omitted B5 from further analysis and discussion. The database included eight igneous rocks, five metamorphic rocks, and two sedimentary rocks. The UCS of the rock types varied from 36.5 to 241.0 MPa, and the BTS varied from 4.7 to 25.2 MPa.
Table 3 also summarizes the previous LCM test results with Korean rock types; it should be noted that all cutting tests were carried out with a CCS (constant cross sectional) disc cutter with a diameter of 17 inches (432 mm) and a tip width of 14 mm. Additionally, the LCM results were obtained under the optimum cutting conditions for the statistical analysis. In these LCM tests, the optimum s/p ratio ranged between 7.5 and 18.0, and the cutter forces were measured as average values. The boreability index (in kN/mm) is defined as the required normal force to penetrate the unit depth (in mm) of rock; it was often referred to as the field penetration index (FPI) in a previous study [32].

2.2. Cerchar Abrasivity Index Test

There are two kinds of testing instruments for the Cerchar abrasivity index test; original Cerchar equipment and West Cerchar equipment. The original Cerchar equipment features a moving pin lever with a fixed rock specimen, while, for the West Cerchar equipment, the rock specimen travels under a fixed stylus pin. All test data included in this study were obtained using the West Cerchar equipment, as shown in Figure 2. This equipment’s stylus pin has a 90° tip and a diameter of 10 mm, and is made of steel with a specific Rockwell hardness. The suggested hardness of the stylus pin (HRC 55) was used for the tests, which is referred to as the ASTM standard [33].
Table 4 summarizes the Cerchar abrasiveness test results obtained for Korean rock types, and some of these testing results were also presented in a previous study [34]. It should be noted that the Cerchar abrasiveness test was carried out on the saw-cut surface. The research database included 14 igneous rocks, 11 metamorphic rocks, and 5 sedimentary rocks. The UCS of the rocks varied from 34.9 to 235.3 MPa, and the BTS varied from 1.6 to 18.2 MPa.
Figure 2. The Cerchar abrasivity test system used in this study: (a) photo; (b) schematic drawing (1 is weight, 2 is pin guide, 3 is steel pin, 4 is specimen, 5 is vice sled, 6 is hand crank) (after [35]).
Applsci 13 02612 g002

3. Results and Discussions
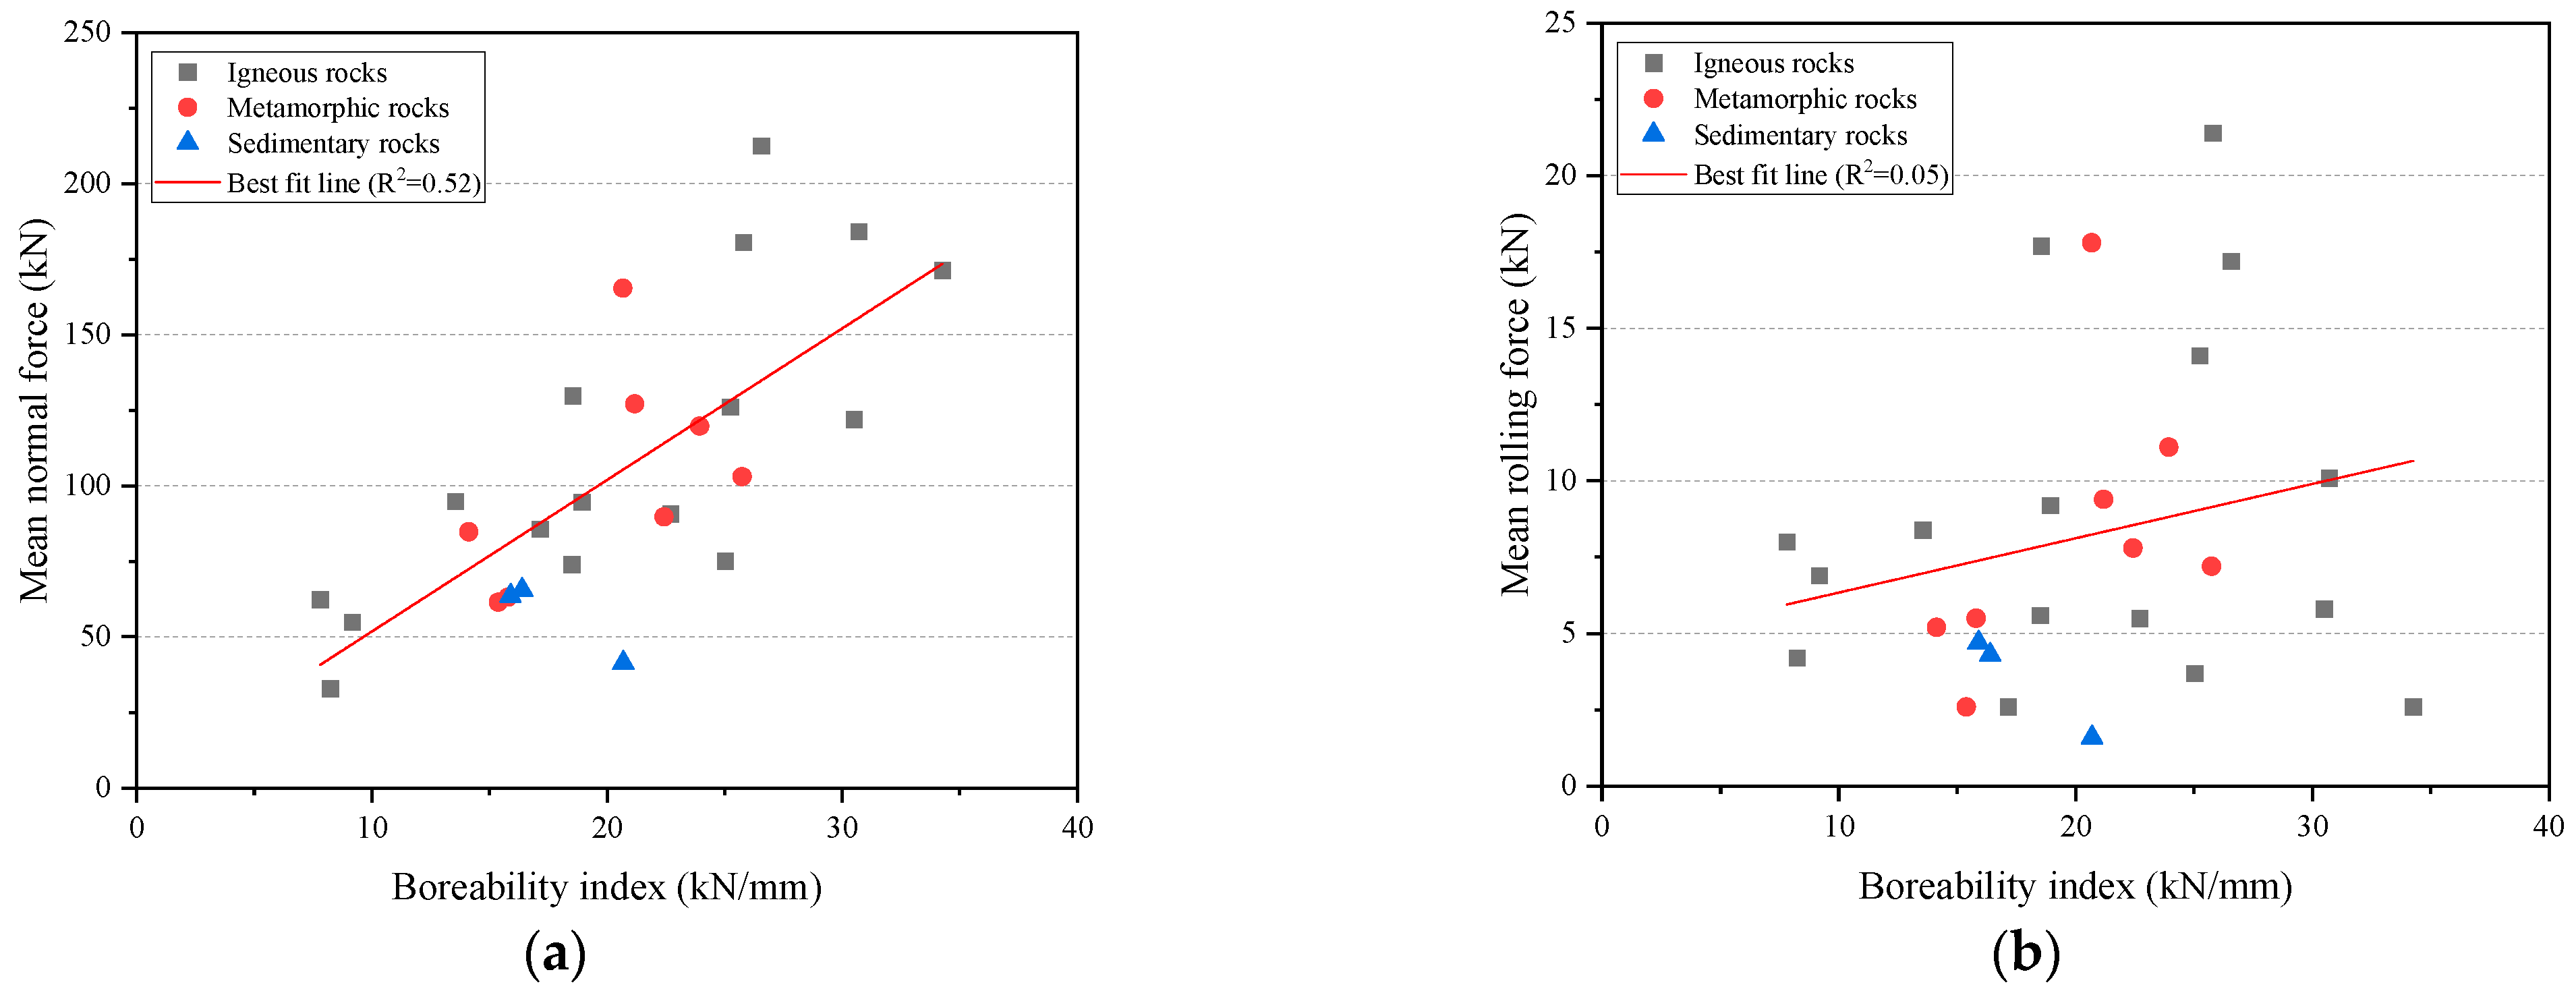
3.1. Cutter Force

When a disc cutter cuts rock, three directional cutter forces (i.e., normal, rolling, and side forces) act on the disc cutter. The normal and rolling forces are considered as main force components to evaluate the required thrust and torque of TBM during rock excavation. It has been proven that cutter forces are affected by rock strengths [31,36,37]; therefore, UCS and BTS are basic input parameters used to estimate cutter forces in the empirical TBM performance prediction model. Figure 3 and Figure 4 show the relationship between cutter forces (MNF (mean normal force) and MRF (mean rolling force)) and rock strengths (UCS and BTS). The origins of the rocks are marked with different colors. The results show that the cutter forces slightly increased with increasing UCS and BTS, regardless of the rock origin. This trend is consistent with the results of previous studies [31,36,37]; however, the relationships shown in Figure 3 and Figure 4 were somewhat scattered. Because the dataset included cutter forces from different penetration depths and cut spacings, it was reasonable for this study to show the effects of cutting conditions on cutter forces. This fact is supported by previous studies [30,31,36,37,38].
To diminish the effect of the penetration depth, the boreability index (BI) can be used for the quantitative analysis of the relationship between rock strengths and cutter forces. The BI is usually called the field penetration index (FPI). The BI is calculated as the ratio of the normal force to the penetration depth, while the FPI is calculated as the ratio of the thrust per each cutter to the penetration depth per revolution [37,39]. Figure 5 shows the relationship between the BI and cutter forces. The results show that significant linear relationships were found in the case of the normal force, as shown in Figure 5a. However, the rolling force had a poor correlation with the BI, as shown in Figure 5b.
The rolling force is usually estimated based on the empirical relationship between the normal force and the rolling force. This relationship can be expressed as the concept of the cutting coefficient (CC), which is defined by the ratio of the rolling force to the normal force. As shown in Figure 6a, the average CC for the Korean rock types included in this study was 8% on average, and the CC range was consistent with the findings of previous studies [30,37]. However, as shown Figure 6b, there are no significant relationships between CC and rock strengths in the database. The result is not consistent with the finding from the previous study [37].
Based on these relationships, we attempted to find correlations between the normal forces and brittleness indices. Figure 7 shows that the brittleness indices were correlated with the normal cutter force, and that the prediction bands (upper and lower bounds) were also obtained under a 95% confidence level. Further, the results show that B1 had the best correlation with the MNF compared to the other brittleness indices. The R2 values of B1, B2, B3, and B4 were 0.50, 0.37, 0.41, and 0.18, respectively. It was presumed that the differences in these correlations were affected by the Brazilian tensile strength of the rock types; in the case of B2, the effect of the tensile strength on the brittleness values were not significant compared to B1 because the UCS was usually 10~20 times larger than the BTS. Otherwise, B5 was inherently different from B1, according to the definition. Increases in the BTS were found to result in contradictory contributions to B1 and B4. Tensile strength is considered an important parameter in rock cutting because tensile fracturing is of importance in the rock fragmentation process. This is because rock chipping highly depends on tensile cracks’ propagating towards adjacent cutting lines. Consequently, the differences discussed above affected the results for the correlations between the brittleness indices and cutter forces.
The prediction models used for the cutter forces obtained from the statistical regression analysis are summarized in Table 5. For generalized force prediction, the penetration depth and cutter spacing of the disc cutter were considered in the force prediction equations. The results indicated that B1 and the UCS and BTS models gave a better prediction for the cutter force compared to the other brittleness indices models. The results indicated that the brittleness indices had positive relationships with the normal cutter forces based on the power function, meaning that the cutting resistance or required energy increased with the brittleness of the rock. These findings coincide with those of previous studies [4,27,40]. Further, the UCS was found to have a positive relationship with the cutter force, while the BTS had a negative relationship with the cutter force from the regression model. If it is not possible to perform the LCM test for a given rock formation in the early stage design of TBM tunneling, the cutter force, which is an essential parameter for the specification design of TBM, can be approximately estimated using the proposed equations in Table 5, based on the basic mechanical rock properties, i.e., the brittleness or rock strengths.

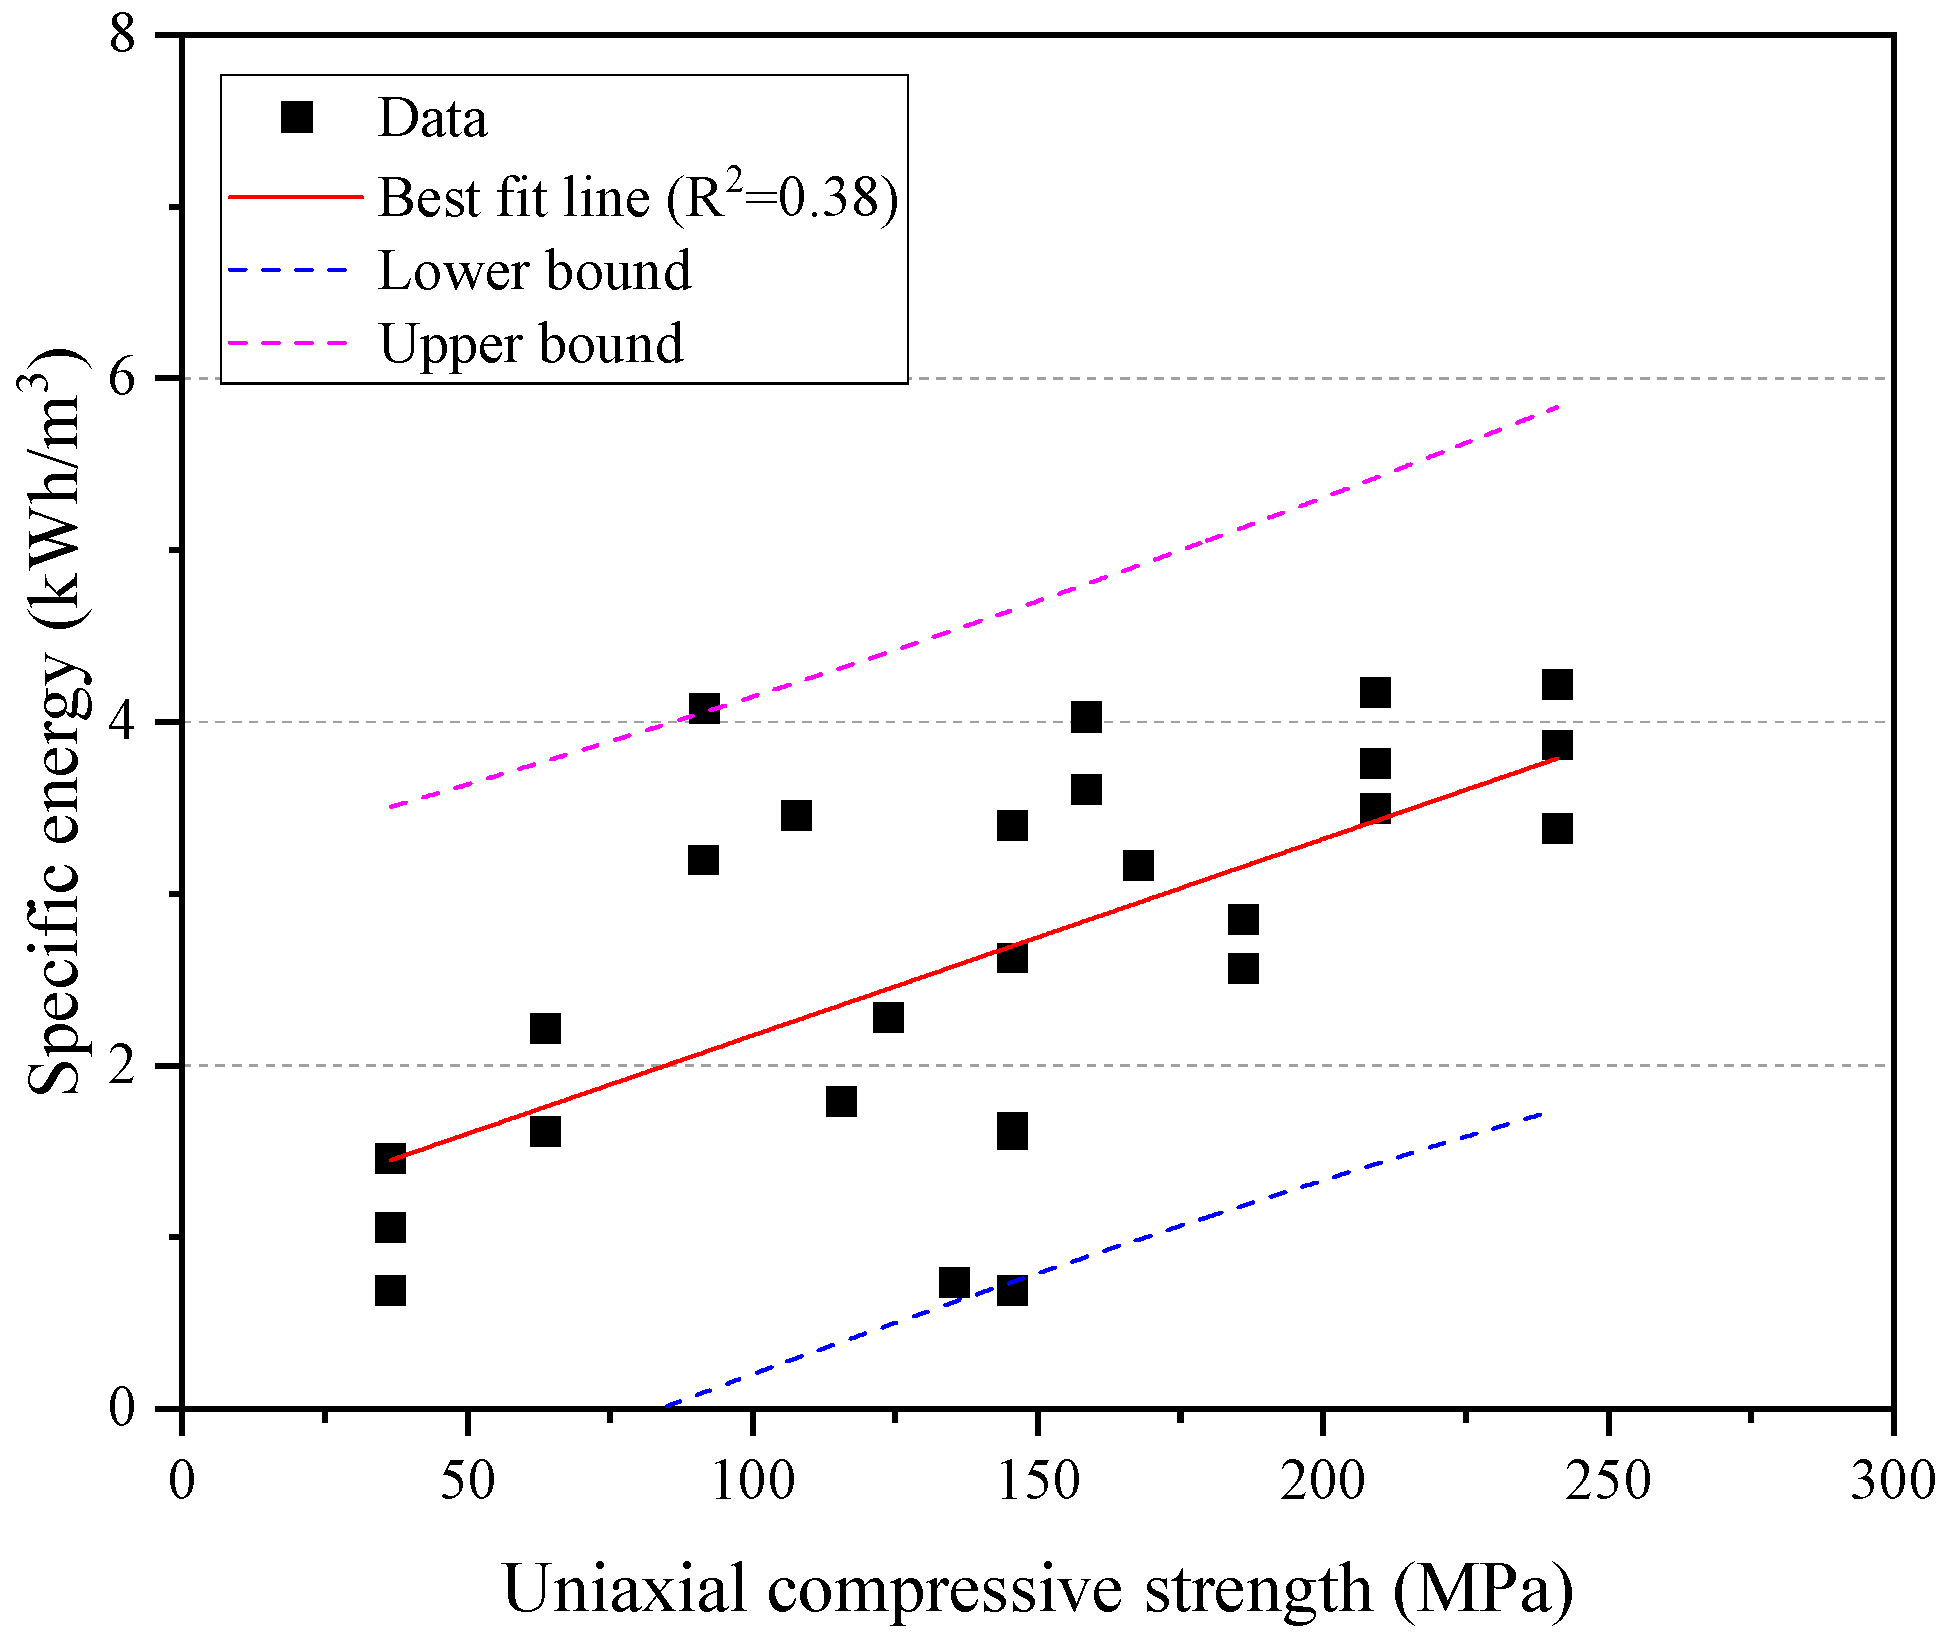
3.2. Specific Energy

Figure 8 shows the relationship between the brittleness indices and specific energy. It is noteworthy that all the specific energy was measured at optimum cutting conditions. For all brittleness indices, the specific energy tended to increase with increases in the index. This means that the cutting resistance and required energy increased as the rock brittleness increased. This finding coincides with the results obtained for the normal force in the earlier section. Among the four indices, B3 and B4 had fine correlations with the specific energy, while B1 and B2 had a poor correlation with the specific energy.
The results had good agreement with some previous studies. Goktan [26] studied the relationship between rock brittleness (B2) and specific energy, finding no significant relationship between specific energy and B2. Altindag [1] also reported that there was no correlation between specific energy values and the brittleness of B1 and B2, while he found that B4 had good correlations with the specific energy of mechanical cutting tools.
It is a fact that the specific energy generally increases as rock strength increases, because the required cutter force increases as the strength increases. Figure 9 presents the relationship between the UCS and specific energy. The results indicated that the UCS also has a better linear relationship than the brittleness indices. These findings agreed well with a previous study [37], which reported that the specific energy of the optimum condition increased as the uniaxial compressive strength increased.
Table 6 shows the prediction models used for the specific energy obtained from the statistical regression analysis. For B1 and B2, no meaningful prediction model was obtained using multiple non-linear regression analysis. For B3 and B4, a power function-based regression model was obtained. Based on these results, B4 can be considered as an indicator to evaluate cutting efficiency. Further, it was found that the penetration depth, UCS, and BTS had a positive relationship with the specific energy, while the cutter spacing had a negative relationship with the specific energy.
However, the results indicated that prediction models of specific energy showed lower coefficients of determination (R2) values; this implies that the considered input parameters and amount of data are not enough to accurately predict specific energy, and that the relationships between input and output parameters for regression analysis might be more complicated than that of this analysis (based on multiplication of power function). As reported by the previous studies [36,37,41], the specific energy changed with the combination of penetration depth and cut spacing. This specific energy curves can usually be represented by a convex function with a minimum point, and this minimum point indicates the optimum cutting condition. Pan et al. [37] also reported that the characteristics of specific energy curves depends on the rock type (or strength), values of penetration depth, and cut spacing. Consequently, it means that the database should be able to efficiently cover the range of each variable for the regression analysis; an extended database and further analysis will be required.

3.3. Optimum s/p Ratio

In the current research database, optimum S/p (S/p (opt)) ratios were found to range from 7.5 to 18. Figure 10 shows the relationship between the optimum s/p ratio and brittleness indices. For the considered brittleness indices, the specific energy tended to decrease as the index decreased. The results indicated that B3 had a good linear correlation with the optimum s/p ratio.
Although the optimum s/p ratio could not be accurately determined with the prediction model, by revealing the upper and lower boundaries, it is possible to roughly determine the optimum s/p ratio for the wide range of rock strength. The relationships, including the upper and lower boundaries of the optimum s/p ratio, are useful information in the preliminary stage of TBM design. It is possible to estimate the number of cutters on the cutter head, cutter arrangement, main specifications (i.e., thrust, torque, and power), and construction period if the optimum s/p ratio can be determined.

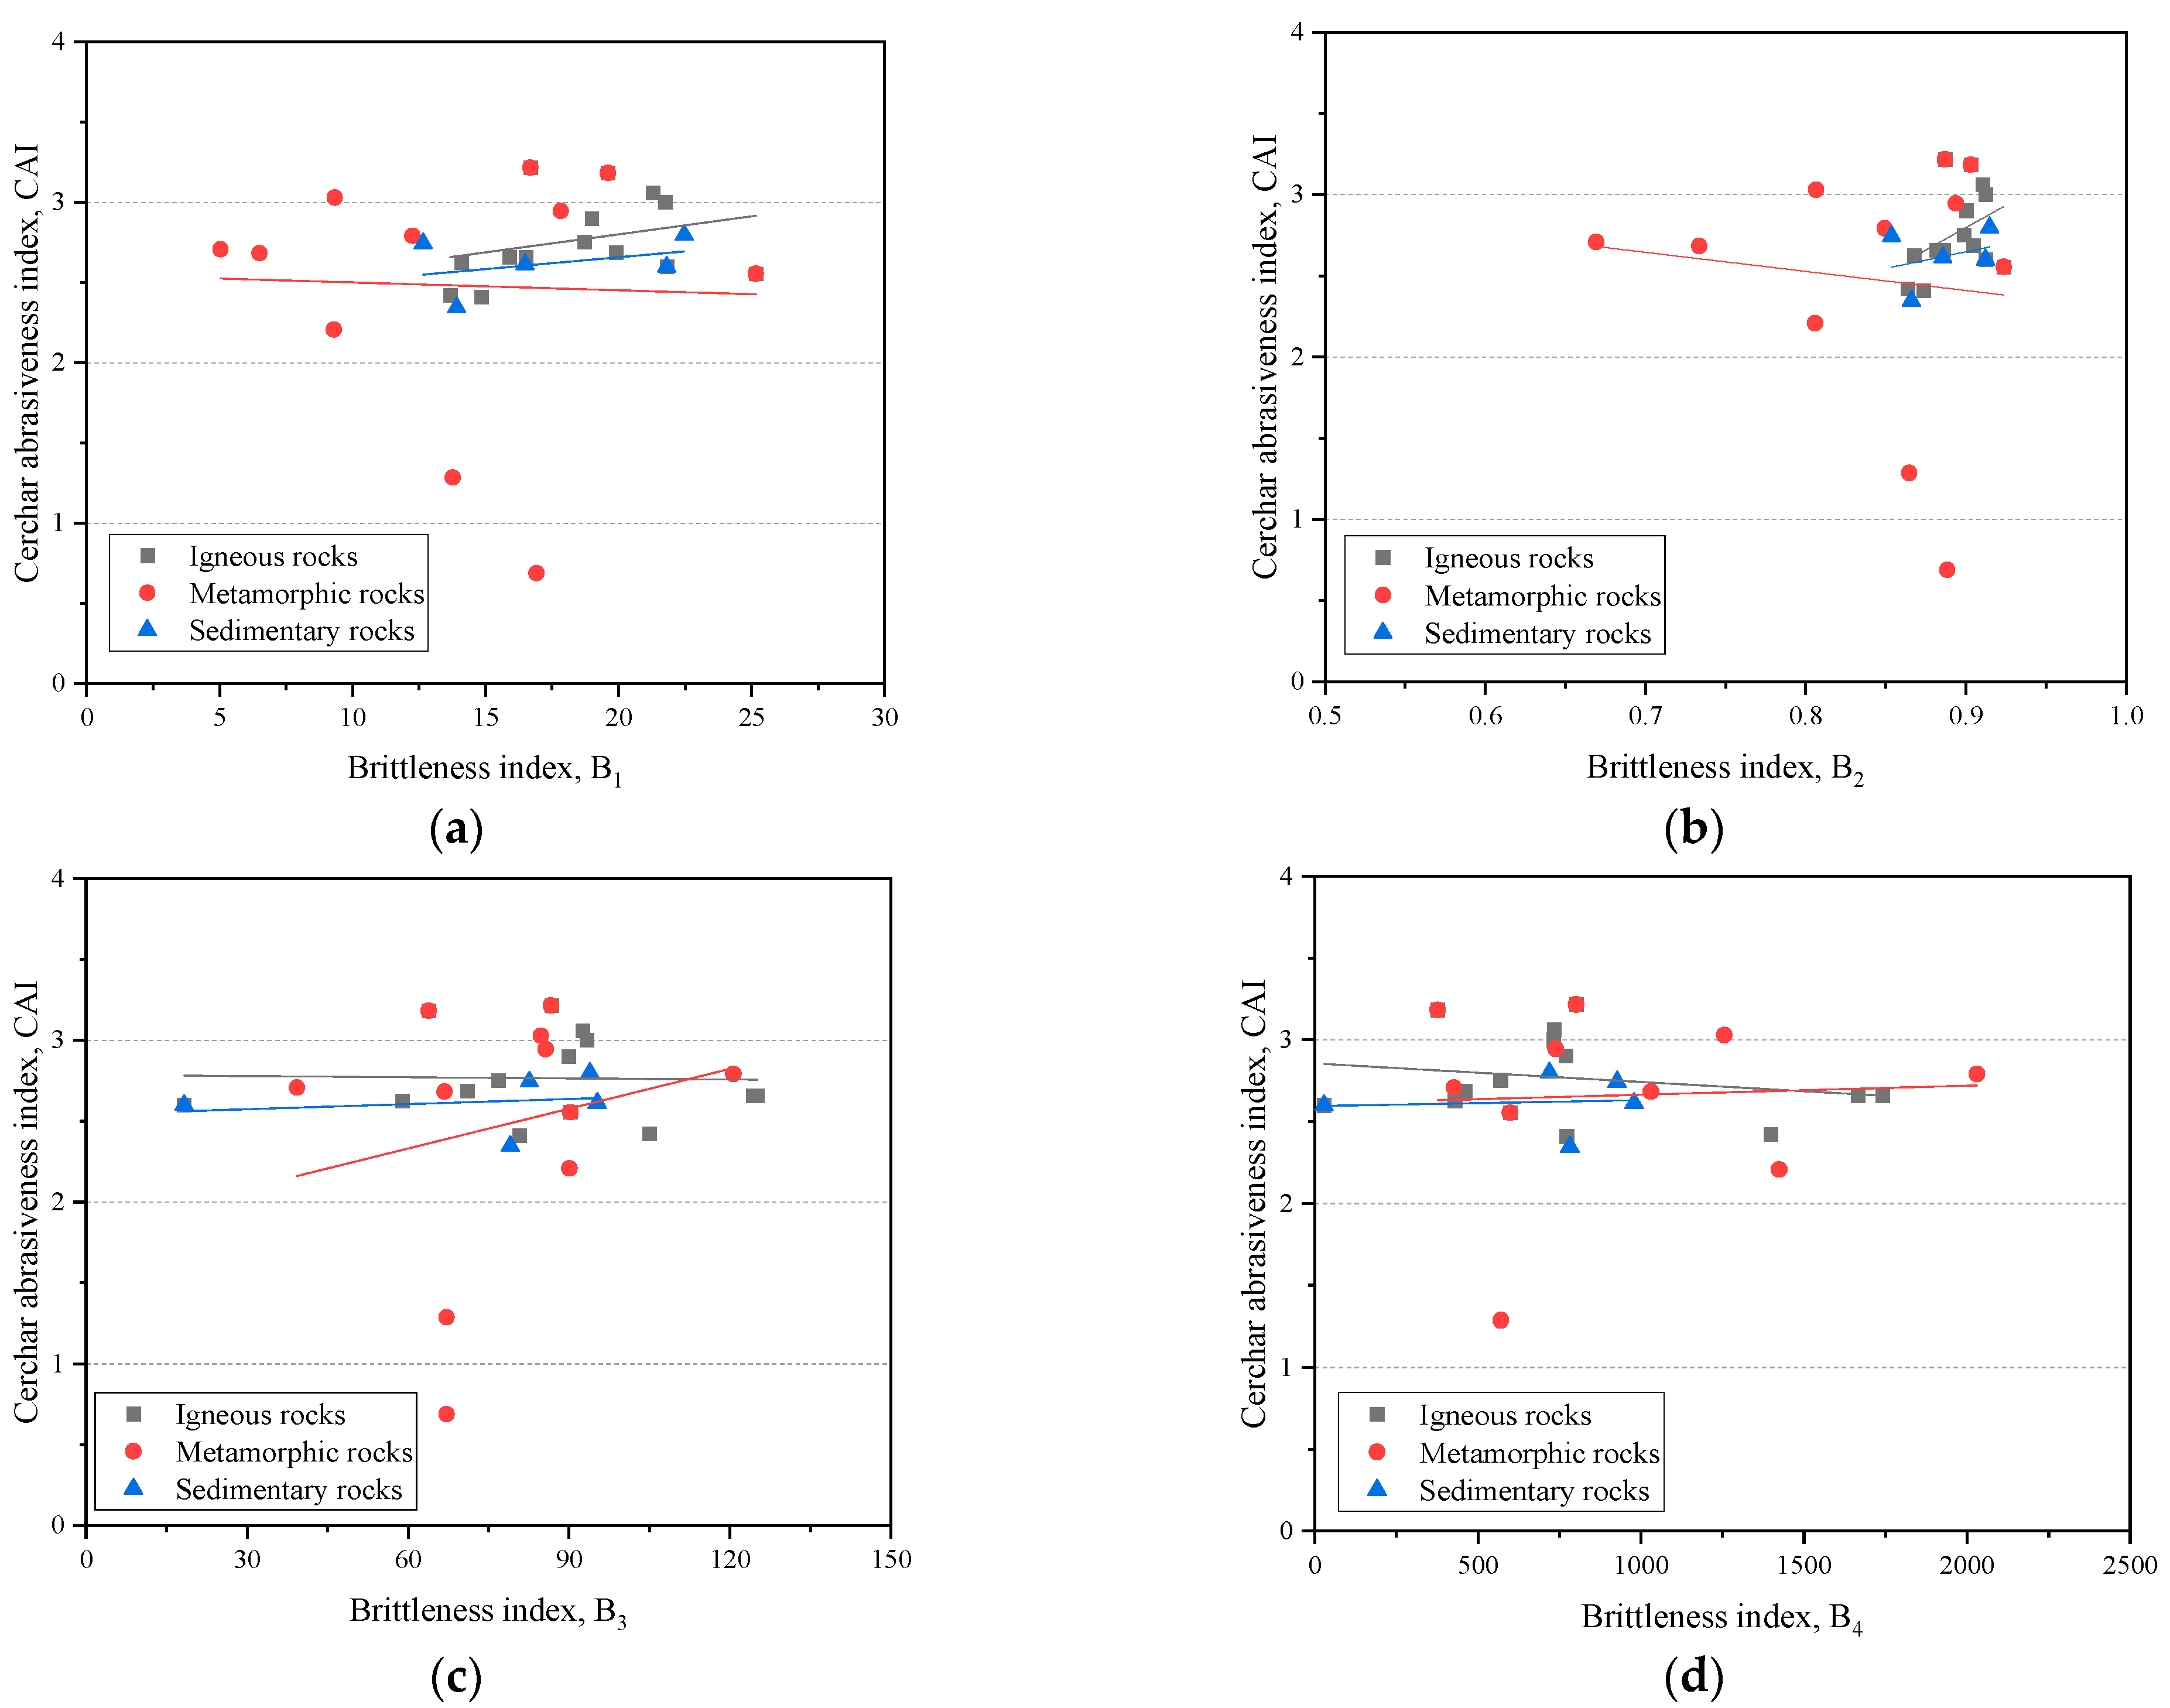
3.4. Abrasivity of Rock

Figure 11 shows the relationship between the CAI and brittleness indices. The results are presented by grouping based on the rock’s geological origins. Overall, no significant relationship was found between the brittleness indices and CAI. For B1 and B2, CAI roughly increases with the brittleness of rock for the igneous and sedimentary rocks, while it also roughly decreases in metamorphic rocks. This finding means that the abrasiveness of rock depends on properties other than the strength property of rock, and implies that rock abrasiveness may vary depending on a rock’s geological origin. The statement can be supported by the previous study [42]. They stated that different correlations between geomechanical properties and CAI were found according to the origin of rocks. Because the main mineral composition depends on the origin of rocks, it is thought that these differences in mineral composition lead to different trends in the relationship between the abrasiveness of rock and several properties of rock. However, in this study, the relationships were found to not be consistent in the current research database. This means that it is challenging to estimate rock abrasivity with only the rock brittleness, which is expressed by the rock strength.
On the other hand, Figure 12 shows the relationship between CAI and EQC. A significant linear relationship was found between the CAI and EQC. As reported by the previous studies [21,34,35,42], this indicated that the equivalent quartz content (EQC) is highly correlated with the rock abrasivity. However, conflicting findings have been also reported by other previous studies; Al-Ameen and Waller [20] stated that rock strength is the most influencing factors on the CAI value, while Alber [22] reported that any significant correlation between CAI and EQC was not obtained. It is presumed that the tested rock types could affect the CAI values, which also means that other properties of rock (e.g., porosity, mineral composition, grain size, etc.) could affect the rock abrasivity. However, this cannot be concluded with the current findings.
In Table 7, the regression models used to predict the CAI values based on the EQC and brittleness indices are shown. All prediction models showed similar performance for predicting the CAI values. Furthermore, the UCS model showed a similar level of performance compared to the brittleness indices model, indicating that the BTS played no significant role in predicting the CAI values. These results were consistent with the findings of previous studies [34,35]. Although the rock abrasivity and mineral composition can be useful indicators to estimate the cutter wear, the properties are usually measured from the homogeneous rock specimen, while the tested rocks in this study are limited in isotropic rocks. According to the observations from the tunneling site, the excessive cutter wear occurred in the mixed ground conditions or highly weathered formations with lower rock abrasivity values [43,44,45,46,47]; moreover, the anisotropy of rock significantly affected the cutter wear [48]. Therefore, further studies will be required to investigate the effect of mixed ground and the anisotropy of rock on the cutter wear based on the rock abrasivity and brittleness, based on the results of the current study.

4. Conclusions

This study analyzed the correlation between the brittleness of rock and cutting performance parameters with the LCM and CAI test results performed on Korean rocks. Based on the relationships analyzed, we presented several empirical equations for predicting cutter forces, specific energy, and CAI, which are important design parameters of TBM. Further, it was concluded that these parameters can be approximately estimated from the mechanical properties and rock brittleness. The main results and findings of this paper are as follows:
  • The normal force of a disc cutter was correlated with the UCS and BTS of rocks. It also had a good linear relationship with the brittleness indices, especially with B1.
  • Among the four brittleness indices, B3 and B4 were correlated with the optimum specific energy; additionally, it was found that the optimum specific energy was highly correlated with the UCS of rocks. In addition, the specific energy had positive relationships with the penetration depth, UCS, BTS, and brittleness indices, while it had negative relationships with the cutter spacing.
  • The optimum s/p ratio was found to range from 7.5 to 18 in the current LCM database, and it had negative linear relationships with brittleness and the UCS of rocks.
  • It was found that the CAI was slightly correlated with the brittleness indices, and that it was highly correlated with the EQC. A significant linear relationship between the CAI and EQC was found. Furthermore, the CAI prediction models featuring the EQC showed high predictability.
The main results and findings of this study should serve as useful references for determining the excavation rates of machines, the construction period, and the cutting tool consumption through using several rock properties in the preliminary design stage of TBM tunneling. In order to improve the reliability of the results, the research database should be expanded continuously.

Author Contributions

Conceptualization, H.J.; methodology, H.J. and S.C.; formal analysis, H.J. and S.C.; writing—original draft preparation, H.J.; writing—review and editing, Y.-K.L.; visualization, H.J. All authors have read and agreed to the published version of the manuscript.

Funding

This research was funded by the National Research Foundation of Korea (NRF) grant, funded by the Korean government (MSIT) (No. NRF-2021R1G1A1091572).

Institutional Review Board Statement

Not applicable.

Informed Consent Statement

Not applicable.

Data Availability Statement

Data available on request.

Conflicts of Interest

The authors declare no conflict of interest.

References

  1. Altindag, R. Correlation of specific energy with rock brittleness concepts on rock cutting. J. S. Afr. Inst. Min. Metall. 2003, 103, 163–171. [Google Scholar]
  2. Gong, Q.M.; Zhao, J. Influence of rock brittleness on TBM penetration rate in Singapore granite. Tunn. Undergr. Space Technol. 2007, 22, 317–324. [Google Scholar] [CrossRef]
  3. Yagiz, S. Assessment of brittleness using rock strength and density with punch penetration test. Tunn. Undergr. Space Technol. 2009, 24, 66–74. [Google Scholar] [CrossRef]
  4. Jeong, H.Y.; Cho, J.W.; Jeon, S.; Rostami, J. Performance assessment of hard rock TBM and rock boreability using punch penetration test. Rock Mech. Rock Eng. 2016, 49, 1517–1532. [Google Scholar] [CrossRef]
  5. Meng, F.Z.; Wong, L.; Zhou, H. Rock brittleness indices and their applications to different fields of rock engineering: A review. J. Rock Mech. Geotech. 2021, 13, 221–247. [Google Scholar] [CrossRef]
  6. Meng, F.; Zhou, H.; Zhang, C.; Xu, R.; Lu, J. Evaluation methodology of brittleness of rock based on postpeak stress-strain curves. Rock Mech. Rock Eng. 2015, 48, 1787–1805. [Google Scholar] [CrossRef]
  7. Hucka, V.; Das, B. Brittleness Determination of Rocks by Different Methods. Int. J. Rock Mech. Min. Sci. Geomech. Abstr. 1974, 11, 389–392. [Google Scholar] [CrossRef]
  8. Altindag, R. Assessment of some brittleness indexes in rock-drilling efficiency. Rock Mech. Rock Eng. 2010, 43, 361–370. [Google Scholar] [CrossRef]
  9. Özfırat, M.K.; Yenice, H.; Şimşir, H.; Yarali, O. A new approach to rock brittleness and its usability at prediction of drillability. J. Afr. Earth Sci. 2016, 119, 94–101. [Google Scholar] [CrossRef]
  10. Kahraman, S.; Altindag, R. A brittleness index to estimate fracture toughness. Int. J. Rock Mech. Min. Sci. 2004, 41, 343–348. [Google Scholar] [CrossRef]
  11. Jeong, H.; Jeon, S. Characteristic of size distribution of rock chip produced by rock cutting with a pick cutter. Geomech. Eng. 2018, 15, 811–822. [Google Scholar]
  12. Gehring, K.H. Prognosis of advanced rates and wear for underground mechanized excavations. Felsbau 1995, 13, 439–448. [Google Scholar]
  13. Bruland, A. Hard rock tunnel boring–Advance rate and cutter wear, Project report 1B-98, NTNU. Trondheim Nor. Inst. Technol. 1998, 3, 83. [Google Scholar]
  14. Rostami, J.; Ozdemir, L.; Bruland, A.; Dahl, F. Review of issues related to cerchar abrasivity testing and their implications on geotechnical investigations and cutter cost estimates. In Proceedings of the Rapid Excavation and Tunneling Conference (RETC), Seattle, WA, USA, 27–29 June 2005; pp. 738–751. [Google Scholar]
  15. Hassanpour, J.; Rostami, J.; Azali, S.T.; Zhao, J. Introduction of an empirical TBM cutter wear prediction model for pyroclastic and mafic igneous rocks; a case history of Karaj water conveyance tunnel, Iran. Tunn. Undergr. Space Technol. 2014, 43, 222–231. [Google Scholar] [CrossRef]
  16. Farraokh, E.; Kim, D.Y. 2018, A discussion on hard rock TBM cutter wear and cutterhead intervention interval length evaluation. Tunn. Undergr. Space Technol. 2008, 23, 351–359. [Google Scholar]
  17. Elbaz, K.; Shen, S.L.; Zhou, A.; Yin, Z.Y.; Lyu, H.M. Prediction of disc cutter life during shield tunneling with AI via the incorporation of a genetic algorithm into a GMDH-type neural network. Engineering 2021, 7, 238–251. [Google Scholar] [CrossRef]
  18. Zhang, N.; Shen, S.L.; Zhou, A. A new index for cutter life evaluation and ensemble model for prediction of cutter wear. Tunn. Undergr. Space Technol. 2023, 131, 104830. [Google Scholar] [CrossRef]
  19. Atkinson, T.; Cassapi, V.B.; Singh, R.N. Assessment of abrasive wear resistance potential in rock excavation machinery. Int. J. Min. Geol. Eng. 1986, 3, 151–163. [Google Scholar] [CrossRef]
  20. Al-Ameen, S.I.; Waller, M.D. The influence of rock strength and abrasive mineral content on the Cerchar abrasive index. Eng. Geol. 1994, 36, 293–301. [Google Scholar] [CrossRef]
  21. Plinninger, R.J.; Kasling, H.; Thuro, K.; Spaun, G. Testing conditions and geomechanical properties influencing the cerchar abrsivity index (CAI) value. Int. J. Rock Mech. Min. Sci. 2003, 40, 259–263. [Google Scholar] [CrossRef]
  22. Alber, M. Stress dependency of the Cerchar abrasivity index (CAI) and its effects on wear of selected rock cutting tools. Tunn. Undergr. Space Technol. 2008, 23, 351–359. [Google Scholar] [CrossRef]
  23. Massalov, T.; Yagiz, S.; Rostami, J. Relationship between key rock properties and Cerchar abrasivity index for estimation of disc cutter wear life in rock tunneling applications. In Proceedings of the Eurock 2020, Trondheim, Norway, 14–19 June 2020. [Google Scholar]
  24. Mossalov, T.; Yagiz, S.; Adoko, A.C. Application of soft computing techniques to estimate cutter life index using mechanical properties of rocks. Appl. Sci. 2022, 12, 1446. [Google Scholar] [CrossRef]
  25. Ko, T.Y.; Lee, S.S. Effect of rock abrasiveness on wear of shield tunnelling in Bukit Timah granite. Appl. Sci. 2020, 10, 3231. [Google Scholar] [CrossRef]
  26. Goktan, R.M. Brittleness and micro-scale rock cutting efficiency. Int. J. Min. Sci. Technol. 1991, 13, 237–241. [Google Scholar] [CrossRef]
  27. Kahraman, S. Correlation of TBM and drilling machine performances with rock brittleness. Eng. Geol. 2002, 65, 269–283. [Google Scholar]
  28. Goktan, R.M.; Yilmaz, N.G. A new methodology for the analysis of the relationship between rock brittleness index and drag pick cutting efficiency, J.S. Afr. Inst. Min. Metall. 2005, 105, 727–734. [Google Scholar]
  29. Chang, S.H.; Choi, S.W.; Bae, G.J.; Jeon, S. Performance prediction of TBM disc cutting on granitic rock by the linear cutting test. Tunn. Undergr. Sp. Technol. 2006, 21, 271. [Google Scholar] [CrossRef]
  30. Jeong, H.Y.; Jeon, S.W.; Cho, J.W.; Chang, S.H.; Bae, G.J. Assessment of cutting performance of a TBM disc cutter for anisotropic rock by linear cutting test. Tunn. Undergr. Space 2011, 21, 508–517. [Google Scholar]
  31. Cho, J.W.; Jeon, S.; Yu, S.H.; Chang, S.H. Optimum spacing of TBM disc cutters: A numerical simulation using the three-dimensional dynamic fracturing method. Tunn. Undergr. Sp. Technol. 2010, 25, 230–244. [Google Scholar] [CrossRef]
  32. Hassanpour, J.; Rostami, J.; Khamehchiyan, M.; Bruland, A.; Tavakoli, H.R. TBM performance analysis in pyroclastic rocks: A case history of Karaj water conveyance tunnel. Rock Mech. Rock Eng. 2010, 43, 427–445. [Google Scholar] [CrossRef]
  33. D7625-10; Standard test method for laboratory determination of abrasiveness of rock using the CERCHAR Method. ASTM: Montgomery County, PA, USA, 2010.
  34. Lee, S.D.; Jung, H.Y.; Jeon, S.W. Determination of rock abrasiveness using Cerchar abrasiveness test. Tunn. Undergr. Space 2012, 22, 284–295. [Google Scholar] [CrossRef]
  35. Rostami, J.; Ghasemi, A.; Gharahbagh, E.A.; Dogrouz, C.; Dahl, F. Study of dominant factors affecting cerchar abrasivity index. Rock Mech. Rock Eng. 2014, 47, 1905–1919. [Google Scholar] [CrossRef]
  36. Snowdon, R.A.; Ryley, M.D.; Temporal, J. A study of disc cutting in selected British rocks. Int. J. Rock Mech. Min. Sci. Geomech. Abstr. 1982, 19, 107–121. [Google Scholar] [CrossRef]
  37. Pan, Y.; Liu, Q.; Peng, X.; Liu, Q.; Liu, J.; Huang, X.; Cui, X.; Cai, T. Full-scale linear cutting tests to propose some empirical formulas for TBM disc cutter performance prediction. Rock Mech. Rock Eng. 2019, 52, 4763–4783. [Google Scholar] [CrossRef]
  38. Gertsch, R.; Gertsch, L.; Rostami, J. Disc cutting tests in Colorado Red Granite: Implications for TBM performance prediction. Int. J. Rock Mech. Min. Sci. 2007, 44, 238–246. [Google Scholar] [CrossRef]
  39. Hassanpour, J.; Rostami, J.; Zhao, G. A new hard rock TBM performance prediction model for project planning. Tunn. Undergr. Space Technol. 2011, 26, 595–603. [Google Scholar] [CrossRef]
  40. Mohammadi, S.D.; Torabi-Kaveh, M.; Bayati, M. Prediction of TBM penetration rate using intact and mass rock properties (case study: Zagros long tunnel, Iran). Arab. J. Geosci. 2015, 8, 3893–3904. [Google Scholar] [CrossRef]
  41. Tumac, D.; Balci, C. Investigations into the cutting characteristics of CCS type disc cutters and the comparison between experimental, theoretical and empirical force estimations. Tunn. Undergr. Space Technol. 2015, 45, 84–98. [Google Scholar] [CrossRef]
  42. Moradizadeh, M.; Cheshomi, A.; Ghafoori, M.; TrighAzali, S. Correlation of equivalent quartz content, Slake durability index and Is50 with Cerchar abrasiveness index for different types of rock. Int. J. Rock Mech. Min. Sci. 2016, 86, 42–47. [Google Scholar] [CrossRef]
  43. Zhao, J.; Gong, Q.M.; Eisenten, Z. Tunnelling through a frequently changing and mixed ground: A case history in Singapore. Tunn. Undergr. Space Technol. 2007, 22, 388–400. [Google Scholar] [CrossRef]
  44. Elbaz, K.; Shen, S.L.; Cheng, J.W.C.; Arulrajah, A.; Shirlaw, N. Cutter-disc consumption during earth pressure balance tunnelling in mixed strata. ICE Proc. Geotech. Eng. 2018, 171, 1–11. [Google Scholar] [CrossRef]
  45. Zhao, Y.; Yang, H.; Chen, Z.; Chen, X.; Huang, L.; Liu, S. Effects of Jointed Rock Mass and Mixed Ground Conditions on the Cutting Efficiency and Cutter Wear of Tunnel Boring Machine. Rock Mech. Rock Eng. 2018, 52, 1303–1313. [Google Scholar] [CrossRef]
  46. Ren, D.J.; Shen, S.L.; Arulrajah, A.; Cheng, W.C. Prediction model of TBM disc cutter wear during tunnelling in heterogeneous ground. Rock Mech. Rock Eng. 2018, 51, 3599–3611. [Google Scholar] [CrossRef]
  47. Thuro, K. Drillability prediction: Geological influences in hard rock drill and blast tunnelling. Geol. Rundsch 1997, 86, 426–438. [Google Scholar] [CrossRef]
  48. Kotwica, K.; Malkowski, P. Methods of mechanical mining of compact-rock-A comparison of efficiency and energy consumption. Energies 2019, 12, 3562. [Google Scholar] [CrossRef] [Green Version]
Figure 1. The linear cutting machine system [4]: (a) photo; (b) schematic drawing.
Applsci 13 02612 g001
Figure 3. Relationship between mean normal force and rock strengths: (a) UCS; (b) BTS.
Applsci 13 02612 g003
Figure 4. Relationship between mean rolling force and rock strengths: (a) UCS; (b) BTS.
Applsci 13 02612 g004
Figure 5. Relationship between cutter forces and boreability index: (a) normal force; (b) rolling force.
Applsci 13 02612 g005
Figure 6. Cutting coefficient for full-scale linear cutting tests: (a) range of CC; (b) CC vs. BTS.
Applsci 13 02612 g006
Figure 7. Relationship between brittleness indices and mean normal force: (a) MNF–B1; (b) MNF–B2; (c) MNF–B3; (d) MNF–B4.
Applsci 13 02612 g007
Figure 8. Relationship between specific energy and brittleness indices: (a) SE–B1; (b) SE–B2; (c) SE–B3; (d) SE–B4.
Applsci 13 02612 g008
Figure 9. Relationships between UCS and specific energy.
Applsci 13 02612 g009
Figure 10. The relationships between optimum s/p ratio and brittleness indices: (a) S/p(opt)–B1; (b) S/p(opt)–B2; (c) S/p(opt)–B3; (d) S/p(opt)–B4.
Applsci 13 02612 g010
Figure 11. The relationships between the Cerchar abrasiveness index and brittleness indices: (a) CAI–B1; (b) CAI–B2; (c) CAI–B3; (d) CAI–B4.
Applsci 13 02612 g011
Figure 12. The relationships between the Cerchar abrasiveness index and equivalent quart content: fitting for (a) each rock origin, and (b) all rock types.
Applsci 13 02612 g012
Table 1. Different definitions of rock brittleness based on rock strengths in previous studies (modified from [6]).
Definition of Rock BrittlenessReferences
B 1 = σ c / σ t [7]
B 2 = ( σ c σ t ) / ( σ t + σ c ) [7]
B 3 = ( σ t + σ c ) / 2 [9]
B 4 = ( σ c × σ t ) / 2 [1]
B 5 = ( σ c × σ t ) / 2 [8]
σc and σt were uniaxial compressive strength and Brazilian tensile strength of rock, respectively.
Table 2. Mechanical properties of rocks used in the linear cutting machine (LCM) tests.
Rock TypeUCS
(MPa)
BTS
(MPa)
B1B2B3B4
Granite #1209.09.222.710.915109.1961.4
Granite #291.310.19.060.80150.7461.1
Granite #3107.67.414.480.87157.5398.1
Granite #4135.36.819.930.90471.1460.0
Granite #536.54.77.710.77020.685.8
Granite #6145.57.818.650.89876.7567.5
Diorite158.511.214.150.86884.9887.6
Felsite145.59.515.310.87777.5691.1
Gneiss #1167.510.615.800.88189.1887.8
Gneiss #291.515.26.030.71553.4695.4
Gneiss #3123.811.211.020.83367.5693.3
Gneiss #4241.013.318.050.895127.21602.7
Gneiss #5186.011.516.120.88398.81069.5
Tuff115.525.24.580.64236.21455.3
Limestone63.68.867.180.75636.2281.7
Table 3. Results of linear cutting machine test for Korean rock types (data from [4,30,31]).
Rock Typep 1
(mm)
Sopt 1
(mm)
MNF 2
(kN)
MRF 2
(kN)
SEopt 1
(kWh/m3)
BI 1
(kN/mm)
Granite #1440122.05.84.1730.50
Granite #1660184.210.13.7630.70
Granite #1860212.517.23.5026.56
Granite #244874.05.63.2018.50
Granite #344090.85.53.4622.70
Granite #4570171.32.60.7434.26
Granite #547232.94.21.468.23
Granite #56108556.91.069.17
Granite #5814462.48.00.697.80
Granite #637575.13.71.6425.03
Granite #657585.72.60.6917.14
Granite #677594.88.41.6013.54
Diorite570126.214.14.0325.24
Diorite770129.817.73.6118.54
Felsite57094.69.22.6318.92
Felsite790180.621.43.4025.80
Gneiss #1570119.711.13.1723.94
Gneiss #244889.77.84.0822.43
Gneiss #346063.25.52.2815.80
Gneiss #44601037.24.2225.75
Gneiss #4660127.19.43.8721.18
Gneiss #4880165.417.83.3820.68
Gneiss #543061.52.62.5715.38
Gneiss #564584.85.22.8514.13
Tuff46065.64.31.7916.40
Limestone23641.41.62.2220.70
Limestone47263.64.71.6215.90
1 The p, Sopt, SEopt, and BI are penetration depth, optimum cutter spacing, specific energy, and boreability index under optimum cutting conditions, respectively. 2 MNF and MRF are the mean normal force and mean rolling force, respectively.
Table 4. Cerchar abrasivity index (CAI) values and mechanical properties of Korean rock types.
OriginRock TypeUCS
(MPa)
BTS
(MPa)
EQCCAIB1B2B3B4
IgneousGranite #1178.48.258.33.00121.750.91293.3731.4
Granite #2145.97.864.12.75318.610.89876.9569.0
Granite #3135.36.843.02.68819.930.90471.1460.0
Granite #4170.99.064.52.90219.080.90090.0769.1
Granite #5176.78.359.53.06121.430.91192.5733.3
Granite #6151.310.264.02.41014.890.87480.8771.6
Granite #7173.66.959.12.55525.200.92490.3598.9
Granite #8121.56.262.43.18419.770.90463.9376.7
Granite #9163.69.863.63.21716.650.88786.7801.6
Granite #1034.91.661.72.59922.220.91418.327.9
Diorite235.314.836.62.65815.860.881125.11741.2
Gabbro110.07.838.32.62514.030.86759.9429.0
Diabase234.514.239.42.65816.580.886124.41664.9
Porphyry195.614.344.62.42213.650.863105.01398.5
MetamorphicGneiss #1126.97.56.60.69015.410.87867.2475.9
Gneiss #2162.717.547.32.20815.700.88090.11423.6
Gneiss #3125.39.130.41.2865.600.67067.2570.1
Gneiss #4115.817.870.72.68317.910.89466.81030.6
Gneiss #565.613.052.22.70812.230.84939.3426.4
Gneiss #6162.29.181.22.9469.340.80785.7738.0
Gneiss #7223.118.250.82.79213.940.866120.72030.2
Gneiss #8173.66.959.12.55516.570.88690.3598.9
Gneiss #9153.116.451.13.03012.660.85484.81255.4
Amphibole121.56.262.43.18422.360.91463.9376.7
Propylite163.59.863.63.21713.480.86286.7801.1
SedimentaryDolomite147.510.673.02.34613.170.85979.1781.8
Limestone34.91.661.72.59916.970.88918.327.9
Sandstone179.710.950.72.6139.300.80695.3979.4
Shale153.212.155.62.74413.850.86582.7926.9
Tuff179.88.047.82.7996.500.73393.9719.2
Table 5. Prediction models for normal cutter force.
ModelInput ParametersEquations
1B1, p, S MNF = p 0.58 × S 0.27 × B 1 0.95 (R2 = 0.66)
2B2, p MNF = 61.25 × p 0.70 × B 2 4.16 (R2 = 0.63)
3B3, p, S MNF = p 0.61 × S 0.24 × B 3 0.59 (R2 = 0.65)
4B4, p, S MNF = p 0.75 × S 0.29 × B 4 0.34 (R2 = 0.55)
5UCS, BTS, p, S MNF = p 0.55 × S 0.23 × UCS 0.77 × BTS 0.46 (R2 = 0.70)
Table 6. Prediction models for specific energy under optimum conditions.
Input ParametersEquations
B3, p, S SE = 1.16 × p 0.11 × S 0.36 × B 3 0.496 (R2 = 0.44)
B4, p, S SE = 1.09 × p 0.21 × S 0.37 × B 4 0.322 (R2 = 0.47)
UCS, p, S SE = 1.07 × p 0.15 × S 0.37 × UCS 0.456   (R2 = 0.43)
UCS, BTS, p, S SE = 0.75 × p 0.16 × S 0.35 × UCS 0.37 × BTS 0.27 (R2 = 0.47)
Table 7. Prediction models for the Cerchar abrasiveness index.
Input ParametersEquations
B1, EQC CAI = 0.46 × B 1 0.036 × EQC 0.41 (R2 = 0.59)
B2, EQC CAI = 0.52 × B 2 0.173 × EQC 0.415 (R2 = 0.59)
B3, EQC CAI = 0.36 × B 3 0.066 × EQC 0.427 (R2 = 0.61)
B4, EQC CAI = 0.41 × B 4 0.024 × EQC 0.426 (R2 = 0.60)
UCS, EQC CAI = 0.35 × UCS 0.067 × EQC 0.427 (R2 = 0.61)
Disclaimer/Publisher’s Note: The statements, opinions and data contained in all publications are solely those of the individual author(s) and contributor(s) and not of MDPI and/or the editor(s). MDPI and/or the editor(s) disclaim responsibility for any injury to people or property resulting from any ideas, methods, instructions or products referred to in the content.

