Article

A Hybrid Model for Predicting Low Oxygen in the Return Air Corner of Shallow Coal Seams Using Random Forests and Genetic Algorithm

1
Beijing Key Laboratory for Precise Mining of Intergrown Energy and Resources, China University of Mining and Technology (Beijing), Beijing 100083, China
2
School of Emergency Management and Safety Engineering, China University of Mining and Technology (Beijing), Beijing 100083, China
*
Author to whom correspondence should be addressed.
Appl. Sci. 2023, 13(4), 2538; https://doi.org/10.3390/app13042538
Submission received: 12 January 2023 / Revised: 10 February 2023 / Accepted: 13 February 2023 / Published: 16 February 2023
(This article belongs to the Special Issue Mining Safety: Challenges and Prevention of Mine Disasters)

Abstract

:
In order to better solve the phenomenon of low oxygen in the corner of return airway caused by abnormal gas emission in goaf during shallow coal seam mining, by analyzing the source and reason of low oxygen phenomenon, a prediction model of oxygen concentration in the corner of return airway based on genetic algorithm (GA) and random forest (RF) technology was proposed. The training sample set was established by using the field data obtained from actual monitoring, including the oxygen concentration in the return airway corner, the periodic pressure step distance of the roof, the surface temperature and atmospheric pressure. GA was used to optimize the parameters in the RF model, including trees and leaves in the forest. The results showed that the model prediction error was minimum when the number of trees was 398 and the number of leaves was 1. In addition, GA was used to optimize the number of hidden neurons and the initial weight threshold of the back-propagation neural network (BPNN). In order to verify the superiority of the model, the GA optimized RF and BPNN model are compared with the conventional RF and BPNN model. Analyze the average absolute percentage error (MAPE), root mean square error (RMSE), and average absolute error (MAE) of the prediction data of each model. The results show that the optimized RF prediction model is better than other models in terms of prediction accuracy.

1. Introduction

Abnormal gas emission in goaf is a common phenomenon in the process of coal mining, which leads to low oxygen, CH4 overrun, CO overrun and other problems in the return air corner of working face; that is, the return air side of the mining face is close to the upper side of the return air roadway and the triangular place at the edge of the goaf [1,2,3,4,5,6]. The oxygen concentration of the human body in normal activities ranges from 19.5 to 23.5%. When the oxygen concentration in the air drops below 17%, people will have adverse physiological reactions, such as dyspnea, fatigue and other uncomfortable reactions, which may lead to asphyxia in serious cases. Therefore, low oxygen seriously affects the safe production of coal mines and the physical and mental health of underground workers.
Roof and floor characteristics, coal quality, and other factors [7,8,9,10] are affected by coal mining technology. There is a lot of residual coal in the working face roadway, open-off cut, and other areas. There are different degrees of roof coal in the middle of the working face [11,12]. A large amount of broken coal remains in the overlying goaf on part of the working face [13,14]. The coal seam with easy spontaneous combustion absorbs a large amount of oxygen, and the residual coal in goaf is easy to low temperature oxidize at under the condition of good heat storage environment [15,16,17,18]. During the mining of shallow buried coal seam group, the airflow leakage from the surface fissure, the negative pressure ventilation of the working face, and other factors make the low oxygen gas in the goaf flow out to the return air corner of working face and accumulate, which leads to the abnormal oxygen concentration in the return air corner [19,20,21,22].
In recent years, with the rise of artificial intelligence, various fields have been exploring intelligent prediction models suitable for this field and realizing intelligent coverage on the basis of original research. Examples include support vector machine (SVM), back propagation neural network (BPNN) and a series of models used in medicine, economics, environmental science and engineering, and other fields [23,24,25,26]. In the field of coal mine safety, prediction is the basis and premise of disaster prevention and control, such as the prediction of coal rock and gas outburst, gas explosion, coal spontaneous combustion and other disasters [27,28,29,30,31]. At present, the research on the prediction of low oxygen in the return airway corner is limited. Yang constructed a prediction model of oxygen concentration of working face based on the monitoring data of a mine in Shendong by using principal component analysis method and generalized regression neural network [32]. Studies show that these methods have certain accuracy for nonlinear prediction problems, but there are still shortcomings. For example, BPNN is very sensitive to the initial weight and converges easily to the local minimum [33]. Changes of SVM hyperparameters have a great influence on the prediction results [34].
Real-time prediction of oxygen concentration in return airway corner of working face is the premise of the governance of the low oxygen problem. Therefore, it is necessary to establish a more effective and more accurate prediction model of oxygen concentration in return air corner to provide guidance for prevention and governance of low oxygen. Random forest is a predictor which is randomly established and contains multiple decision trees. For high-dimensional data, random forest performs better than other algorithms when analyzing the relationship between various factors on the basis of multiple influencing factors [35]. At the same time, out-of-bag data (OOB) is used for unbiased error estimation when creating random forest, which makes random forest have better generalization ability [36]. For example, Lei [37] established the prediction model of random forest coal spontaneous combustion through oxidation experimental data and established and verified the accuracy of random forest model by using field data. The results show that random forest method can be further applied in other fields. Carlos Montes [38] proposes a stochastic forest model to predict sediment transport in sewer pipelines. The model avoids overfitting and improves prediction accuracy by comparing it with previously reported models. For the random forest, the super parameters in the model include the number of trees and leaves and the prediction accuracy will be improved if the optimal value of the parameters is obtained. Therefore, the optimization of the random forest model based on artificial intelligence optimization algorithm will get more accurate prediction results. Currently, the widely used optimization algorithms include particle swarm optimization [39], firefly algorithm [40], ant colony algorithm [41], genetic algorithm [42], etc. Among them, the genetic algorithm has good global search ability and can quickly search out all the solutions in the solution space without falling into the trap of fast descent of local optimal solution. Moreover, with its parallelism, it can carry out distributed calculation conveniently and accelerate the solving speed [43,44].
This study takes Shangwan Mine of Shendong Mining Area as the research object. The source of low oxygen gas was determined through the analysis of coal seam gas components and the oxidation experiment of residual coal. The factors affecting the pressure difference between the goaf and the working face were analyzed comprehensively to determine the cause of low oxygen in the return air corner. On this basis, a RF hybrid model based on GA optimization is proposed to predict the oxygen concentration in the return air corner, providing guidance for the prevention of low oxygen. GA was used to optimize parameters in the RF model, including the number of trees in the forest and the number of leaves per tree, to achieve the optimal prediction results in line with the actual situation. At the same time, GA was used to optimize the number of hidden neurons and the initial weight threshold of BPNN model. The prediction accuracy and generalization ability of GA-RF, RF, GA-BPNN and BPNN were compared and analyzed by performance evaluation indexes to verify the superiority of the hybrid prediction model, which not only provides guidance for the prevention and governance of low oxygen phenomenon in the return air corner of working face, but also provides reference for the prevention and governance of CH4 overrun and CO overrun in the return air corner.

2. Experiment and Methods

In order to obtain the field measured data in the mining process and the cause of low oxygen, Shangwan Coal mine of Shendong Mining Area located in Ejin Horo Banner, Ordos City, Inner Mongolia Autonomous Region was selected as the test mine. An amount of 22104 fully-mechanized working faces of Shangwan Coal mine are the fourth working face in the first plate area of 22# coal, and the goaf of 12# coal is above the working face. The working face is arranged along the dip with a strike length of 330.9 m, a propelling distance of 4132.6 m, a designed mining height of 6.5 m, a ground elevation of 1164–1260 m, and a seam floor elevation of 1045.55–1074.44 m. The three-dimensional schematic diagram of the working face is shown in Figure 1. Under the influence of geological conditions, occurrence conditions of coal seams, mining method, and working face arrangement, the roof caving of goaf is connected with the overlying goaf to form a composite mining goaf. Under the condition of repeated disturbance mining, resulting in the three-dimensional air leakage channel from the surface to the goaf of the working face.

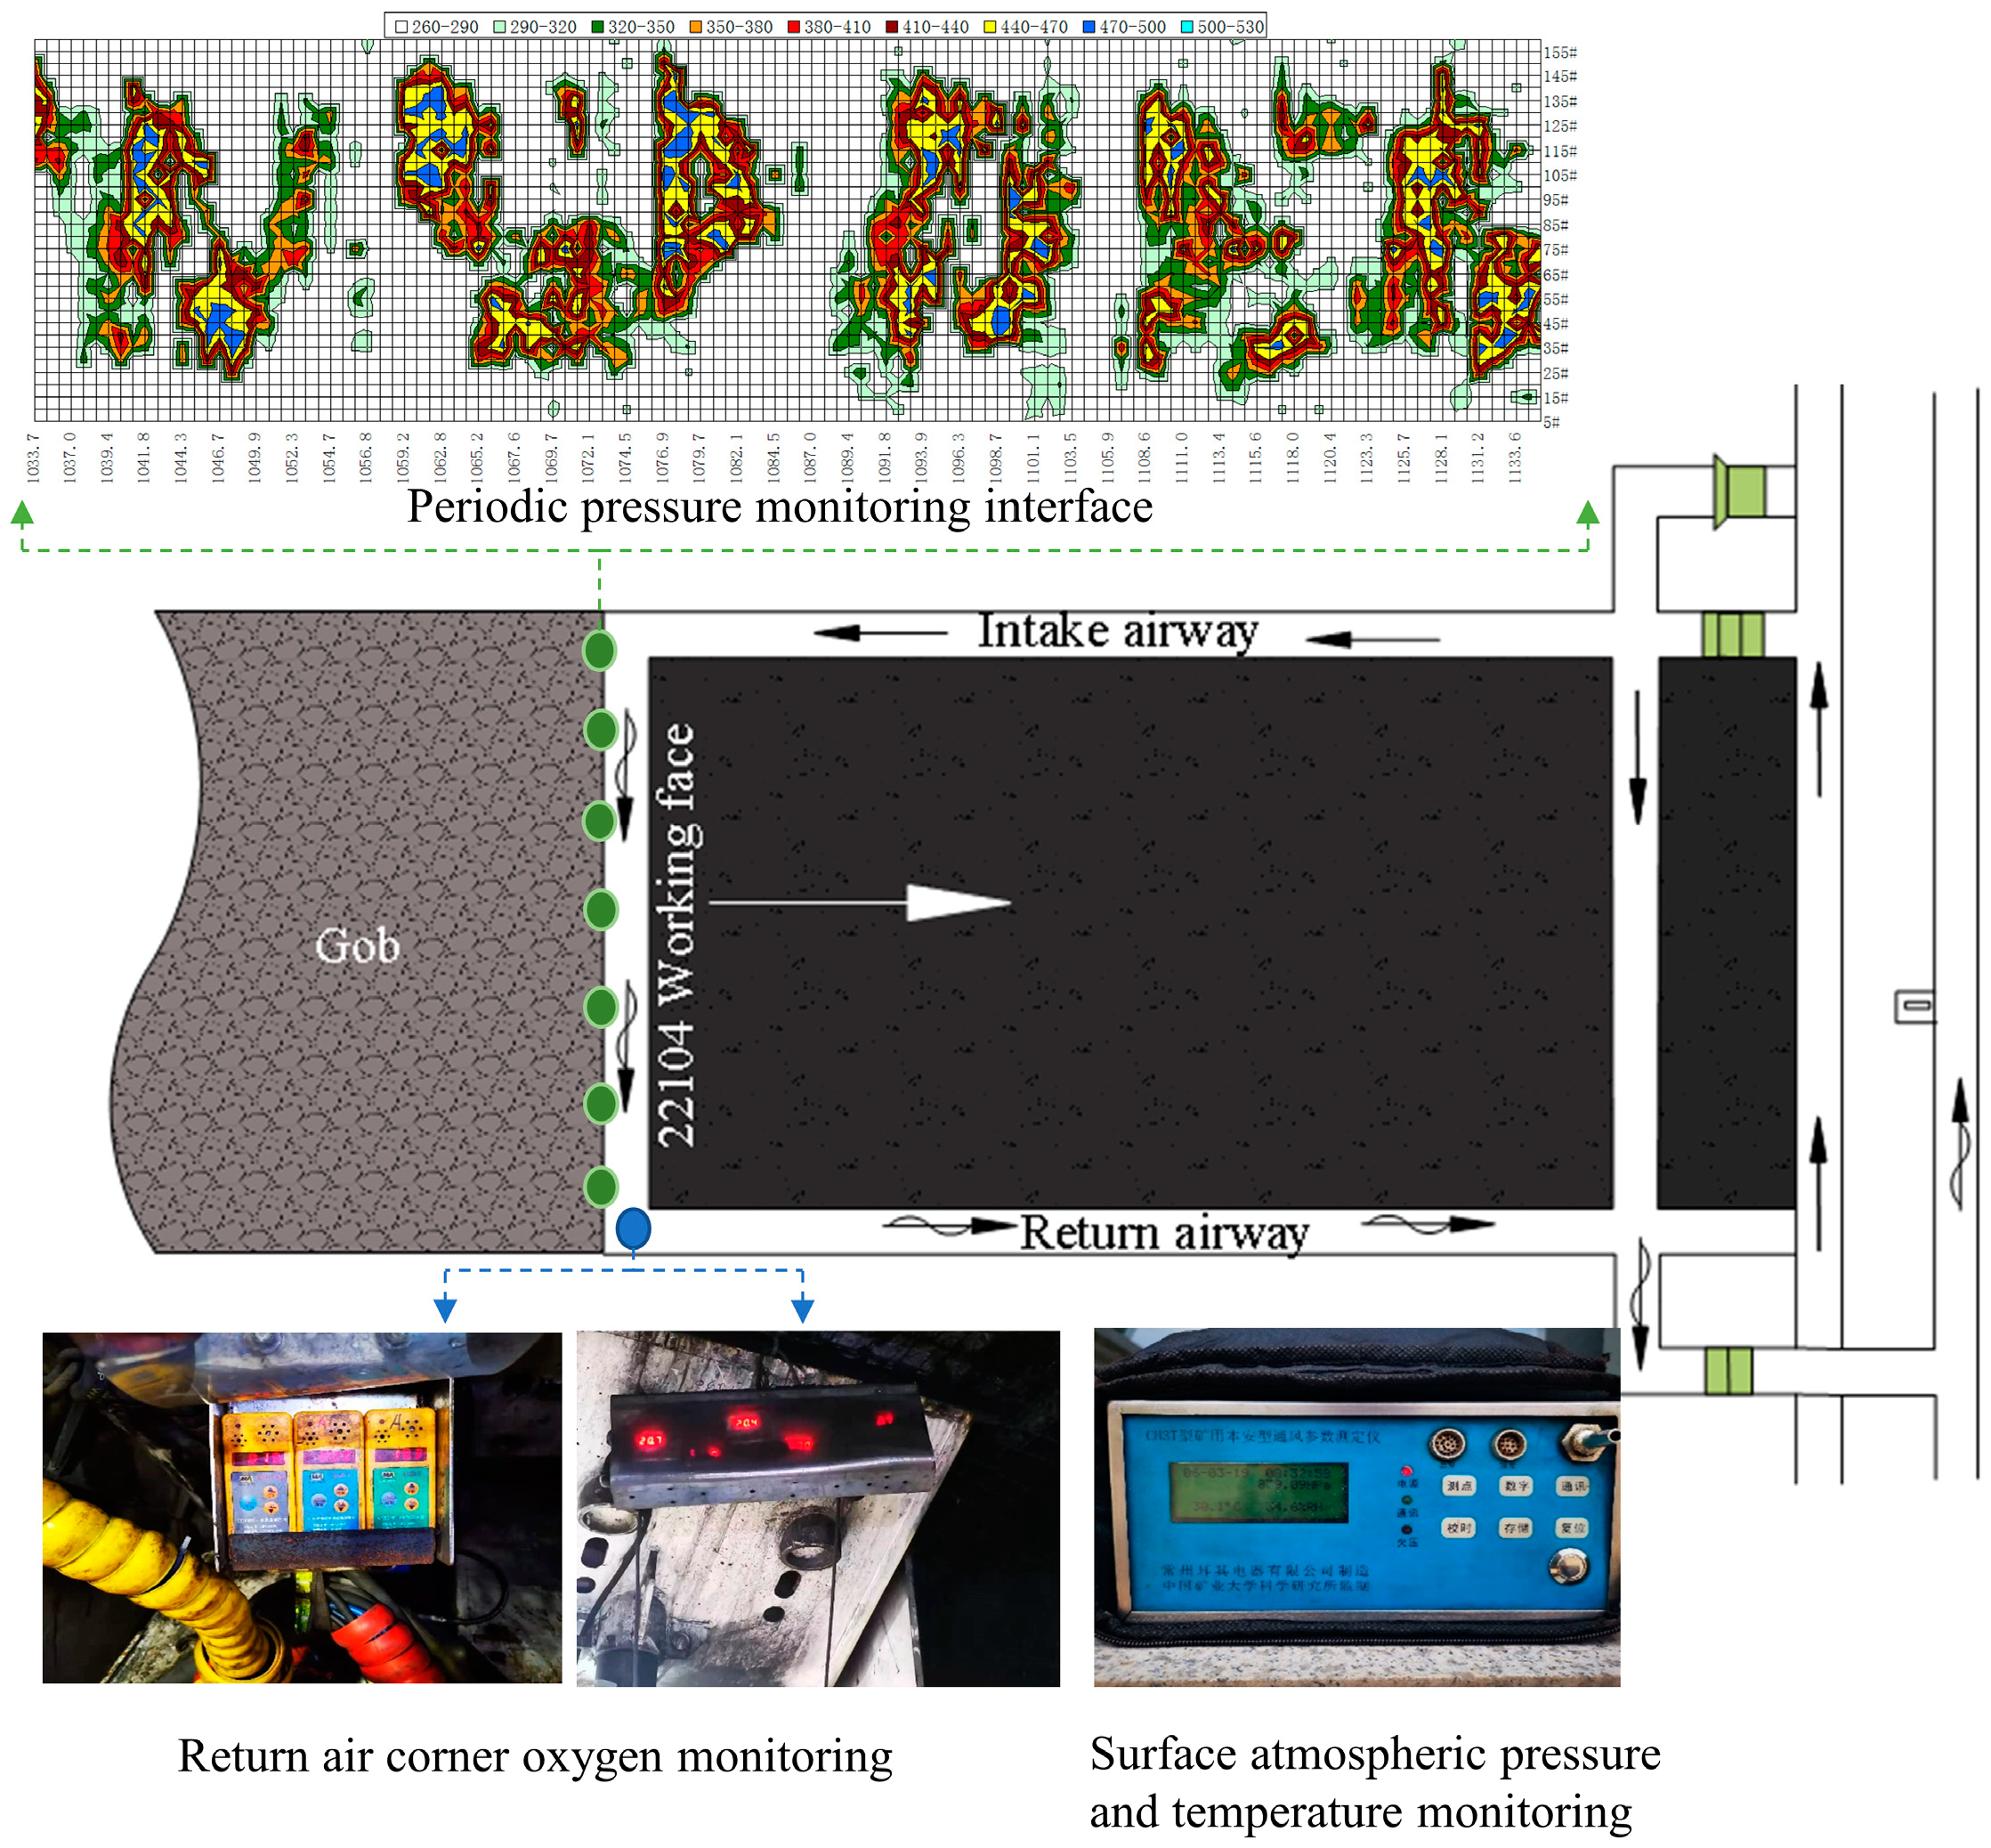
2.1. Low Oxygen Source Analysis

The gas in the return air corner and inside the goaf was sampled and analyzed. The main components of the gas were determined by gas chromatography. As shown in Table 1, the O2 concentration in the air return corner is 17.004%, the N2 concentration is 82.685%, and the CO2 concentration is 0.289%. The highest nitrogen concentration in the goaf reaches 95.538%. Therefore, it can be determined that the low oxygen in the air return corner is mainly caused by the high nitrogen concentration.
The gas at the return air corner comes from the fresh air flow of the working face and the gas emitted from the goaf. The sources of the gas inside the goaf include the gas produced by the desorption of the broken coal after the coal seam is mined, and the gas consumed and produced during the chemical reaction of the left coal inside the goaf.
Samples were taken from 12 # coal and 22 # coal respectively. Gas components were determined through coal desorption experiment and gas chromatography analysis. The results are shown in Table 2. The average proportion of N2, CH4 and CO2 in the desorption gas is 92.76%, 5.98% and 1.21% respectively. It can be determined that the main form of coal seam gas emission is N2 emission. The N2 extracted from broken coal is one of the sources of low oxygen gas in the goaf.
The Shendong mining area belongs to shallow buried deep, easy to spontaneous combustion, near coal seam group multiple disturbance mining [45], and the remaining coal in goaf is easy to be oxidized. A certain amount of residual coal samples was taken from 22104 goafs of the Shangwan Mine, and the coal oxidation experiment was carried out by means of oxidation heating experiment device, and the corresponding laws of oxygen consumption and gas production were analyzed. The change results of gas concentration in the process of heating and oxidation of coal samples are shown in Figure 2. In the test temperature range, the gases produced by oxidation include CO, CH4, CO2, C2H4, C2H6, and C3H8. Meanwhile, the change of O2 concentration during the oxidation process of residual coal was recorded.
During the whole experiment, the oxygen concentration decreased continuously and the production of low oxygen gas increased continuously. As the residual coal in the goaf is in the broken state, the contact area between coal and oxygen increases, leading to a more sufficient oxidation reaction. The coal absorbs and consumes oxygen, and the oxygen proportion in the goaf decreases continuously, forming a high nitrogen and low oxygen environment.
Through the analysis of coal seam gas components and the oxidation experiment of residual coal, it is determined that the low oxygen gas in the goaf mainly includes the nitrogen produced by the desorption of broken coal and the low oxygen gas produced after the consumption of oxygen by the oxidation of residual coal. This makes the goaf become a high nitrogen and low oxygen environment.

2.2. Low Oxygen Causes Analysis

When the pressure of the goaf is greater than that of the working face, the low oxygen gas in the goaf will gush out to the working face. The negative pressure ventilation mode causes the lowest pressure at the return air corner, so the low oxygen phenomenon at the return air corner is the most serious. Therefore, the change in the pressure difference between the working face and the goaf is the main reason for the low oxygen gas emission.
The mine ventilation system delivers fresh air flow to the working face from the surface. The change of static pressure of the working face synchronizes with the change of atmospheric pressure of the surface. The temperature difference between day and night in Shendong mining area is large. The atmospheric pressure changes obviously in one day. When the surface atmospheric pressure decreases, the static pressure of the working face also decreases. This results in a large pressure difference between the working face and the goaf. The abnormal emission of low oxygen gas in the goaf leads to the change of O2 concentration in the return air corner. The change rule of oxygen concentration in daily return air corner of 22104 working face affected by surface atmospheric pressure and temperature is analyzed, as shown in Figure 3.
According to Figure 3, from 0 to 13 o’clock on the same day, oxygen concentration varied from 17.3–18.4%, while atmospheric pressure and temperature showed an overall upward trend. From 13 o’clock to 17 o’clock, oxygen concentration gradually decreased and low oxygen appeared. At 16 o’clock, oxygen concentration reached the lowest value of 15.8%. At the same time, atmospheric pressure showed a downward trend and temperature showed a rising trend. From 17 o’clock to 24 o’clock, oxygen gradually increased to more than 17%, while atmospheric pressure showed a rising trend and temperature showed a declining trend. The pressure difference on that day was 400 Pa and the temperature difference was 8.2 °C. The results show that the change of surface atmospheric pressure and temperature will lead to the change of oxygen concentration in the corner of return air. It is greatly affected by the numerical changes of pressure difference and temperature difference in a short time.
The mining speed of 22104 working face in Shangwan Coal Mine is 16 m/d, the speed of the shearer is fast, the average thickness of the coal seam is 6.6 m, and the full-height mining method is adopted. When mining is too fast, it is easy to cause the goaf coal seam roof to not collapse in time. Then, the periodic pressure step distance will be too long. When mining to a certain distance, and a large area of overhanging roof suddenly collapses, low oxygen gas in the goaf will be squeezed into the mining space, resulting in abnormal gas concentration at the return airway corner. The oxygen concentration in the return air corner of different pressure step distance regions was statistically compared, as shown in Figure 4. When the 22104 face is advanced from 1332 m to 1524 m, the average periodic pressure step distance is 18.45 m. When advancing from 1785 m to 2200 m, the average periodic pressure step distance was 12.69. The lowest oxygen concentration value was 13.6% and the variance was 1.16 in the area from 1332 m to 1524 m; the lowest oxygen concentration value was 15.9% and the variance was 0.76 in the area from 1785 m to 2200 m. The results show that the smaller the periodic pressure step, the smaller the dispersion degree of oxygen concentration, the higher the data stability, and the smaller the abnormal gas emission degree of goaf. Therefore, the periodic pressure step distance is also one of the factors affecting the oxygen concentration in the corner of the return air.
To sum up, the occurrence of low oxygen in the return air corner of the shallow seam mining face can be summarized as follows: under the condition of composite large-area goaf, the residual coal desorption and low-temperature oxidation produce a large amount of low oxygen gas, mainly for N2, making the goaf become a high nitrogen and low oxygen environment. Influenced by air leakage channel, surface climate change, roof collapse and other factors, the pressure difference between the goaf and the working face changes dynamically. Under the effect of pressure difference and negative pressure ventilation, low oxygen gas gushes out from the return corner, resulting in low oxygen.

2.3. Prediction Method

2.3.1. Random Forest

Random forest (RF) is one of the most widely used algorithms in ensemble learning. It is an ensemble learner with multiple decision trees. It establishes regression and classification CART trees and analyzes regression and classification problems by calculating the optimal bifurcation nodes without pruning [46]. The Bootstrap autonomous sampling method was used to randomly select M training sample sets with the same size as the original sample set and construct CART trees for M training sample sets [47]. The tree is split and grown by counting the amount of information each feature contains. The decision result of each decision tree is synthesized by majority voting method, and the classification result is output. For regression problem, the final result is obtained by means of average treatment of each decision result.
When the sample data is randomly sampled, about one-third of the data is not selected. This is called out-of-bag (OOB) data [48]. Since OOB data do not participate in the construction of decision tree in the random forest model, OOB error estimation is an error estimation method that can replace the test set. The out-of-bag data error is the unbiased estimation of the test data set error. OOB data can be used to test the generalization ability of the model and analyze the relative importance of the input indexes to the predicted results of the model [34]. The algorithm flow framework is shown in Figure 5.
In the training stage, noise interference is performed on input indicators based on OOB data. The eigenvalues of input indicators are randomly changed to calculate the importance of input indicators (the influence of input on output). By randomly changing the value of the indicator variable F in each tree of OOB sample, the sum of the average error of the prediction accuracy of OOB sample before and after the change of the input indicator is calculated to obtain the importance of the input indicator. The importance of each input indicator is obtained from the mean of all trees [48]. The calculation formula is as follows:
F I t f = T x i β c t I l j = c i t β c t x i β c t I l j = c i , π f t β c t T
where, β c t is the OOB sample of the corresponding decision tree, and t represents the number of the tree (1, 2, …, T), T represents the total number of trees, c i t and c i , π f t represent the predicted value of each sample in the tree before and after changing variables respectively. xi indicates that the sample value lj is a real label. I represents the importance function based on lj value, i represents the number of samples per leaf in the tree, and j represents the number of samples per tree in the forest.

2.3.2. Genetic Algorithm

Genetic algorithm (GA) is a method to search for the optimal solution by simulating the natural evolution process. Through mathematical methods and computer simulation operation, the solving process of the problem is transformed into a process similar to the crossover and mutation of chromosome genes in biological evolution [43,44]. When solving complex combinatorial optimization problems, compared with some conventional optimization algorithms, better optimization results can be obtained faster. Genetic algorithm has been widely used in combinatorial optimization, machine learning, signal processing, adaptive control, and other fields.
The basic operation flow of GA is as follows:
  • Initialization: set the evolution algebra counter t = 0, the maximum evolution algebra T, randomly generate n individuals as the initial population g(0), and find an appropriate coding scheme to encode individual ai in the population.
  • Individual evaluation: Define the objective function and calculate the fitness g(ai) of each individual in the population.
  • Selection operation: select the individuals participating in reproduction according to the size of fitness. Take the proportion of fitness as the selection standard. For a population of given size n ={a1, a2,…, an}, the fitness of individual ai is g(ai). Then, its selection probability is
    p ( a i ) = g ( a i ) i = 1 n g ( a i ) ,   i   =   1 ,   2 ,   ,   n .
  • Crossover operation: According to crossover probability Pc, two matched individuals are selected to exchange part of their genes, thus forming two new individuals. Crossover operation is an important feature of genetic algorithm which is different from other evolutionary algorithms. It plays a key role in genetic algorithm and is the main method to generate new individuals. Crossover operators generally adopt single point crossover operators.
  • Mutation operation: according to the mutation probability Pm, some gene values in the individual coding string are replaced with other gene values to form a new individual. The mutation operation in GA is an auxiliary method to generate new individuals, which determines the local search ability of GA, while maintaining the diversity of the population. The cross operation and mutation operation cooperate with each other to jointly complete the global search and local search of the search space.
  • Population g(t) gets the next generation population g(t + 1) after selection, crossover, and mutation operations.
  • Termination condition: when t = T, the individuals with optimal fitness obtained in the evolution process are output as the optimal solution and the calculation is terminated.
The GA calculation process is shown in Figure 6.

2.3.3. Hybrid RF Model Based on GA Optimization

RF model parameters were optimized based on GA, including trees and leaves. The Tree Bagger algorithm in MATLAB was used to build the random forest model. In the running stage of the model, the initial number of trees was set to the default value of 500 [49], the initial number of leaves of each tree was set to 5 [50], and the initial default parameter value was used to input the importance analysis of indicator variables.
In general, if the number of trees in the forest and the number of leaves per tree are less than the optimal number, underfitting may occur, resulting in a high model error rate. Overfitting occurs when the model is larger than the optimal number. Therefore, GA was proposed to optimize the number of trees and leaves to improve the prediction performance of RF model and reduce the error rate. The algorithm optimizes the number of trees and leaves by searching all possible optimal values of the objective function in the solution space. Figure 7 shows the GA-RF prediction flow chart for predicting oxygen concentration in the corner of return air.
The process of the GA optimized RF hybrid model used to predict the oxygen concentration in the return air corner is as follows:
Part 1: According to the collected samples, the data are divided into training samples and test samples. Through the importance analysis of the characteristic input indexes of the training samples, the input indexes are re-determined to improve the calculation efficiency and accuracy of the model.
  • Determine training samples and test samples. Set RF model input, namely samples, and indicators.
  • Determine the number of trees and leaves in the forest. The recommended default number of trees is 500. The developers of the Tree Bagger algorithm suggested 5 leaves per tree as the default. Therefore, in this study, the initial trees in the forest and the number of leaves per tree are 500 and 5, respectively.
  • Use the “Tree Bagger algorithm” developed by MATLAB to train the RF algorithm. In this process, analyze the importance of indicator variables and screen out which input indicators will have a great impact on the output. Variable importance analysis is used to improve algorithm performance and reduce simulation time.
  • Modify the RF algorithm input according to the importance analysis results of indicator variables.
Part 2: Based on the optimization of input variables and samples, GA was used to optimize the number of trees and leaves in RF to improve the accuracy of the prediction model.
  • Determine the objective function. In this study, the objective function is to minimize the RMSE value between the sample predicted data and the actual data in the training stage. The objective function is:
    RMSE = 1 n i = 1 n f i y i 2
    where n is the sample number, fi is the actual value, and yi is the predicted value.
    f = min ( R M S E ) s . t . 1 l e a f 10 1 n t r e e s 500
  • Initialize the genetic population
  • Evaluate the fitness of the initial population, select evolutionary individuals through roulette, carry out crossover and mutation operations, and update the fitness of the population.
  • Run Tree Bagger algorithm in GA training mode to optimize the number of trees and leaves based on f = min ( R M S E ) .
  • Update the population fitness to check whether it reaches the global optimal value. If so, go to the next step; otherwise, return the third step to make it reach the global optimal solution.
  • Determine the amount of trees and the number of leaves when the target function is optimal.
  • Stop the optimization process and transfer the optimal parameter values to the Tree Bagger algorithm.
Part 3: Finally, the RF model is trained and tested using the corrected variable indicators and optimized parameters.

2.3.4. Hybrid BPNN Model Based on GA Optimization

BPNN is a typical feedforward network. Through the method of forward propagation of network structure, BPNN uses training function to reverse modify the network weight matrix and threshold value. The model is built in MATLAB simulation and compilation environment, and the network model is trained by fully adjusting the number of hidden layer neurons.
Since the optimal number of hidden neurons was not known during initial modeling, the number of hidden neurons was determined by empirical formula S = 2n + 1 = 13 (n is the number of nodes in the input layer). If the number of hidden neurons is lower than the optimal value, there may be inadequate fitting, which may result in a high generalization error. If the number of hidden neurons is higher than the optimal value, overfitting and high variance may occur. Therefore, the initial weights and thresholds of the network are randomly obtained, and the number of hidden neurons is optimized by GA to determine the neural network topology. Each individual in GA population contains the number of hidden neurons in a network. The objective function is used to calculate the individual fitness value, and the number of hidden neurons corresponding to the optimal fitness value is found through selection, crossover and mutation operations. The objective function is to minimize the training data RMSE.

2.4. Data Collection and Indicator Setting

According to the analysis of the causes of low oxygen in Section 2.2, changes in surface atmospheric pressure and temperature, and the periodic pressure step distance of the roof will affect the abnormal oxygen concentration in the corner of return air. Therefore, the air multi-physical parameter measuring instrument is arranged on the ground to record the temperature and atmospheric pressure of the air on the ground in real time. Combined with the parameters of the return air corner sensor and the periodic pressure data of the working face, the real-time data of the linkage between the upper and lower parts of the mine are measured in different stages of the advancing of the working face. The data collection layout is shown in Figure 8.
The input indexes of the prediction model are determined as time, hourly temperature difference, hourly pressure difference, daily temperature difference, daily pressure difference and working face cycle pressure step distance. The output indexes are oxygen concentration in the corner of return air. In order to ensure the robustness of the model and avoid excessive fitting, the number of samples collected should be guaranteed, divided into training samples and test samples, and the test samples should not be less than a quarter of the total number. Nine hundred twenty-nine groups of model index data were statistically obtained through the mine up-down linkage measurement. Hourly oxygen concentration, surface atmospheric pressure and temperature data samples are shown in Figure 9. Indicator data are obtained after pretreatment.

2.5. Evaluation Indexes of Model Performance

Performance evaluation indexes include mean absolute error (MAE), mean absolute percentage error (MAPE) and root mean square error (RMSE). MAE is the average absolute error index, with a range of [0, +∞]. The larger the error is, the larger the value will be; otherwise, the value will be smaller. When the predicted value is in complete agreement with the real value, MAE is equal to 0. MAPE is the prediction accuracy index, with a range of [0, +∞]. The larger the error is, the larger the value will be. Otherwise, the value will be smaller. When MAPE is 0, the predicted value is in complete agreement with the real value. RMSE is the efficiency index of the prediction process, and the range is [0, +∞]. The larger the error is, the larger the value will be, and vice versa.
MAE = 1 n i = 1 n f i y i
MAPE = 1 n i = 1 n f i y i y i × 100 %
RMSE = 1 n i = 1 n f i y i 2

3. Results

3.1. Subsection

After data set division, training data samples were used to analyze the importance of indicators to improve the accuracy of the model. The initial number of trees was 500 and the number of leaves was 5. Indexes with low importance have certain influence on the efficiency and accuracy of model prediction. Input indexes were screened by index importance analysis. As shown in Figure 10, six input indicator variables are used to predict the oxygen concentration in the return air corner, and each indicator input has a certain contribution to the output, but the size is different. By analyzing the proportion of importance value of input variables, the importance of hourly pressure difference is the highest, reaching 2.9/3, while the importance of daily pressure difference is the lowest, reaching 1.01/3. The results show that the six input indexes have contribution values to the output, and they are not small, so there is no need to screen the input indexes in this process.

3.2. Optimization Results of Model Parameters

The number of trees and leaves of the random forest initial parameters were 500 and 5, respectively. Based on the above data, the RF model was optimized by GA. The minimum RMSE value of training data was used as the objective function to optimize the number of trees and leaves. This was done to improve the prediction accuracy of the model. The initial population of GA is set randomly, assuming that the population size is 50, the maximum number of iterations is 100, the crossover probability is 0.8, and the mutation probability is 0.1.
Figure 11 shows the convergence curve of tree count and leaf count based on the GA optimized RF model. The X-axis is the number of iterations and the Y-axis is the fitness value of the objective function RMSE. GA maintains a high convergence rate and falls into the optimal solution after about 40 iterations of optimization. Based on the optimal solution of objective function, the optimal number of trees and leaves in random forest is 398 and 1.
The RF model optimized by GA is used to predict the oxygen concentration in the return airway corner of the working face. The number of trees and the number of leaves corresponding to random forest parameters after optimization of objective function f = min ( R M S E ) are 398 and 1. The input indexes are selected after importance analysis and screening. Eighty percent of the data are selected as model training samples, and 20% of the data are selected as model testing and verification. The comparison between the oxygen concentration predicted by GA-RF model and the actual data is shown in Figure 12.

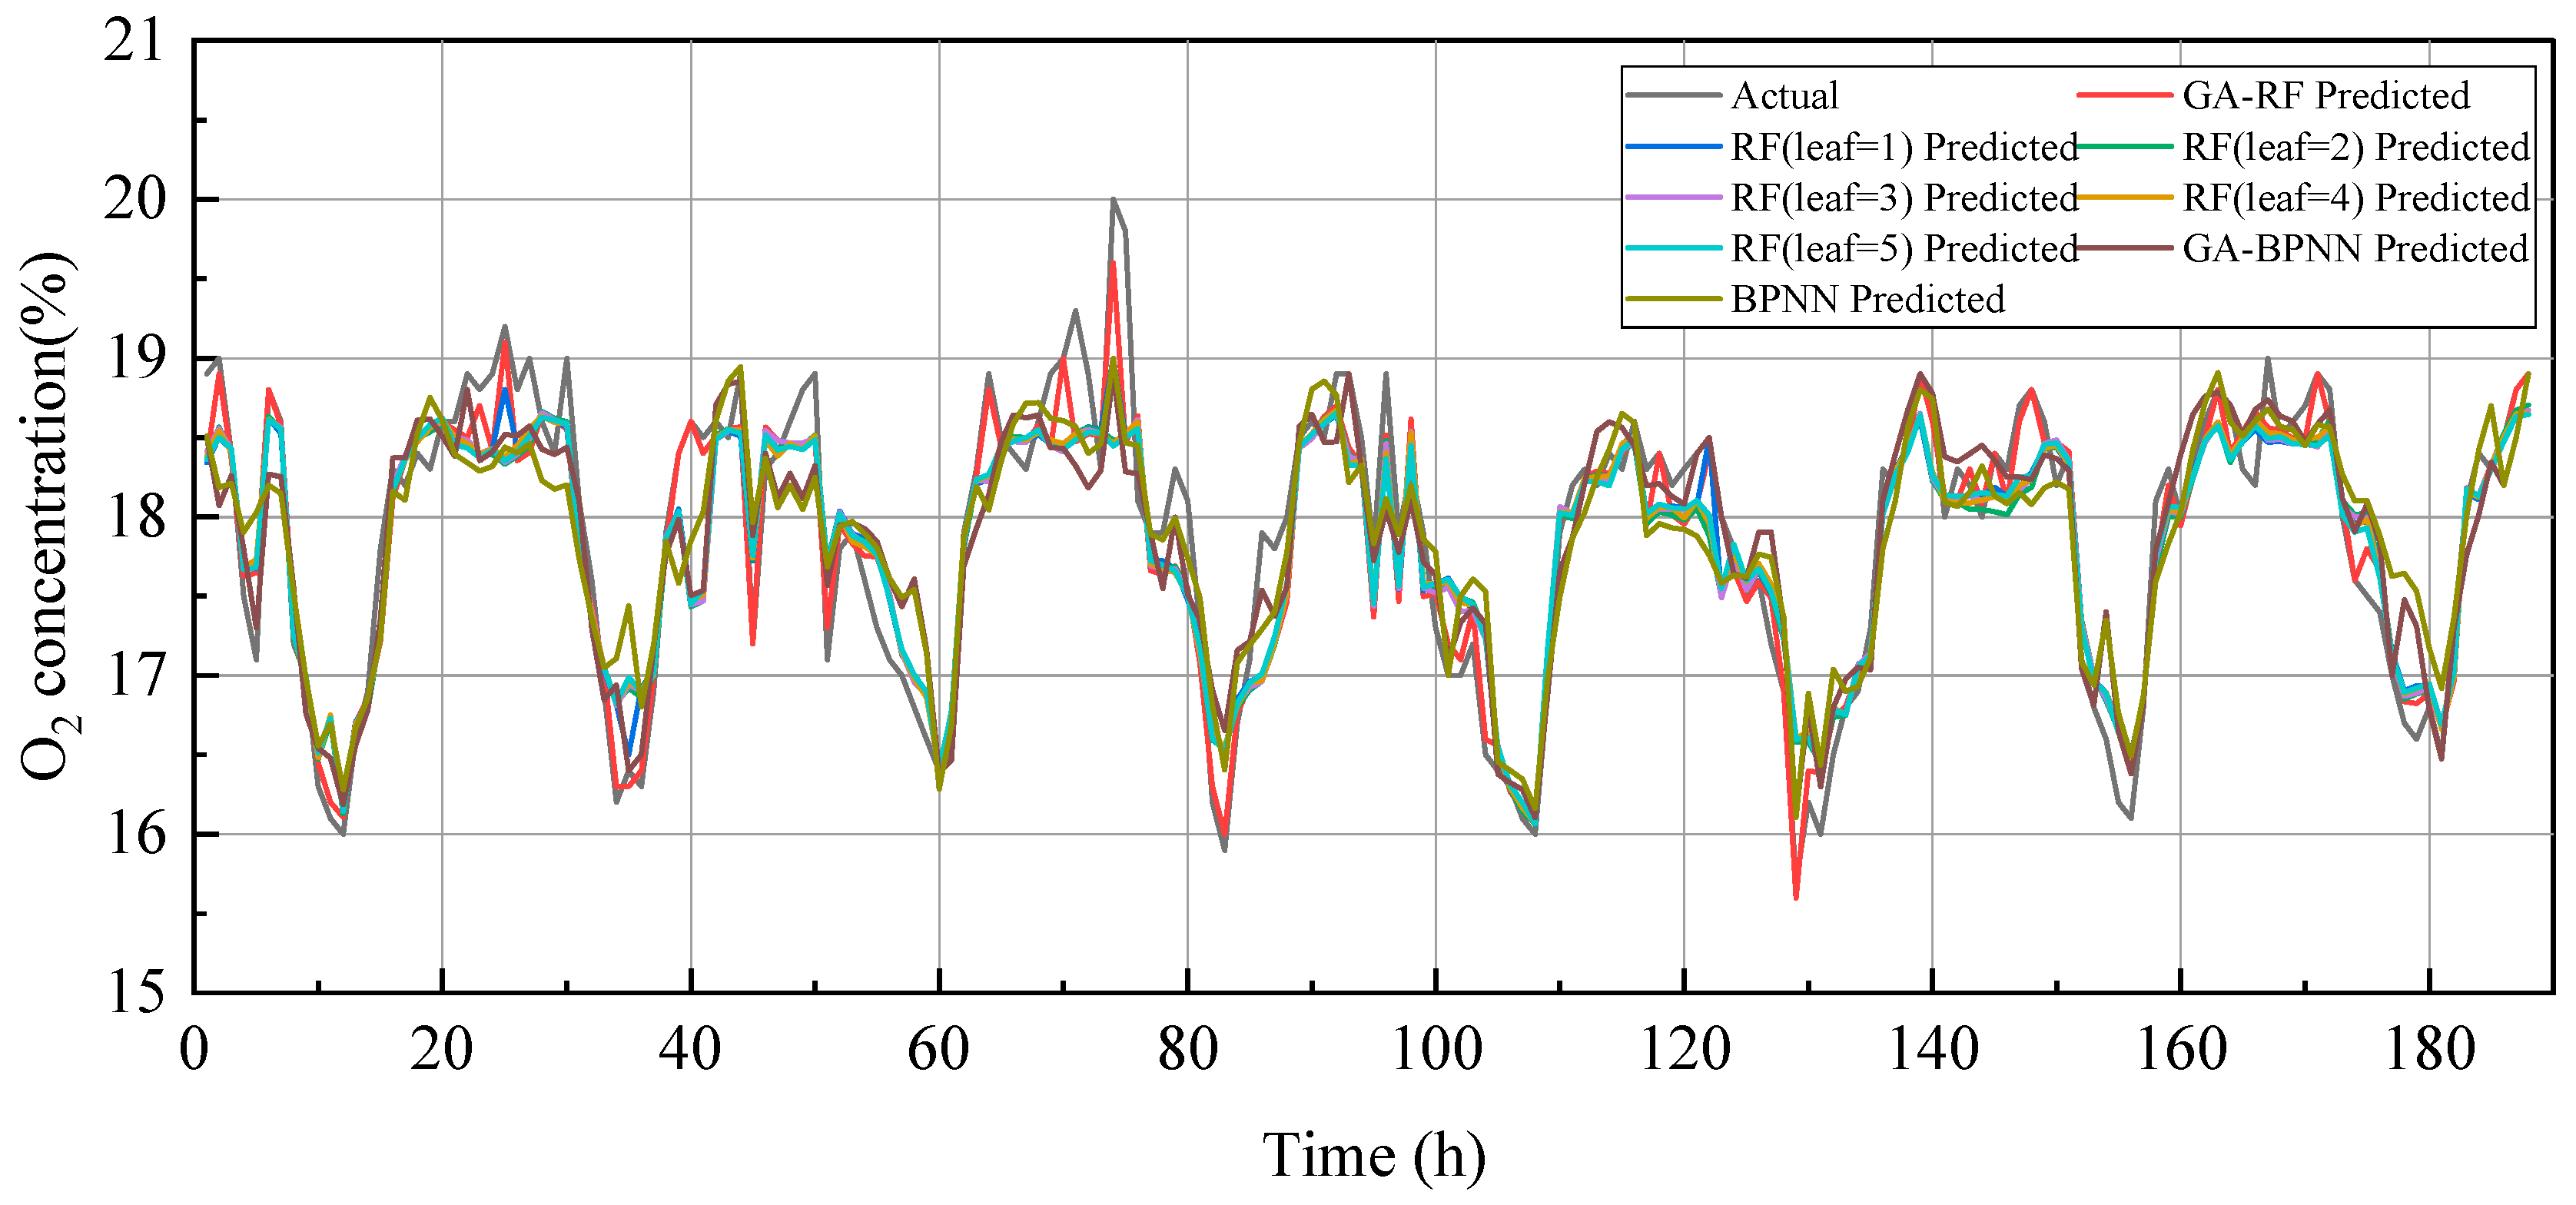
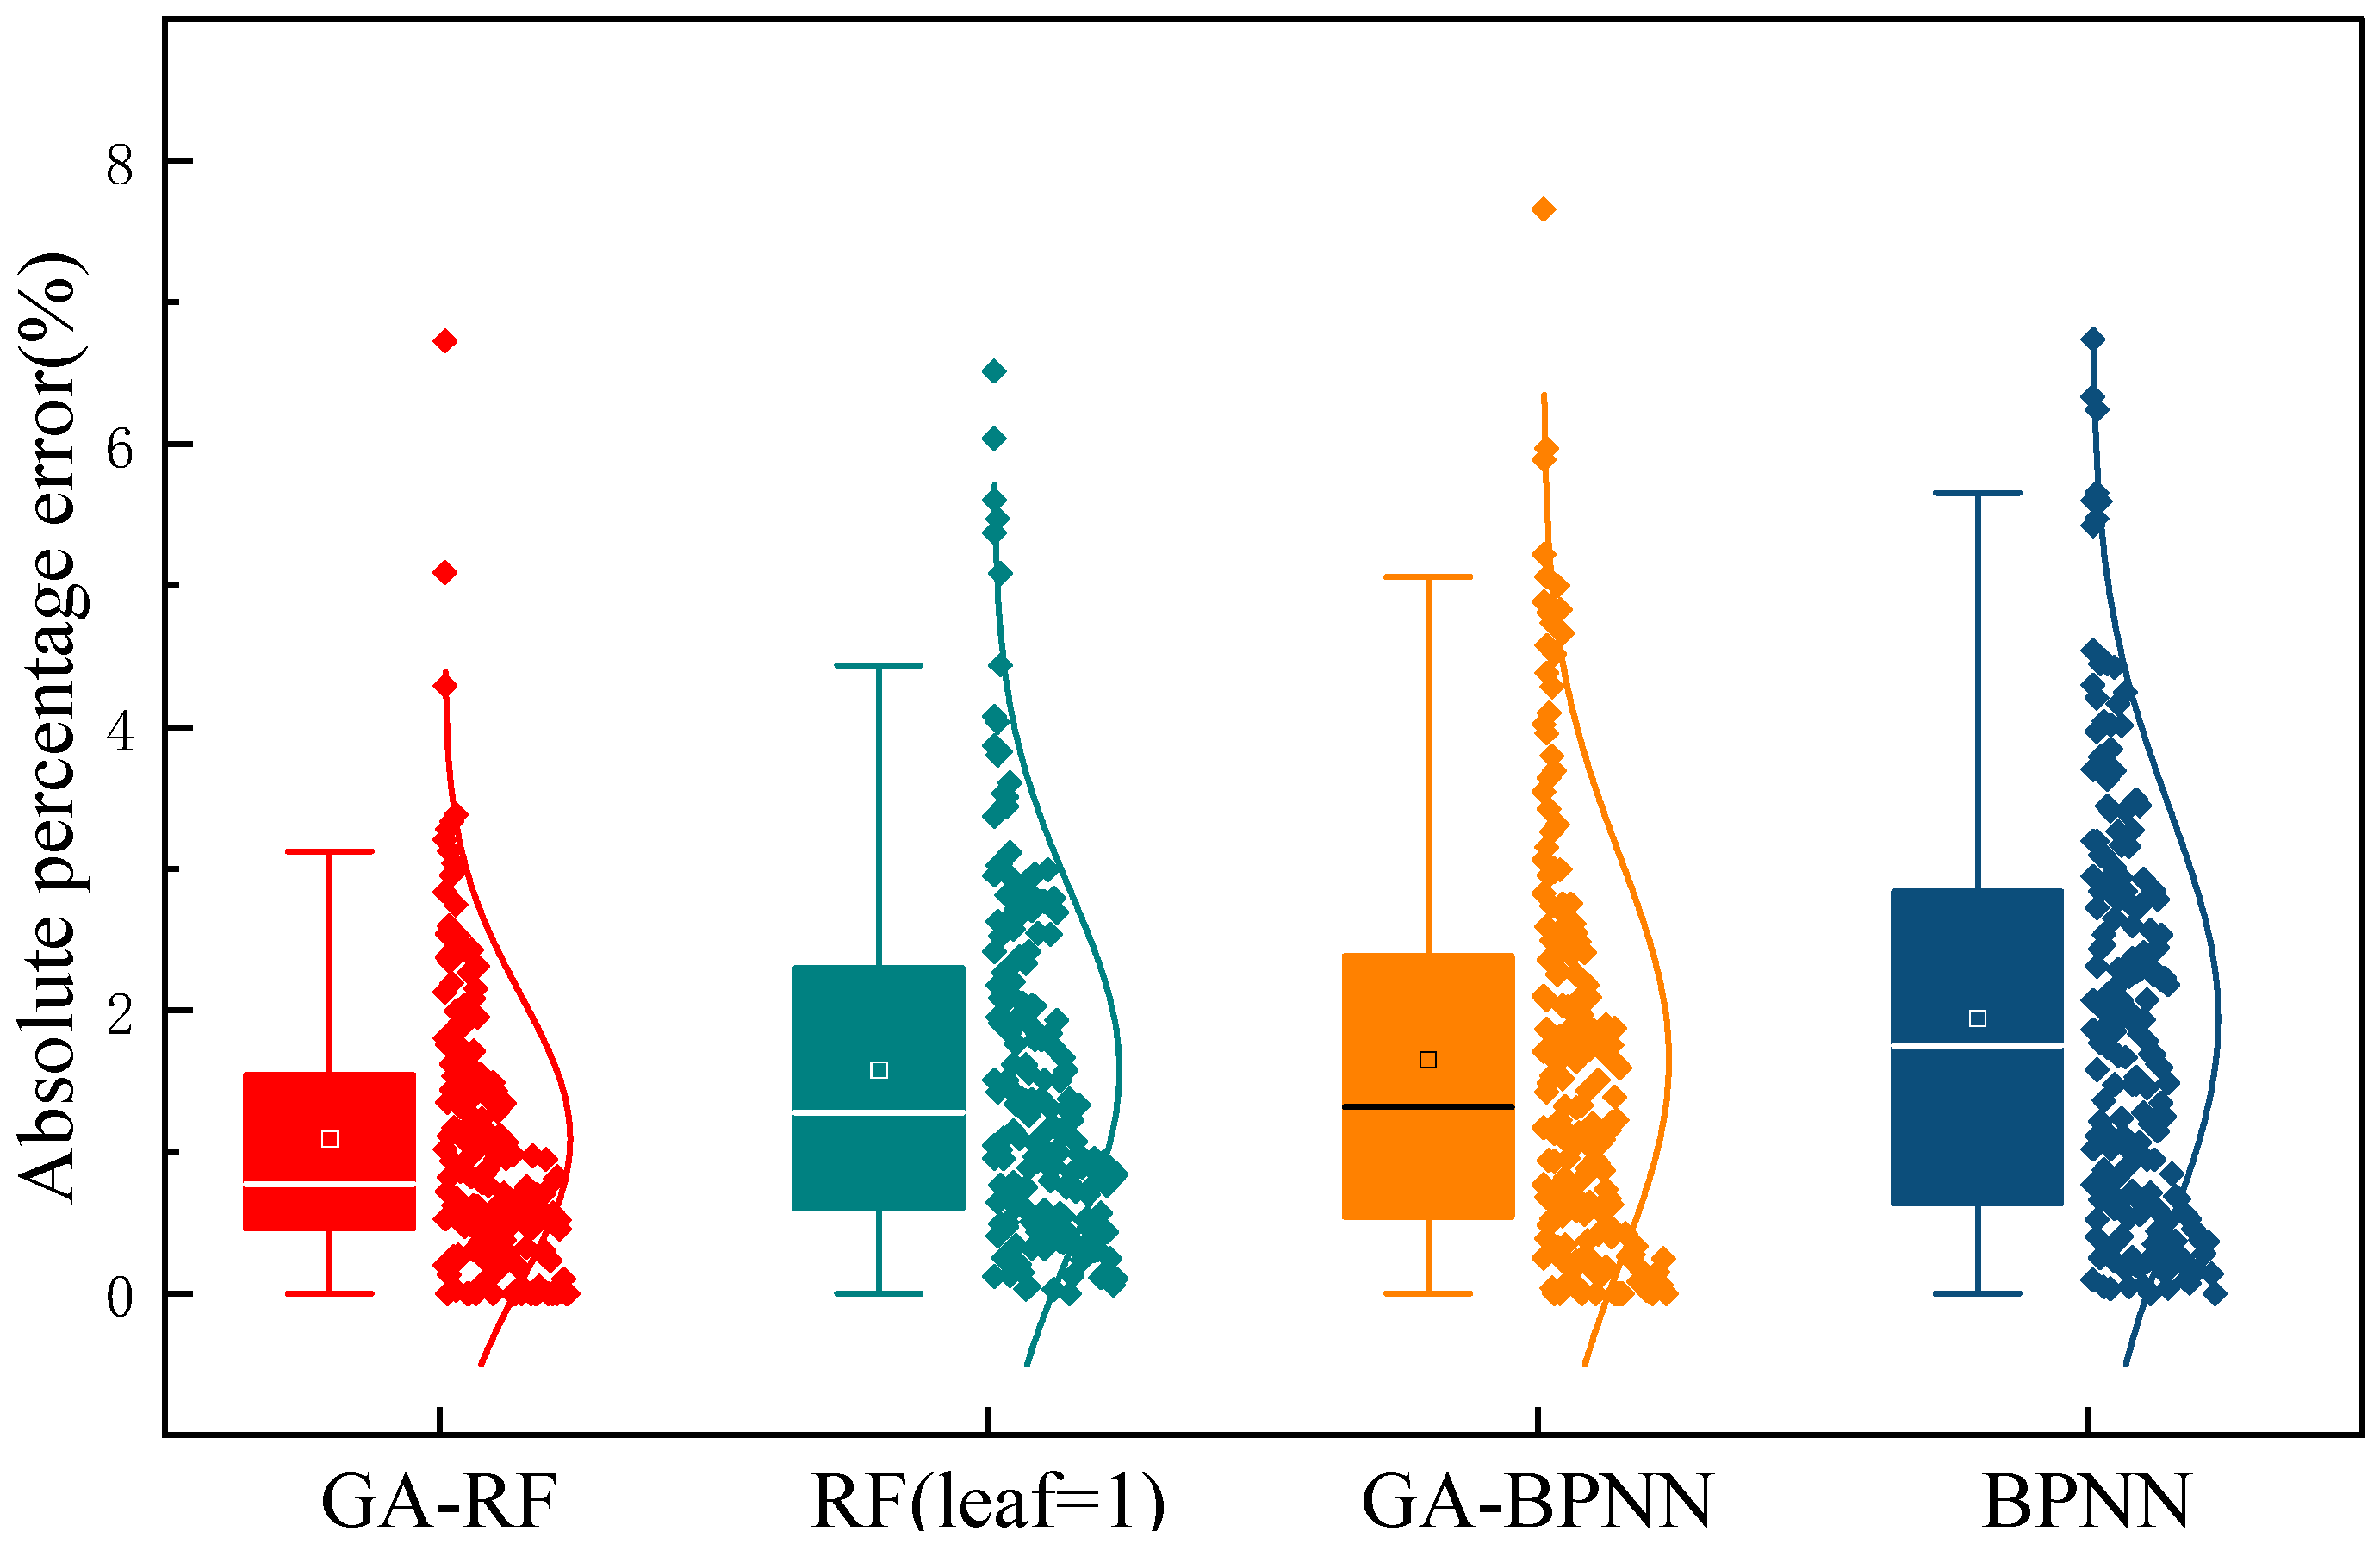
3.3. Model Comparison

In order to prove the superiority of the ga-RF model, the predicted oxygen concentration data of the return airway corner were compared with that of the traditional RF and BPNN as well as that of the optimized BPNN model based on GA.
First, the RF model with the default tree size of 500 and the number of leaves [1, 5] was used. The RF process is shown in Figure 13. In the training phase, MSE(OOB) value of leaves = [1, 5] is used as an unbiased estimation of the error of the test data set to test the generalization ability of the model. As shown in Figure 13, MSE(OOB) tends to be stable when the number of trees exceeds 100. MSE(OOB) = 0.091 is the minimum when leaf = 1 and trees = 417, which is basically consistent with RF parameters leaf = 1 and trees = 398 after GA optimization. This further verified the rationality of RF model parameters optimized by GA.
In GA-BPNN, the initial population of GA was set randomly, assuming that the population size was 50 and the maximum iteration was 100. GA parameters were set as crossover probability 0.8 and variation probability 0.1. The GA convergence curve for optimizing the number of hidden neurons is shown in Figure 14. After about 40 iterations, the optimal solution is obtained. Based on the optimal solution of the objective function, the optimal number of hidden neurons corresponding to the optimal individual is nine.
The topological structure of the return air corner oxygen prediction model is 6-9-1. That is, the network is a three-layer structure, in which the hidden layer neurons are nine, and the input and output neurons are six and one, respectively.
The number of network weights and thresholds is determined according to the network structure, and the initial weights and thresholds of BPNN are optimized by GA. Each individual in GA population contains the initial weight and threshold value of a network. The objective function is used to calculate the individual fitness value. GA finds the initial weight and threshold value corresponding to the optimal fitness value through selection, crossover and mutation operation.
The objective function is to minimize the training data RMSE. The initial population of GA was set randomly, assuming that the population size was 50 and the maximum iteration was 100. GA parameters were set as crossover probability 0.8 and variation probability 0.1.
The GA convergence curve of the optimized initial thresholds and weights is shown in Figure 15. After about 40 iterations, the optimal solution is obtained. Based on the optimal solution of the objective function, the optimal initial weight and threshold corresponding to the optimal individual are obtained, and the optimal initial value is assigned to BPNN for training model.
According to the above analysis, the internal parameters of GA-RF, RF, GA-BPNN and BPNN models are shown in Table 3.
Based on the collected data samples, the training set and test set with the same proportion were divided. Ga-rf, RF, GA-BPNN and BPNN were used to predict the oxygen concentration in the corner of the return air. The predicted data were shown in Figure 16.
When ntree = 500 and leaf = 1, the MSE(OOB) value of the RF model is the smallest. Therefore, the RF model with ntree = 500 and leaf = 1 is selected to compare the absolute percentage error with other models.
When RF and BPNN optimized by GA are compared with RF and BPNN, the MAPE is significantly reduced. This indicates that GA has a certain optimization effect on the prediction accuracy of the model. The absolute error percentage of RF is slightly less than that of GA-BPNN. This indicates that RF has a certain prediction accuracy even without parameter optimization. The error is within a controllable range. Combined with Figure 16 and Figure 17, it can be seen that GA-RF has the best prediction effect.
According to the model performance evaluation indexes mentioned in Section 2.4, the predicted performance evaluation indexes of GA-RF, RF, GA-BPNN and BPNN models are calculated as shown in Table 4. The RMSE, MAPE, and MAE of the GA-RF model are about 0.2713, 1.09, and 0.1961, respectively. These values are all smaller than other prediction models. According to the meaning of each evaluation index, the smaller the value, the higher the prediction accuracy of the model. The RMSE of GA-RF, RF, GA-BPNN, and BPNN are 0.2713, 0.3628, 0.3941 and 0.4354, respectively. The RMSE of GA-RF is significantly smaller than that of other prediction models, indicating that GA-RF has the highest prediction accuracy. According to the site situation of 22104 working face in Shangwan Mine, the oxygen concentration at the return air corner is less than 18.0%, which can be determined as low oxygen, and the sensor accuracy reaches one decimal place. Therefore, when the difference of RMSE values of each model differences, it will have a significant impact on the prediction accuracy of low oxygen. The results show that the GA-RF model has higher universality and accuracy in the prediction of oxygen concentration at return air corner. Compared with the GA-RF model, the prediction accuracy of RF, GA-BPNN and BPNN is not enough.

4. Conclusions

In this study, a machine learning hybrid model GA-RF was developed for prediction of oxygen concentration of the working surface return airflow corner during coal mine. An amount of 22104 working faces of Shangwan Coal Mine in Shendong mining area were used as the research object. Through the analysis of coal seam gas components and the oxidation experiment of residual coal, it was determined that the low oxygen gas in the goaf mainly includes the nitrogen produced by the desorption of broken coal and the low oxygen gas produced after the consumption of oxygen by the oxidation of residual coal, making the goaf become a high nitrogen and low oxygen environment. Influenced by air leakage channel, surface climate change, working face mining speed, and other factors, the pressure difference between the goaf and the working face changes dynamically. Under the effect of pressure difference and negative pressure ventilation, low oxygen gas gushes out from the return corner, resulting in low oxygen.
Field data were collected through up-down linkage of mine. Training samples were constructed, and input and output indexes of prediction model were determined. Using GA to optimize the RF model parameters, including the number of trees and the number of leaves per tree, and MAE, MAPE, and RMSE were used to evaluate the prediction performance of the model. Compared with RF, GA-BPNN, and BPNN models, the number of hidden neurons was firstly optimized when GA optimized BPNN, and the network topology was determined. On this basis, the initial weights and thresholds of the network were optimized. The results show that GA-RF has high generalization ability and prediction accuracy, and GA has certain optimization effect on prediction accuracy. The RMSE, MAPE, and MAE values of the GA-RF model are about 0.2713, 1.09, 0.1961, respectively. Therefore, it is suggested to use GA-RF model to predict the oxygen concentration in the corner of return air. Based on the change of surface climate conditions and the data of the roof of the working face, the oxygen concentration at the return air corner is predicted without affecting the ventilation system, and the prevention and control measures for low oxygen are prepared in advance to ensure the safe production of workers. At the same time, according to the actual situation of the mine, GA-RF model can also be used to predict similar abnormal gas emission problems in goaf, such as CH4 overrun and CO overrun in return air corner.

Author Contributions

Conceptualization, K.W. and Z.A.; methodology, Z.A. and W.Z.; validation, Z.A., W.Z. and Q.F.; formal analysis, Z.A. and A.Z.; investigation, Z.A. and Q.F.; resources, Z.A., W.Z. and A.Z.; writing—original draft preparation, Z.A.; writing—review and editing, K.W., Z.A. and W.Z.; supervision, K.W.; funding acquisition, K.W. and W.Z. All authors have read and agreed to the published version of the manuscript.

Funding

This work was supported by the Beijing Natural Science Foundation (Grant number 8222070), the Innovative Research Group Project of the National Natural Science Foundation of China (Grant number 52121003) and the National Natural Science Foundation of China (Grant numbers 52130409 and 51874314).

Institutional Review Board Statement

Not applicable.

Informed Consent Statement

Not applicable.

Data Availability Statement

The authors confirm that the data supporting the findings of this study are available within the article.

Conflicts of Interest

The authors declare no conflict of interest.

References

  1. Xia, T.; Zhou, F.; Wang, X.; Kang, J.; Pan, Z. Safety evaluation of combustion-prone longwall mining gobs induced by gas extraction: A simulation study. Process Saf. Environ. Prot. 2017, 109, 677–687. [Google Scholar] [CrossRef]
  2. Liu, W.; Qin, Y. A quantitative approach to evaluate risks of spontaneous combustion in longwall gobs based on CO emissions at upper corner. Fuel 2017, 210, 359–370. [Google Scholar] [CrossRef]
  3. Xu, Y.; Li, Z.; Liu, H.; Zhai, X.; Li, R.; Song, P.; Jia, M. A model for assessing the compound risk represented by spontaneous coal combustion and methane emission in a gob. J. Clean. Prod. 2020, 273, 122925. [Google Scholar] [CrossRef]
  4. Juganda, A.; Strebinger, C.; Brune, J.F.; Bogin, G.E. Discrete modeling of a longwall coal mine gob for CFD simulation. Int. J. Min. Sci. Technol. 2020, 30, 463–469. [Google Scholar] [CrossRef]
  5. Zhuo, H.; Qin, B.; Qin, Q.; Su, Z. Modeling and simulation of coal spontaneous combustion in a gob of shallow buried coal seams. Process Saf. Environ. Prot. 2019, 131, 246–254. [Google Scholar] [CrossRef]
  6. Zhang, J.; An, J.; Wen, Z.; Zhang, K.; Pan, R.; Mamun, N.A.A. Numerical investigation of coal self-heating in longwall goaf considering airflow leakage from mining induced crack. Process Saf. Environ. Prot. 2020, 134, 353–370. [Google Scholar] [CrossRef]
  7. Chen, Y.; Zhu, S.; Wang, Z.; Li, F. Deformation and failure of floor in mine with soft coal, soft floor, hard roof and varying thicknesses of coal seam. Eng. Fail. Anal. 2020, 115, 104653. [Google Scholar] [CrossRef]
  8. Wang, H.; Cheng, C.; Chen, C. Characteristics of polycyclic aromatic hydrocarbon release during spontaneous combustion of coal and gangue in the same coal seam. J. Loss Prev. Process Ind. 2018, 55, 392–399. [Google Scholar] [CrossRef]
  9. Zhao, W.; Wang, K.; Liu, S.; Ju, Y.; Zhou, H.; Fan, L. Asynchronous difference in dynamic characteristics of adsorption swelling and mechanical compression of coal: Modeling and experiments. Int. J. Rock Mech. Min. Sci. 2020, 135, 571–580. [Google Scholar] [CrossRef]
  10. Xu, C.; Yang, G.; Wang, K.; Fu, Q. Uneven stress and permeability variation of mining-disturbed coal seam for targeted CBM drainage: A case study in Baode coal mine, eastern Ordos Basin, China. Fuel 2021, 289, 119911. [Google Scholar] [CrossRef]
  11. Feng, G.; Wang, P. Simulation of recovery of upper remnant coal pillar while mining the ultra-close lower panel using longwall top coal caving. Int. J. Min. Sci. Technol. 2020, 30, 55–61. [Google Scholar] [CrossRef]
  12. Zhao, W.; Cheng, Y.; Jiang, H.; Wang, H.; Wang, L. Role of the Rapid Gas Desorption of Coal Powders in the Development Stage of Outbursts. J. Nat. Gas Sci. Eng. 2016, 28, 491–501. [Google Scholar] [CrossRef] [Green Version]
  13. Zhang, Z.; Deng, M.; Wang, X.; Yu, W.; Zhang, F.; Dao, V.D. Field and numerical investigations on the lower coal seam entry failure analysis under the remnant pillar. Eng. Fail. Anal. 2020, 115, 104638. [Google Scholar] [CrossRef]
  14. Zhang, C.; Tu, S.; Zhao, Y. Compaction characteristics of the caving zone in a longwall goaf: A review. Environ. Earth Sci. 2019, 78, 27. [Google Scholar] [CrossRef]
  15. Cheng, J.; Zheng, X.; Lei, Y. A compound binder of coal dust wetting and suppression for coal pile. Process Saf. Environ. Prot. 2021, 147, 92–102. [Google Scholar] [CrossRef]
  16. Zhou, D.; Lu, W.; Li, J.; Song, Y.; Wu, C. Reactive adsorption mechanism of O2 onto coal vitrinite during the low temperature oxidation process. Fuel 2022, 308, 121802. [Google Scholar] [CrossRef]
  17. Ma, L.; Yu, W.; Ren, L.; Qin, X.; Wang, Q. Micro-characteristics of low-temperature coal oxidation in CO2/O2 and N2/O2 atmospheres. Fuel 2019, 246, 259–267. [Google Scholar] [CrossRef]
  18. Zhang, Y.; Wu, J.; Chang, L.; Wang, J.; Xue, S.; Li, Z. Kinetic and thermodynamic studies on the mechanism of low-temperature oxidation of coal: A case study of Shendong coal (China). Int. J. Coal Geol. 2013, 120, 41–49. [Google Scholar] [CrossRef]
  19. Xu, J.; Zhu, W.; Xu, J.; Wu, J.; Li, Y. High-intensity longwall mining-induced ground subsidence in Shendong coalfield, China. Int. J. Rock Mech. Min. Sci. 2021, 141, 104730. [Google Scholar] [CrossRef]
  20. Zhuo, H.; Qin, B.; Qin, Q. The impact of surface air leakage on coal spontaneous combustion hazardous zone in gob of shallow coal seams: A case study of Bulianta Mine, China. Fuel 2021, 295, 120636. [Google Scholar] [CrossRef]
  21. Zhang, C.; Zhao, Y.; He, X.; Guo, J.; Yan, Y. Space-sky-surface integrated monitoring system for overburden migration regularity in shallow-buried high-intensity mining. Bull. Eng. Geol. Environ. 2021, 80, 1403–1417. [Google Scholar] [CrossRef]
  22. Zhuo, H.; Qin, B.; Shi, Q.; Li, L. Development law of air leakage fractures in shallow coal seams: A case study in the Shendong Coalfield of China. Environ. Earth Sci. 2018, 77, 772. [Google Scholar] [CrossRef]
  23. Işcan, B. ANN modeling for justification of thermodynamic analysis of experimental applications on combustion parameters of a diesel engine using diesel and safflower biodiesel fuels. Fuel 2020, 279, 118391. [Google Scholar] [CrossRef]
  24. Huang, W.; Liu, H.; Zhang, Y.; Mi, R.; Tong, C.; Xiao, W.; Shuai, B. Railway dangerous goods transportation system risk identification: Comparisons among SVM, PSO-SVM, GA-SVM and GS-SVM. Appl. Soft Comput. 2021, 109, 107541. [Google Scholar] [CrossRef]
  25. Kumari, P.; Toshniwal, D. Deep learning models for solar irradiance forecasting: A comprehensive review. J. Clean. Prod. 2021, 318, 128566. [Google Scholar] [CrossRef]
  26. Zhao, J.; Yang, D.; Wu, J.; Meng, X.; Li, X.; Wu, G.; Yu, S. Prediction of temperature and CO concentration fields based on BPNN in low-temperature coal oxidation. Thermochim. Acta 2021, 695, 178820. [Google Scholar] [CrossRef]
  27. Wu, Y.; Gao, R.; Yang, J. Prediction of coal and gas outburst: A method based on the BP neural network optimized by GASA. Process Saf. Environ. Prot. 2020, 133, 64–72. [Google Scholar] [CrossRef]
  28. Zhang, J.; Ai, Z.; Guo, L.; Cui, X. Research of Synergy Warning System for Gas Outburst Based on Entropy-Weight Bayesian. Int. J. Comput. Intell. Syst. 2020, 14, 376–385. [Google Scholar] [CrossRef]
  29. Xiao, Y.; Lü, H.; Huang, A.; Deng, J.; Shu, C. A new numerical method to predict the growth temperature of spontaneous combustion of 1/3 coking coal. Appl. Therm. Eng. 2018, 131, 221–229. [Google Scholar] [CrossRef]
  30. Cheng, J.; Qi, C.; Zhang, J. Influences of methane and propane on the explosion characteristics of polymethyl methacrylate and acrylonitrile butadiene styrene dusts. Process Saf. Progress. 2022, 41, 384–394. [Google Scholar] [CrossRef]
  31. Zhao, W.; Wang, K.; Ju, Y. Quantification of the asynchronous gas diffusivity in macro-/micropores using a Nelder-Mead simplex algorithm and its application on predicting desorption-based indexes. Fuel 2023, 332, 126149. [Google Scholar] [CrossRef]
  32. Yang, X.; Wang, X.; Zhou, S. Prediction model of working face hypoxia based on improved generalized regression neural network. J. Min. Sci. Technol. 2019, 4, 434–440. [Google Scholar]
  33. Zhang, Y.; Aslani, F.; Lehane, B. Compressive strength of rubberized concrete: Regression and GA-BPNN approaches using ultrasonic pulse velocity. Constr. Build. Mater. 2021, 307, 124951. [Google Scholar] [CrossRef]
  34. Lei, C.; Deng, J.; Cao, K.; Xiao, Y.; Ma, L.; Wang, W.; Shu, C. A comparison of random forest and support vector machine approaches to predict coal spontaneous combustion in gob. Fuel 2019, 239, 297–311. [Google Scholar] [CrossRef]
  35. Zhan, Y.; Li, J.Q.; Liu, C.; Wang, K.C.P.; Pittenger, D.M.; Musharraf, Z. Effect of aggregate properties on asphalt pavement friction based on random forest analysis. Constr. Build. Mater. 2021, 292, 123467. [Google Scholar] [CrossRef]
  36. Yokoyama, A.; Yamaguchi, N. Comparison between ANN and random forest for leakage current alarm prediction. Energy Rep. 2020, 6, 150–157. [Google Scholar] [CrossRef]
  37. Lei, C.; Deng, J.; Cao, K.; Ma, L.; Xiao, Y.; Ren, L. A random forest approach for predicting coal spontaneous combustion. Fuel 2018, 223, 63–73. [Google Scholar] [CrossRef]
  38. Montes, C.; Kapelan, Z.; Saldarriaga, J. Predicting non-deposition sediment transport in sewer pipes using Random forest. Water Res. 2021, 189, 116639. [Google Scholar] [CrossRef]
  39. Zhu, W.; Rad, H.N.; Hasanipanah, M. A chaos recurrent ANFIS optimized by PSO to predict ground vibration generated in rock blasting. Appl. Soft Comput. 2021, 108, 107434. [Google Scholar] [CrossRef]
  40. Ewees, A.A.; Al-qaness, M.A.A.; Elaziz, M.A. Enhanced salp swarm algorithm based on firefly algorithm for unrelated parallel machine scheduling with setup times. Appl. Math. Model. 2021, 94, 285–305. [Google Scholar] [CrossRef]
  41. Zhang, Y.; Chen, X.; Lv, D.; Zhang, Y. Optimization of urban heat effect mitigation based on multi-type ant colony algorithm. Appl. Soft Comput. 2021, 112, 107758. [Google Scholar] [CrossRef]
  42. Motlagh, A.A.; Shabakhty, N.; Kaveh, A. Design optimization of jacket offshore platform considering fatigue damage using Genetic Algorithm. Ocean Eng. 2021, 227, 108869. [Google Scholar] [CrossRef]
  43. Bai, J.; Liu, T.; Wang, Z.; Lin, Q.; Cong, Q.; Wang, Y.; Bu, G. Determining the best practice—Optimal designs of composite helical structures using Genetic Algorithms. Compos. Struct. 2021, 268, 113982. [Google Scholar] [CrossRef]
  44. Wei, Y.; Liu, L.; Yu, D.; Hellermann, M.; Chen, W.; Wang, J.; He, X. Analysis of HL-2A charge exchange spectra using parallel genetic algorithm. Fusion Eng. Des. 2021, 168, 112680. [Google Scholar] [CrossRef]
  45. Ju, J.F.; Xu, J.L.; Zhu, W.B. Longwall chock sudden closure incident below coal pillar of adjacent upper mined coal seam under shallow cover in the Shendong coalfield. Int. J. Rock Mech. Min. Sci. 2015, 77, 192–201. [Google Scholar] [CrossRef]
  46. Ryzin, J.V.; Breiman, L.; Friedman, J.H.; Olshen, R.A.; Stone, C.J. Classification and Regression Trees. J. Am. Stat. Assoc. 1986, 81, 253. [Google Scholar] [CrossRef]
  47. Breiman, L. Bagging predictors. Mach. Learn. Arch. 1996, 24, 123. [Google Scholar] [CrossRef] [Green Version]
  48. Ibrahim, I.A.; Khatib, T. A novel hybrid model for hourly global solar radiation prediction using random forests technique and firefly algorithm. Energy Convers. Manag. 2017, 138, 413–425. [Google Scholar] [CrossRef]
  49. Liaw, A.; Wiener, M. Classification and Regression by randomForest. R News 2001, 2, 18–22. [Google Scholar]
  50. MATLAB. TreeBagger. Mathworks. 2016. Available online: https://www.mathworks.com/help/stats/treebagger.html (accessed on 28 August 2016).
Figure 1. Three-dimensional schematic diagram of 22104 working face.
Applsci 13 02538 g001
Figure 2. Regular of gas generation by oxidation heating of residual coal.
Applsci 13 02538 g002
Figure 3. Diurnal variation data of oxygen concentration in the return airway corner.
Applsci 13 02538 g003
Figure 4. Oxygen concentration in the return airway corner at different pressure step distance.
Applsci 13 02538 g004
Figure 5. Flow chart of RF algorithm.
Applsci 13 02538 g005
Figure 6. GA flow chart.
Applsci 13 02538 g006
Figure 7. Flow chart of random forest mixing model based on GA optimization.
Applsci 13 02538 g007
Figure 8. Layout of linkage data collection.
Applsci 13 02538 g008
Figure 9. Sample data. (a) Oxygen concentration, (b) Surface atmospheric pressure, (c) Surface temperature.
Applsci 13 02538 g009
Figure 10. Importance analysis of input indicators.
Applsci 13 02538 g010
Figure 11. Minimum RMSE fitness fusion characteristic curve based on GA optimized RF parameters.
Applsci 13 02538 g011
Figure 12. Prediction data of oxygen concentration in GA-RF return-air corner.
Applsci 13 02538 g012
Figure 13. MSE(OOB) data under different numbers of leaves.
Applsci 13 02538 g013
Figure 14. The minimum RMSE fitness fusion characteristic curve, based on GA optimized BPNN number of hidden neurons.
Applsci 13 02538 g014
Figure 15. Minimum RMSE fitness fusion characteristic curve based on GA optimized BPNN initial weights and thresholds.
Applsci 13 02538 g015
Figure 16. GA-RF, RF, GA-BPNN, BPNN return air corner oxygen concentration prediction data.
Applsci 13 02538 g016
Figure 17. GA-RF, RF, GA-BPNN, BPNN absolute error percentage box.
Applsci 13 02538 g017
Table 1. Gas analysis of goaf.
PlaceO2 (%)N2 (%)CO (%)CO2 (%)CH4 (%)
Return air corner17.00482.6850.00560.2890.0171
Goaf (25 m)16.59983.0580.00720.3360
Goaf (219 m)8.268691.1030.0050.60390.0193
Goaf (489 m)3.050295.5380.00091.40360.0071
Table 2. Analysis results of coal seam gas components.
No.Sampling LocationsGas Composition
CH4
(%)
CO2
(%)
N2
(%)
112 # coal seamAuxiliary transport roadway (1500 m)4.221.6394.01
3Air return roadway (1570 m)6.560.6092.80
5Auxiliary transport roadway (1750 m)5.722.2592.03
722 # coal seamAir return roadway (1750 m)7.340.8091.81
8Air return roadway (1850 m)6.251.7092.05
9Auxiliary transport roadway (2850 m)5.790.2993.88
Table 3. Internal parameters of GA-RF, RF, GA-BPNN, and BPNN prediction model.
IndexGA-RFRF
Number of trees398500
Number of leaves11
2
3
4
5
IndexGA-BPNNBPNN
Number of hidden neurons913
Initial weight and thresholdOptimizationRandom
Table 4. Numerical Value of Performance Evaluation Index of GA-RF, RF, GA-BPNN and BPNN.
ModelRMSEMAPE (%)MAE
GA-RF0.27131.090.1961
RF (leaf = 1)0.36281.570.2813
RF (leaf = 2)0.37971.620.2895
RF (leaf = 3)0.37871.610.2883
RF (leaf = 4)0.38141.620.2901
RF (leaf = 5)0.38461.640.2942
GA-BPNN0.39411.650.2950
BPNN0.43541.940.3455
Disclaimer/Publisher’s Note: The statements, opinions and data contained in all publications are solely those of the individual author(s) and contributor(s) and not of MDPI and/or the editor(s). MDPI and/or the editor(s) disclaim responsibility for any injury to people or property resulting from any ideas, methods, instructions or products referred to in the content.

