Article

Field Pull-Out Tests of Percussion Driven Earth Anchors (PDEAs)

Department of Civil Engineering, University of Texas at Arlington, Arlington, TX 76019, USA
*
Authors to whom correspondence should be addressed.
Appl. Sci. 2023, 13(4), 2132; https://doi.org/10.3390/app13042132
Submission received: 2 January 2023 / Revised: 27 January 2023 / Accepted: 6 February 2023 / Published: 7 February 2023
(This article belongs to the Special Issue Slope Stability and Earth Retaining Structures)

Abstract

:
Percussion driven earth anchors (PDEAs) are driven into soils using an installation steel hammer rod. PDEAs are relatively easy to install and have gained wide applications recently. The Texas Department of Transportation (TxDOT) planned to use these anchors for slope stability mitigation along the Clear Fork Trinity River at Interstate Highway 20 (IH-20) in Benbrook, Texas. However, there are no straightforward design and construction guidelines for these systems. In addition, the pull-out capacity and failure mechanisms of PDEAs in clayey soils have not been thoroughly studied. In this study, three PDEAs, Duckbill model 138 II (DB-138 II), were installed and tested on the proposed west channel bank slope to acquire the ultimate pull-out capacity. The anchors were embedded to an average depth of 10 feet into the slope bank, predominantly consisting of sandy lean clay (CL) soil. The slope was graded at an average 2:1 to 2.5:1 configuration. After installation, the anchors were subjected to an upward pull-out force using a hydraulic jack system to measure their pull-out capacity. The pull-out load, displacement, and strains were continuously recorded with a load cell, a linear variable differential transformer (LVDT), and a strain gauge, respectively. Pull-out load versus displacement curves were produced and analyzed to determine the behavior of the anchors. An empirical estimation method was then chosen to estimate pull-out capacity based on undrained shear strengths obtained either from laboratory tests or in situ Texas cone penetration (TCP) data. The comparison between estimated and field-obtained pull-out capacities showed that the pull capacity estimated using TCP data resulted in reasonably good agreement with the field-obtained capacity. The field experiment results help us to understand the relationship between the calculated and actual field pull-out resistance when PDEAs are used in clayey soil slopes.

1. Introduction

State Departments of Transportation in the USA, including TxDOT, continuously battle with unforeseen slope failures associated with their infrastructure. Slopes are generally used as a part of roadside safety elements along roadways, bridge abutments, and channel banks. Several methods have been used to treat slopes associated with critical structures to minimize slope stability failures that may cause a safety hazard to the traveling public. TxDOT [1] recommends upper limits on the plasticity index (PI) for exposed side slopes based on different slope conditions to reduce the probability of slides. The agency does not recommend exposed slopes of less than 2.5 to 1. Bridge abutment slopes have been historically treated by concrete riprap. Rock riprap and gabion mattresses have been prevalent slope treatments for channel bank slopes. Rock riprap and gabion mattresses have successfully been used on slopes of 3:1 and flatter. Soil anchors and nails have been widely used to achieve stability of critical steep slopes by providing counter forces to the driving forces that tend to destabilize the slope mass. Channel slopes stabilized by soil anchors have the advantage of maintaining channel flow capability compared to retaining walls such as gabion walls.
The uplift capacity of a vertical buried anchor, also known as the breakout factor, typically comprises the weight of soil within the failure zone and frictional and/or cohesive resistance along the realized failure surface. The required uplift capacity of these systems can be enhanced by increasing the size and embedment depth of the anchor or improving backfill strength and density [2,3,4,5,6,7,8]. According to Kovacs [9], an anchor design depends upon a dimensionless critical depth value of H/B, where H is the depth of the anchor and B is the anchor base width or diameter, depending on the type of anchor. Critical depth defines the depth at which an anchor is classified as deep or shallow.
Extensive research has been performed to improve the assessment of anchor uplift behavior within unreinforced soil, comprising experimental, analytical, and numerical studies. Early research on anchor uplift capacity was conducted under 1 g conditions in stabilizing transmission towers. It was primarily limited to scaled laboratory experiments to demonstrate the effects of shape, embedment, soil conditions, and soil types on anchor resistance [10,11,12,13,14,15]. Centrifuge-based laboratory experiments have been employed to capture better realistic, scaled gravitational conditions assessing uplift capacity [16,17,18]. Theoretical uplift solutions have been developed by using cavity expansion theory [19], limit equilibrium theory [20,21,22,23], reverse hopper theory [24], and elastoplastic continuum analyses [18,25].
Three different experimental studies conducted on anchors’ performance by Kananyan [26] produced three critical depths of 6, 3, and 1.5, respectively. Baker and Konder [27] conducted experiments on sands with circular anchors and inferred that anchors with H/B of above 6 are deep. They found the critical depth based on the shape of the failure surface suggested by Balla [28]. They observed that the pull-out strength of anchors below the critical depth of 6 was very close to the ones calculated by the Balla equation. They also observed, for shallow anchors with a H/B value less than 6, that an upheaval of the ground surface above the anchor was preceded by a curvilinear failure plane. For deep anchors with H/B values over 6, Baker and Konder observed neither a curvilinear failure pattern nor upheaval of the ground surface until the anchors were pulled far enough [9]. Liang et al. [29] also looked at the failure modes of the sand soil during pull-outs of plate anchors and found that when anchors are sufficiently deep, i.e., H/B = 8, the soil exhibits local failure and moves clockwise around the anchor. He also observed that shallow anchors such as H/B = 2 and H/B = 5 generally show a conical failure shape mode during the pull-out of the anchor. Yoshida et al. [30] provided results of field pull-out experiments of actual flip anchors driven into the ground consisting of a top sand layer and a clay layer underneath. Their results indicated that pull-out behavior of flip anchors in clay was quite different from that in the sand. The overburden pressure contributed less to the pull-out force for anchors built in clay than in sand. In summary, previous studies mainly focused on the pull-out behaviors of traditional anchors, both in clay and sand, such as plate and flip anchors. Limited research has been conducted on investigations of the pull-out behavior of percussion-driven earth anchors in clay.
Some anchor manufacturers supply PDEA anchors in different shapes and sizes, including Platipus, Duckbill, and Hulk. However, the usage of these anchor systems is minimal due to the insufficient information on design methodology and performance data as it relates to slope stability applications. Therefore, building an anchor performance database containing different soil conditions for these anchors is necessary to enable engineers to develop and improve the design methodology for such systems. In summary, most theoretical and experimental studies on the pull-out resistance of soil anchors were conducted on circular plates within the sand. Additionally, very limited theoretical and experimental studies exist measuring the performance of deep anchors with a H/D value over 6. In addition, most of the analytical equations derived from the above theoretical and experimental studies could not be directly and fully applied to the deep PDEA studied in this project. Therefore, in this paper, field tests of three PDEA anchors are presented to study the pull-out capacity of PDEA anchors. The relationship between anchor pull-out load and displacement was established and analyzed to determine the behavior of PEDAs during the field pull-out process. Moreover, an existing empirical method was modified by inputting in situ Texas cone penetration (TCP) data to estimate pull-out capacity. The comparison between in situ pull-out and predicted results showed a reasonably good match. This study helped to understand the relationship between the calculated and actual field pull-out resistance when PDEAs are used in clayey soil slopes.

2. Background on PDEA

Percussion driven earth anchors (PDEA) are mechanical soil anchors driven into the soil with desired depth using percussion forces and load-locked by pulling the anchors to the required tension load. PDEAs have recently been widely used for slope stability and other applications in the transportation industry. However, limited information exists on design methodology, including pull-out capacity and performance data of such anchors as it relates to slope stability applications, especially the one used in this study, the DB 138 II PDEA anchor. Typical components of a percussion driven earth anchor (PDEA) are an anchor head with lower termination, wire tendon/rod, and top termination with a top accessory plate. Figure 1 shows the typical PDEA components.
In this study, a DB-138 II anchor was tested in the field to understand the ultimate pull-out resistance of the anchor in low-plasticity sandy lean clay (CL) soil. This was achieved by installing and testing three instrumented PDEA anchor systems on the IH-20 TxDOT project site in Benbrook, Texas. The measured ultimate pull-out resistance is compared with the prediction from the closest design equation developed for non-PDEA anchors. The performance of PDEA anchors, as described by the Platipus Anchors supplier, is shown in Figure 2. In addition, Figure 2 shows the idealized performance anchor response curve according to the Platipus Anchors brochure.

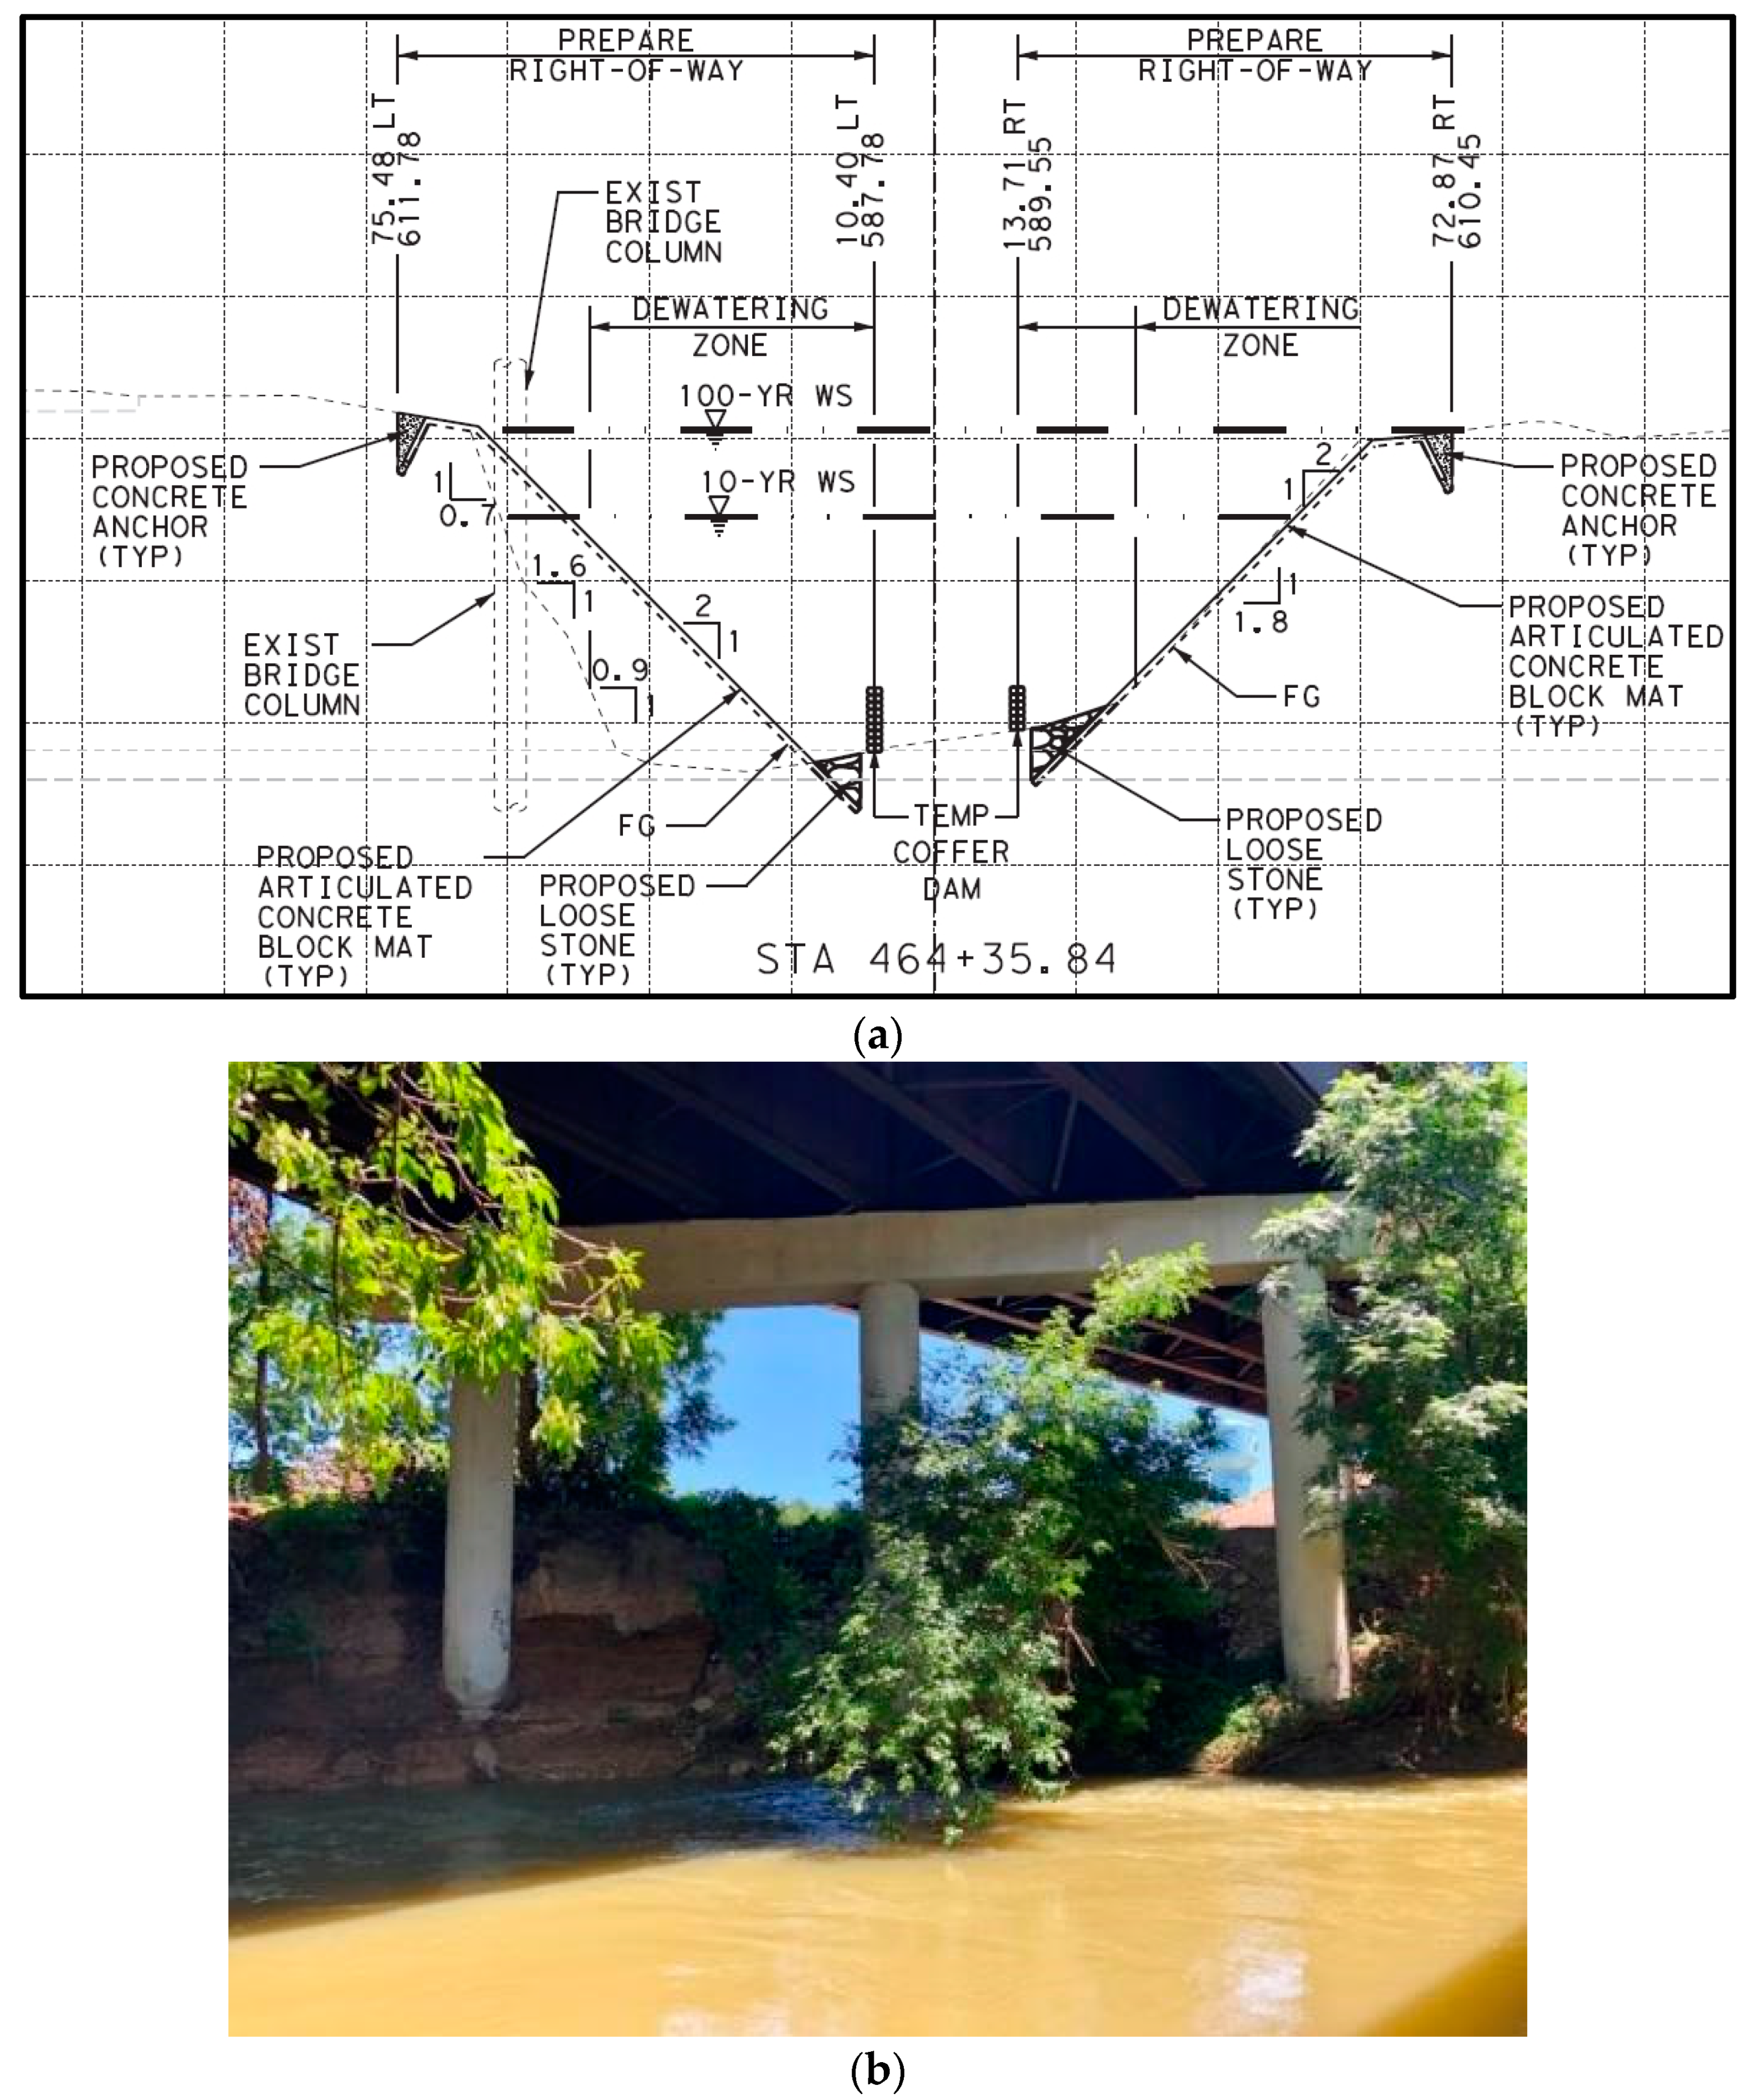
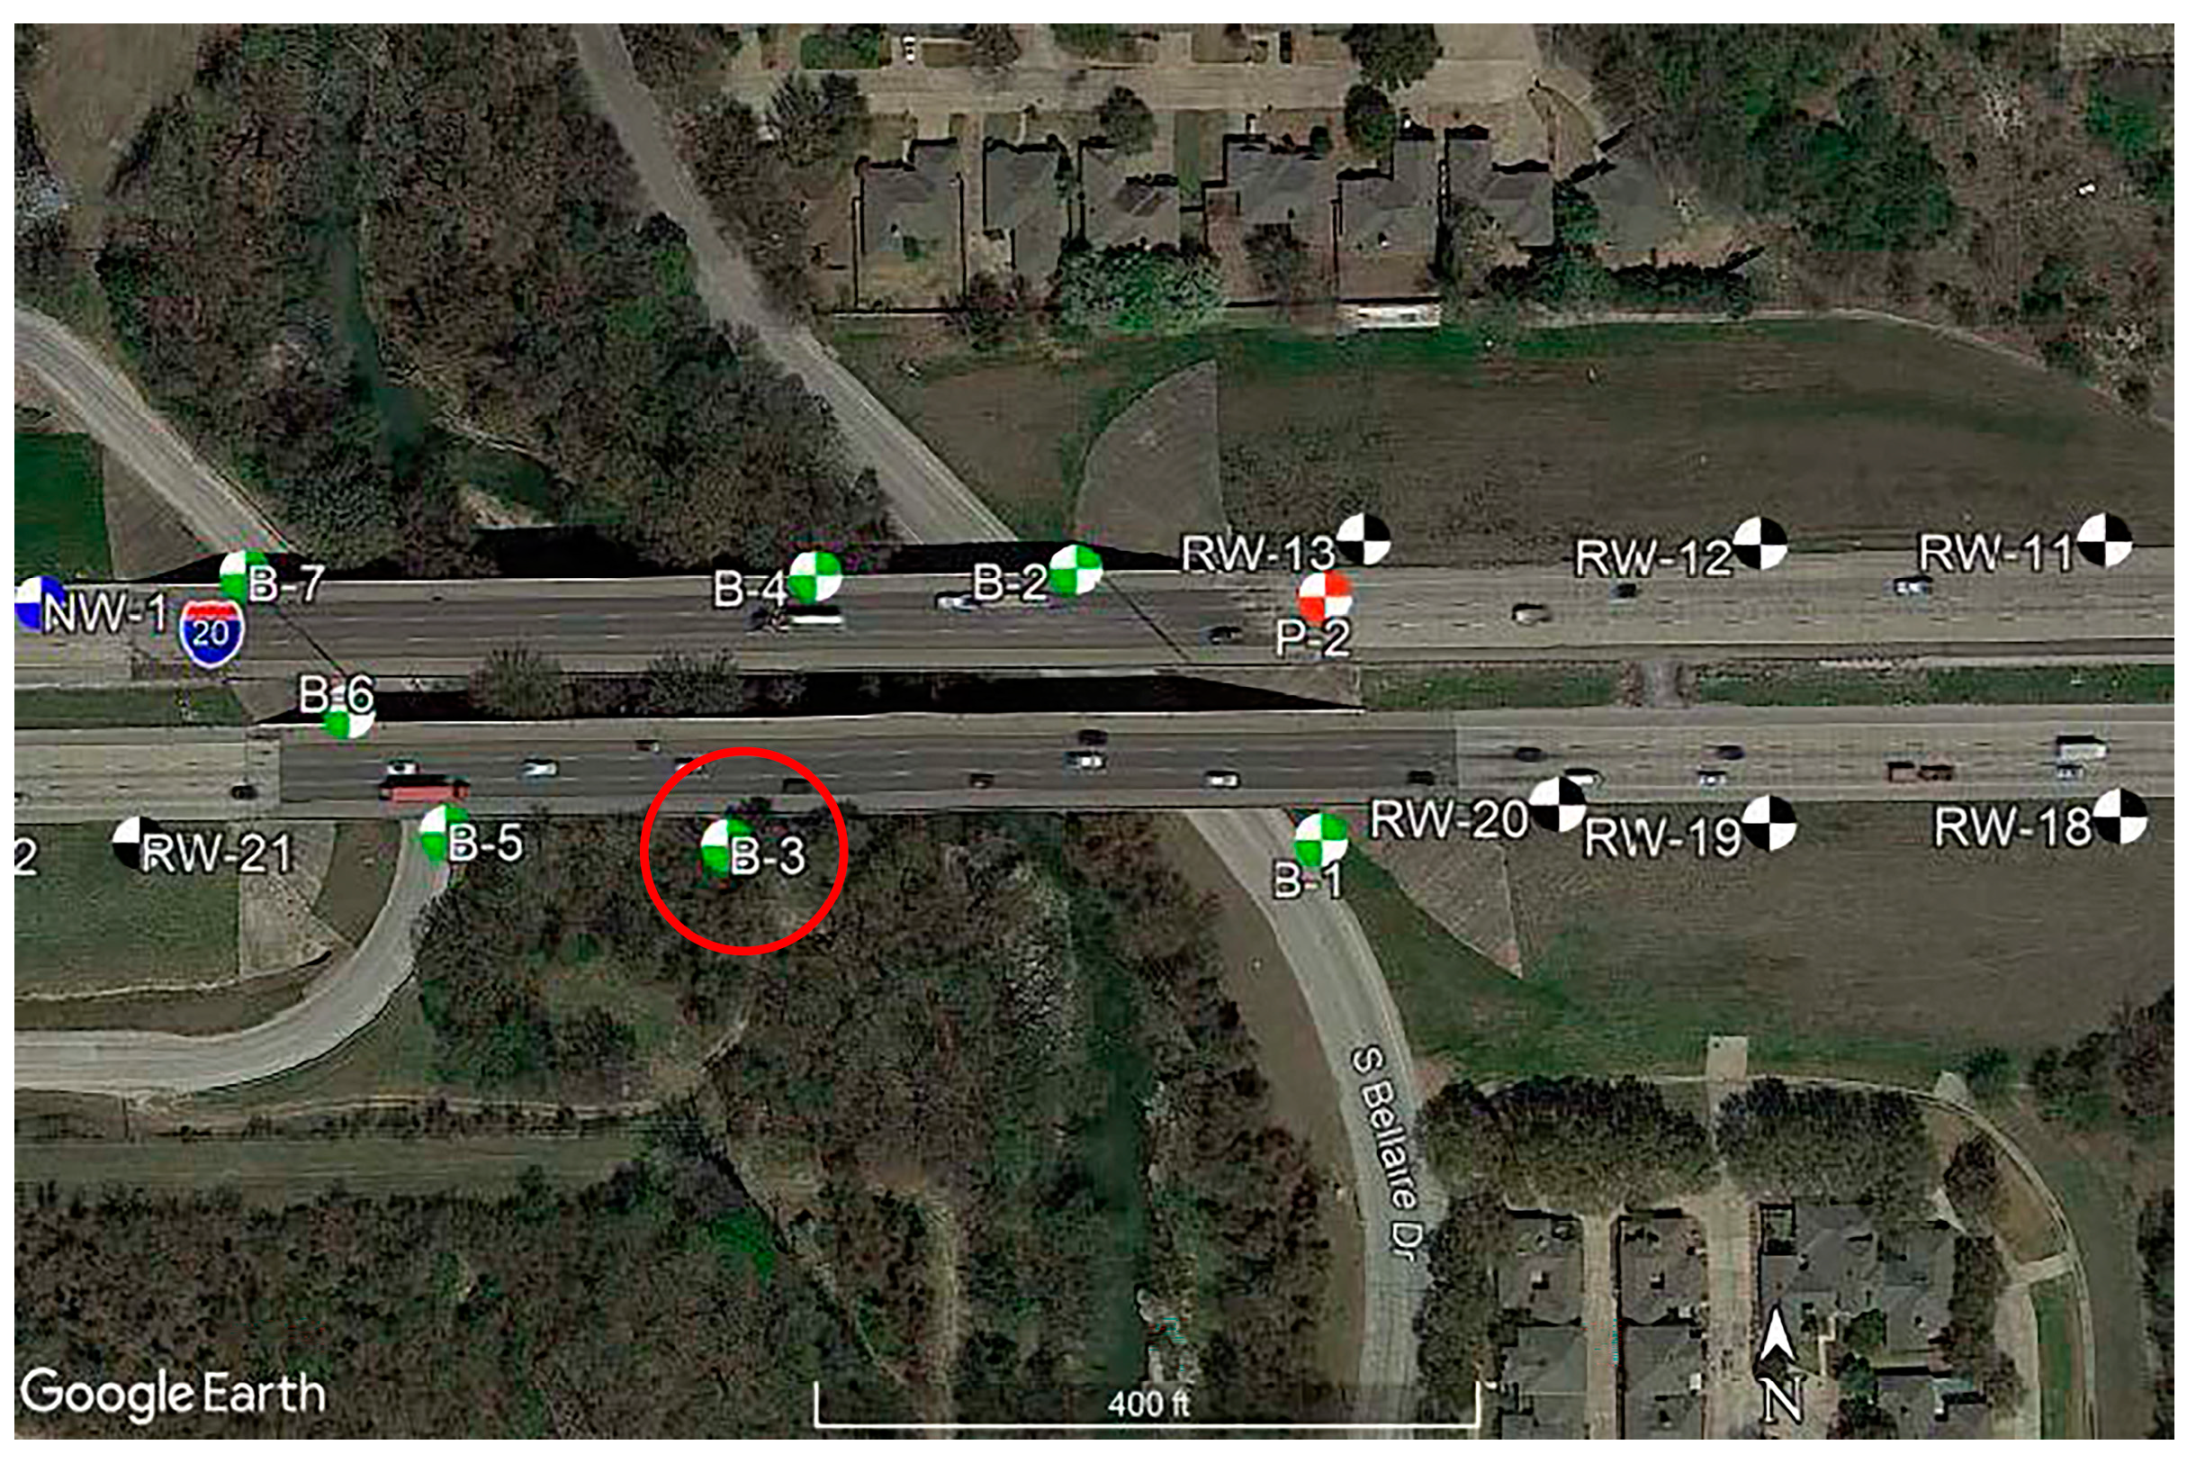
3. Site Conditions and Soil Characterization

The geotechnical soil exploration of the site near the channel slope indicated that the soil in the channel bank is composed predominantly of lean clay (CL) for the top 6 m, underlain by 1.2 m of clayey gravel and weathered limestone layers. Figure 3a illustrates the existing and proposed soil slope configuration of the channel bank slope. The existing west bank slope (dash line), i.e., the right-side bank in Figure 3a, is with a slope ratio of 1.8:1. Figure 3b shows the existing slope conditions after years of erosion and scouring before rebuilding the slope. From preliminary slope stability analysis results, the depth of the critical failure plane was located at 2.1 m with a factor of safety of approximately 1.0, which failed to meet the requirement from TxDOT [1]. Therefore, slope improvement is needed.
In addition, groundwater, encountered at 7.3 m from the top of the ground, has limited effects on the slope stability design. The west bank slope involved in this study was shaped by cutting, scraping, and compacting to a slope ratio of 2:1 for slope treatments. This, in turn, left the slope less disturbed. As a result, the slope was ready to get treated with the PDEA anchors with 4 feet spacing after slope shaping and compaction, as shown in Figure 4. Figure 4a shows the picture of the slope being worked by cutting and moving around the soil to achieve the proposed slope configuration, while Figure 4b shows the completed slope ready to be treated by the PDEA system. With the installation of the PDEA system, the factor of safety of the slope increases by 0.5 from 1.0 to 1.5, meeting the TxDOT’s slope stability requirement.
Figure 5 shows the Geotech borehole map near the vicinity of the west bank. In contrast, borehole B-3 is the closest applicable borehole to characterize the west bank in this study. B-4 is the applicable borehole to characterize the east bank. The boreholes show general soil profile consistency; hence, the whole area is predominantly similar soil with high moisture and gravel pocket variability.
As part of the geotechnical exploration, Texas cone penetration (TCP) tests were taken at 1.5 m intervals, following the TxDOT Designation Tex-132-E, ‘Test Procedure for Texas Cone Penetration’ [1]. The summary of TCP results, along with TCP boring log of borehole 3, are shown in Figure 6.
Laboratory testing was performed to obtain basic soil properties. In addition, bulk soil samples were collected from the west bank soil slope of the Clear Fork Trinity River. Laboratory tests were performed for Atterberg limits [32], particle size distribution [33], maximum dry density and optimum moisture content [34], specific gravity [35], and unconfined shear strength (UCS test) [36]. The test results are summarized in Table 1.
Moreover, the electrical resistivity imaging (ERI) method was utilized to map the proposed slope. The result indicated that the slope embankment is composed of dry and moist stiff clay with high moisture variability, as shown in Figure 7. Basic Geotech exploration was completed, including Texas cone penetration (TCP). The results from the TCP and the laboratory tests were consistent regarding the basic soil parameters and shear strength parameters. The undrained cohesion (Cu) based on the TCP in borehole B-3 was found to be 46.2 kN/m2 by using the design chart recommended by TxDOT [1]. However, the Cu in nearby boreholes, such as B-6 and B-4, exhibit a Cu value of 51.7 kN/m2 and 126.2 kN/m2, respectively, showing considerable variability in the same area.

4. Field Pull-Out Test Program

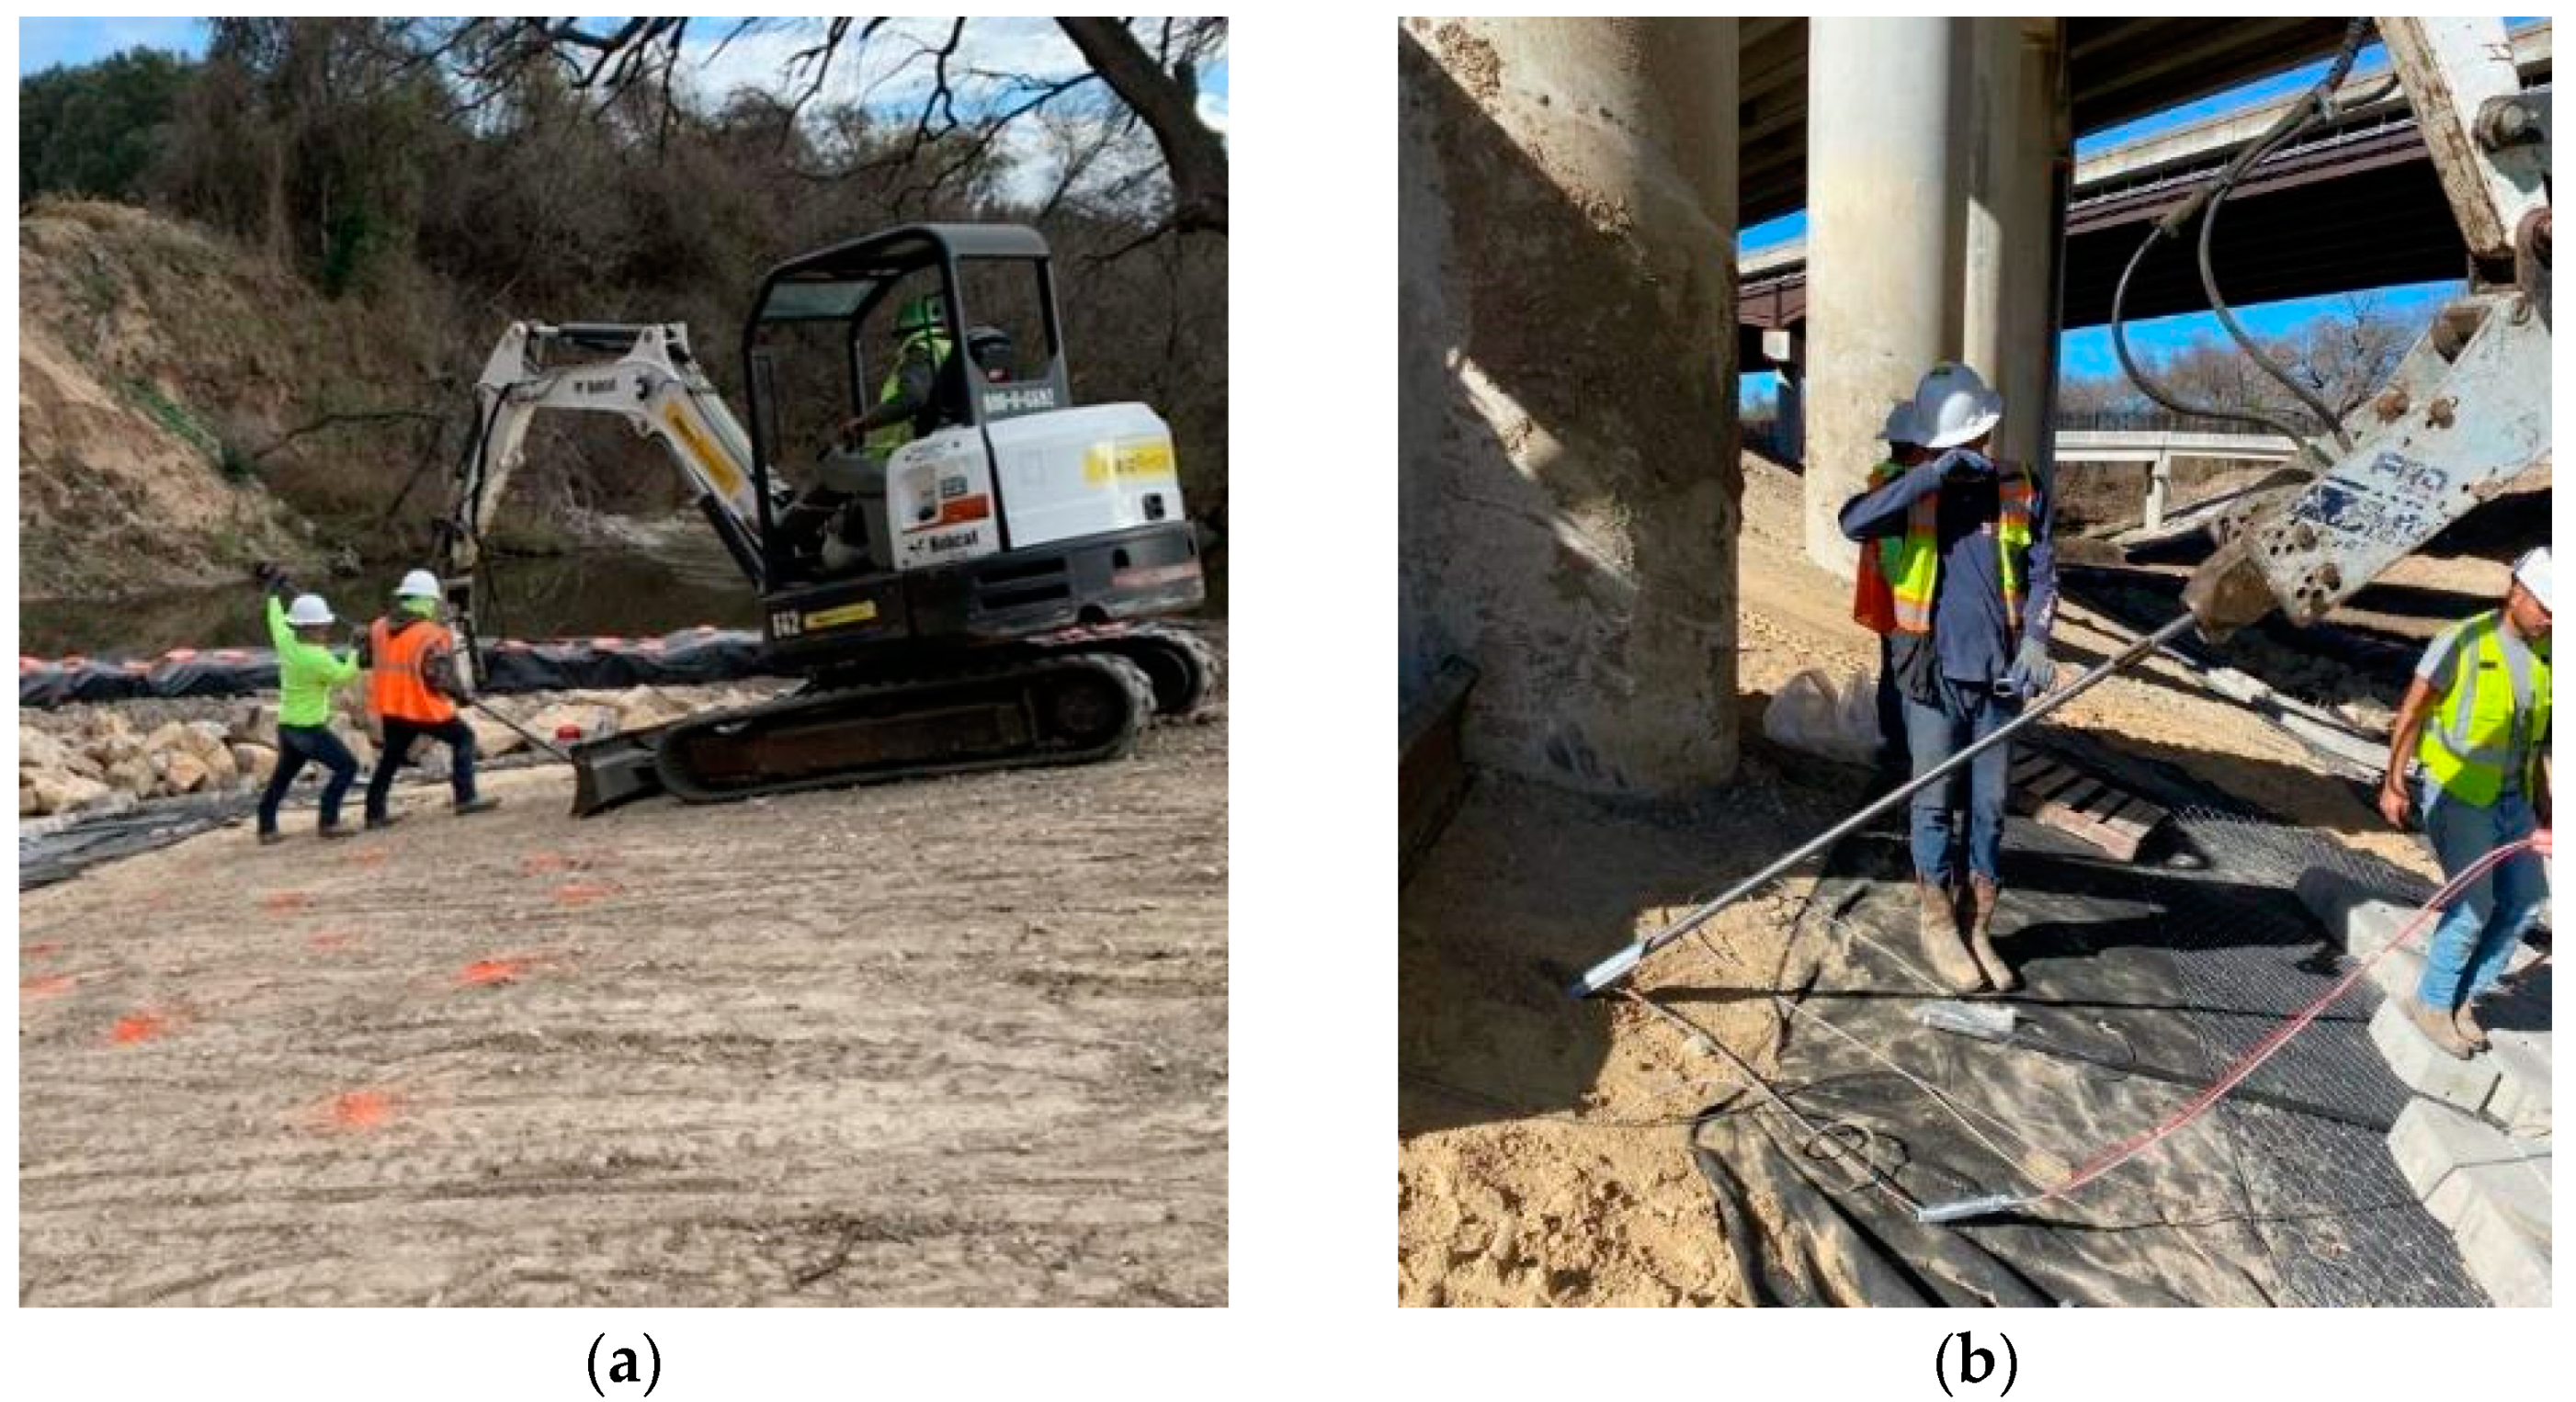
4.1. Installation of PDEA Anchors

Three DB 138 II PDEA anchors paired with stainless-steel wire tendons of a diameter of 6.35 mm were installed in three locations on the west bank and tested in this study. The tendons were secured using copper sleeve wire stops. Figure 8 shows the anchor used for this test.
The PDEA anchors were driven into the slope using a driving rod and a mini excavator with a hammer attachment. Once the desired depth had been reached, or the anchor encountered a rocky or hard layer and could not be pushed anymore, the driving ceased. During the field installation of the PDEA anchors, the anchors could not be hammered more than 3 m, as they encountered stiff soil layers such as gravel and weathered limestone. Even though the anchors were designed to be embedded 4.6 m perpendicular to the slope, the majority of anchors did not achieve the design depth, but did achieve an average embedment of 3–3.7 m due to the abundance of gravel and rock in the soil. This phenomenon can also be observed from the ERI results in Figure 7. Figure 9 shows the driving of PDEA anchors using a mini-excavator and a hammer attachment.

4.2. Instrumentation and Test Method

After the PDEA was hammered to the desired depth or was terminated due to refusal, comprehensive instrumentations were carried out for the field pull-out test to measure the anchor performance during testing. Figure 10 illustrates the setup and components of the field pull-out test. Figure 11 shows the process of driving the PDEA anchors and testing them for pull-out resistance. The anchor head was hammered perpendicular to the surface using a percussion force using an attached hammering rod that would later be taken out once the desired depth had been achieved (Figure 11a). The anchor was then pulled, rotated, and tensioned by applying a tensile load against the anchor (Figure 11b,c). An aluminum hollow plunger hydraulic cylinder (ENERPAC RACH206, 229 KN Capacity, 150 mm Stroke, Enerpac, Columbus, WI, USA) was used to transfer the load from the hydraulic hand pump (ENERPAC P392, Enerpac, Columbus, WI, USA) to the soil tendon (PDEA). A plunger was used to mobilize the cable in the PDEA system. The anchor displacement during the pull-out test was obtained via a displacement transducer (GEOKON Model 1450-6, GEOKON, Lebanon, NH, USA). A donut-type load cell (Transducer Techniques THC-7.5K-V, Temecula, CA, USA) was utilized to measure the pull-out load applied to the PDEA during the test. Strain gauges (Model 4151 Miniature Strain Gauge, GEOKON, Lebanon, NH, USA) were used to measure the strain of the tendon as a secondary data source for the load cell. Finally, the anchor was load-locked by using a top termination plate and grip system at a specified working condition (Figure 11d).

5. Results and Analysis

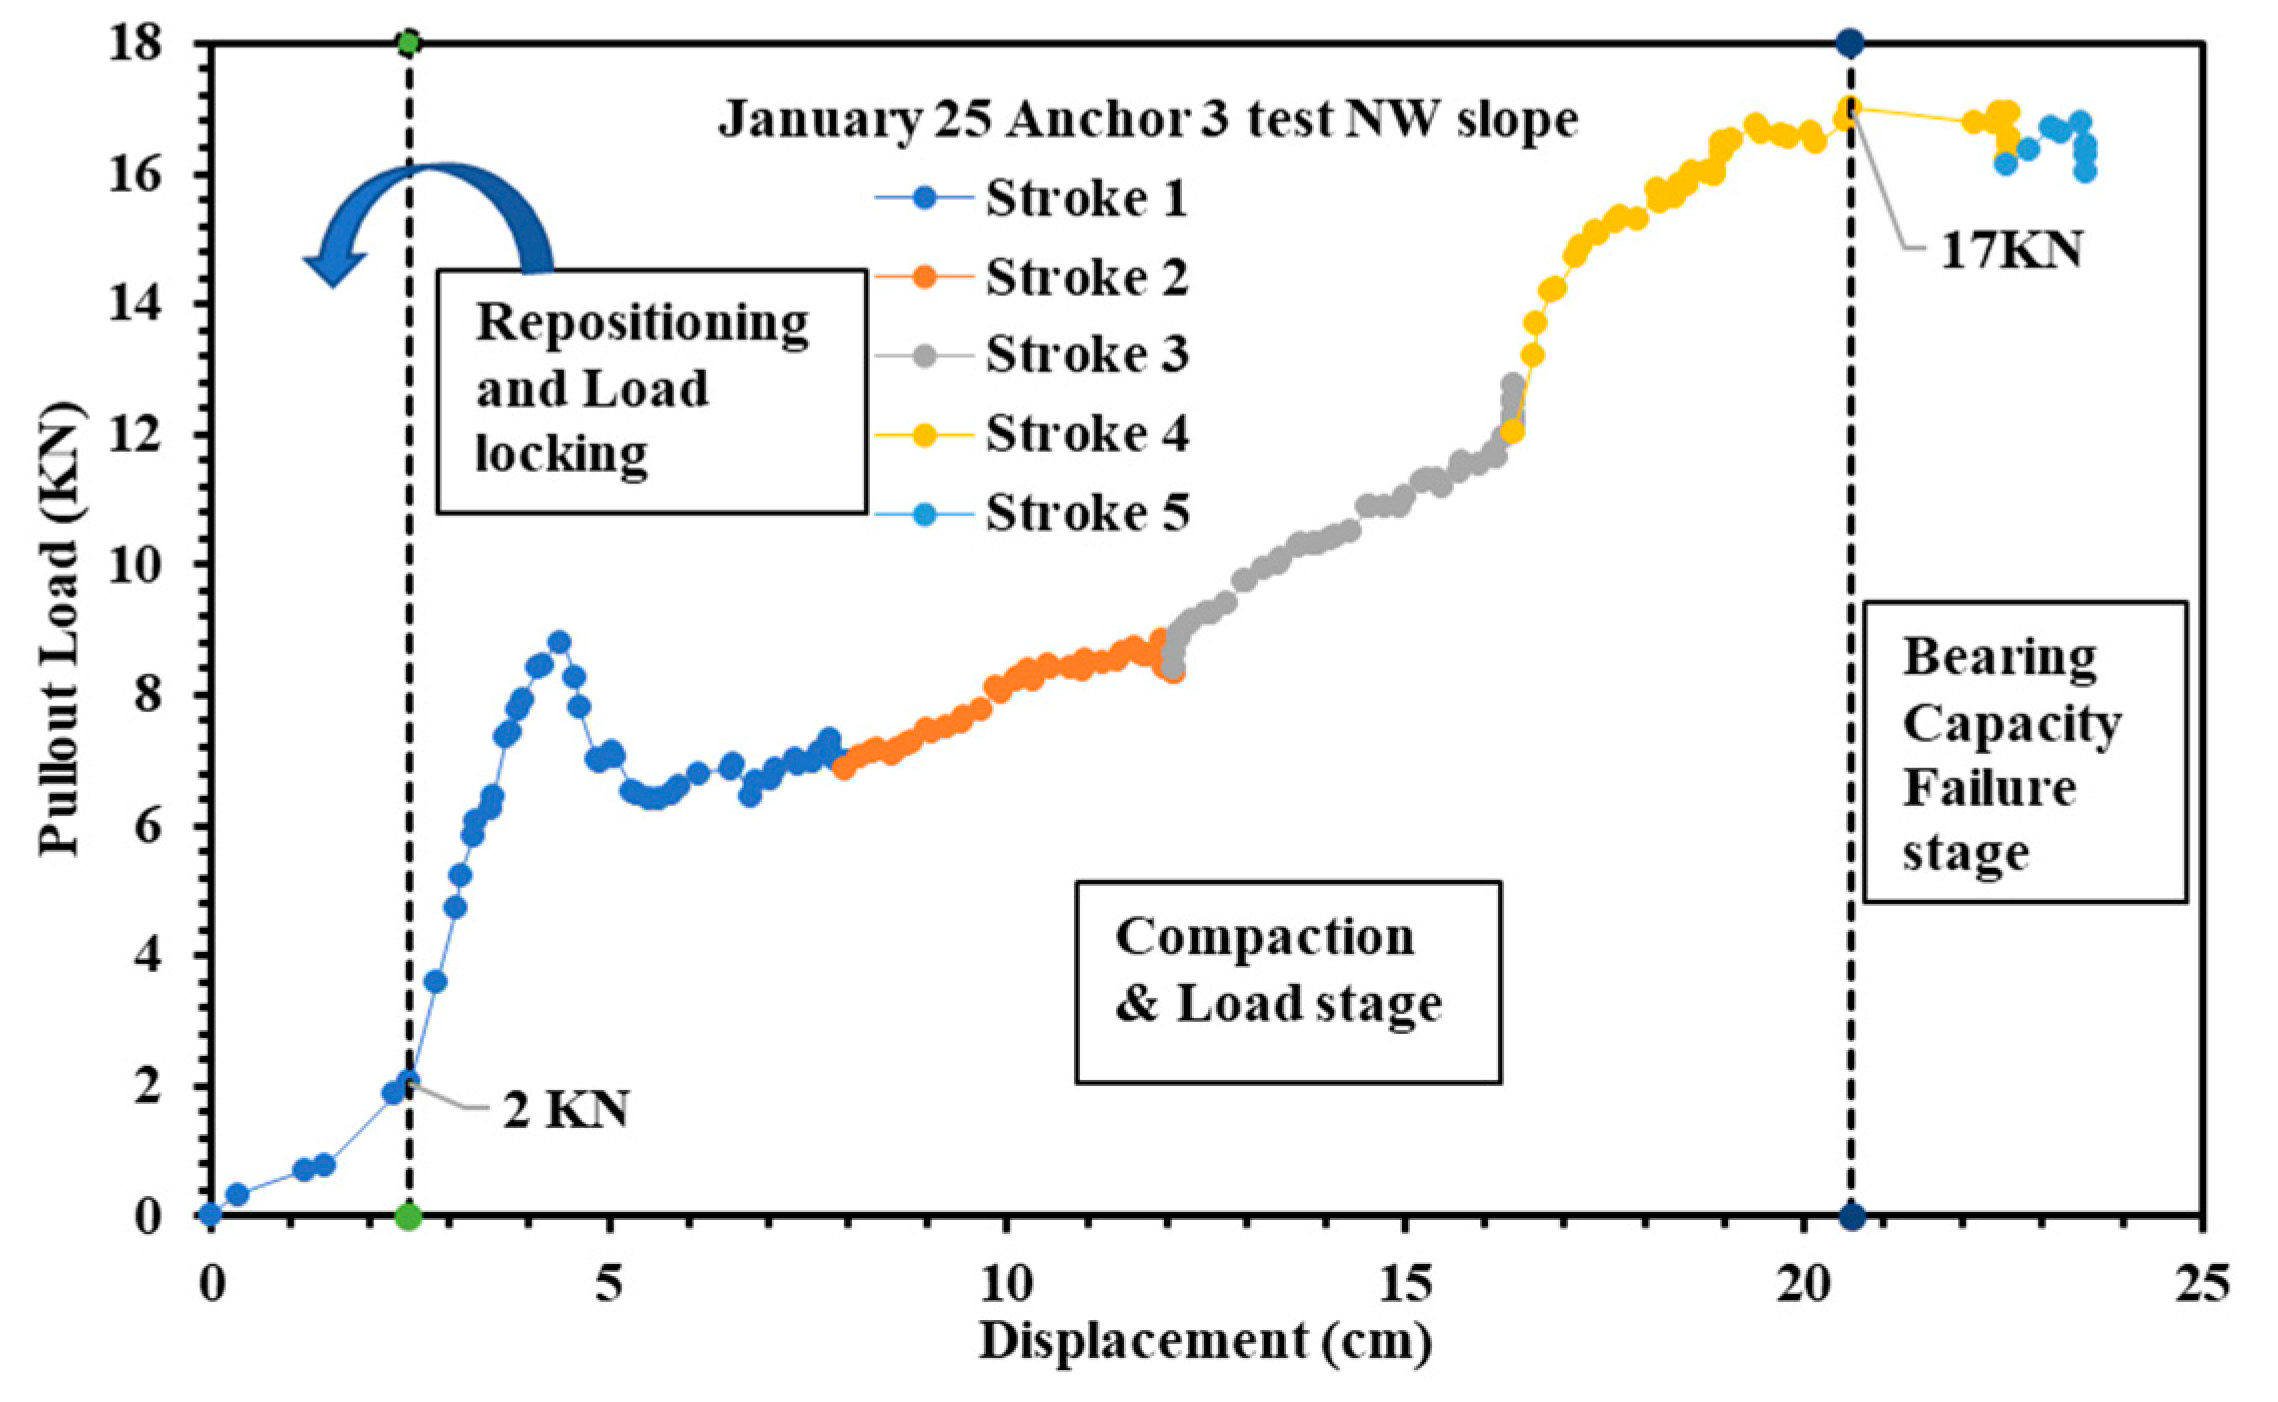
5.1. Field Pull-Out Test Results

According to Platipus Anchors Brochure [31], the load–displacement curve for the pull-out test typically goes through three major stages. The first stage is the repositioning and load-locking stage, where the anchor repositions to a horizontal position when subjected to pull-out loads. This stage typically occurs at lower loads of up to 2.2 kN, as observed in this study. The second stage of the pull-out test includes more loading and compaction of soil above the anchor. This stage produces high resistance while the anchor is subjected to pull-out loads. This second stage continues until the anchor reaches the ultimate resistance based on the soil conditions. In practice, the working load usually lies in this stage close to 75% of the ultimate resistance. The third and last stage brings the anchor to failure by bearing capacity due to the strength of the soil with respect to the anchor type.
For this study, the anchor pull-out tests were plotted based on the load and displacements measured using the load cell and LVDT, respectively. Four field pull-out tests were employed on the west slope. The performance of each anchor was evaluated in different field conditions. Table 2 summarizes pull-out test results, including the maximum pull-out load and displacement for each tested anchor. One of the anchors, anchor 3, was installed and tested near the northwest quadrant of the channel bank slope. It was subjected to pull-out force until the maximum pull-out resistance was achieved. This anchor was tested in five loading strokes.
Additionally, this anchor testing was used as an example to illustrate the behavior of each stroke and the stroke combination process. Figure 12 and Figure 13 depict each stroke’s load, displacement response, and the combined stroke curve. The first stroke, shown in Figure 12, subjected the anchor to repositioning and load locking. Then, the anchor shifted to the compaction and loading stage at around 2 kN load and stayed in that stage. The maximum load achieved by stroke 1 was 8.79 kN over 7.6 cm displacement. The second stroke experienced the compaction and loading phase and reached a maximum load of 8.8 kN over 7 cm displacement. The behavior of the anchor during the third stroke was similar to that in the second stroke, except that the third stroke achieved a higher load over a smaller displacement (12.76 kN over 5.6 cm displacement). Figure 12 also shows that the fourth stroke experienced the compaction phase and reached the ultimate pull-out strength of 17 kN over the 9 cm displacement. This stroke also showed that as the load decreased from the ultimate value, it experienced bearing capacity failure. In the last stroke of this test, stroke 5 regained the load up to around stroke 4′s last load and then continued to decrease toward failure.
The individual strokes were further processed to be merged into one continuous anchor-response pull-out curve to obtain the ultimate load and the corresponding maximum displacement. The curves for each stroke were combined using the following process. Stroke 1′s curve was held as the foundation of the combined curve and kept the same as the original shown in Figure 13. The curve from stroke 2 was shifted to the left until it reached stroke 1′s curve. The data from stroke 2 that were lower than the maximum displacement of stroke 1 were omitted. This process was repeated for all strokes to produce one continuous anchor-response load–displacement curve. Figure 12 illustrates the combined force-versus-displacement graph for the anchor 3 pull-out test. The ultimate pull-out resistance and corresponding maximum displacement from this test were found to be Pult = 17 kN and 20.6 cm, respectively.
Anchor 2 was tested twice to reach the ultimate pull-out strength. Figure 14 and Figure 15 show that the first test brought the anchor into the compaction and loading stage, while the second test brought the anchor through ultimate load and bearing capacity failure. Even though no sharp drop occurred after the ultimate load, the load remained relatively constant as displacement increased, indicating that the anchor had already reached the ultimate load.
Figure 16 shows the anchor pull-out test results for anchor 1. This anchor was the first that was installed in the southwest area of the west channel bank. This anchor was subjected to pull-out force using field mini-excavator equipment for repositioning, and hence already went through the reposition and locking stage before testing. Then, the pull-out test was performed to determine the maximum pull-out load using the hydraulic jack system. This anchor exhibited a load of 13.17 kN over a 2.85 cm displacement.

5.2. Prediction of Ultimate Pull-Out Load

Typical failure modes for shallow and deep anchors in sandy soil have been developed in previous studies. However, to the author’s knowledge, soil failure patterns from PDEA anchors embedded in clayey soil have not been well studied. In this study, there was not a defined failure pattern for anchors installed 3 m into the channel bank slope.
Existing methods available to estimate the ultimate pull-out of anchors in clayey soils have been examined throughout the literature review. An equation was identified for assessing the pull-out capacity of rectangular plates using the soil’s shape factors, weight factors, and undrained shear strength parameters. The following Equation (1) was suggested by Das 1980 [38] for deep anchors in clayey soils. The equation was developed based on an α β parameter curve derived from experimental pull-out test results and using the breakout factor (Fc) with respect to embedment ratio, developed by Das, 1978 [39]. Per Das, the α value is the ratio of embedment ratio to critical embedment ratio, (H/B)/(H/B) cr, and the β value is the corresponding breakout factor ratio, Fc/Fc*. The equation is shown below as Equation (1). Equation (1) was used to calculate the maximum pull-out resistance, Qo.
Q o = BL   { [ 7.56 + 1.44 ( L B ) ]   C u + γ H } ;   Q u = Q o + W f
In Equation (1), B (cm) is the width of the anchor, L (cm) is the length of the anchor, Cu (kN/m2) is the representative undrained cohesion value of the soil, γ   (kN/m3) is the unit weight of the soil, H (m) is the depth of the anchor, Q u (kN/m3) is the ultimate pull-out resistance, and W f (kN) is the self-weight of the anchor itself. W f (kN) can reasonably be ignored for small anchors as the self-weight effect is negligible.
For this study, the anchor was approximated as a rectangular plate anchor to utilize the existing pull-out capacity estimation techniques from previous studies. The following values are used in the pull-out capacity estimation calculation: L = 30.5 cm, B = 6.4 cm, Cu = 29.3 kN/m2, H = 3 m, and γ = 19.6 kN/m3. The half of the unconfined compressive strength from Table 1 was used as the undrained shear strength Cu. The ultimate pull-out capacity calculated based on this equation was 9.23 kN. This study’s three field pull-out tests found the maximum experimental field pull-out resistance to be in the 13.2 kN to 17 kN range. The average TCP-N number was utilized to obtain Cu values based on the correlation suggested by TxDOT, as shown in Equation (2). Another set of calculations was performed based on Cu values 46.2 kN/m2 from TCP data in the boring logs. The estimated Pu values were 13.8 kN. Figure 7 indicates strong spatial variabilities of soils, for example, moisture content, within the slope embankment. This nonuniformity results in different TCP-N values at different locations, generating different correlated Cu values. In addition, the laboratory Cu values were obtained using UCS test based on soil optimum moisture content. This also results in errors when utilizing Equation (1) to estimate ultimate pullout resistance, since the equation was developed for saturated clay. Table 3 tabulates the pull-out load obtained from field and laboratory and TCP data through Equation (1). The field pull-out test showed higher pull-out resistance by an average of 37% than the predicted value from empirical Equation (1) using Cu values generated by the laboratory test. In addition, based on the Cu values found from the in-situ TCP values, the estimated ultimate pull-out load is much closer to the pull-out test results, with only an 8% average variation. Hence, the equation is a good estimation tool and is more reliable based on Cu values from in-situ TCP values, especially if the slope is in a cut condition, like the one in this study.
C u = 3.575 N ,   N   i s   t h e   n u m b e r   o f   b l o w s / 30   cm

6. Discussion

Load variations among different anchors were attributed to the type of soil encountered at the anchor depth. It was observed that during installation, the rate at which the anchors were driven was associated with the ultimate pull-out capacity measured during field tests. Anchors 1 and 2 were driven at a relatively faster rate than anchor 3; hence, the associated field pull-out test showed a higher load for anchor 3 than for anchors 1 and 2. Additionally, compared to anchor 3, anchors 1 and 2 might be installed close to or within the moist zone since the two anchors’ locations are near the middle of the slope. Moreover, it can be inferred and confirmed from the ERI resistivity images that anchors 1 and 2 were installed in the highly moist zone. In contrast, anchor 3 was installed in a dry, stiff, granular soil pocket area. During the installation of the anchors, the contractor went through different equipment trials to determine the most efficient way to install these anchors. It was observed that the most effective way to install this type of PDEA anchor was by using mini-excavators with hollow hammer attachments and malleable steel hammering rods, along with experienced equipment operators that have performed similar work.
The load-locking method used by the contractor utilized a mini-excavator along with a load reader to pull the anchor tendons until the desired locking load. After achieving the desired loading, the contractor locked the top termination using a manual button crimping tool. This method has limitations in that it does tend to leave some slack during crimping, and the slack causes the final locking load to be lower than the expected value. One obvious limitation of the PDEA anchors observed in this study’s site work was that the PDEA system is a great candidate where there is no high variability of soil stiffness and the existence of high gravel, rocks, and limestone layers. Therefore, this system is ideal for medium-stiffness clay materials.
The prediction equation’s limitation is that it does not consider the high variability in soil stiffness and the existence of gravel, rock, and sand seams in real-time conditions. However, this is a global challenge, as most geotechnical theories assume idealized conditions. It is recommended to use the in situ TCP values, especially for cut conditions, to minimize the limitations of this empirical equation and improve the accuracy of predicting PEDAs’ ultimate pull-out load.

7. Summary and Conclusions

In this study, the pull-out behavior of percussion driven earth anchors (PEDAs) in clayey soils was investigated by conducting both field and laboratory tests. The anchors were field-tested after being installed in lean silty clay (CL), the type of soil dominant on the project site. The anchors were installed around 3 m into the slope and were subject to field pull-out tests. The maximum experimental field pull-out resistance was found to be in the range of 13.2 kN to 17 kN. The variation was due to the strong spatially variabilities of soils, for example, moisture content, within the slope embankment. Additionally, an empirical equation was used to estimate the ultimate pull-out capacity based on the undrained shear strength obtained from laboratory and in situ TCP test data. Compared to the field maximum pull-out load, the pull-out resistance estimated by empirical equation 1 using laboratory-acquired Cu values is an average of 37% lower, while based on the Cu values found from the in situ TCP values, the estimated ultimate pull-out load is much closer to the pull-out test results, with only an 8% average variation. Therefore, the prediction equation is promising for estimating the pull-out capacity, but is highly affected by the accuracy of the shear strength value of the soil. Even though a considerable discrepancy exists between the calculated and experimental pull-out resistance, the equation can help estimate field pull-out strength during the planning stage. Moreover, it is recommended that the field pull-out test methodology be further refined and more field pull-out tests be performed in different conditions to develop an accurate empirical model to estimate the ultimate pull-out resistance of these types of anchors. In addition, future studies on the size effects of anchors on the pull-out behavior need to be performed. The failure modes for these anchors in clayey soils also need to be studied further.

Author Contributions

Conceptualization, X.Y. and L.H.; methodology, X.Y., L.H. and G.L.; validation, X.Y., N.T.A. and G.L.; formal analysis, X.Y., N.T.A. and G.L.; investigation, N.T.A., M.A., A.P. and G.L.; data curation, N.T.A., M.A. and A.P.; writing—original draft preparation, N.T.A.; writing—review and editing, X.Y. and G.L.; visualization, N.T.A. and G.L.; supervision, X.Y.; project administration, X.Y., L.H. and G.L.; funding acquisition, X.Y. and L.H. All authors have read and agreed to the published version of the manuscript.

Funding

This research was funded by the Texas Department of Transportation: 02-0XXIA001.

Institutional Review Board Statement

Not applicable.

Informed Consent Statement

Not applicable.

Data Availability Statement

Not applicable.

Acknowledgments

This study was supported by TxDOT as part of the performance measurement of these types of anchors. The authors are grateful for the support and assistance received from the agency.

Conflicts of Interest

The authors declare no conflict of interest.

References

  1. Texas Department of Transportation. Geotechnical Manual; Texas Department of Transportation: Austin, TX, USA, 2000.
  2. Khan, A.J.; Mostofa, G.; Jadid, R. Pullout resistance of concrete anchor block embedded in cohesionless soil. Geomech. Eng. 2017, 12, 675–688. [Google Scholar] [CrossRef]
  3. Moayedi, H.; Mosallanezhad, M. Uplift resistance of belled and multi-belled piles in loose sand. Measurement 2017, 109, 346–353. [Google Scholar] [CrossRef]
  4. Shin, J.; Kim, J.; Chang, H.-J. Anchor plate effect on the breakout capacity in tension for thin-walled concrete panels. Eng. Struct. 2016, 106, 147–153. [Google Scholar] [CrossRef]
  5. Eskandarinejad, A. Seismic vertical uplift capacity of horizontal strip anchors embedded in sand adjacent to slopes using finite element limit analysis. Arab. J. Geosci. 2022, 15, 16. [Google Scholar] [CrossRef]
  6. Fan, C.-C.; Lu, J.Z.; Chen, H.H. The pullout resistance of plant roots in the field at different soil water conditions and root geometries. CATENA 2021, 207, 105593. [Google Scholar] [CrossRef]
  7. Guan, J.; Zhongju, F.; Zhao, R.; Zhangzhengxu, Z.; Wen, J. Unload Pull-out Test of Full-length Grouted Bolts in Slope Reconstruction and Expansion. J. Eng. Technol. Sci. 2021, 53, 302–315. [Google Scholar] [CrossRef]
  8. Jiang, X.; Qian, Y.; Yang, H.; Xiao, Z.; Fan, W.; Zhu, Y.; Liu, W.; Guo, J. Model Test Studies on Slope Supported by Bamboo Anchor and Timber Frame Beam. Geotech. Geol. Eng. 2022, 40, 4327–4344. [Google Scholar] [CrossRef]
  9. Kovacs, A.; Blouin, S.; McKelvy, B.; Colligan, H. On the Theory of Ground Anchors; Defense Technical Information Center: Fort Belvoir, VA, USA, 1975.
  10. Tian, Y.; Gaudin, C.; Cassidy, M.J. Improving Plate Anchor Design with a Keying Flap. J. Geotech. Geoenviron. Eng. 2014, 140, 04014009. [Google Scholar] [CrossRef]
  11. Wang, D.; O’Loughlin, C.D. Numerical study of pull-out capacities of dynamically embedded plate anchors. Can. Geotech. J. 2014, 51, 1263–1272. [Google Scholar] [CrossRef]
  12. Dash, S.K.; Choudhary, A.K. Geocell reinforcement for performance improvement of vertical plate anchors in sand. Geotext. Geomembr. 2018, 46, 214–225. [Google Scholar] [CrossRef]
  13. Zhou, C.; Ma, W.; Sui, W. Transparent soil model test of a landslide with umbrella-shaped anchors and different slope angles in response to rapid drawdown. Eng. Geol. 2022, 307, 106765. [Google Scholar] [CrossRef]
  14. Wang, W.; Sun, S.; Wei, J.; Yu, Y.; He, W.; Song, J. Numerical experimental study on optimum design of anchorage system for Xiashu loess slope. J. Cent. South Univ. 2021, 28, 2843–2856. [Google Scholar] [CrossRef]
  15. Maleki, A.; Lajevardi, S.H.; Briançon, L.; Nayeri, A.; Saba, H. Experimental study on the L-shaped anchorage capacity of the geogrid by the pullout test. Geotext. Geomembr. 2021, 49, 1046–1057. [Google Scholar] [CrossRef]
  16. Dickin, E.A. Uplift Behavior of Horizontal Anchor Plates in Sand. J. Geotech. Engrg. 1988, 114, 1300–1317. [Google Scholar] [CrossRef]
  17. Dickin, E.A.; Leung, C.F. Performance of piles with enlarged bases subject to uplift forces. Can. Geotech. J. 1990, 27, 546–556. [Google Scholar] [CrossRef]
  18. Tagaya, K.; Scott, R.F.; Aboshi, H. Pullout Resistance of Buried Anchor in Sand. Soils Found. 1988, 28, 114–130. [Google Scholar] [CrossRef]
  19. Vesić, A.S. Breakout Resistance of Objects Embedded in Ocean Bottom. J. Soil Mech. Found. Div. 1971, 97, 1183–1205. [Google Scholar] [CrossRef]
  20. Meyerhof, G.G.; Adams, J.I. The Ultimate Uplift Capacity of Foundations. Can. Geotech. J. 1968, 5, 225–244. [Google Scholar] [CrossRef]
  21. Murray, E.J.; Geddes, J.D. Uplift of Anchor Plates in Sand. J. Geotech. Engrg. 1987, 113, 202–215. [Google Scholar] [CrossRef]
  22. Ghaly, A.; Hanna, A. Model investigation of the performance of single anchors and groups of anchors. Can. Geotech. J. 1994, 31, 273–284. [Google Scholar] [CrossRef]
  23. Sahoo, J.P.; Khuntia, S. Lower bound solutions for uplift capacity of strip anchors adjacent to sloping ground in clay. Mar. Georesour. Geotechnol. 2018, 36, 405–416. [Google Scholar] [CrossRef]
  24. Lee, K.F.; Davidson, J.F.; Akroyd, J.; Kraft, M. Lifting a buried object: Reverse hopper theory. Chem. Eng. Sci. 2014, 105, 198–207. [Google Scholar] [CrossRef]
  25. Rowe, R.K.; Davis, E.H. The behaviour of anchor plates in sand. Géotechnique 1982, 32, 25–41. [Google Scholar] [CrossRef]
  26. Kananyan, A.S. Experimental investigation of the stability of bases of anchor foundations. Soil Mech. Found. Eng. 1966, 3, 387–392. [Google Scholar] [CrossRef]
  27. Baker, W.H.; Konder, R.L. Pullout load capacity of a circular earth anchor buried in sand. Highw. Res. Rec. 1966, 108, 1–10. [Google Scholar]
  28. Balla, A. The resistance to breaking-out of mushroom foundations for pylons. In Proceedings of the Fifth International Conference on Soil Mechanics and Foundation Engineering, Paris, France, 17–22 July 1961; pp. 569–576. [Google Scholar]
  29. Liang, W.; Zhao, J.; Wu, H.; Soga, K. Multiscale Modeling of Anchor Pullout in Sand. J. Geotech. Geoenviron. Eng. 2021, 147, 04021091. [Google Scholar] [CrossRef]
  30. Yoshida, S.; Xiong, X.; Matsumoto, T.; Yoshida, M. Field pull-out experiments of flip-type ground anchors driven in ground of clay and sand layers. GEOMATE J. 2021, 20, 93–100. [Google Scholar]
  31. Platipus Anchors Limited (n.d.). Civil Engineering and Construction-Platipus Earth Anchor Systems. Available online: https://resources.platipus-hub.com/Brochures/UK/Platipus%20Civil%20Engineering%20&%20Construction%20Brochure.pdf (accessed on 20 December 2022).
  32. ASTM D4318-17e1; Test Methods for Liquid Limit, Plastic Limit, and Plasticity Index of Soils. ASTM International: West Conshohocken, PA, USA, 2017.
  33. ASTM D6913-04; Test Methods for Particle-Size Distribution (Gradation) of Soils Using Sieve Analysis. ASTM International: West Conshohocken, PA, USA, 2004.
  34. ASTM D698-12; Test Methods for Laboratory Compaction Characteristics of Soil Using Standard Effort (12,400 ft-lbf/ft3 (600 kN-m/m3)). ASTM International: West Conshohocken, PA, USA, 2012.
  35. ASTM D854-14; Test Methods for Specific Gravity of Soil Solids by Water Pycnometer. ASTM International: West Conshohocken, PA, USA, 2014.
  36. ASTM D2166/D2166M-16; Test Method for Unconfined Compressive Strength of Cohesive Soil. ASTM International: West Conshohocken, PA, USA, 2016.
  37. Shelter Tress Inc. Duckbill Model 138 II. Available online: https://www.sheltertree.com/1897-34991/staking/planting_staking/duckbill-model-138-ii-5000-lb.aspx (accessed on 20 December 2022).
  38. Das, B.M. A Procedure for Estimation of Ultimate Uplift Capacity of Foundations in Clay. Soils Found. 1980, 20, 77–82. [Google Scholar] [CrossRef]
  39. Das, B.M. Model Tests for Uplift Capacity of Foundations in Clay. Soils Found. 1978, 18, 17–24. [Google Scholar] [CrossRef]
Figure 1. Components of PDEA [31].
Applsci 13 02132 g001
Figure 2. Expected load–displacement curve of PDEA [31].
Applsci 13 02132 g002
Figure 3. Existing and proposed channel bank configuration (a) and existing bank conditions (b).
Applsci 13 02132 g003
Figure 4. Slope grading work on the west bank used for this study: (a) slope work to proposed configuration; (b) finished graded slope.
Applsci 13 02132 g004
Figure 5. Geotech borehole locations (B-3 is the borehole involved in this study).
Applsci 13 02132 g005
Figure 6. TCP data and boring log of borehole 3 (the circled point is the outlier data).
Applsci 13 02132 g006
Figure 7. Inverted resistivity profiles from the ERI test at the west bank: (a) inverted resistivity profile from ERI line at the crest of the west bank slope; (b) inverted resistivity profile from ERI line at 36 m behind the crest of the slope.
Applsci 13 02132 g007
Figure 8. Duckbill 138 II (DB 138 II) earth anchor [37].
Applsci 13 02132 g008
Figure 9. PDEA anchor driving process on west bank slope using mini-excavator: (a) setup of a mini excavator and (b) anchor driven using the excavator.
Applsci 13 02132 g009
Figure 10. Schematics of field anchor pull-out test.
Applsci 13 02132 g010
Figure 11. Illustration of PDEA anchoring and testing process: (a) anchor driven, (b) pullout test setup, (c) pullout test (anchor rotation), and (d) anchor locking and finish surface of slope.
Applsci 13 02132 g011
Figure 12. Schematics of field anchor pull-out test. Anchor 3 pull-out test, all strokes, northwest bank, 25 January 2022.
Applsci 13 02132 g012
Figure 13. Anchor 3 pull-out test, combined strokes, northwest bank, 25 January 2022.
Applsci 13 02132 g013
Figure 14. Anchor 2 pull-out test 1, southwest bank, 13 January 2022.
Applsci 13 02132 g014
Figure 15. Anchor 2 pull-out test 2 repeat, southwest bank, 15 February 2022.
Applsci 13 02132 g015
Figure 16. Anchor 1 post-load-lock pull-out test on the southwest slope.
Applsci 13 02132 g016
Table 1. Summary of laboratory test results.
Soil Sample LocationIH-20 West Bank MiddlePI (%)9
Group SymbolCLGs (-)2.7
Group nameSandy Lean Clayγd, max (kN/m3)17.66
Clay (%)13.29γ (kN/m3)19.64
Silt (%)44.37ωopt (%)14.7
Sand (%)42.34UCS qu (kN/m2)58.6
LL (%)27
Table 2. Summary of field anchor pull-out test.
Anchor IDRegionDepth of Installation (m)Max. Pull-Out Load (kN)Corresponding Displacement (cm)
Anchor 1: Post-load-lockSouthwest2.413.22.85
Anchor 2: Test 1Southwest3.09.032.5
Anchor 2: Test 2 repeatSouthwest3.014.019.3
Anchor 3Northwest3.017.020.6
Table 3. Summary of maximum field pull-out load and pull-out capacity estimated from laboratory and TCP data.
Anchor IDMax. Field Pull-Out Load (kN)Pull-Out Load Estimated from Lab Data (kN)Error (%)Pull-Out Load Estimated from TCP Data (kN)Error (%)
Anchor 113.29.2330.113.84.5
Anchor 214.034.11.4
Anchor 317.045.718.8
Disclaimer/Publisher’s Note: The statements, opinions and data contained in all publications are solely those of the individual author(s) and contributor(s) and not of MDPI and/or the editor(s). MDPI and/or the editor(s) disclaim responsibility for any injury to people or property resulting from any ideas, methods, instructions or products referred to in the content.

