Article

Effect of Feed Rate on the Force and Energy in the Cutting Process Using Planar Technical Blades

by
Tomasz Chaciński
1,
Bartosz Zieliński
2 and
Krzysztof Nadolny
1,*
1
Department of Production Engineering, Faculty of Mechanical Engineering, Koszalin University of Technology, Racławicka 15-17, 75-620 Koszalin, Poland
2
Espersen Koszalin Sp. z o.o., Mieszka I 29, 75-124 Koszalin, Poland
*
Author to whom correspondence should be addressed.
Appl. Sci. 2023, 13(3), 2013; https://doi.org/10.3390/app13032013
Submission received: 20 December 2022 / Revised: 31 January 2023 / Accepted: 2 February 2023 / Published: 3 February 2023
(This article belongs to the Section Mechanical Engineering)

Abstract

:

Featured Application

The authors anticipate applying the knowledge presented in this article to the selection of appropriate parameters for the process of skinning flatfish in fish processing enterprises.

Abstract

Considering the technological processes taking place in fish processing enterprises (skinning), it is possible to specify various factors affecting the tool life and process efficiency. The paper presents the methodology of the study and the results and analysis of the collected data on the effect of the cutting speed of the technical blade used in the fish skinning process on the forces occurring in the cutting process. A special test stand was used in the study, which allowed obtaining repeatable results at a wide range of cutting speed values in the cutting process (70–400 mm/s). The study also determined the values of work W and power P, as well as the ej index (unit energy intensity index), which helped to select the most favorable blade feed rate parameter. The results indicated the most favorable cutting speed parameter and showed a clear relationship between the feed rate and the force and energy expenditure; as the cutting speed increases, an upward trend in force and energy expenditure was noted.

1. Introduction

In the manufacturing industry, and especially in the food industry, there are processes that require the separation of soft tissue from the rest of the product. Sen [1], Boziaris [2], and Borda et al. [3] provide detailed descriptions of how the food industry, particularly related to fish processing, requires the use of numerous (and occasionally complicated) processing operations that effectively separate the raw fish material.
One of the tissue separation operations in the food manufacturing industry is cutting. Planar technical blades are used in these cutting processes. Cutting blades are used in the manufacturing step of fish processing to separate edible from inedible components. In this context, the procedures of gutting, heading, portioning, and skinning can be distinguished [4].
Blades used in these processes come in a variety of sizes and forms, depending on the stage of processing that is being done. According to Colás and Totten’s research, alloy and carbon steels, tools, high speeds, and stainless steels are the primary materials used to make industrial cutting blades [5]. Stainless steel blades are safe for contact with food [6]. Stainless steel can be defined as an Fe alloy with a minimum of 10.5% Cr content. It is resistant to corrosion due to its ability to passivate, depending on the chemical composition of the particular alloy [7].
Production process optimization, or the aim to increase output effectiveness and reduce costs while preserving the required product quality, is a goal for manufacturing facilities. From the perspective of technical blade durability, issues regarding breaks in the production processes and financial aspects are related. The fundamental characteristic of cutting tools is what is referred to as their “cutting capability”, which can be described as the requirement to apply the necessary force needed to cut (separate) the processed material. A technical blade’s ability to cut is influenced by a variety of variables. According to the cutting technique and the blade’s intended use, technical blades have different cutting capacities, which consist of the following factors [8]:
  • Material:
    • material type,
    • condition of the material,
    • physical properties of the material.
  • Blade:
    • cutting edge shape,
    • size of wedge angle,
    • metrological properties of the edge,
    • metrological properties of adjacent surfaces.
  • Conditions:
    • cutting conditions,
    • cutting parameters (e.g., cutting speed).
In their publication, Zielinski et al. [9] describe the effect of edge shape and blade wedge angle on the cutting forces involved in the process. The values of wedge angle that are frequently used in the food sector are in the range of α = 3–10° and α1 = 20–30°, where α stands for cutting blade tip angle, and α1 stands for cutting blade wedge angle. The longevity of the blade and forces in the cutting process directly rely on the angle of the blade [10]. Due to the endurance of the cutting blade and the phenomena of the blade’s edge scrolling during the milling or grinding process, the lowest value of this angle is constrained.
The value of the angle has a substantial effect on the energy intensity of the cutting process, depending on the application and the material being machined [11]. The authors of [12] studied the impact of both edge rounding radius and blade angle. The cutting force measurements made throughout the cutting process have a high correlation with blade sharpness. One of the most significant elements affecting cutting force is the geometry of the blade, particularly its tip radius and wedge angle. Information about how these factors affect cutting forces can be found in the literature [12,13,14,15,16,17]. Liu et al. [18] and Sun et al. [19], in addition to blade angle and cutting speed, point out other important factors related to the cutting characteristics of plastics such as the introduction of vibrations, which can have a significant impact on the forces involved in the process and the surfaces left after cutting.
In their 2015 study, Adamovsky [20] investigated the impact of blade wear on cutting force when slicing through carbon fibers. The cutting process was demonstrated to be impacted by blade wear in two different ways. The first involves how, as wear increases and the blade’s overall height decreases, the effective depth of the blade’s penetration into the substrate can decrease dramatically. Only when the knife blades protrude a particular amount from the knife mounting bracket is this wear effect noticeable. By monitoring the knife edges’ protrusion from the reference surface, it is simple to regulate how much the depth changes. Changes in blade geometry that necessitate increasing the cutting pressure force are a second impact of advancing knife wear.
Cutting studies conducted in the literature describe experiments performed on different types of materials and tissues using different types of technical blades (with different edge shapes and different wedge angle values). In their works, the authors conduct cutting tests often under quasi-static conditions. The literature also describes tests carried out for various materials (mainly foods such as meat, vegetables, cheese, and sorghum stalks) at 10 mm/s [11], where the significance of the cutting speed parameter was neglected, and also from 30 mm/s [21], through to 280 mm/s [22] and 500 mm/s (where no statistically significant differences were found) [23,24], up to 2000 mm/s [25].
An analysis of the available literature sources [26] showed that for some of the materials tested, increasing the cutting speed leads to a decrease in the cutting forces present in the process [22], while for others it leads to growth in the forces [21,27]. Therefore, there is a need to determine the optimal cutting speed, depending on the type of cut material used. The study described in this paper refers to the one conducted by Zieliński et al. [9]. Analysis of the effect of cutting speed on cutting force and energy consumption of the process was the main aim of this study. The cutting speed range for the tests conducted is 70–400 mm/s. The parameter was selected based on the possible speeds in the process of skinning flatfish under industrial conditions. Tests on the effect of cutting speed on cutting forces were carried out on a special bench characterized by a range of the cutting speed: vf = 1–400 mm/s. A novel element distinguishing this work is the approach in which the range of measured velocities on the test bench is very wide (in this case, from 70 mm/s to 400 mm/s). In addition to relying on a wide range of cutting speeds for testing, a novel element of the study of cutting specimens that mimic soft tissues is the use of the authors’ rectilinear motion kinematics test stand, equipped with a high-speed data acquisition system.

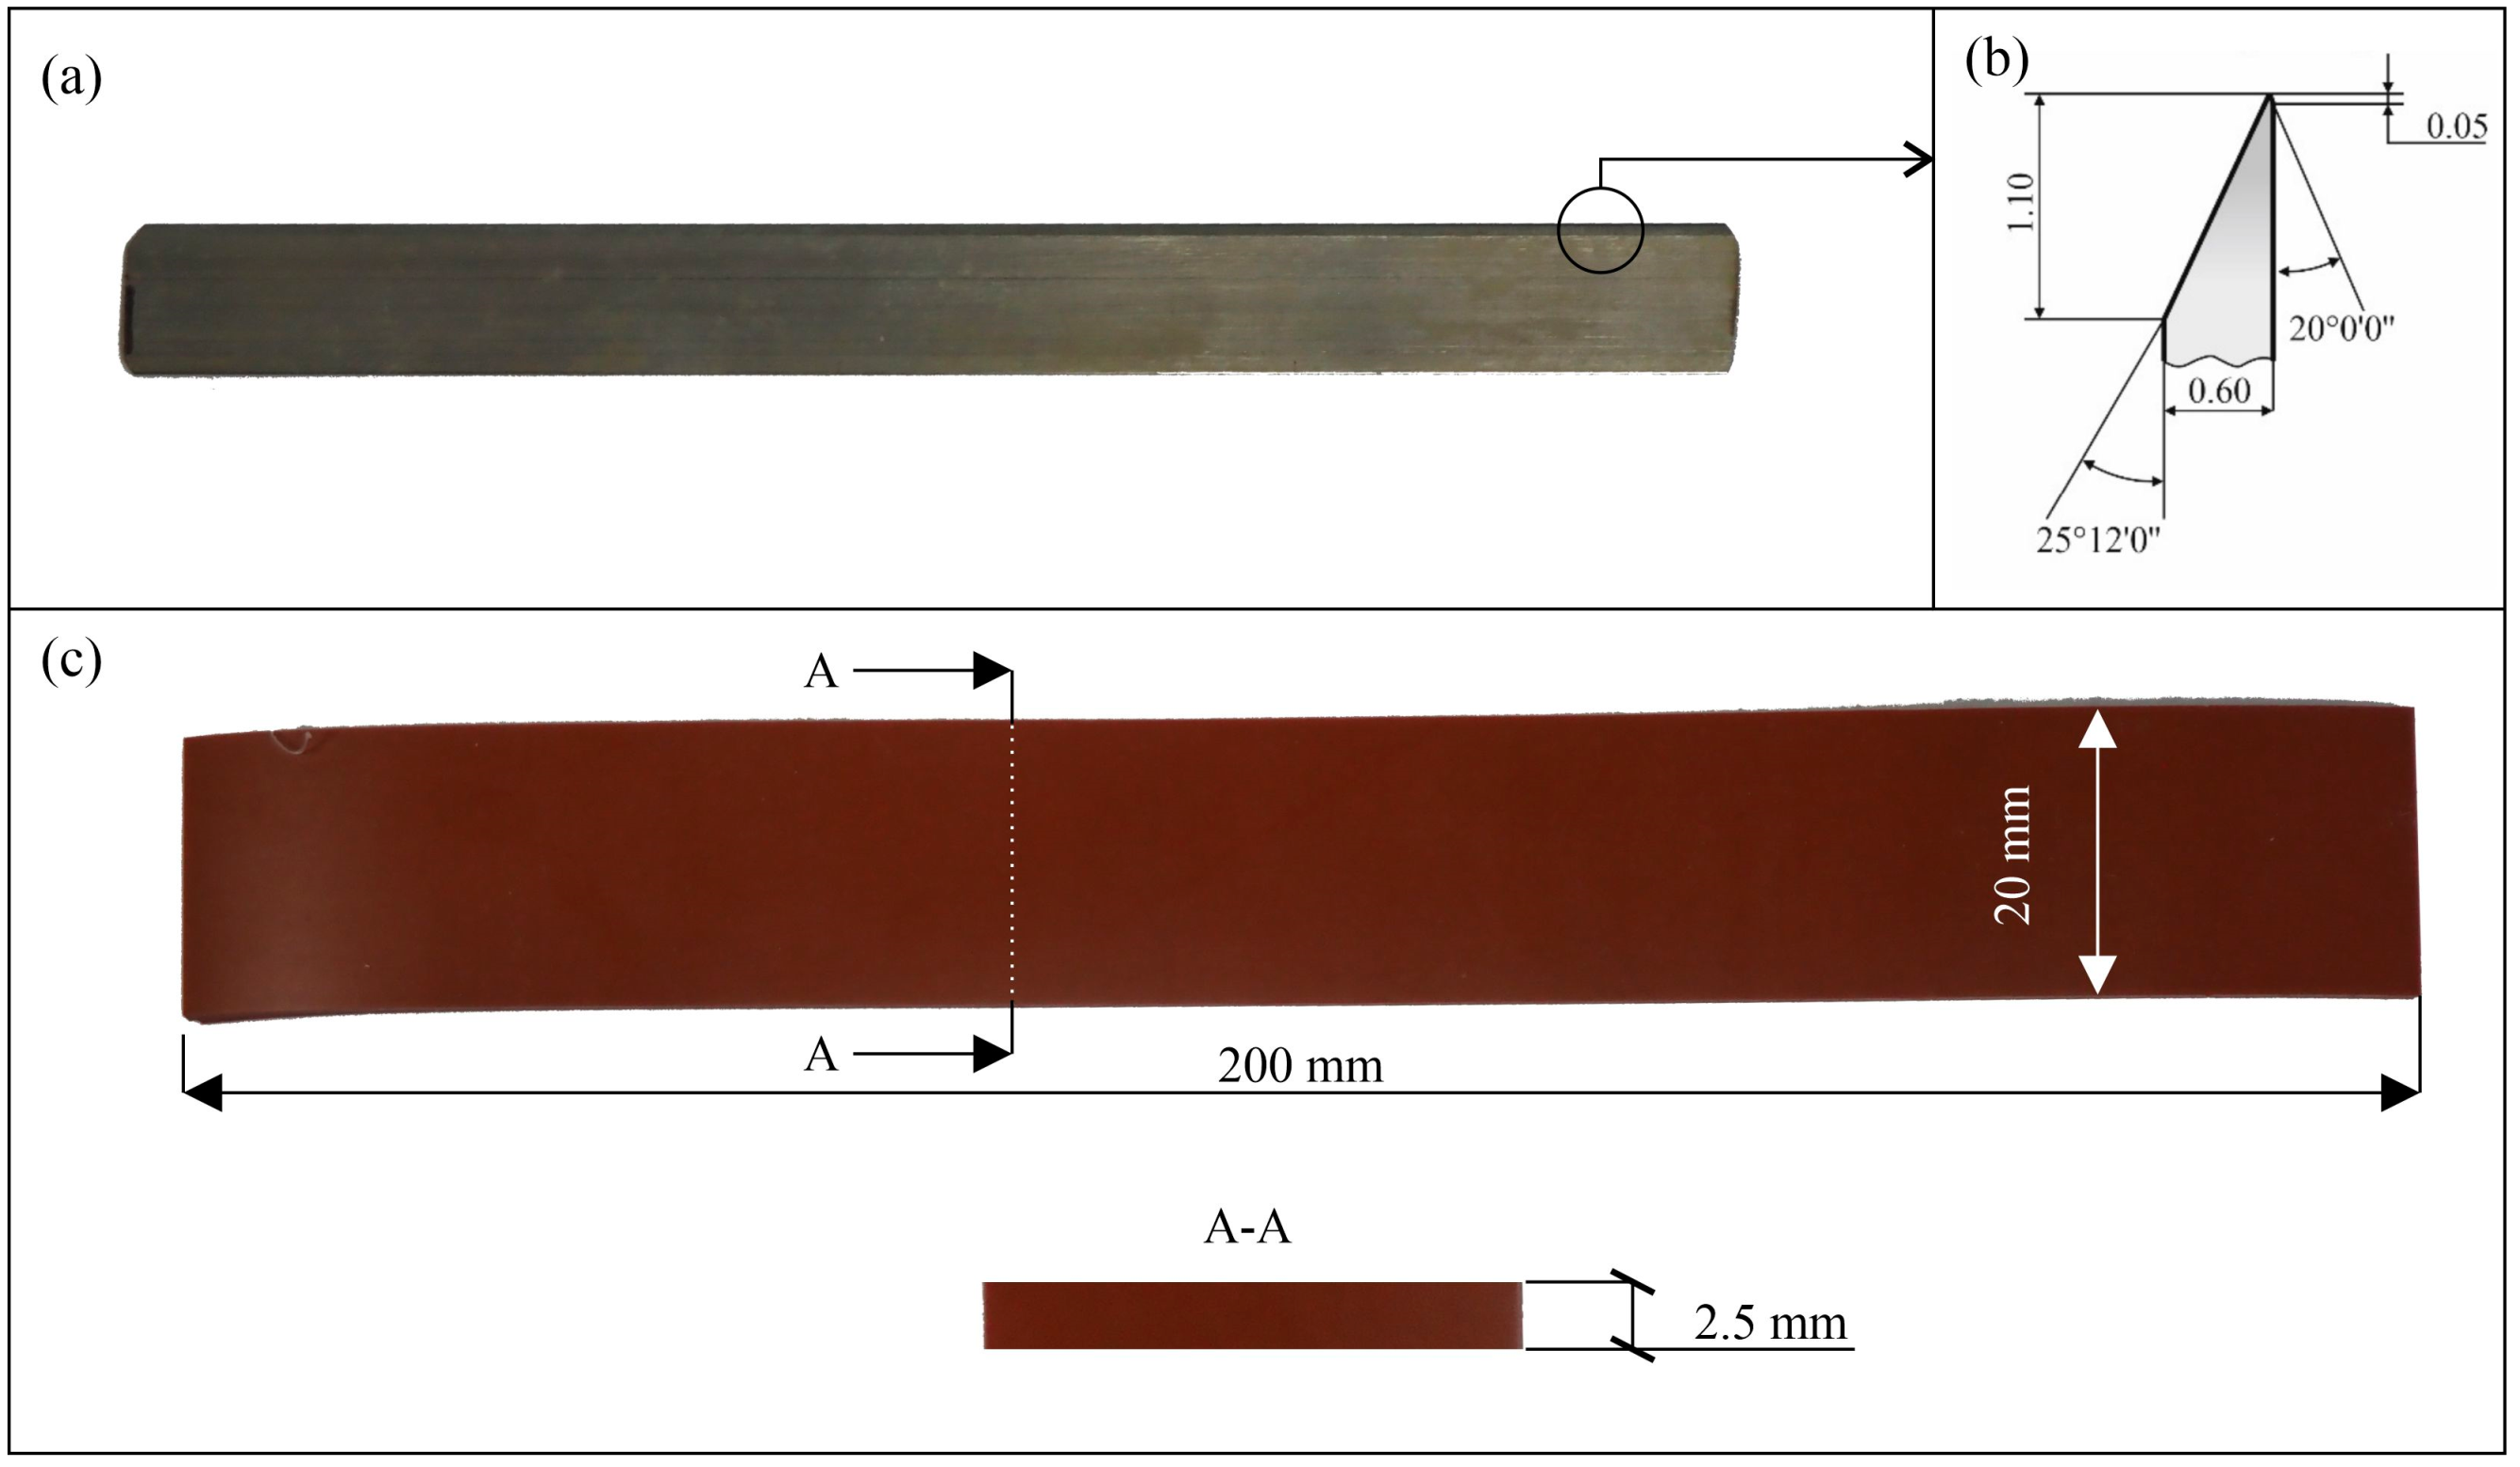
2. Materials and Methods

Planar technical blades were used to perform a series of tests. The cutting speed range for the tests conducted was 70–400 mm/s. The measurement points were spaced every 30 mm/s. For each cutting speed, 5 tests were performed.

2.1. Test Stand

The test stand was fitted with an operator panel, with which it was possible to adjust the feed rate of the cutting blade in the range of 1–400 mm/s. Figure 1 shows the test stand and indicates its main components.
As described in a previous work [9], the stand was equipped with a specimen holder. In the studies described, an additional supporting fixture was used that supports the specimens closer to the intersection. As a result, the specimen does not have a chance to stretch, and the results of the tests carried out are characterized by a smaller scattering of measured force values. Figure 2 shows how the specimen is mounted into the jaws of the test stand.
Planar technical blades were mounted on the strain gauge bridge. For these tests, the blade geometries chosen were those characterized in previous tests [9] by the lowest forces occurring in the cutting process (that is, those with the smallest wedge angle). Figure 3 shows the blade mounted in the holder.
The measurement stand has an original control system that was built using components that were readily accessible on the market and carefully chosen and set up. The load cell with a load range of 0–15 kg, AVX 30 15e (SCAIME-Weighing & Measurement for Industry, Juvigny, France) was the primary component enabling the measurements.
The same manufacturer’s eNod4-T-DI00-000-SC signal amplifier received measurement data from the load cell. The controller recorded the signal once it was processed by utilizing specialized software. The operational settings were configured, and measurement data were gathered. The programmable operator panel was based on the USL-050-B05 (Unitronics, Airport City, Israel) panel. Following the measurement, collected data could be digitally transferred through the USB interface and used for additional analysis.
To ensure the safety of the operator, a protecting shield was used to encase the stand to restrict access to moving parts during work.
Table 1 shows the technical parameters of the cutting force measurement station.

2.2. Tools and Workpieces

One cutting blade dedicated for the flat fish skinning process was used in the experiments. The blade was made of high-carbon martensitic stainless steel X39Cr13 (Kuno Wasser GmbH, Solingen, Germany for Steen F.P.M. International, Kalmthout, Belgium). The blade was in the condition provided by the manufacturer (new, not used before). The properties of X39Cr13 steel are shown in Table 2. Figure 4a shows a general view of the cutting blade.
The general view of the blade used in testing is shown in Figure 4. Polyurethane (EKO INDUSTRIE Sp.z o.o., Słupsk, Poland) was used as the specimen material in the research presented to assess the cutting forces during the procedure. The study conducted by other writers on the comparable cutting methods [11,12,28] detailed in Section 1 of this article served as the foundation for the selection of this material, because it has been shown that polyurethane can replace soft tissue in laboratory tests. The most crucial mechanical properties of the polyurethane are listed in Table 3 [29]. Test samples were prepared. Each sample was cut with dimensions of 200 mm × 20 mm and a 2.5 mm thickness from a polyurethane sheet (Figure 4c).

2.3. Experiment Methodology

The measurement involved a series of preparatory steps, such as placing the specimen in the jaws, attaching the blade to the strain gauge bridge, and defining the feed rate for the test. As the cutting process was performed, the strain gauge bridge measured the cutting force F at an interval of 3–4 ms. The collected data was stored in the device’s memory. In order to maintain the best possible repeatability of the measurements, a clamping method was provided that allows the specimen to be preloaded with a force of 28 N (which results in a 10 mm elongation of the specimen). Figure 5 shows the sample mounted in the jaws before cutting occurs.
In previous studies [9], the authors considered a cutting speed of vf = 214 mm/s. Such a value was previously adopted, due to the fact that it is close to the process feed rate used in an industrial plant processing flat fish (the cutting speed was adopted on the basis of data from fish processing plant Espersen Koszalin Sp. z o.o., Koszalin, Poland). Here, the authors decided to test a wider range of cutting speeds, from vf = 70 mm/s up to vf = 400 mm/s, which is the maximum cutting speed achievable on the used test bench.
The methodology for measuring the cutting force F is described in the following steps:
  • Fixing blade in the blade retaining body;
  • Fixing the test sample using supporting bracket in jaws;
  • Closing the main door;
  • Enabling the main servomotor;
  • Zeroing of the Z-axis;
  • Entering the feed rate value vf according to experiment plan;
  • Disengagement of the main safety switch;
  • Tare of the force F sensor reading;
  • Starting of the measuring procedure;
  • Engaging the main safety switch;
  • Opening main door and unclamping the cut sample.
After all the repetitions, all the measurement data files were transferred to a PC using a portable flash drive. The data files were saved in the system manufacturer’s proprietary format for the sensor. It was necessary to convert these files using UniStream Data Converters Suite 1.0.17 software (Unitronics, Airport City, Israel). The converted files were further processed and analyzed using Microsoft Excel spreadsheet version 2211 compilation 15831.20190 (Microsoft, Redmond, WA, USA).
For this study, a total of 60 tests were conducted. The range of vf velocities (70–400 mm/s) was adjusted in 30 mm/s increments. This led to 12 measurement points, for which 5 repetitions were performed. The collected data were pre-prepared for analysis in Excel software. The results of the data processing were force diagrams in individual charts, plotting fields under the average cutting force diagrams for given feed rates. Work W and power P calculations were also made for the averaged forces for each cutting speed vf. Based on all the collected data, the unit energy intensity index [26] of the cutting process was calculated for each cutting speed tested. The unit energy intensity ej of the cutting process was defined as the work W required to cut a unit area A of the material (Figure 4).

3. Results and Discussion

The results of the performed tests of the cutting force F of the chosen blade relative to cutting speed vf are shown in Figure 6. Figure 6a shows the averaged curves of cutting force F for each cutting speed vf in time t. Figure 6b shows all measured values of cutting forces F relative to cutting speeds. Mean values, trend line, and area under the cutting force, represented by the impulse I of the force F curve, are also shown. The impulse I is calculated from the following formula:
I = F × t, N·s;
where I is impulse, F is force, and t is time.
Collected data enabled us to calculate work W and power P for each cutting speed vf from the average force values. Results are presented in the chart in Figure 7. Work W is calculated from the following formula:
W = F × s, J;
where W is work, F is force, and s is distance. Power P is calculated from the following formula:
P = W/t, W;
where P is power, W is work, and t is time.
Collected data were also used to determine the unit energy intensity index ej [26] of the cutting process, calculated as follows:
ej = W/A, J/m2;
where W is work and A is cross-sectional area of the sample. Figure 8 shows the graph of ej relative to cutting speed vf.
The obtained measurement data show changes in the cutting force F depending on the cutting speed used. A tendency for the force to increase with increasing cutting speed was observed. The maximum force recorded was 3.99 N for a cutting speed of 340 mm/s. The lowest cutting force occurred when testing at the lowest cutting speed considered, namely 70 mm/s, and was 2.37 N, which is 59% of the maximum value. The average highest recorded cutting force occurred at 310 mm/s and was equal to 3.44 N, and the lowest average force occurred at 70 mm/s and was equal to 2.6 N, which is 75% of the maximum force averaged for each cutting speed test.
Despite the fact that the recorded maximum force and averaged maximum force did not occur at the highest cutting speed tested, from the collected data shown in Figure 6b, the trend clearly shows that the cutting force F increases along with cutting speed. Therefore, it can be concluded that it will be desirable from the point of view of extending tool life to reduce the cutting speed in the process. This is because lower forces have been associated in the literature with slower cutting edge wear. In industrial conditions, however, the use of a slower cutting speed leads to an increase in the unit time of the operation, which is also not advantageous from an economic point of view. It is therefore necessary to seek an optimum, controlling the cutting speed in such a way as to minimize the process time and forces occurring during cutting.
The increased forces F in the cutting tests were due to the material properties of the polyurethane. Properties such as tensile strength, elastomer density, and shore hardness characterize the decohesion process of this material. In this case, the material properties directly influenced the increase in cutting force F with increasing vf cutting speed.
Based on the observed data, it is possible to observe characteristic points, such as a sudden decrease in force F at 380 mm/s, a decrease in the energy intensity of the cutting process ej at 340 mm/s, and a decrease in work W and power P at a blade feed rate of 340 mm/s. To explain these phenomena, which are a deviation from the general trend according to which the recorded data follow, it is necessary to discuss the basic phenomena occurring in soft tissue decohesion. Zhongwei Hu et al. [30] detail the following phases in the process of soft tissue cutting:
  • deformation phase,
  • rupture phase (preceded by a break-in point),
  • cutting phase.
Before the break-in point, the deformation phase occurs, which initiates the rupture and subsequent cutting process. In this phase, the blade penetrates the sample but does not separate, causing the sample to become strained. Increasing the sample deformation stress leads to entering the rupture phase, which is more violent as the sample deformation stress increases. Once the blade leads to the “break-in point”, a fracture begins and rapidly spreads, leading to the tissue rupture phase. In this phase, the blade barely exchanges energy with the tissue. The energy absorbed by the sample is immediately released. The area of newly formed cracks depends on the energy absorbed in the deformation phase. The more energy that was absorbed in the previous phase, the larger the crack surface formed in the rupture phase. The cutting phase immediately follows, in which the cutting force varies less than in the previous cutting phases [30].
Due to the different kinematics of movement as reported in the literature, and due to the thickness of the specimens, it is difficult to detail the cutting phase in the presented graphs (Figure 6). Conclusions are drawn based on the cutting force F when the “break-in point” is reached. However, analysis of the basic phenomena occurring in the process of cutting through soft tissues allows the authors to put forward a hypothesis. The phenomena of reduction of energy expenditure and cutting forces F located in the vicinity of the cutting speed of 340–380 mm/s are related to the stresses introduced into the material. At these particular cutting speeds, the deformation phase is shortened, but intensified, leading to a rapid transition to the rupture phase while reaching the “break-in point” earlier.
An analysis was carried out, which included calculating the area under the cutting curve (Figure 6a), which represents impulse I of the force F. A chart of the relationship between the impulse curve I and cutting speed vf in the cutting process is shown in Figure 6b. Conducted analysis shows that the impulse curve I decreases with increasing vf cutting speed. This means that with increased cutting speed, admittedly, the cutting force is higher, but the total working time in a given trial increases and the impulse of force tends to decrease.
To support the above conclusions, work W and power P values were calculated for each cutting speed based on the averaged force values, which are shown in Figure 7. The maximum calculated work took the value of 0.015 J for a cutting speed of 340 mm/s, and the maximum power values were 3.95 W for a cutting speed of 310 mm/s. The lowest calculated values for work and power were 0.0092 J for a cutting speed of 280 mm/s and 2.28 W for a cutting speed of 280 mm/s. From the data collected in Figure 7, it can be seen that, as in the case of force, there is an upward trend in work W and power P with increasing cutting speed, but the relationship is not as pronounced.
Based on the literature [24], the index ej, which expresses unit energy intensity, was calculated. The data are shown in Figure 8. It was observed that the unit energy intensity tends to increase with increasing cutting speed in the process. The increasing unit energy intensity index ej is due to the formula in which it is calculated. Since the index is calculated from the quotient of the work W and the cross-section of sample A, assuming that the cross-section of sample A is constant, and the value of the calculated work W decreases, the value of the index ej also decreases.

4. Conclusions

Based on the design, implementation, and research work completed, the following findings were established for the study evaluating the cutting force of planar technical blades used in flatfish processing.
  • In order to carry out the described tests, it was necessary to use a stand that allows adjustment of the cutting speed in the range under study (70–400 mm/s).
  • Repeatability of measurements and high sampling rate were guaranteed by using a test bench with numerical control and digital data recording. It was decided to use a system that allowed the export of measurement data and their further analysis.
  • Utilizing a wide range of cutting speeds vf while measuring forces F at multiple measurement points (12 feed rates and 5 tests for each point) was a unique feature of this experiment.
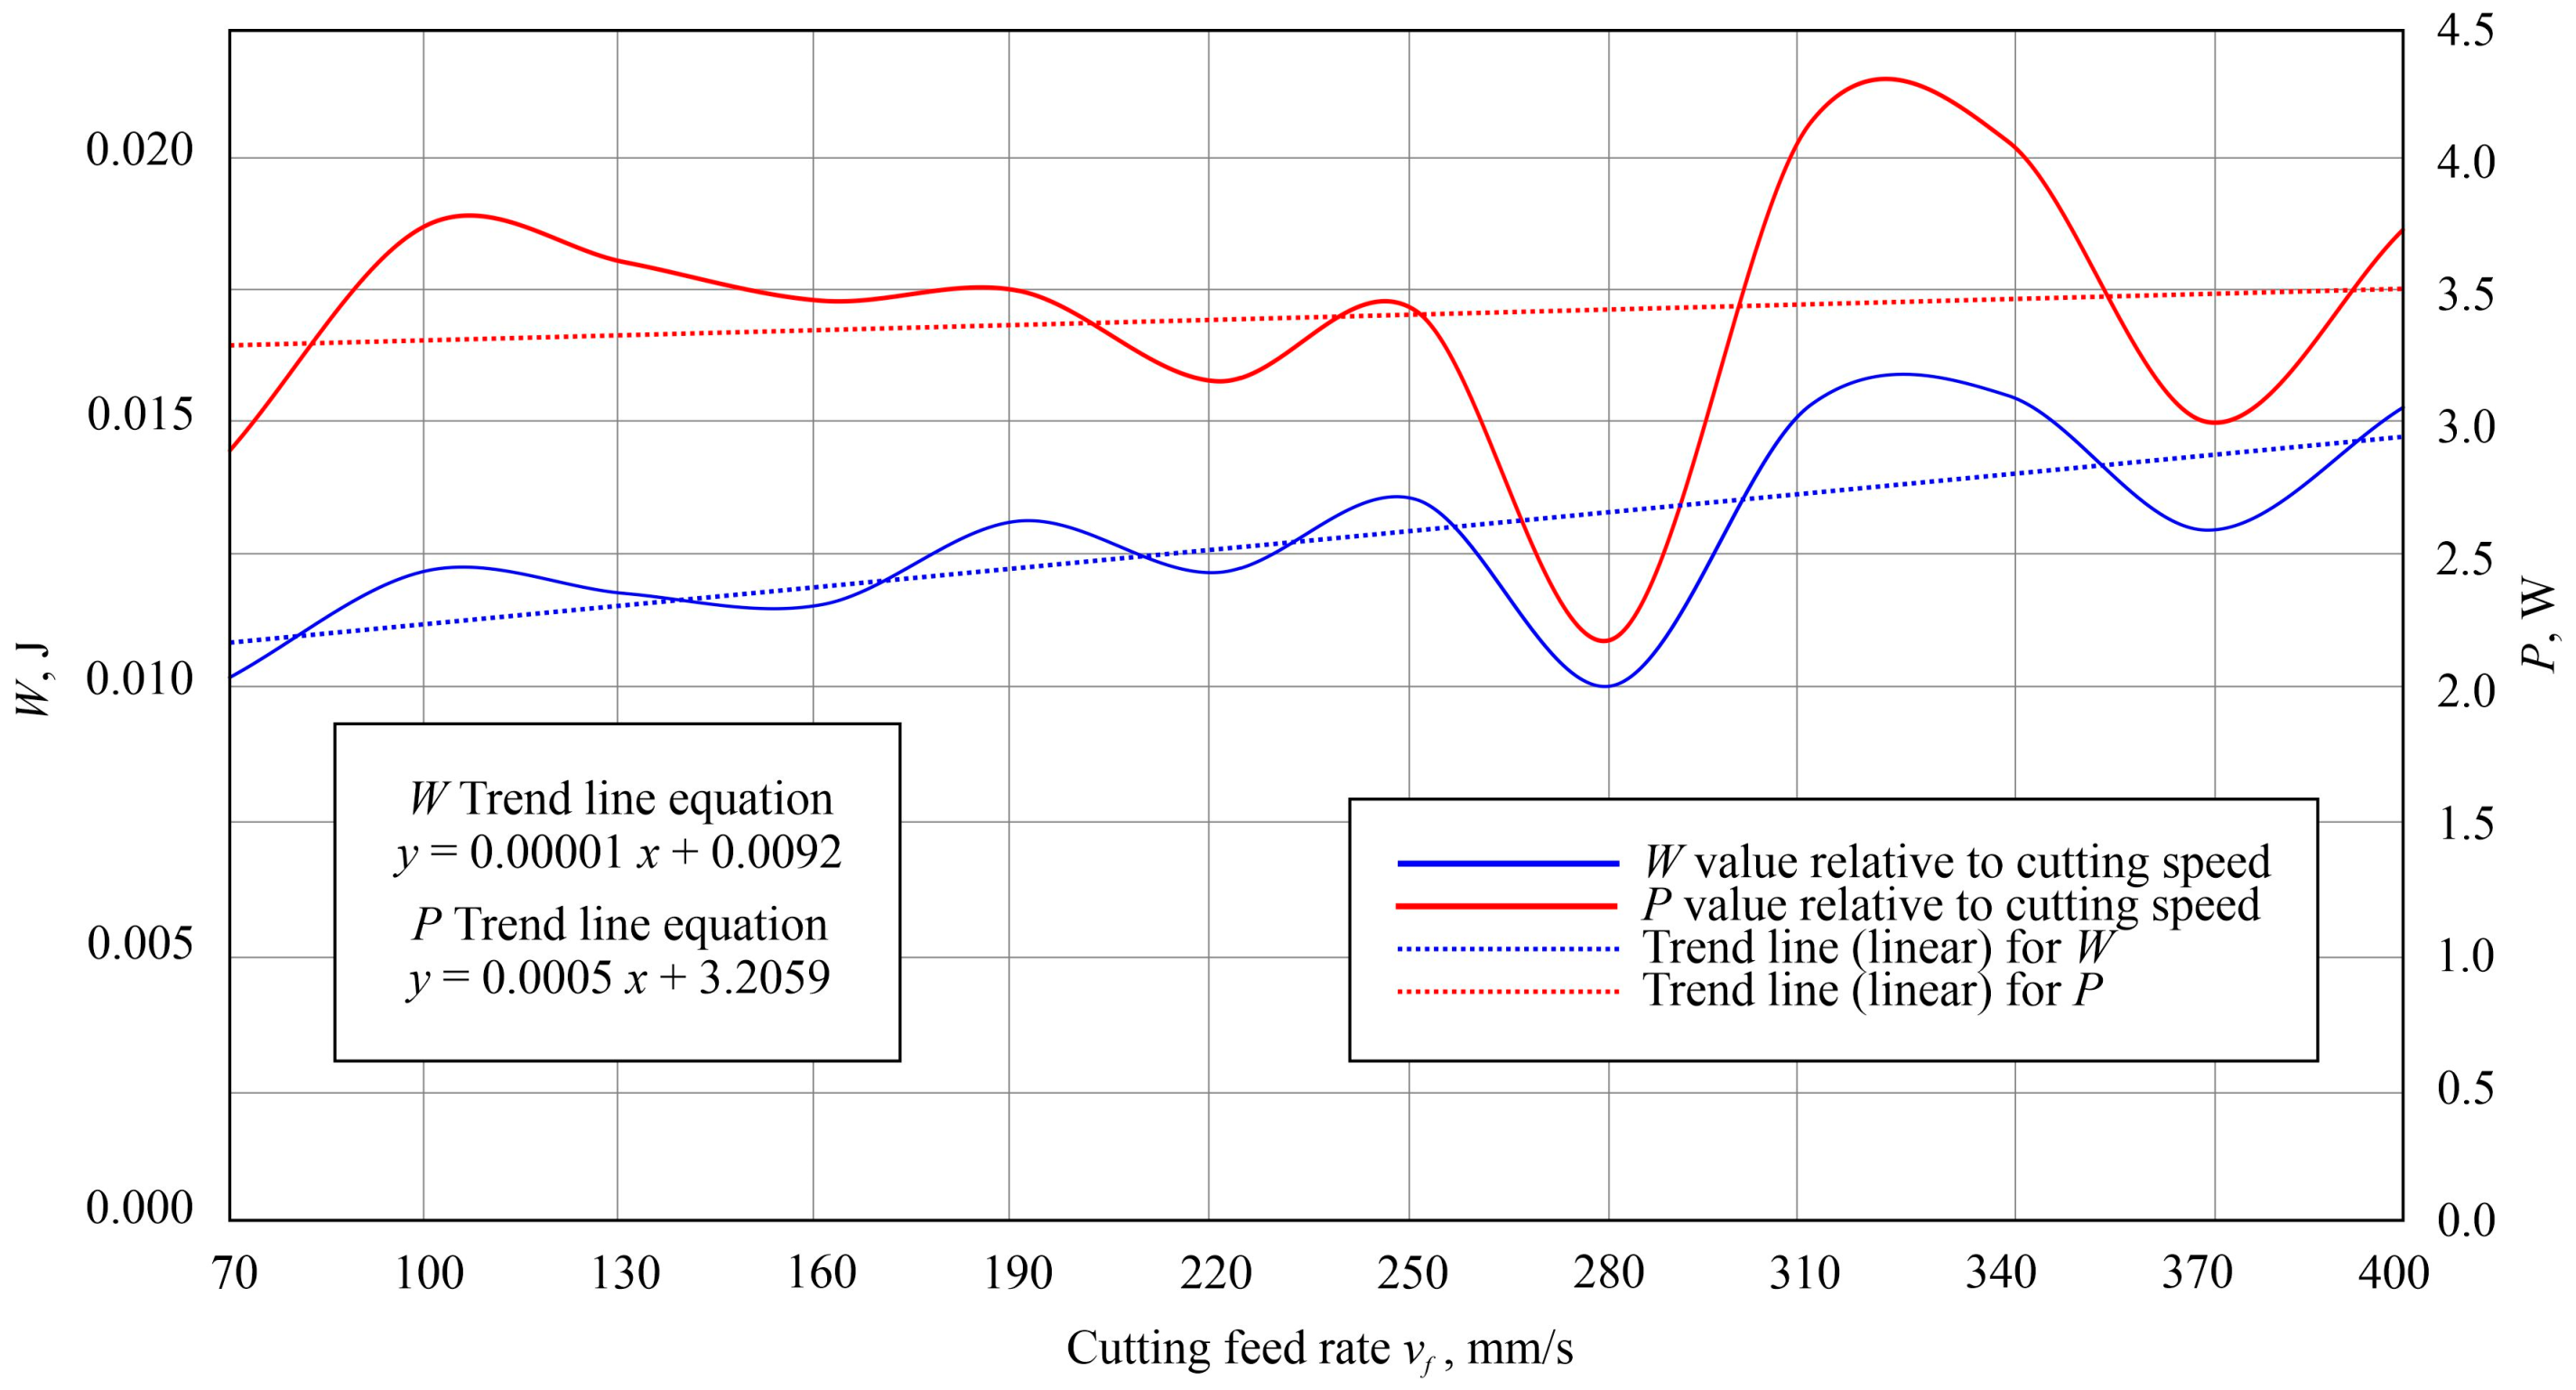
  • Analysis of the results allowed us to identify the most favorable cutting speed (70 mm/s) due to the minimum forces (2.6 N) occurring in the cutting process.
  • Calculated work W and power P increased with force F. Calculations of the unit energy intensity ej index were made. The values of the ej index also maintained an incremental trend with increasing cutting speed, indicating that more energy is consumed in the process as speed increases. The maximum value (242 J/m2) of the ej index at the highest cutting speed vf (400 mm/s) was equal to 161% of the value of the ej index (150 J/m2) calculated for the lowest tested cutting speed vf (70 mm/s).
  • The slowest tested cutting speed (70 mm/s) was considered the most favorable parameter due to the lowest forces (2.6 N) and the lowest energy expenditure (150 J/m2). In industrial conditions, however, process time t is an equally important factor, which increases with decreasing cutting speed. Thus, further analysis is needed to find the optimum between the smallest forces and process time. Time t of the process with minimum feed rate vf (70 mm/s) was equal to 109 ms, while t for maximum vf (400 mm/s) was equal to 27 ms. At a minimum cutting speed of 70 mm/s, the process takes four times longer to complete compared to the maximum tested speed (400 mm/s).
  • Reducing the cutting speed vf has a positive effect on reducing the cutting force F (which is related to the blade wear process) and the energy expenditure in the form of the calculated ej index. However, excessive reduction of the blade feed rate parameter leads to a significant (fourfold) extension of the process. It is therefore necessary to control the feed parameter in search of a combination of output factors that will ensure stable and safe operation of the blade, with its minimum wear and minimum duration of operation.
  • Since the studies presented are of a laboratory nature, it is not possible to replicate under such circumstances the effect of variables that occur in a manufacturing process. As a result, tests performed on the test bench mentioned above must finally be confirmed by experiments carried out in production line conditions for flat fish skinning.
  • Extended research is planned to determine the optimal cutting speed vf that will ensure the occurrence of minimum forces F and energy expenditure ej in the cutting process, while not prolonging the process.

Author Contributions

Conceptualization, B.Z. and K.N.; methodology, B.Z., T.C. and K.N.; software, B.Z. and T.C.; validation, K.N.; formal analysis, T.C. and K.N.; investigation, T.C.; resources, K.N.; data curation, B.Z. and T.C.; writing—original draft preparation, T.C.; writing—review and editing, K.N.; visualization, T.C.; supervision, K.N.; project administration, K.N.; funding acquisition, B.Z. and K.N. All authors have read and agreed to the published version of the manuscript.

Funding

This research received no external funding.

Conflicts of Interest

The authors declare no conflict of interest.

References

  1. Sen, D.P. Advances in Fish Processing Technology; Allied Publishers: New Delhi, India, 2005. [Google Scholar]
  2. Boziaris, I.S. (Ed.) Seafood Processing: Technology, Quality and Safety; John Wiley & Sons: Chichester, UK, 2013. [Google Scholar]
  3. Borda, D.; Nicolau, A.I.; Raspor, P. Trends in Fish Processing Technologies; CRC Press: Boca Raton, FL, USA, 2017. [Google Scholar]
  4. Majewski, J. Parameters of Machine Deheading and Variability of Roach Deheading Cut Operation in the Annual Cycle; Agricultural Academy in Szczecin, Faculty of Food Science and Fisheries: Szczecin, Poland, 2005. (In Polish) [Google Scholar]
  5. Colás, R.; Totten, G.E. Encyclopedia of Iron, Steel, and Their Alloys; CRC Press: New York, NY, USA, 2016. [Google Scholar]
  6. Zieliński, B.; Nadolny, K.; Zawadka, W.; Chaciński, T.; Stachurski, W.; Batalha, G.F. Effect of Pro-Ecological Cooling and Lubrication Methods on the Sharpening Process of Planar Blades Used in Food Processing. Materials 2022, 15, 7842. [Google Scholar] [CrossRef] [PubMed]
  7. Przybyłowicz, K. Metals Science; WNT: Warszawa, Poland, 1999. (In Polish) [Google Scholar]
  8. Karpiński, T.; Stępień, P. Methods of Abrasive Shaping of Technical Blades; Scientific Papers of the Institute of Machine Building Technology of Wrocław University of Technology; Wrocław University of Technology: Wrocław, Poland, 1987; pp. 238–248. (In Polish) [Google Scholar]
  9. Zieliński, B.; Chaciński, T.; Pimenov, D.Y.; Nadolny, K. Methodology for Evaluating the Cutting Force of Planar Technical Blades Used in Flatfish Processing. Micromachines 2021, 12, 1516. [Google Scholar] [CrossRef] [PubMed]
  10. Verhoeven, J.D. Experiments on Knife Sharpening; Department of Materials Science and Engineering Iowa State University: Ames, IA, USA, 2004. [Google Scholar]
  11. McCarthy, C.; Hussey, M.; Gilchrist, M. On the sharpness of straight edge blades in cutting soft solids: Part I—Indentation experiments. Eng. Fract. Mech. 2007, 74, 2205–2224. [Google Scholar] [CrossRef]
  12. McCarthy, C.; Annaidh, A.N.; Gilchrist, M. On the sharpness of straight edge blades in cutting soft solids: Part II—Analysis of blade geometry. Eng. Fract. Mech. 2010, 77, 437–451. [Google Scholar] [CrossRef]
  13. McGorry, R.W.; Dowd, P.C.; Dempsey, P.G. The effect of blade finish and blade edge angle on forces used in meat cutting operations. Appl. Ergon. 2005, 36, 71–77. [Google Scholar] [CrossRef]
  14. Yuan, Z.; Zhou, M.; Dong, S. Effect of diamond tool sharpness on minimum cutting thickness and cutting surface integrity in ultraprecision machining. J. Mater. Process. Technol. 1996, 62, 327–330. [Google Scholar] [CrossRef]
  15. Moore, M.; King, F.; Davis, P.; Manby, T. The effect of knife geometry on cutting force and fracture in sugar beet topping. J. Agric. Eng. Res. 1979, 24, 11–27. [Google Scholar] [CrossRef]
  16. Meehan, R.R.; Kumar, J.; Earl, M.; Svenson, E.; Burns, S.J. The Role of Blade Sharpness in Cutting Instabilities of Polyethylene Terephthalate. J. Mater. Sci. Lett. 1999, 18, 93–95. [Google Scholar] [CrossRef]
  17. Goh, S.; Charalambides, M.; Williams, J. On the mechanics of wire cutting of cheese. Eng. Fract. Mech. 2005, 72, 931–946. [Google Scholar] [CrossRef]
  18. Liu, Y.; Zhang, D.; Geng, D.; Shao, Z.; Zhou, Z.; Sun, Z.; Jiang, Y.; Jiang, X. Ironing effect on surface integrity and fatigue behavior during ultrasonic peening drilling of Ti-6Al-4 V. Chin. J. Aeronaut. 2022, in press. [Google Scholar] [CrossRef]
  19. Sun, Z.; Geng, D.; Zheng, W.; Liu, Y.; Liu, L.; Ying, E.; Jiang, X.; Zhang, D. An innovative study on high-performance milling of carbon fiber reinforced plastic by combining ultrasonic vibration assistance and optimized tool structures. J. Mater. Res. Technol. 2023, 22, 2131–2146. [Google Scholar] [CrossRef]
  20. Adamovsky, M.F.A. The Effect of Cutting Blade Geometry and Material on Carbon Fiber Severing as Used in High-Volume Production of Composites; The University of Western Ontario: London, ON, Canada, 2015. [Google Scholar]
  21. Brown, T.; James, S.J.; Purnell, G.L. Cutting forces in foods: Experimental measurements. J. Food Eng. 2005, 70, 165–170. [Google Scholar] [CrossRef]
  22. Kowalik, K.; Sykut, B.; Opielak, M. A study of the effect of feed rate on resistance of cutting food products. Agric. Eng. 2005, 9, 181–186. (In Polish) [Google Scholar]
  23. Nadulski, R.; Guz, T. Influence of some design and operating parameters on the vegetable cutting process. Agric. Eng. 2001, 10, 253–258. (In Polish) [Google Scholar]
  24. Nadulski, R.; Wawryniuk, P. The influence of selected design parameters of the cutting unit on the vegetable cutting process. Agric. Eng. 2003, 7, 297–305. (In Polish) [Google Scholar]
  25. Marks, N.; Krzysztofik, B.; Piech, T. Effect of impact speed and energy on mechanical damage to potato tubers. Ann. Agric. Sci. 1985, 76, 1. (In Polish) [Google Scholar]
  26. Kowalik, K. The Impact of Cutting Technology of Selected Food Products Food Products on the Energy Intensity of the Process. Doctoral Dissertation, Lublin University of Technology, Lublin, Poland, 2011. (In Polish). [Google Scholar]
  27. Yiljep, Y.; Mohammed, U. Effect of Knife Velocity on Cutting Energy and Efficiency during Impact Cutting of Sorghum Stalk. CIGR E-J. 2005, 7, 1–10. [Google Scholar]
  28. Gilchrist, M.; Keenan, S.; Curtis, M.; Cassidy, M.; Byrne, G.; Destrade, M. Measuring knife stab penetration into skin simulant using a novel biaxial tension device. Forensic Sci. Int. 2008, 177, 52–65. [Google Scholar] [CrossRef] [PubMed]
  29. Eko Industrie. Polyurethane Board—Material Card; Eko Industrie Sp. z o.o.: Słupsk, Poland, 2021. [Google Scholar]
  30. Hu, Z.; Zhang, B.; Sun, W. Cutting characteristics of biological soft tissues. CIRP Ann. Manuf. Technol. 2012, 61, 135–138. [Google Scholar] [CrossRef]
Figure 1. General view of the measuring station.
Applsci 13 02013 g001
Figure 2. The method of fixing the sample on the measuring stand.
Applsci 13 02013 g002
Figure 3. Method of fixing planar technical blade in the holder at the strain gauge bridge.
Applsci 13 02013 g003
Figure 4. General view of blade used (a), geometry of the cutting blade (b), polyurethane sample (c).
Applsci 13 02013 g004
Figure 5. Sample mounted in jaws and supporting bracket during cutting test.
Applsci 13 02013 g005
Figure 6. Experimental results of cutting force F relative to cutting speed: (a) averaged cutting force curves for each cutting speed; (b) measured values of cutting force, mean values, and the impulse I of force F.
Applsci 13 02013 g006
Figure 7. Chart for work W and power P relative to vf cutting speed.
Applsci 13 02013 g007
Figure 8. Graph for unit energy intensity of the cutting process ej relative to cutting speed vf.
Applsci 13 02013 g008
Table 1. Technical parameters of the cutting force measurement station [9].
ParameterValue
Power supplyAC 230 V/50 Hz
Safety featuresDoor state sensor, emergency stop
Operator panelControl panel USL-050-B05 (Unitronics, Airport City, Israel)
Sampling rateInterval 3–4 ms (250–333 Hz)
Working range of the load cell0–15 kg
Cutting speed range1–400 mm/s
Cutting force measurement unitGrain
Data transferUSB-A, via digital flash drive
Table 2. The physical properties of X39Cr13 stainless steel.
Thermal ExpansionModulus of ElasticityPoisson
Number
Electrical
Resistivity
Electrical
Conductivity
Specific HeatDensityThermal
Conductivity
10−6·K−1GPavΩ·mm2/mS·m/mm2J/(Kg·K)Kg/dm3W/(m·k)
10.52150.27–0.300.551.824607.7030
Table 3. Properties of the material (polyurethane) used as specimens in the study.
ParameterValue
Tensile strength DIN 5350445–50 MPa
Elongation at break DIN 53504450–680%
Abrasion DIN 5351625–50 mm3
Elastomer density1.25–1.30 g/cm3
Shore hardness DIN 5350555–95° ShA
Maximum temperature resistance80 °C
Disclaimer/Publisher’s Note: The statements, opinions and data contained in all publications are solely those of the individual author(s) and contributor(s) and not of MDPI and/or the editor(s). MDPI and/or the editor(s) disclaim responsibility for any injury to people or property resulting from any ideas, methods, instructions or products referred to in the content.

