Article

Evaluation and Economics of Shale Gas Reserves in the Flysch-Eocene Formation of the Jaca Basin

by
Laura M. Valle-Falcones
*,
Carlos Grima-Olmedo
,
Ramón Rodríguez-Pons Esparver
and
Enrique Zamarro-Toves
Departamento de Ingeniería Geológica y Minera, Escuela Técnica Superior de Ingenieros de Minas y Energía, Universidad Politécnica de Madrid, Ríos Rosas, 28003 Madrid, Spain
*
Author to whom correspondence should be addressed.
Appl. Sci. 2023, 13(3), 1732; https://doi.org/10.3390/app13031732
Submission received: 9 December 2022 / Revised: 26 January 2023 / Accepted: 27 January 2023 / Published: 29 January 2023
(This article belongs to the Special Issue Advances in Energy Conservation and Rational Use of Energy)

Abstract

:

Featured Application

The analysis through geological and geophysical techniques of shale gas fields with increased production rate through hydraulic fracturing stimulation, allows increasing national natural gas production and reducing external energy dependence.

Abstract

The new international outlook for the gas sector suggests evaluating exploitable reserves in previously unconsidered areas including hydraulic fracturing technology. In order to estimate the amount of gas in the Jaca Flysch formation, the analysis of geological and geophysical logs and the volumetric method have been used. It has been taking into account the part of the formation likely to contain gas, the porosity (2.65%) calculated from sonic logs with Wyllie’s equation, the water saturation (35.3%) with Archie’s formula, and the initial gas formation volume factor (Bgi), estimated with MHA-P3 software with the reservoir pressure/temperature data 3600 psi/90 °C. The economic analysis of each well has been carried out based on three options, without stimulation, with 50% and 100% stimulation by fracking, and five possible construction costs (7.5–15 MM€). The impact of the use of the fracking technology on the production of the well is about 48%. The production rate and the economic impact that its exploitation would have on the domestic demand for natural gas has been analyzed, resulting in a significant contribution to the national energy mix of between 10–20% of consumption for several years.

1. Introduction

Shale gas reservoirs are located in multiple Paleozoic and Mesozoic formations from the Cambrian to the Cretaceous. These formations have given rise to reservoirs with different properties, depending on the geological environment in which they sedimented.
Shale gas is stored in shales, marls, or gas siltstones, all of which are fine-grained sedimentary rocks rich in organic matter, capable of generating and retaining gas, which can be exploited through unconventional methods. These rocks act both as a source and reservoir of gas, with no traps or seals, which generally gives them a regional distribution. In these reservoirs, methane is present in two different forms, adsorbed on the surface of organic components or in the clay minerals of the shales. They also have very low permeability (micro-nano darcy), making gas extraction difficult and requiring the use of stimulation methods such as hydraulic fracturing.
Shale gas is usually found in very large areas that laterally present highly variable petrophysical properties, requiring significant “in situ” volumes due to their low recovery factor [1]. The advances in horizontal drilling techniques and in well stimulation have made it possible to obtain economically profitable production and to place the significant resources of unconventional gas reservoirs in the reserves category.
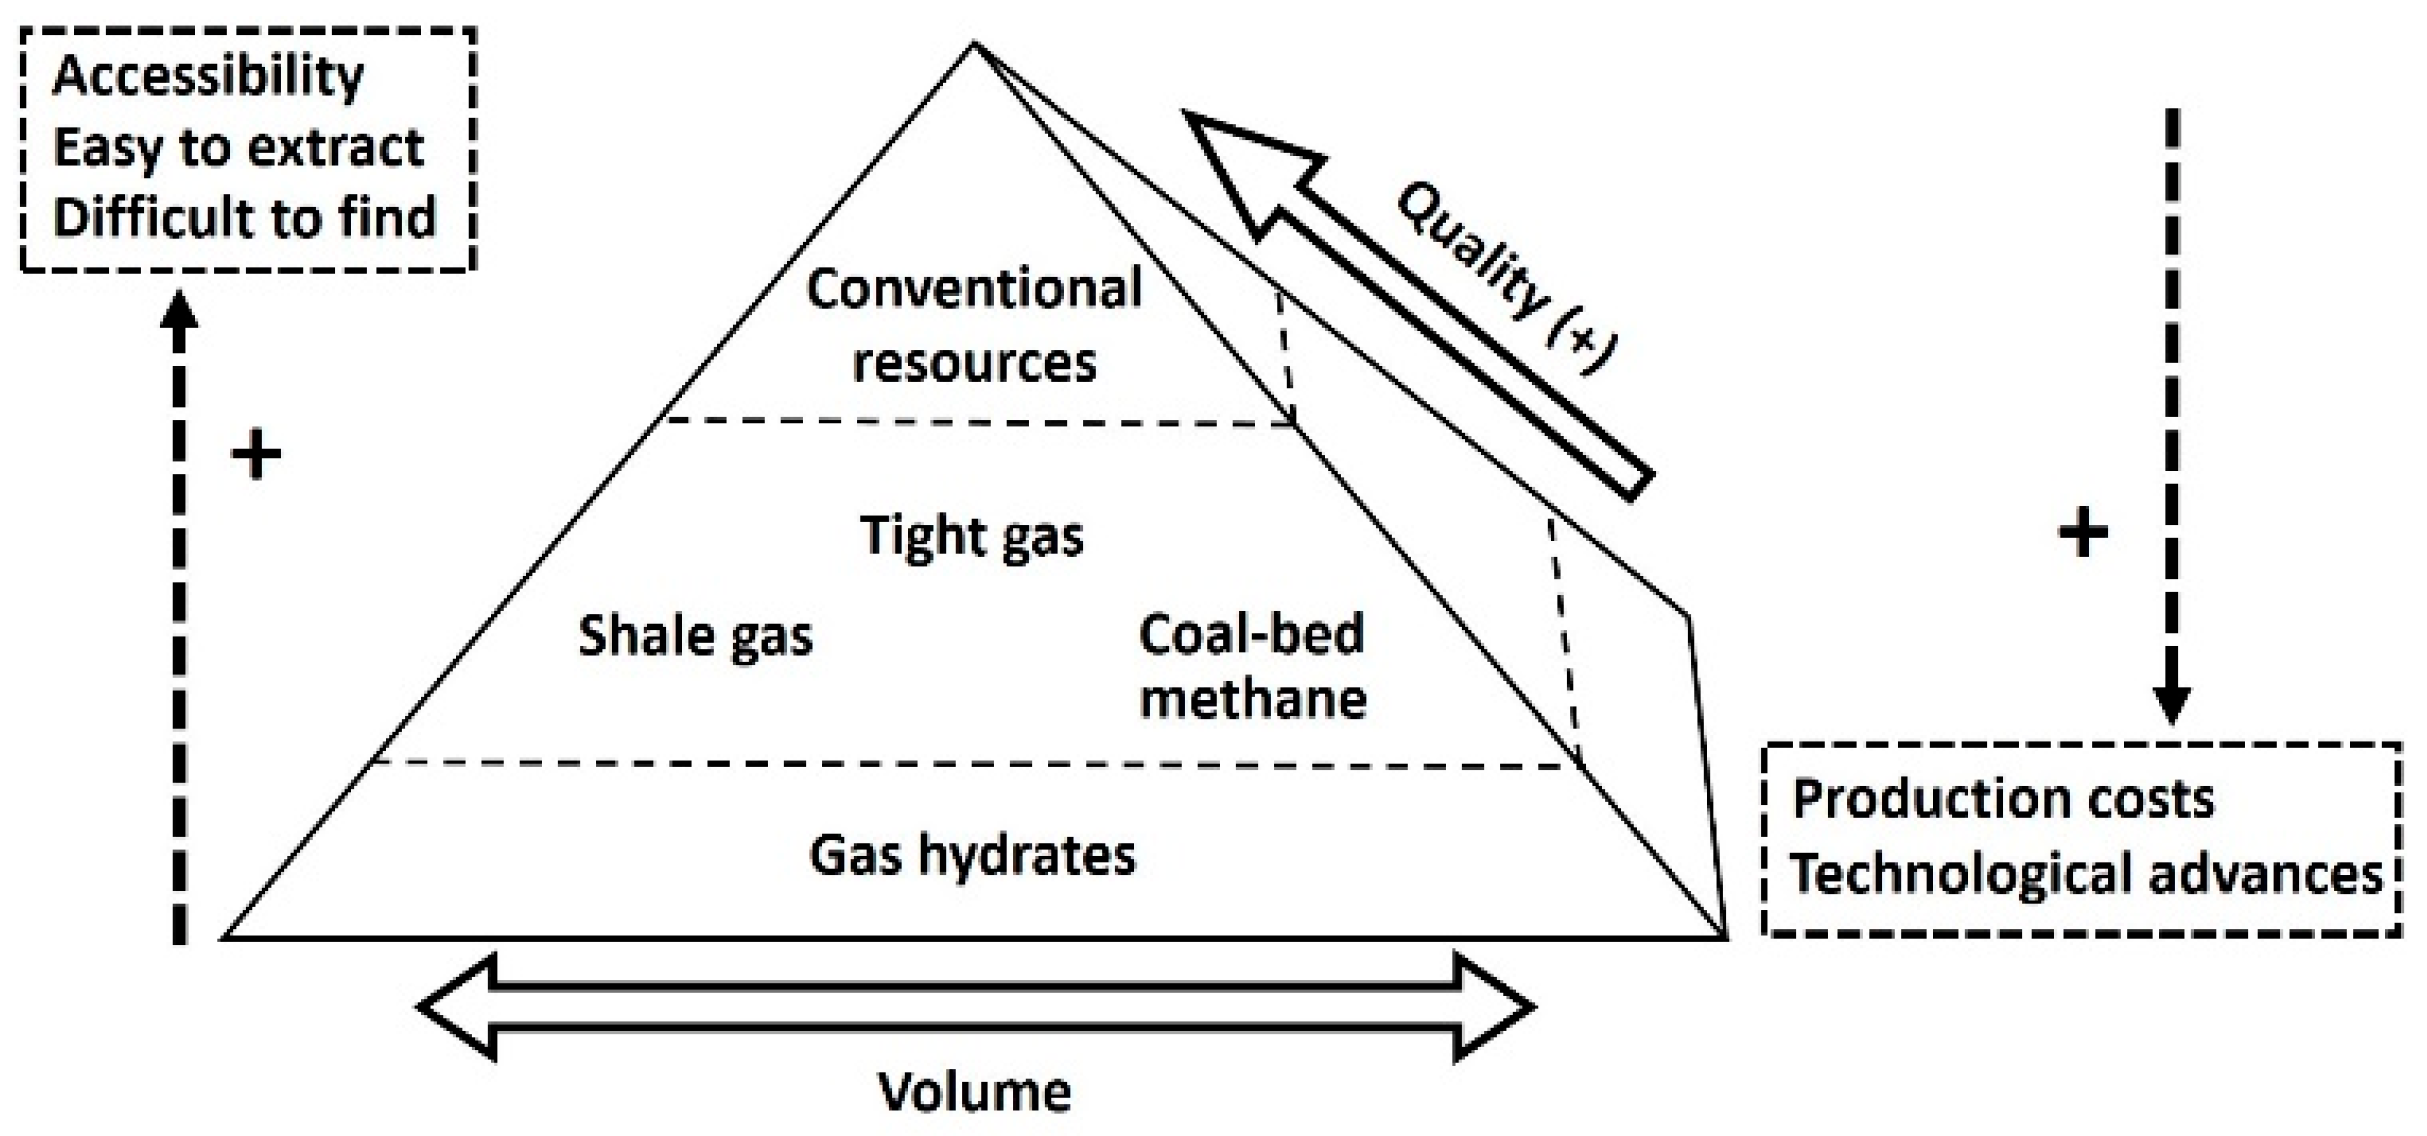
As an alternative to traditional sources of natural gas, depending on their geological characteristics, quality and volume, as well as other factors (accessibility, ease of extraction, location, cost, and production technology), there are four types of unconventional gas [2,3] (Figure 1).
The hydraulic fracturing is a method used to increase the flow rate of oil and gas wells. The production wells are drilled to a depth of 8000–10,000 ft [4,5], and may have horizontal or directional sections. It is performed by pumping into the geological formation the fracturing fluid at high pressure, commonly composed of water (more than 90%), proppant with sand and chemical additives [6]. The injection rate must be sufficient to increase the downhole pressure such that the fracture gradient/pressure gradient equilibrium of the surrounding rock is broken [7,8].
The width of the fractures created is maintained by introducing a proppant into the fluid to prevent them from closing when injection stops and pressure is reduced. The permeability generated allows the flow of formation fluids into the wellbore [9].
The internal pressure of the geological formation causes the injected fracturing fluid to rise to the surface and can be stored in tanks and wells prior to disposal or recycling. The recovered fluid is known as return flow or produced water, which can be managed by discharge to surface water or by underground injection [4,5,6,7,8,9,10].
Worldwide, shale gas resources are estimated at 16,000 Tcf (450 Tcm), of which 510 Tcf (14 Tcm) would be found in Europe: Germany, France, Holland, Austria, and Poland; and about 2000 Tcf (57 Tcm) in North America: USA and Canada. Considering that world conventional gas reserves are on the order of 6400 Tcf (180 Tcm), the potential for shale gas is enormous. On the other hand, they require significant investments, mainly due to the high number of wells that are necessary, usually horizontal, and may be multilateral, requiring multi-stage fracturing. U.S. conventional natural gas production peaked in early 21st century. The supply-side solution seemed to lie in the development of LNG in the Middle East, Africa, Australia, and Russia for import to the U.S. market. The IEA expected that the U.S. would need a high level of LNG imports to meet gas demand [11]. However, shale gas production in the U.S. grew significantly in the 2000–2010 period, from 0.39 Bcf to 4.87 Bcf, representing a 22% increase in dry gas production. The forecast increase in shale gas production to 13.6 Tcf by 2035 would account for 49% of total U.S. gas production [12]. This gas is currently the main driver of natural gas independence in the US [13], and with a significant influence on the world price system of the sector [11,13,14].
On 8 March 2022, the European Commission proposed the outline of a plan to make Europe independent of Russian fossil fuels well before 2030. This plan would transform the European energy system and address the climate crisis [15]. The European Union has included natural gas in the E.U. Taxonomy [16] of clean energy. The “Plan Nacional Integrado de Energía y Clima” 2021–2030 of the Spanish “Ministerio para la Transición Ecológica y el Reto Demográfico” [17] foresees a constant use of natural gas as a primary source of electricity, making it the only hydrocarbon whose consumption is not expected to decline.
The Spanish electricity system relies heavily on the use of natural gas (total Spanish consumption is about 100 MMm3/d) to compensate for the intermittency of wind and solar generation plants. Practically all of the natural gas consumed in Spain is imported (99%) [18]. The countries that supplied natural gas to Spain in 2020 were Algeria (41.0%), the United States (16.9%), and Nigeria (11.0%) [18], with the United States becoming the main supplier in 2022 and an increase in imports of Russian gas in 2022 [19]. None of these countries belongs to the European Union, nor to the so-called Schengen Area. The supply of natural gas is then subject to the bilateral agreements to be established with the supplying countries, affected by the international geopolitical situation and the USD–EUR ratio.
The exploitation of shale gas in Europe is strongly opposed because of its potential environmental and public health impacts, which have been endorsed in the form of protests and bans in several countries and regions [20]. In Spain, any exploration and subsequent production of hydrocarbons is illegal since the entry into force of Law 7/2021, of 20th May, on climate change and energy transition [21].
The absence of exploration in Spain for more than thirty years, unsuccessfully attempted by several companies, which have renounced to dozens of research permits, is the result of media campaigns against fossil fuels and fracking technology [22,23].
The development of exploitation activities in previously unconsidered areas must be supported by consistent studies based on the extensive experience developed in many countries.
This work aims to estimate the existence of enough natural gas reserves in the Jaca Flysch formation, located between the provinces of Huesca and Navarra, by means of the analysis of geological and geophysical logs and the volumetric method. In addition, the rate of production and the economic impact that its possible exploitation would have on the internal demand for natural gas has been analyzed.
The results and conclusions obtained could be taken as a reference for a complete analysis of the rest of the Spanish basins where the presence of shale gas is recognized. It would thus contribute to the European REPowerEU plan in response to global energy market disruptions with the “Recovery and Resilience Mechanism” (RRM) and the “E.U. Energy Platform” (a unified procurement platform) [15].

2. Materials and Methods

2.1. Geology. Discovery of the Jaca Flysch

The exploration and development of shale gas fields requires the integration of numerous disciplines such as geology, geophysics, hydrogeology, geochemistry, and petrophysics [24].
Although Spain’s geography has been little explored with respect to its hydrocarbon reserves, it has favorable depositional environments and pressure regimes similar to other countries. The prospective possibilities of Shale Gas are located in the Basque-Cantabrian, Pyrenean, Ebro, Guadalquivir, and Betic basins, which correspond to Paleogene (Eocene), Cretaceous (Upper and Lower), Lower Jurassic (Lias), and Carboniferous (Westphalian-Eastphalian) areas.
Effective shale volumes are conditioned by organic matter richness, reservoir quality, and adsorption capacity. These parameters are affected by age, depth, organic content, maturity, and mineralogy, with great variation among different formations worldwide. Major shale geological formations include Goldwyer and Shahejie (Paleogene), Vaca Muerta (Cretaceous-Jurassic), Barnett, Bakken and Bowland (Carboniferous), Marcellus, Muskwa, Otter Park and Evie (Devonian), Qiongzhusi, Llandovery, and Longmaxi (Cambrian and Silurian).
Geographically, the area studied covers the pre-Pyrenean zone, framed between the meridians of Pamplona to the W and Boltaña to the E, to the S it is limited by the Ebro depression (Somontano de Huesca and Ribera de Navarra) and to the N by the loamy depression of the Canal de Berdún-Val Ancha and the Aoiz area. Important features include the Sierras Oscenses, which form a continuous elongated front from ESE to WNW. To the north of these mountain ranges, the Tertiary Continental folding gives rise to a moderately rugged relief in which the conglomeratic masses of Canciás, Peña Oroel, San Juan de la Peña, and Peña Izaga stand out due to their elevation [25]. The Jaca Flysch is located in the eastern part of the Pamplona-Jaca Basin (Figure 2).
The producing units are the fractured carbonate megabreccias of Aurín and Jaca, intercalated in the Flysch units (Eocene) that reach a total thickness of 2500 m, and are divided into (Figure 3) [26]:
  • Lower carbonate Flysch. Carbonate breccias intercalated with sands and clays, 150–300 m thick. Recognized as the source rock of the Serrablo Field.
  • Sandy Flysch. Submarine turbiditic sands with intercalations of carbonate mega-layers (Gallego, Aurín, Suprajaca and Jaca), 10–100 m thick.
  • Upper Flysch. Similar to sandy Flysch, but without megalayers.
  • Blue marls. They are interfingered with the Flysch acting as a seal.
The Serrablo field is a case of a gas trap in carbonate megabasins formed by a conglomerated and brecciated basal zone, where gas is produced mainly through fractures. Each producing megabasin has an independent gas-water contact. The marl and clay deposits along with other levels of the Flysch sequence constitute the source rock for the generated hydrocarbons, which migrated and were trapped in structures created during the later stages of thrust [27].
The field began production in the 1980s, when several exploratory boreholes were drilled near the town of Sabiñánigo (Huesca) [28]. The Flysch and the carbonate series were identified, both with the presence of natural gas with an approximate methane content of 98%.
The Serrablo 1–5 wells allowed estimating Flysch reserves of at least 25 Bsm3. Twenty three drillings were carried out to characterize the reservoir, with companies such as Hispanoil and Eniepsa interested in its possible exploitation.
At the beginning of 1984, the area that was put into production was the carbonate rocks. The Zaragoza-Serrablo gas pipeline was built to connect the field with the existing gas pipeline network managed by Enagás [29].
At the end of the 1990s, the field ceased to be exploited because the reserves proved to be lower than expected. These old fields have recently been used as a natural gas storage facility managed by Enagás.
Drilling was also carried out in the region of Navarra where traces of natural gas were found when crossing the aforementioned Flysch.
The Jaca Flysch extends from the region of Navarra to approximately the border between Aragón and Cataluña. The area highlighted in red dots in the stratigraphic column of Figure 3 shows the location of the Flysch, with no evidence of gas found along its entire extent. (Figure 4).
From the analysis of the data collected by a previous study of the Petrophysical Institute Foundation (IPf) [26], the wells that did identify natural gas were Pamplona-2, Pamplona-3, Aoiz-1, San Vicente-1, Serrablo-13, Serrablo-7, and Ayerbe de Broto-1. These drillings are compiled in the IGME/CSIC (Spanish National Research Council) lithological database [28], where the column of the different lithologies crossed by each one of them is found.
In the Serrablo-13 well, a production test was carried out in the Flysch, giving a ¼ choke flow for about 500 h over a period of 31 days. At 25 h, a flow rate of 13,000 sm3/d was measured and after ten days it dropped to 5300 sm3/d and 117 psi at the wellhead [26].

2.2. Estimated Volume of Flysch Reserves

The volumetric method has been used to estimate the amount of gas in the reservoir (Flysch), taking into account the part of the formation susceptible to host gas (NTG), porosity, and gas saturation (Equation (1)).
OGIP = A · Hgross · NTG · · 1 Swi Bgi
Geochemical studies on samples from several wells indicate that the Eocene sediments have a low organic matter content (TOC 0.6%) with a degree of maturity (Ro 1.0–1.3%) in the dark shale interval, formed by clayey limestones intercalated with marls [30]. These values can be compensated by the large accumulation of shales whose volume can be deduced from the thickness of the layers of the drillhole columns [31,32].

2.2.1. Flysch Thickness

The thickness of the Flysch varies depending on the geographical area in which it is located. We can know its thickness with the existing wells and extrapolate the results in areas where there are no logs (Table 1).
Since exact data on which part of the Flysch contains gas and which does not are unknown, an estimate will be made that the NTG is of 50%.

2.2.2. Porosity

The Flysch porosity has been calculated from sonic logs using the Wyllie equation. [33] (Equation (2)).
= Δ t Δ tma Δ tf Δ tma
The transit time has been taken for the Aoiz-1 well, which is the one with logs in the Flysch formation. The data extracted from this well are as follows (Table 2).
An average value is obtained from the logs Δt of 58.5 μs/ft. In turn, the values of Δtma and Δtf can be approximated, respectively at 46.5 μs/ft and 500 μs/ft for a mostly gas content. A formation porosity value of 2.65% is obtained.

2.2.3. Water Saturation

Water saturation was calculated using the formula of Archie et al. [34] (Equation (3)).
Sw n = a   Rw m · Rt
The formation resistivity (Rt) 235 ohm/m has been obtained directly from the electrical logs. The Pamplona-3 well has been used, as it is the only one for which these logs are available, estimating that the rest of the formation has the same resistive parameters. The resistivity of water (Rw) at the formation temperature (about 90 °C) is 0.03146 ohm/m.
Taking the value 2.0 for the saturation (n) and cementation (m) exponents, and 1.0 for the tortuosity factor (a), we obtain with the formation porosity (2.65%) a water saturation value of 35.3%.

2.2.4. Gas Formation Initial Volume Factor

The volumetric method estimates the reserves in the reservoir and requires a factor (Bgi), which relates these reserves in the reservoir to their volume at surface.
The MHA-P3 software developed by the company Malkewicz Hueni Associates, Inc (Golden, CO, USA) was used to estimate it [35]. By entering the reservoir pressure/temperature data 3600 psi/90 °C, we have obtained the results of Figure 5.
As can be observed, for a pressure close to 3670 psi, the volumetric factor is 0.004632 (rm3/sm3).

2.2.5. Reserves (OGIP)

An estimate of the gas reserves in the field is made with the data previously obtained (Table 3). For this estimation, it has been considered that the radius of influence of each well studied is 3 km, and therefore, the area of influence of each vertical well (considered within the Flysch containing reserves) is 28.27 km2.
In total there are an estimated of 498 Bsm3, applying a recovery factor of 5% and 10% of the reserves, this results in a respective OGIP of 24.88 Bsm3 and 49.77 Bsm3.

3. Results

3.1. Production of the Flysch

The annual production estimates have been calculated based on the tests performed in the Serrablo-13 well, carried out by Hispanoil and Eniepsa, integrated at that time within the National Institute of Industry (INI). Additionally, production stimulations using hydraulic fracturing technology have been considered.

3.1.1. Production of the Well

Production estimates have been calculated and represented based on three options, case 1: well without stimulation, case 2: well with 50% stimulation by fracking, and case 3: well with 100% stimulation by fracking (Table 4 and Figure 6).
The increase in production with the fracking technique is based on existing studies [6,9,11].

3.1.2. Total Production

The geographical area in which the site is located is very mountainous and has several nature reserves [36]. Due to this, it has been estimated that only 50% of the surface area (Figure 4) could accommodate production wells, resulting in an approximate production area of 518,921 acres (2100 km2).
Several studies [28,37] indicate, for the drilling of gas wells, optimal area of influence of 75–120 acres (0.3–0.45 km2). Considering an area of 100 acres between wells, 5190 vertical wells could be drilled to exploit the reservoir. For economic and environmental reasons, it is advisable to consider a multiple horizontal production technique, typical of hydraulic fracturing developments, which reduces the number of vertical wells required.
Considering the theoretical number of wells that can be drilled, it is possible to estimate, for the reservoir, the first year’s production, the average of the 2nd–7th year and the total cumulative production based on the three options considered (Table 5).

3.2. Well Economic Analysis

An economic study was conducted on the basis of a single well to analyze the profitability of the field as a whole. Significant investments are necessary for the execution of a large number of wells, usually horizontal, which may be multi-lateral, requiring a multi-stage fracturing method.
The most important factors to be taken into account during field development are: OGIP, the extent of the field (number of wells), the depth and direction of the wells (field characteristics), the selling price of the gas, the existence of a local market or nearby pipelines for its transportation, and the environmental safety.
The price of energy in the E.U. depends on a variety of different supply and demand conditions, including the geopolitical situation, the national energy mix, the import diversification, the grid costs, the environmental protection costs, the adverse weather conditions and the tax levels (Figure 7). The gas price used in the calculations is the corresponding price for Spain in 2019, 0.1082 €/kWh (Eurostat) [38]. It has been estimated as constant, due to the fact that the medium-term outlook does not foresee a drop in price to 2020 or earlier levels.
Well costs depend on where the wells are drilled, how deep they are drilled and whether they are vertical or horizontal. In the USA, the construction cost of a 5280 ft horizontal well with a vertical depth of about 7000 ft is between 3–5 MM USD In Europe these costs are likely to be higher.
The economic analysis of a well has been carried out based on 3 options: no stimulation, 50% and 100% stimulation by fracking; and 5 possible construction costs: 7.5–15 MMEUR (Figure 8). These costs include the preparation of the land where the well will be located, the complete drilling and the well structure itself. A well abandonment cost of 300,000 EUR each has also been taken into account.
Fixed costs have been estimated at 100,000 EUR per year, including personnel costs, while variable costs, including maintenance or possible eventualities, will be estimated at 0.2 EUR/1000 scf of gas extracted.
In case 1, open hole, the investment per well is not economically profitable since the resulting NPV is negative. However, the whole is still profitable unless the cost per well is around 15 MM EUR. Since natural gas is included in the EU Taxonomy [16], energy transition grants are available that would make the operation viable even if fracking technology is not used. It would be a case of giving priority to national supply, even if it is not as economically profitable as the other options (cases 2 and 3).
Given the potential benefits, both economically and in terms of security of supply, more comprehensive studies [39] would be required to fully characterize the reservoir and be able to more accurately assess its profitability.

4. Discussion

4.1. Impact on the Gas Sector

In 2019, around 38,000 MMm3 of natural gas [18] was consumed in Spain for electricity generation, and industrial and residential use, representing a growth of 14.57% over 2018. In 2020 it dropped to 34,000 MMm3 due to the effects of the pandemic.
Estimated first-year production rates vary depending on whether or not fracking is used, but range between 20,000 and 38,000 MMm3.
Figure 6 shows a high gas production obtained in the first year, which declines rapidly during the following years. Economically, production could be stopped after the tenth year, due to the poor yield obtained. However, this decision would be subject to changes in gas prices and improvements in the techniques used to produce the field.
The impact of the use of the fracking technique on the production of the well is also noted. The difference between case 1 and case 3 production in the first year is about 48%, a value similar to the difference in total production over the 20 years.
To make a more accurate approximation of the impact, the average production from the second to the seventh year is used, since no more than 5000 vertical wells can be put into production at the same time in the first year. A more realistic production is considered to be the sum of wells that are starting production and wells that have been in production for several years or even abandoned wells.
An average production between 4000 and 8000 MMm3 would represent between 10% and 20% of consumption over several years. A 100% stimulation with fracking is close to the annual gas consumption rate for electricity, which in 2019 was 28% of the total consumed [18].
The peak of natural gas consumption in Spain was reached in 2008 with 42,000 MMm3. The country’s 20-year growth projections could suggest that this target will be reached and may be exceeded. Overall, over 20 years, it is estimated that around 800,000 MMm3 of natural gas could be consumed.
With the previously estimated 20-year production of the reservoir (Table 5), the percentage that its exploitation would represent varies between slightly less than 10% and 18%. These percentages are very representative of a single field, in addition to the positive economic impact it would have on the country. Since there are several natural gas fields within the Spanish territory, similar to the one studied, imports of this energy resource could be reduced, thus reducing energy dependence.

4.2. Required Infrastructures

In order to guarantee the transportation of the natural gas produced, infrastructures such as pipelines and auxiliary facilities are required. As a consequence of the gas projects developed in the Pamplona-Jaca Basin, there is a underground storage facility, nearby compressor stations (EC), and transport centers (CT) where the maintenance, operation, and control activities of the Spanish gas pipeline network (width 0.51 m, pressure 35–72 bar) are coordinated [29]. There are also nearby international connections (CI) at Irún and Larrau, to facilitate the sale of natural gas to other European countries (Figure 9).

4.3. Environmental Challenges

With the continued expansion of natural gas production, the environmental issues associated with shale gas have become increasingly controversial. In fact, the potential environmental impacts have exerted a significant negative influence on public opinion, which is slowing and even halting the development of shale gas exploration and production due to several factors [11].
Further stimulation of production by hydraulic fracturing (case 3 in Table 4) carries greater environmental implications and liabilities related to water use, possible contamination of aquifers, and induced seismicity.
The high depth of the fissures created with respect to the location of possible freshwater aquifers and a lateral/vertical extension ratio of approximately 4/1 reduce the risk of contamination. The greatest risks identified by the researchers depend on the integrity of the wells, and the quality of the casing and cementing, with the greater or lesser degree of stimulation being practically negligible. During sequential injection, the wellbore zones already fractured are isolated and, as a consequence, the increase in seismicity produced during the generation of new fissures is very limited.

4.3.1. Use of Large Volumes of Water

Shale gas production consumes a large volume of freshwater that depends on the fracturing operations, the depth and length of the well, the properties of the fracturing fluid, and the fracture design. Typically, 2 to 4 million gallons (7571–15,142 MMm3) of water are needed per horizontal shale gas well [40,41].
One way to offset the large water requirements of hydraulic fracturing is to recycle the flow back or produced water from the fracturing process [42] by adding additional chemicals as well as fresh water to make up a new fracturing solution. However, water reuse presents problems due to the high concentrations of compounds and TDS contained in the return flow [43].

4.3.2. Potential Water Contamination

Although some of the chemicals used are harmless to the environment [44,45], others are classified as toxic and carcinogenic and are more or less likely to affect human health. [6,11,46]. Safety measures must be taken during transportation, storage, and disposal at the drilling sites [11,43], and the volumes of liquid and solid wastes generated must be properly treated to avoid contaminating the soil and surface water.
The production of shale gas without applying good practices can lead to environmental contamination, for example, the propagation of fractures can lead to the discharge of contaminated water into surrounding aquifers [47,48,49,50,51,52]. For direct contamination of underground drinking water aquifers to occur, it is necessary for the hydrofractures to propagate several thousand feet beyond the upper boundary of the target formation through many rock layers.
Another factor to consider and assess is the risk of well integrity failure, with particular attention to the surrounding cement and casing [43,53]. If the annulus is poorly sealed, natural gas, fracturing fluids, and formation water with high TDS concentrations can communicate directly from outside the target formation wellbore with intermediate rock layers and drinking water aquifers [11,43].
Several tools are available to help producers and regulators minimize the risk of cement and casing failures. The American Petroleum Institute (API) develops and updates standards and recommended practices for oil and gas exploration and production activities.

4.3.3. Emissions of CH4 and CO2

The main component (90%) of shale gas, methane (CH4), can contaminate both water [47,49] and air [54], as well as active drilling sites [47].
The general consensus based on IPCC reports [55] is that natural gas emits about half as much carbon as coal used in efficient power plants. The official IEA [56,57] and US EPA [58] reports on carbon emissions from fossil fuel combustion are also based on this consensus. Methane is a very potent greenhouse gas, although it remains only one-tenth of the time in the atmosphere compared to carbon dioxide.
The carbon footprint is an indicator of the effect and life cycle of greenhouse gases [59]. Determining the influence of shale gas on climate change is complex and controversial, in part because of uncertainty about the extent of methane leakage [60,61,62,63].
When comparing the emissions between the use of coal, conventional gas, and shale gas in power generation (MJe) [64], the greenhouse impact of natural gas is only as bad as that of coal when taking into account a methane leakage rate of 7.9% and a short global warming period of 20 years.
For leakage rates of less than 2%, the impact of shale gas is close to one-third of that produced by coal, and methane leakage is a negligible part of the greenhouse forcing compared to the CO2 released during the combustion process [62].

4.3.4. Earthquakes Induced

A number of studies [43,53,65] indicate that fracking drilling to exploit shale gas could cause earthquakes as it aims to break up the rock, which could affect nearby constructions. However, in multistage hydraulic fracturing (sequenced in 10–20 stages), the induced microseisms are so small that they can only be detected using high-sensitivity seismometers placed in nearby monitoring wells.
Microseismic events occurring in the stimulated portion of the reservoir are distributed in the rock around each of the hydraulic fracture planes. Formation permeability is increased, allowing gas molecules to flow more easily into the production liner. If monitored seismic activity is not detected at significant distances above or below, it means that the fracturing design successfully confined the stimulation to the target formation [43].
Subsurface fluid injection is also an integral part not only of hydraulic fracturing, but also of wastewater disposal in injection wells, some geothermal energy projects, and carbon dioxide sequestration processes.

4.3.5. Impacts on Health

Critical information on the potential environmental and public health impact of shale gas extraction technology has not been taken into account during the early stages of exploitation. As a result, there is a lack of response to address regulatory and public concerns, especially for workers in the industry [66,67,68,69,70].
Strong regulatory oversight is an important factor in ensuring environmental and public protection. In the case of the USA, some aspects of shale gas development are regulated by the Clean Water Law, the Clean Air Law [71,72], and the Safe Drinking Water Law [43].

5. Conclusions

The recent increase in energy prices is making European consumers vulnerable. In order to face the new international scenario of the gas sector, it is convenient to estimate its own exploitable reserves, including hydraulic fracturing technology.
Spain has the capacity to use hydraulic fracturing technology to supply itself with natural gas. Although consumption would still be much higher than existing reserves, a complementary domestic natural gas extraction industry can be generated, reducing foreign dependence on other countries.
The Jaca Flysch site is one of the possible sites that can be exploited in Spain. Its possible exploration and exploitation are restricted by Law 7/2021, of 20th of May, on climate change and energy transition, which expressly prohibits the exploration and extraction of hydrocarbons [21].
The average production proposed in this study would make a significant contribution to the energy mix and would represent between 10% and 20% of national consumption for several years, highlighting the potential in areas similar to the Jaca basin to increase natural gas production by around 48% through the use of hydraulic fracturing.
This technology is in question due to the consequences on the environment if the environmental risks involved are not effectively managed [56]. However, there are procedures and best practices that can help manage and minimize these risks [20], even if it means increasing the cost of a typical well by 7%.
This study proposes a series of actions to ensure sustainable development of Flysch exploitation as it is considered that public confidence in the safety of hydraulic fracturing would be greatly improved by more frequent microseismic monitoring and public dissemination of the results. The establishment of an independent Well Examiner to guarantee the integrity of the wells, verifying through reports the correct design and drilling system, is also proposed.
It is concluded that it is possible to carry out a profitable and sustainable production of natural gas with hydraulic fracturing technology in Spain, limiting the study to the Jaca Flysch, so that it is possible to continue using natural gas as part of the energy mix, contributing to the transition and the reduction of the energy dependence on other countries.

Author Contributions

Conceptualization, L.M.V.-F., C.G.-O. and E.Z.-T.; supervision, L.M.V.-F. and C.G.-O.; validation, L.M.V.-F., C.G.-O. and R.R.-P.E.; writing—original draft, L.M.V.-F., C.G.-O. and E.Z.-T.; writing—review and editing, L.M.V.-F., C.G.-O. and R.R.-P.E. All authors have read and agreed to the published version of the manuscript.

Funding

This research was funded by the Oil and Gas Engineering Master’s degree (mip) of the Universidad Politécnica de Madrid (UPM), which is taught at the Escuela Técnica Superior de Ingenieros de Minas y Energía (ETSIME).

Institutional Review Board Statement

Not applicable.

Informed Consent Statement

Not applicable.

Data Availability Statement

Not applicable.

Conflicts of Interest

The authors declare no conflict of interest.

Abbreviation

AArea
aTortuosity factor
Bcf/mBillion cubic feet/meters
BgiGas formation volume factor (rcf/scf)
Bsm3Billion standard cubic meters
ftFeet
HgrossThickness (ft)
MMsm3Millions standard cubic meters
mCementation exponent 1.7–3.0 (usually 2.0)
nSaturation exponent 1.8–4.0 (usually 2.0)
rcf/m3Reservoir cubic feet/meters
RtFormation resistivity (ohm/m)
RwWater resistivity at formation temperature (ohm/m)
scfStandard cubic feet
sm3/dStandard cubic meter/day
SwWater saturation (%)
SwiIrreducible water saturation (%)
Tcf/mTrillion cubic feet/meters
ΔtTransit time through formation (μs/ft)
ΔtfTransit time through fluid (μs/ft)
ΔtmaTransit time through matrix, formation without fluid (μs/ft)
Porosity (%)
IRRInternal rate of return
LNGLiquefied natural gas
NPVNet present value
NTGNet to gross (%)
OGIPOriginal gas in place (sm3)
RoThermal maturity (%)
TDSTotal dissolved solids (mg/L, ppm)
TOCTotal organic carbon (%)

References

  1. Martínez Orío, R. Estudio de las áreas con potencial de shale gas en el principado de Asturias. In Realización de un Estudio Hidrogeológico en Estructuras Geológicas Relevantes y Con Potencial Actividad Económica; Convenio Específico de Colaboración Principado de Asturias-IGME: Madrid, Spain, 2014. [Google Scholar]
  2. Ghosh, T.K.; Prelas, M.A. Energy resources and systems. In Fundamentals and Non-Renewable Resources; Springer: Berlin, Germany, 2009; Volume 1. [Google Scholar]
  3. EIA’s Energy in Brief: What Is Shale Gas and Why Is It Important? 2010. Available online: http://www.eia.doe.gov/energy_in_brief/about_shale_gas.cfm (accessed on 12 May 2022).
  4. Gidley, J.L.; Holditch, S.A.; Nierode, D.E.; Veatch, R.W., Jr. Recent Advances in Hydraulic Fracturing; SPE Monograph Series; Society of Petroleum Engineers: Richardson, TX, USA, 1990; Volume 12, 464p. [Google Scholar]
  5. EPA. Hydraulic Fracturing Background Information; US Environmental Protection Agency, Ed.; US Environmental Protection Agency: Washington, DC, USA, 2012. [Google Scholar]
  6. Sáenz de Santa María Benedet, J.A.; Gutiérrez Claverol, M. Valoración de la técnica de fracturación hidráulica y su aplicación a la extracción de gas no convencional en las cuencas carbonífera y jurásica de Asturias. Trab. Geol. 2013, 33, 201–229. [Google Scholar]
  7. Broderick, J.; Anderson, K.; Wood, R.; Gilbert, P.; Sharmina, M.; Footitt, A.; Glynn, S.; Nicholls, F. Shale Gas: An Updated Assessment of Environmental and Climate Change Impacts; Tyndall Centre University of Manchester: Manchester, UK, 2011; pp. 1–125. [Google Scholar]
  8. Hazen and Sawyer Environmental Engineers & Scientists. Impact Assessment of Natural Gas Production in the New York City Water Supply Watershed. Final Impact Assessmet Report. December 2009. Available online: https://www.google.com.hk/url?sa=t&rct=j&q=&esrc=s&source=web&cd=&ved=2ahUKEwi4gPfz5ev8AhXUO3AKHdzOAFcQFnoECAkQAQ&url=http%3A%2F%2Fwww.aqlpa.com%2Fsites%2Fass-010-aqlpa%2Ffiles%2Ffiles%2Fgaz%2520de%2520schiste%2Fimpact_assessment_of_natural_gas_production.pdf&usg=AOvVaw2q6mQ44e65SStLvQHCZ7qr (accessed on 26 January 2023).
  9. Modern Shale Gas Development in the United States: A Primer; U.S. Department of Energy Office of Fossil Energy, National Energy Technology Laboratory: Washington, DC, USA, 2009.
  10. Fjær, E.; Holt, R.M.; Horsrud, P.; Raaen, A.M.; Risnes, R. Chapter 11 Mechanics of hydraulic fracturing. Dev. Pet. Sci. 2008, 53, 369–390. [Google Scholar] [CrossRef]
  11. Qiang, W.; Xi, C.; Awadhesh, N.J.; Howard, R. Natural gas from shale formation-The evolution, evidences and challenges of shale gas revolution in United States. Renew. Sustain. Energy Rev. 2014, 30, 1–28. [Google Scholar] [CrossRef]
  12. EIA. Annual Energy Outlook 2012; US Energy Information Administration: Washington, DC, USA, 2012. [Google Scholar]
  13. Annual Energy Outlook 2020 with Projections to 2050. 29 January 2020. #AEO2020. Available online: www.eia.gov/aeo (accessed on 8 May 2022).
  14. Rascoe, A. US Lawmakers Press DOE to Speed LNG Export Review; Reuters: London, UK, 2012. [Google Scholar]
  15. REPowerEu; Affordable, Secure and Sustainable Energy for Europe. Available online: https://ec.europa.eu/info/strategy/priorities-2019-2024/european-green-deal/repowereu-affordable-secure-and-sustainable-energy-europe_es (accessed on 4 July 2022).
  16. European Union. EU Taxonomy 2022. Available online: https://eur-lex.europa.eu/legal-content/EN/TXT/?uri=PI_COM%3AC%282022%29631&qid=1647359214328#document1 (accessed on 30 May 2022).
  17. Plan Nacional Integrado de Energía y Clima (PNIEC) 2021–2030. Available online: https://www.miteco.gob.es/es/prensa/pniec.aspx (accessed on 12 August 2022).
  18. Comisión Nacional de los Mercados y la Competencia. 2020. Informe de Supervisión del Mercado de Gas Natural en España. 2019. Available online: https://www.cnmc.es/listado/sucesos_energia_mercado_gas_informes_anuales_gas/block/250 (accessed on 4 July 2022).
  19. El Mercado del Gas en España. Epdata 2022. Available online: https://www.epdata.es/datos/mercado-gas-espana-graficos/614 (accessed on 18 May 2022).
  20. Bickle, M.; Roberts, J.; Goodman, D.; Selley, R.; Mair, R.; Shipton, Z.; Thomas, H.; Walker, A.; Woods, E.; Younger, P. Shale Gas Extraction in the UK: A Review of Hydraulic Fracturing; Joint Report; The Royal Society and The Royal Academy of Engineering: London, UK, 2012. [Google Scholar]
  21. Boletín Oficial del Estado. Ley 7, 2021, de 20 de Mayo, de Cambio Climático y Transición Energética. Available online: https://www.boe.es/eli/es/l/2021/05/20/7/con (accessed on 12 May 2022).
  22. Estadísticas Prospección y Producción de Hidrocarburos. Ministerio para la Transición Ecológica y el Reto Demográfico. Available online: https://energia.gob.es/petroleo/Exploracion/EstadisticasPetroleo/Paginas/IndexEstad%c3%adsticas.aspx (accessed on 20 June 2022).
  23. Del Olmo, W.M. The Spanish Petroleum Systems and the Overlooked Areas and Targets. Bol. Geol. Min. 2019, 130, 289–315. [Google Scholar]
  24. Mani, D.; Kalpana, M.S.; Patil, D.J.; Dayal, A.M. Chapter 3—Organic Matter in Gas Shales: Origin, Evolution, and Characterization. Explor. Environ. Econ. Impacts 2017, 25–54. [Google Scholar] [CrossRef]
  25. Puigdefábregas, C. La Sedimentación Molásica en la Cuenca de Jaca. CSIC, 1975. MON EEP 104, p. 188. Available online: http://hdl.handle.net/10261/82989 (accessed on 9 June 2022).
  26. Rodriguez, R.; Álvarez, V.; Muñoz, A. Shale Gas & Tight Gas. Oportunidades de Desarrollo en España. Proyecto “Flysch de Jaca”; Documentación interna de trabajo; Fundación Instituto Petrofísico: Getafe, Spain, 2009. [Google Scholar]
  27. Camara, P.; Pedro, J.; Moreno, J. Serrablo gas field: An example of a trap in syntectonic brecciated reservoirs, Pyrenees (Spain). AAPG Bull. 1988, 72, 8–15. [Google Scholar]
  28. Licencias de Prospección Petrolera (Permisos y Licencias Investigación Hidrocarburos). Archivo Técnico de Hidrocarburos (ATH). Ministerio para la Transición Ecológica y el Reto Demográfico. Available online: https://sede.serviciosmin.gob.es/es-ES/Paginas/aviso.aspx#Reutilizacion (accessed on 8 May 2022).
  29. Mapa de Infraestructuras de Enagás en España. Enagás. (Julio 13 2021). Available online: https://www.enagas.es/enagas/en/Transporte_de_gas/TransporteYOperacion/MapaInfraestructuras (accessed on 11 July 2022).
  30. Arenillas González, A.; Molinero, R.; García Crespo, J.; Mediato Arribas, J.F.; Nita, R. Shale Gas Assesment in Spain: Basin and Formation Description. 2017. Available online: https://digital.csic.es/handle/10261/273194 (accessed on 20 January 2023).
  31. Şen, Ş. Prediction of fluid oil and gas volumes of shales with a deep learning model and its application to the Bakken and Marcellus shales. Sci. Rep. 2022, 12, 20842. [Google Scholar] [CrossRef]
  32. Ehsan, M.; Gu, H.; Akhtar, M.M.; Abbasi, S.S.; Ullah, Z. Identification of Hydrocarbon Potential of Talhar Shale: Member of Lower Goru Formation Using Well Logs Derived Parameters, Southern Lower Indus Basin, Pakistan. J. Earth Sci. 2018, 29, 587–593. [Google Scholar] [CrossRef]
  33. Glover, P. Petrophysics MSc Course Notes; Sonic (Acoustic) Log.; Department of Geology and Petroleum Geology, University of Aberdeen: Aberdeen, UK, 1998; pp. 172–197. [Google Scholar]
  34. Archie, G.E. Classification of Carbonate Reservoir Rocks and Petrophysical Considerations. AAPG Bull. 1952, 36, 278–298. [Google Scholar] [CrossRef]
  35. Malkewicz Hueni Associates Inc. MHA-P3; Malkewicz Hueni Associates Inc.: Golden, CO, USA, 2002. [Google Scholar]
  36. Red Natura 2000. Red Ecológica Europea de Áreas de Conservación de la Biodiversidad. Vicepresidencia Tercera del Gobierno. Ministerio para la Transición Ecológica y el Reto Demográfico. Available online: https://www.miteco.gob.es/es/biodiversidad/temas/espacios-protegidos/red-natura-2000/ (accessed on 14 June 2022).
  37. Fanchi, J.R. 8—Well Testing. In Integrated Reservoir Asset Management: Principles and Best Practices; Gulf Professional Publishing: Houston, TX, USA, 2010; pp. 125–144. [Google Scholar] [CrossRef]
  38. Eurostat (Online Data codes: nrg_pc_202 and 203). Second Half 2021. Available online: https://ec.europa.eu/eurostat/statistics-explained/index.php?title=Natural_gas_price_statistics (accessed on 8 June 2022).
  39. Boning, Z.; Baochao, S.; Yulong, Z.; Liehui, Z. Review of Formation and Gas Characteristics in Shale Gas Reservoirs. Energies 2020, 13, 5427. [Google Scholar] [CrossRef]
  40. Plan to Study the Potential Impacts of Hydraulic Fracturing on Drinking Water Resources; U.S. Environmental Protection Agency: Washington, DC, USA, 2011; p. 174.
  41. Water management associated with hydraulic fracturing. API Guidance Document HF2, 1st ed.; American Petroleum Institute: Washington, DC, USA, 2010. [Google Scholar]
  42. Veil, J.A.; Environmental Science Division. Water Management Technologies Used by Marcellus Shale Gas Producers; Argonne National Lab (ANL): Argonne, IL, USA, 2010. [Google Scholar] [CrossRef] [Green Version]
  43. Zoback, M.; Kitasei, S.; Copithorne, B. Addressing the Environmental Risks from Shale Gas Development; Worldwatch Institute: Washington, DC, USA, 2010. [Google Scholar]
  44. EPA. Proceedings of the Technical Workshops for the Hydraulic Fracturing Study: Chemical & Analytical Methods; US Environmental Protection Agency: Washington, DC, USA, 2011. [Google Scholar]
  45. Jackson, R.B.; Pearson, B.R.; Osborn, S.G.; Warner, N.R.; Vengosh, A. Research and Policy Recommendations for Hydraulic Fracturing and Shale—Gas Extraction; Center on Global Change, Duke University: Durham, NC, USA, 2011. [Google Scholar]
  46. Arthur, J.; Bohm, B.; Coughlin, B.J.; Layne, M.; Cornue, D. Evaluating the environmental implications of hydraulic fracturing in shale gas reservoirs. In Proceedings of the SPE Americas E&P Environmental and Safety Conference, San Antonio, TX, USA, 23–25 March 2009. [Google Scholar] [CrossRef] [Green Version]
  47. Osborn, S.G.; Vengosh, A.M.; Warner, N.R.; Jackson, R.B. Methane contamination of drinking water accompanying gas-well drilling and hydraulic fracturing. Proc. Natl. Acad. Sci. USA 2011, 108, 8172–8176. [Google Scholar] [CrossRef] [Green Version]
  48. Schon, S.C. Hydraulic fracturing not responsible for methane migration. Proc. Natl. Acad. Sci. USA 2011, 108, E664. [Google Scholar] [CrossRef] [Green Version]
  49. Warner, N.R.; Jackson, R.B.; Darrah, T.H.; Osborn, S.G.; Down, A.; Zhao, K.; White, A.; Vengosh, A. Geochemical evidence for possible natural migration of Marcellus formation brine to shallow aquifers in Pennsylvania. Proc. Natl. Acad. Sci. USA 2012, 109, 11961–11966. [Google Scholar] [CrossRef] [Green Version]
  50. Rahm, B.G.; Bates, J.T.; Bertoia, L.R.; Galford, A.E.; Yoxtheimer, D.A.; Riha, S.J. Wastewater management and Marcellus Shale gas development: Trends, drivers, and planning implications. J. Environ. Manag. 2013, 120, 105–113. [Google Scholar] [CrossRef]
  51. Rozell, D.J.; Reaven, S.J. Water pollution risk associated with natural gas extraction from the Marcellus shale. Risk Anal. 2012, 32, 1382–1393. [Google Scholar] [CrossRef]
  52. Nicot, J.P.; Scanlon, B.R. Water use for shale-gas production in Texas. US. Environ. Sci. Technol. 2012, 46, 3580–3586. [Google Scholar] [CrossRef]
  53. Kargbo, D.M.; Wilhelm, R.G.; Campbell, D.J. Natural gas plays in the Marcellus shale: Challenges and potential opportunities. Environ. Sci. Technol. 2010, 44, 5679–5684. [Google Scholar] [CrossRef]
  54. COP26-Glasgow Agreements. Available online: https://www.un.org/es/climatechange/cop26 (accessed on 8 June 2022).
  55. IPCC Guidelines for National Greenhouse Gas Inventories; The Intergovernmental Panel on Climate Change: Geneva, Switzerland, 2006.
  56. US Energy-Related CO2 Emissions Rose 6% in 2021 (13th May 2021). Today Energy. US Energy Information Administration. Available online: https://www.eia.gov/todayinenergy/detail.php?id=52380#:~:text=In%202021%2C%20U.S.%20energy%2Drelated,19%20pandemic%20began%20to%20subside (accessed on 14 July 2022).
  57. Global Energy Review: CO2 Emissions in 2021—Analysis—IEA. Available online: https://www.iea.org/reports/global-energy-review-co2-emissions-in-2021-2 (accessed on 14 July 2022).
  58. EPA. Inventory of U.S. Greenhouse Gas Emissions and Sinks: 1990–2020; U.S. Environmental Protection Agency: Washington, DC, USA, 2022; Available online: https://www.epa.gov/ghgemissions/inventory-us-greenhouse-gas-emissions-and-sinks (accessed on 27 May 2022).
  59. Matthews, H.S.; Hendrickson, C.T.; Weber, C.L. The importance of carbon footprint estimation boundaries. Environ. Sci. Technol. 2008, 42, 5839–5842. [Google Scholar] [CrossRef] [Green Version]
  60. Wigley, T. Coal to gas: The influence of methane leakage. Clim. Chang. 2011, 108, 601–608. [Google Scholar] [CrossRef] [Green Version]
  61. Townsend Small, A.; Tyler, S.C.; Pataki, D.E.; Xu, X.; Christensen, L.E. Isotopic measurements of atmospheric methane in Los Angeles, California, USA: Influence of fugitive fossil fuel emissions. J. Geophys. Res. 2012, 117, D7. [Google Scholar] [CrossRef]
  62. Cathles, L.; Brown, L.; Taam, M.; Hunter, A. A commentary on the greenhouse-gas footprint of natural gas in shale formations. Clim. Chang. 2012, 113, 525–535. [Google Scholar] [CrossRef] [Green Version]
  63. Cokar, M.; Ford, B.; Gieg, L.M.; Kallos, M.S.; Gates, I.D. Reactive reservoir simulation of biogenic shallow shale gas systems enabled by experimentally determined methane generation rates. Energy Fuels 2013, 27, 2413–2421. [Google Scholar] [CrossRef]
  64. Stephenson, T.; Valle, J.E.; Riera-Palou, X. Modeling the relative GHG emissions of conventional and shale gas production. Environ. Sci. Technol. 2011, 45, 10757–10764. [Google Scholar] [CrossRef] [PubMed]
  65. Das, I.; Zoback, M.D. Long-period, long-duration seismic events during hydraulic fracture stimulation of a shale gas reservoir. Lead. Edge 2011, 30, 778–786. [Google Scholar] [CrossRef]
  66. Finkel, M.; Hays, J.; Law, A. The shale gas boom and the need for rational policy. Am. J. Public Health 2013, 103, 1161–1163. [Google Scholar] [CrossRef]
  67. IOM (Institute of Medicine). Health Impact Assessment of Shale Gas Extraction: Workshop Summary; The National Academies Press: Washington, DC, USA, 2014. [Google Scholar]
  68. McDermott-Levy, R.; Kaktins, N.; Sattler, B. Fracking the environment, and health. AJN Am. J. Nurs. 2013, 113, 45–51. [Google Scholar] [CrossRef]
  69. Schmidt, C.W. Blind rush? Shale gas boom proceeds amid human health questions. Environ. Health Perspect. 2011, 119, 348–353. [Google Scholar] [CrossRef]
  70. Holzman, D.C. Methane found in well water near fracking sites. Environ. Health Perspect. 2011, 119, 119–289. [Google Scholar] [CrossRef]
  71. Litovitz, A.; Curtright, A.; Abramzon, S.; Burger, N.; Samaras, C. Estimation of regional air-quality damages from Marcellus Shale natural gas extraction in Pennsylvania. Environ. Res. Lett. 2013, 8, 014017. [Google Scholar] [CrossRef]
  72. Oil and Natural Gas Sector: New Source Performance Standards and National Emission Standards for Hazardous Air Pollutants Reviews; U.S. Environmental Protection Agency: Washington, DC, USA, 2018; pp. 52738–52843.
Figure 1. Pyramid of the main conventional and unconventional natural gas resources.
Applsci 13 01732 g001
Figure 2. Geological map of the Jaca Basin (modified from the “Instituto Geológico y Minero de España”, cartographic viewer).
Applsci 13 01732 g002
Figure 3. Stratigraphic column of the Flysch and geological section of the Pamplona Jaca Basin [26].
Applsci 13 01732 g003
Figure 4. Location map of the Jaca Flysch [26].
Applsci 13 01732 g004
Figure 5. MHA-P3 software results for Bgi [35].
Applsci 13 01732 g005
Figure 6. Estimated production based on production data from the Serrablo-13 well. Case 1: open well, Case 2: open well +50% fracking, Case 3: open well +100% fracking.
Applsci 13 01732 g006
Figure 7. Natural gas prices household and non-household consumers (Eurostat) [38].
Applsci 13 01732 g007
Figure 8. NPV (Net Present Value) and IRR (Internal Rate of Return) of the well.
Applsci 13 01732 g008aApplsci 13 01732 g008b
Figure 9. Map of Enagás infrastructures in Spain [29].
Applsci 13 01732 g009
Table 1. Productive layer thickness in each of the wells (Hgross).
WellTop-Bottom Measurement (ft)Thickness of the Layer (ft)
Pamplona-2* 0–1446.851446.85
Pamplona-3* 0–1295.931295.93
Aoiz-1* 0–1391.081391.08
San Vicente-16253.27–14,750.658497.38
Serrablo-13656.16–11,154.8510,498.69
Serrablo-72595.14–10,672.568077.43
* The Flysch was the first layer drilled in the well.
Table 2. Transit time through formation.
Depth (m)50100150200250300350400
Δ t μ s / ft 63645047.56568.56050
Table 3. Calculated volume of gas reserves in each well.
WellThickness (m)OGIP (Bsm3)
Pamplona-244123.07
Pamplona-339520.67
Aoiz-142422.18
San Vicente-12590135.53
Serrablo-133200167.45
Serrablo-72462128.83
Total 497.75
Considering NTG = 0.5, and the area of influence per well of 28.27 km2.
Table 4. Well production data.
Production (MMsm3)
OpcionesAnnual Year 1stCumulative 20 Years
Case 1Open hole3.8314.96
Case 2Open hole + 50% fracking5.6921.58
Case 3Open hole + 100% fracking7.3928.61
Table 5. Estimated field production data.
Estimated Field Production (MMsm3)
Case 1: Open HoleCase 2: Open Hole +50% FrackingCase 3: Open Hole +100% Fracking
First year19,887.729,531.138,354.1
Average 2nd–7th year4054.585994.157914.71
Cumulative 20 years77,642.4112,000.2148,485.9
Disclaimer/Publisher’s Note: The statements, opinions and data contained in all publications are solely those of the individual author(s) and contributor(s) and not of MDPI and/or the editor(s). MDPI and/or the editor(s) disclaim responsibility for any injury to people or property resulting from any ideas, methods, instructions or products referred to in the content.

