1. Introduction
People’s beliefs and diplomatic systems have influenced police responses to delinquency [
1]. In recent years, technological advancements in social media, information, and communication technology have made it easier to schedule and advertise demonstrations, protests, and other forms of improvised activism for the public to compel policymakers [
2].
It is essential to anticipate such manifestations to defend against their supposed destruction and suffering. Initial large-scale protests that attract millions of people often turn into lethal altercations between protesters and security forces, starting a vicious cycle of violence that the authorities are powerless to break [
3]. It is mandatory to copy and obtain the prospective data, i.e., the exact date, time, location, and type of demonstration available on social networks using crawlers to obtain a precise picture of upcoming social activism in real time [
4].
To reduce the ambiguity of information gathered from social networks, the natural language processing (NLP) approach is used to gain the desired outcome [
5]. In Pakistan, being a multilingual territory, we face several issues in linguistic planning [
6]. Technically, it is challenging to obtain desired information from the large volume of data obtained from various sources and languages in multiple formats [
7]. Another serious issue to be addressed involves removing inevitable noise found in crawled data that need to be cleaned, which could easily feed to natural language processors [
8]. Moreover, public emotions could be identified based on the popularity of tweets as emotional tweets gain more attention [
9]. Popular words related to Twitter posts can be used to obtain the classification of sentiments [
10].
In the last decade, the micro-blogging website Twitter played a significant role in planning and managing campaigns that led to major anti-government gatherings, i.e., protests, demonstrations, assemblies, rallies, sit-ins, marches, etc., for democratic claims in the federal and provincial capital cities of Pakistan. Our primary emphasis of this research is to generate real-time alarms to warn the police force regarding anticipated anti-government public gatherings, e.g., protests, demonstrations, assemblies, rallies, sit-ins, marches, etc., to avoid chaos.
For the first time in Pakistan, we implemented an alert system for government authorities to help them identify the date, time, and location of upcoming anti-government gatherings. Tweets in English and Roman Urdu were analyzed in this system to forecast and detect protests, demonstrations, assemblies, rallies, sit-ins, marches, etc., in real time. Data sets were collected from Twitter via Twitter API v2; then data were cleaned and processed for named entity recognition, i.e., times, dates, and locations of upcoming gatherings along with the public sentiment.
The key contributions of this research are as follows.
Keyword-based extraction of public tweets about upcoming anti-government gatherings in English and Roman Urdu using Twitter API v2.
Sentiment analysis (SA) of tweets (i.e., to know anti-government sentiments in order to help government authorities plan security deployments). Different machine learning classifiers were used with a combination of vectorization techniques. The performance and efficiency in terms of accuracy and precision were compared and analyzed. This research on sentiment analysis (SA) helped improve the response efficiency of the police force to deal with emerging threats, advance crowd control, and plan management in Lahore, Pakistan.
Intelligent computer analytics in real time minimizes human intervention that helps to reduce operational costs and errors.
This research monitored the law and order situation in Lahore, Pakistan, by automating police intelligence.
The most repeated words in the data set were visualized in language models, i.e., bigram and trigram.
2. Related Works
Several studies were carried out to examine how protests were planned and promoted on social media [
11]. Data obtained from social media platforms were found to be useful in the development of real-world applications [
12]. Several machine learning (ML) techniques can be applied to Twitter data to find early indications of social unrest and public sentiments [
13].
The naïve Bayes classifier is a probabilistic classifier based on the Bayes theorem; it is commonly used for text classification tasks. This has been used in several studies for sentiment analysis and text classification [
14].
Garca-Moya et al. (2016) [
15] focused on the sentiment analysis from Twitter data using naïve Bayes classifiers; multinomial naïve Bayesian (MNB) and Gaussian naïve Bayesian (GNB) exhibited accuracies of 78.1% and 76.9%, respectively. In the study, Mohammed et al. (2017) [
16] examine the effectiveness of naïve Bayes classifiers, specifically multinomial naïve Bayes (MNB) and Gaussian naïve Bayes (GNB) algorithms for sentiment analyses from Twitter data. The authors reported that the MNB classifier achieved an accuracy of 82.3% and the GNB classifier achieved an accuracy of 81.6% in sentiment classification. These results demonstrated the potential usefulness of naïve Bayes classifiers for sentiment analysis from social media data.
Mishler et al. (2017) [
17] presented a method for identifying tweets related to social unrest through text filtering and classification. The study proposed a system that used natural language processing techniques to filter tweets and classified them based on their relevance to social unrest. The system was evaluated using tweets from real-world events and the results show that it was able to accurately identify relevant tweets. They investigated the protests following the Arab Spring using tweet data and support vector machine (SVM) to predict future disturbances, achieving a precision of 88%. Koc and Cetin (2019) [
18] classified tweets related to protest events according to their sentiment. They used machine learning approaches to train a sentiment classifier on a data set of labeled tweets. The models used in the study were support vector machine (SVM), naïve Bayes (NB), and k-nearest neighbor (k-NN). They evaluated the performances of the models and found that the SVM model achieved the highest accuracy of 92.1%. The study shows that the machine learning approach is effective in the sentiment classification of tweets about protest events.
Soltani et al. (2020) [
19] presented a study that classified tweets related to the yellow vests movement (YVM), according to their sentiments. They used machine learning approaches to train a sentiment classifier on a data set of labeled tweets. The authors used multiple models, including logistic regression (LR), random forest (RF), support vector machine (SVM), and multi-layer perceptron (MLP) were used. They evaluated the performance of the models and found that the random forest model achieved the highest accuracy of 93.1%. The study demonstrates that machine learning techniques can effectively classify tweets related to the Yellow Vests Movement according to sentiment. Meanwhile, Wang et al. (2021) [
20] used a hybrid approach, a combination of random forest (RF) along with the SMOT SVM machine, which gave better results in terms of regression and accuracy in the classification study of diabetes mellitus. Fitri et al. (2019) [
21], in their case study, discussed an anti-Lesbian, gay, bisexual, and transgender (LGBT) campaign in Indonesia; they found public sentiments by using Twitter data, whether negative or positive. When compared to the decision tree and random forest tree, the naïve Bayesian classification algorithm yielded 86.43% of the results, while the decision tree and random forest tree yielded 83.91% of the findings.
Deep learning models have been proposed for sentiment analyses from social media data, including tweets related to protests.
Gao et al. (2021) [
22] used a combination of convolutional neural networks (CNNs) and long short-term memory (LSTM), along with a support vector machine (SVM) classifier to analyze public sentiment about the Black Lives Matter movement on Twitter. They achieved an accuracy of 87.3%, and the combination of CNNs and LSTMs performed better than using either technique alone; SVM was more effective than other classifiers. The study concludes that this method is effective for sentiment analyses from tweets related to social movements, such as Black Lives Matter. The observational study, authored by Hussain et al. (2021) [
23], used NLP and machine learning techniques to analyze public attitudes toward COVID-19 vaccines on social media in the UK and the US. A pre-trained deep learning model, bidirectional encoder representations from transformers (BERT), was used to extract features from the text, and a bag-of-words representation and SVM algorithm were used to classify tweets and Facebook posts as positive, negative, or neutral. The overall accuracy of the algorithm was around 80%.
In a study conducted by Hussain et al. (2022) [
24], a combination of traditional machine learning methods and deep learning (DL) techniques were used to classify tweets into different categories. The study employed a hybrid ensemble model that combined state-of-the-art lexicon rule-based and deep learning-based approaches to analyze sentiment trends related to the main vaccines available in the United Kingdom. The aim of the study was to evaluate the frequency and nature of adverse events following immunization (AEFI)-related mentions on social media in the UK and provide insight into public sentiment toward COVID-19 vaccines. The study used a two-step approach to extract and analyze over 121,406 relevant Twitter and Facebook posts. Results indicated an increasing trend in the number of AEFI mentions on social media; public sentiment toward vaccines (and their manufacturers) was largely positive.
Studies have suggested that sentiment analysis from Twitter data can be useful in identifying patterns of public sentiment and opinions during civil unrest. Machine learning methods helped in achieving better accuracy [
25]. Studies about sentiment analyses provided valuable insight for policymakers and other authorities to enhance their understanding of the dynamics of a given situation and respond in an appropriate manner [
26].
3. Methodology
The micro-blogging website Twitter is a free platform where people can express themselves about their surroundings [
27]. Twitter can be used to follow real-time events [
28].
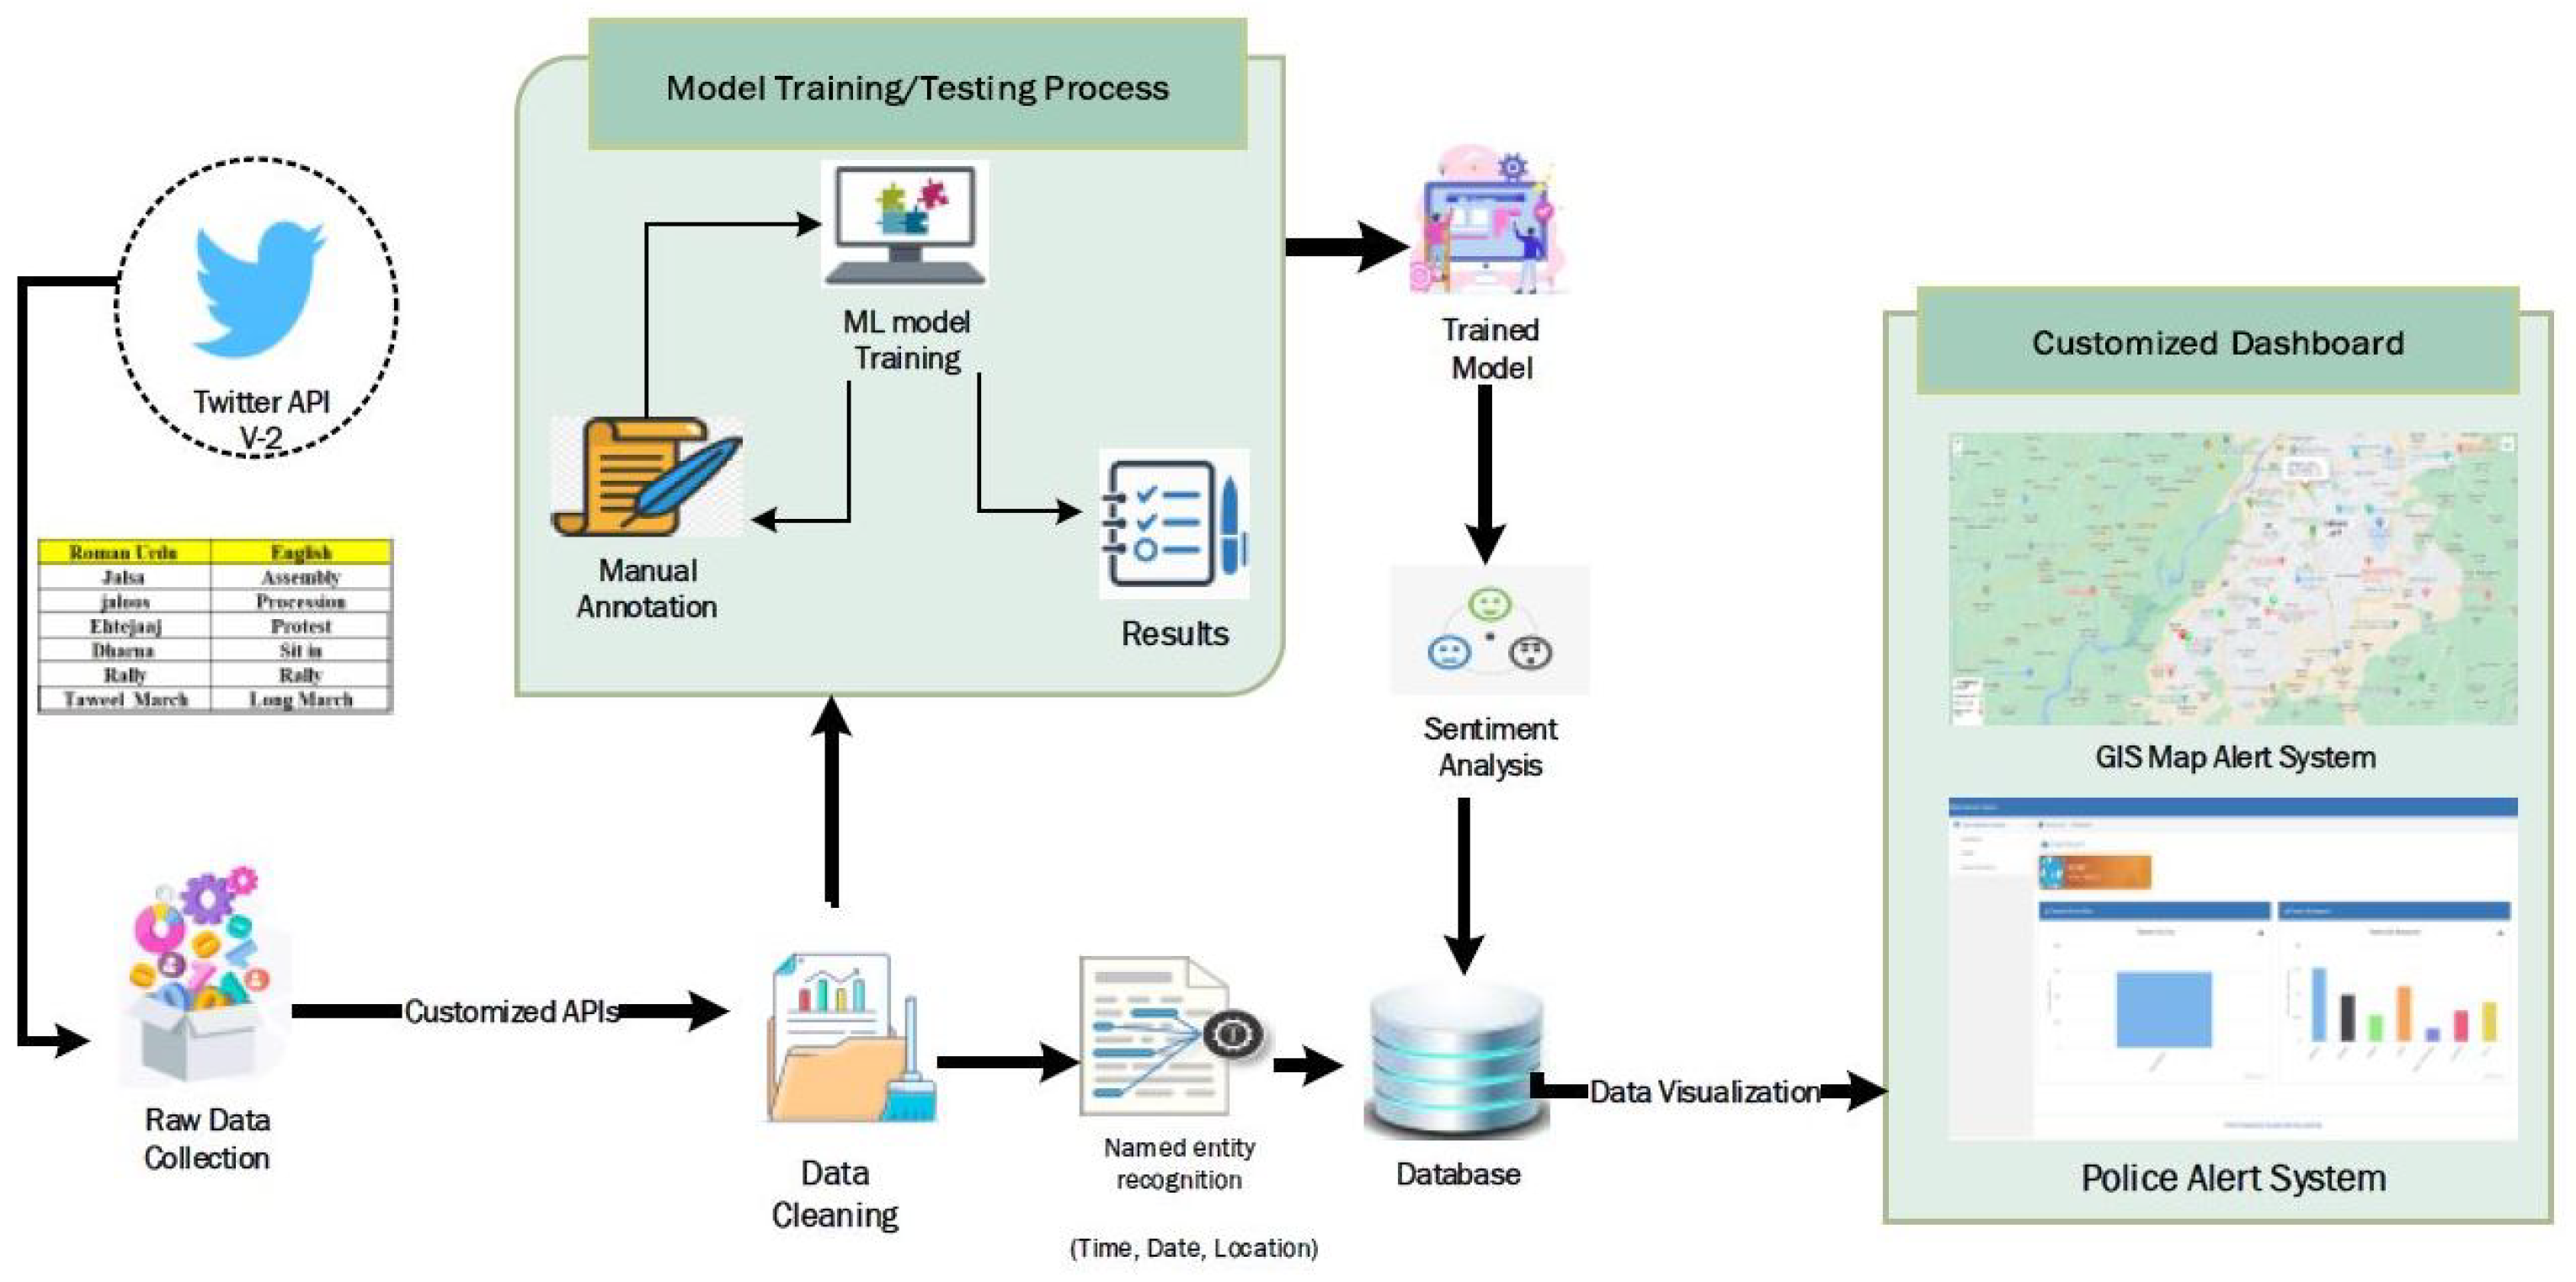
Figure 1 shows the overall architecture and process of various tasks to analyze sentiments. It shows how our suggested system operates. To identify impending demonstrations, named entity recognition, such as time, date, and location, were extracted and stored in the database. Sentiment analysis was then used to determine how the general public felt about the protests.
3.1. Data Collection
Data collection was the first step in the completion of the work. In our project, we used Twitter API v2, which crawled the Twitter data available in the form of tweets based on keywords targeting the geographical location (Lahore, Pakistan). The alert system generates alerts for law enforcement agencies for upcoming protests, demonstrations, assemblies, rallies, sit-ins, marches, etc., in Lahore, Pakistan. From the information gathered, the targeted tweets related the keywords; people over the internet use different spellings for the same word in Roman Urdu as there are no hard and fast rules or uniform patterns. In Roman Urdu, people use mixed/combined phrases and words of both Urdu and English. Basically, it is Urdu but written in the English alphabet, commonly used by people who can speak Urdu but cannot read the Arabic style of Urdu. English is the most commonly used language on the internet; therefore, most people in Pakistan write on social media in Roman Urdu. For example, the Roman Urdu word ‘Ehtajaaj’ (English meaning ‘protest’) can be written in various forms, such as ‘ihtijaaj’, ‘ehtejaj’, ‘ahtjaj’, ‘ehtijaj’, ‘ehtajaj’, etc. Our system targeted the tweets with specific words related to protests in English and Roman Urdu. As spellings vary from person to person in every tweet, our data dictionary holds the variants of each expected word in English and Roman Urdu. The text files are generated against each keyword found in the tweets to save the related tweets separately.
3.2. Data Cleaning
The data used in processing were extracted from Twitter in raw form (textual format only), which made data cleaning easy. The data processing and cleaning process is given below.
3.2.1. Noise Removal
Tweet texts hold a sequence of characters (regular expressions), stopping words, special characters, and emojis. It was important to remove these to obtain clean data.
Table A1 lists the stop words recognized in English and Roman Urdu.
3.2.2. Link Removal
As in tweets, people mention links and URLs to redirect to other pages and other sites. Therefore, it was necessary to remove links from the data to obtain accurate and target data for analysis.
3.2.3. Hashtags and Symbols Removal
People use hashtags and multiple symbols in their tweets to highlight various aspects of real-life events or as speech expressions. Hashtags and symbol removal are necessary for preparing text for analysis. Our system was implemented in Python, the REGEX library, which was used to remove the regular expressions from obtained data. Special characters, such as @, &, *, and hashtags were removed.
3.2.4. Conversion to Lowercase
The cleaned data set was converted to lowercase letters to gain uniformity in the data set. It helps computers in fast and steady computation and helps to avoid errors.
3.3. Extraction of Gathering Attributes
Extracting attributes or entities from the text after cleaning the text was important to obtain the details of upcoming events. Keywords extracted for our system were as follows.
The time mentioned for the protest in the specific tweet;
The date mentioned for the protest in the specific tweet;
The location mentioned for the protest in the specific tweet.
Time and date from tweet content helped in discovering when the gatherings (especially protests, demonstrations, assemblies, rallies, sit-ins, marches, etc.) were going to happen. The location from the tweet helped us find the location of the upcoming public gathering. Time, date, and location were extracted from the content of tweets. Data extracted were saved in the database to receive insight into upcoming anti-government gatherings, i.e., protests, demonstrations, assemblies, rallies, sit-ins, marches, etc.
3.4. Manual Annotation of Tweets in Roman Urdu
A team of domain specialists manually annotated the extracted Twitter data set to obtain intelligent results. The annotation guidelines were defined in the context of our research and discussed and shared with domain experts to reduce complexity. The annotation rules defined are given in
Table A3. The rules defined targeted anti-government tweets. The annotation rules lie in the range of five classes, −1, −0.5, 0, +0.5, +1. Where −1 stands for a high negative value (anti-government sentiments), −0.5 represents a partial negative value, 0 stands for neutral, 0.5 for partial positive, and value 1 (pro-government sentiment) was considered a positive sentiment. Sample tweets are given below in
Table 1.
3.5. Vectorization Process
The vectorization process helps with the testing and training of large data sets. The vectorization process reduced the time complexity of real-time applications. The reliability of our model was enhanced by the vectorization of the data set by using two vectorization techniques, i.e., TFIDF and count vectorization.
3.5.1. Count Vectorization
Our data set was vectorized using a count vector in the python sci-kit learn package. By using this technique, the textual data were transformed into numeric form. The vectors generated were equal in dimension. They increased the flexibility of the feature extraction module. Before feeding our processed data to the training module, they were converted to vector form.
3.5.2. TFIDF (Term Frequency–Inverse Document Frequency)
The TFIDF (term frequency–inverse document frequency) vectorization technique was used to overcome the vulnerabilities of count vectors. This technique identifies how important the word is in the context of the problem. It avoids words that are high in repetition but picks words that make sense. The data are broken down into sentence form to pick up the feature. Equation (
1) is given below
where ‘t’ is the term, ‘d’ is a document, and ‘D’ is a corpus of documents. TF indicates the frequency of the word that occurs in each document in the sample. It is the ratio of the number of times a word occurs in a report to the total words contained in that record. It increases in proportion to the number of times that the term appears in the database. Inverse data frequency (IDF) is used to calculate the prevalence of rare words across all reports in the database. Words that appear seldom in the corpus have a high IDF score.
3.6. Model Training by Machine Learning Classifiers
A brief overview of ML classifiers used in our research for sentiment analysis is given below.
3.6.1. Random Forest (RF)
A RF is a classifier consisting of a collection of trees. RF is constructed when any input fed to the classifier in vector form is x, and the random sample trees picked from the original data are the same as the original data in size. The
k is a random vector picked from the
tree and is independent of past random vectors that are denoted by
, which shows the independent sampling from previously distributed data. Sample bootstrapping as T is initially derived from training data. A large number of trees are then generated, k = 1, ..., K (usually K >= 100). The random forest then classifies x by taking the most popular voted class from all of the tree predictors in the forest [
29].
Using RF in data set training gave high accuracy as new samples of data obtained from tweets were predicted.
The RF classifier reduced the correlation as it works on a random feature selection pattern.
Variance is reduced as every feature is not selected for the training set.
Regression problems were overcome as the average predictions from each tree were considered.
3.6.2. Decision Tree (DT)
A decision tree works on a rule-based approach and is a supervised ML algorithm. They make decisions, such as human beings based on rules fed to algorithms. They can perform classification as well as regression. A decision tree is also known as a classification and regression tree (CART).
Equation (
3) for DT represents the Gini impurity, which is a matrix used in the generation of DT to identify how the features of a data set should be partitioned into nodes to form the tree. Equation (
3) can be defined as a data set D that contains samples from c classes. The probability of samples belonging to class i at a given node can be denoted as
Then the Gini Impurity of data set D can be defined as:
where the Gini impurity is used for the classification of impure data; it is calculated by subtracting the total of the squared probability of each class out of one. It promotes larger partitions that are simple to implement, whereas information gain prefers smaller partitions with different values [
30].
The addition of a new feature adds a new class to the tree. Every new query adds a new node to the tree. The first node is generally called the root node of the tree and the last node after which no further split happened in the tree is known as the leaf node of the tree.
The decision tree used for
Visualization of the tree;
Pre-processing is not required;
All types of data are handled by the tree nicely.
3.6.3. Multinomial Naïve Bayes (MNB)
We trained our data set with MNB. As the name suggests, the MNB is an upgraded version of the Bayes theorem that works with probabilities.
Equation (
4) is derived from the naïve Bayesian theorem to find the likelihood of class A with B.
where P(A) denotes the prior probability of class A. P(B) denotes the prior probability of class B. P(B|A) denotes the occurrence of predictor B given the class A probability.
The mathematical expression for the MNB classifier is in Equation (
5)
Equation (
5) shows that prior
is the quotient. Where the numerator is estimated as the factorial of the sum of all features
In turn, the denominator is obtained as a product of all feature
factorials. The numerator is evaluated as a probability distribution, which is the likelihood of all possible outcomes where S occurred in document D from class
.
MNB is very easy and simple to implement as well; probabilities are calculated on real-time applications.
It works well with continuous and discrete data types, handles large data sets with ease, and is scalable.
MNB only works with textual data; numeric data are not handled.
MNB is unable to address the regression problems accurately.
In our case, we obtained our data in real time from Twitter and in textual form; the probability and likelihood were calculated by the use of the MNB classifier; therefore, textual data were assigned to word classes for categorizing purposes. The frequency of words did not affect the classification of data.
3.6.4. Gaussian Naïve Bayes (GNB)
GNB is based on the Bayes theorem. It is more effective with continuous data sets, continuous features, and models that have a normal (Gaussian) distribution. Equation (
6) is derived as:
We assume that r follows a Gaussian or normal distribution; we must substitute the probability density of the normal distribution and name it GNB. To compute this formula, one needs the mean and variance of w. In Equation (
6),
and
are the variance and mean of the continuous variable w, computed for a given class c of r.
The variance in Equation (
6) is assumed as
Independent of w (i.e., ;
Independent of r (i.e., ;
Or independent of both.
GNB:
Handles continuous large data sets with high flexibility and it works well with large data sets.
It can be applied to complex and nonlinear problems.
It is highly independent.
Good results can be obtained only on the large data set.
3.6.5. Support Vector Machine (SVM)
SVM is a supervised learning model used for regression and classification. A support vector machine is a statistical learning algorithm [
31]. Equation (
7) explains the ArgMax for SVM. It is common for multi-class classification models to predict a vector of probabilities (or probability-like values), with one probability for each class label. The probabilities represent the likelihood that a sample belongs to each class label.
where w represents the weight matrix, b is bias, and X and Y are dependent and independent variables.
As for SVM:
SVM is memory efficient.
It is a highly-dimensional space if the number of dimensions is greater than the number of samples.
A custom kernel could be specified and support common kernel functions as well.
If the number of features is much greater than the sample, over-fitting in the selecting kernel functions shall be evaded.
Five-fold cross-validation is expensive to use as SVM does not estimate probabilities.
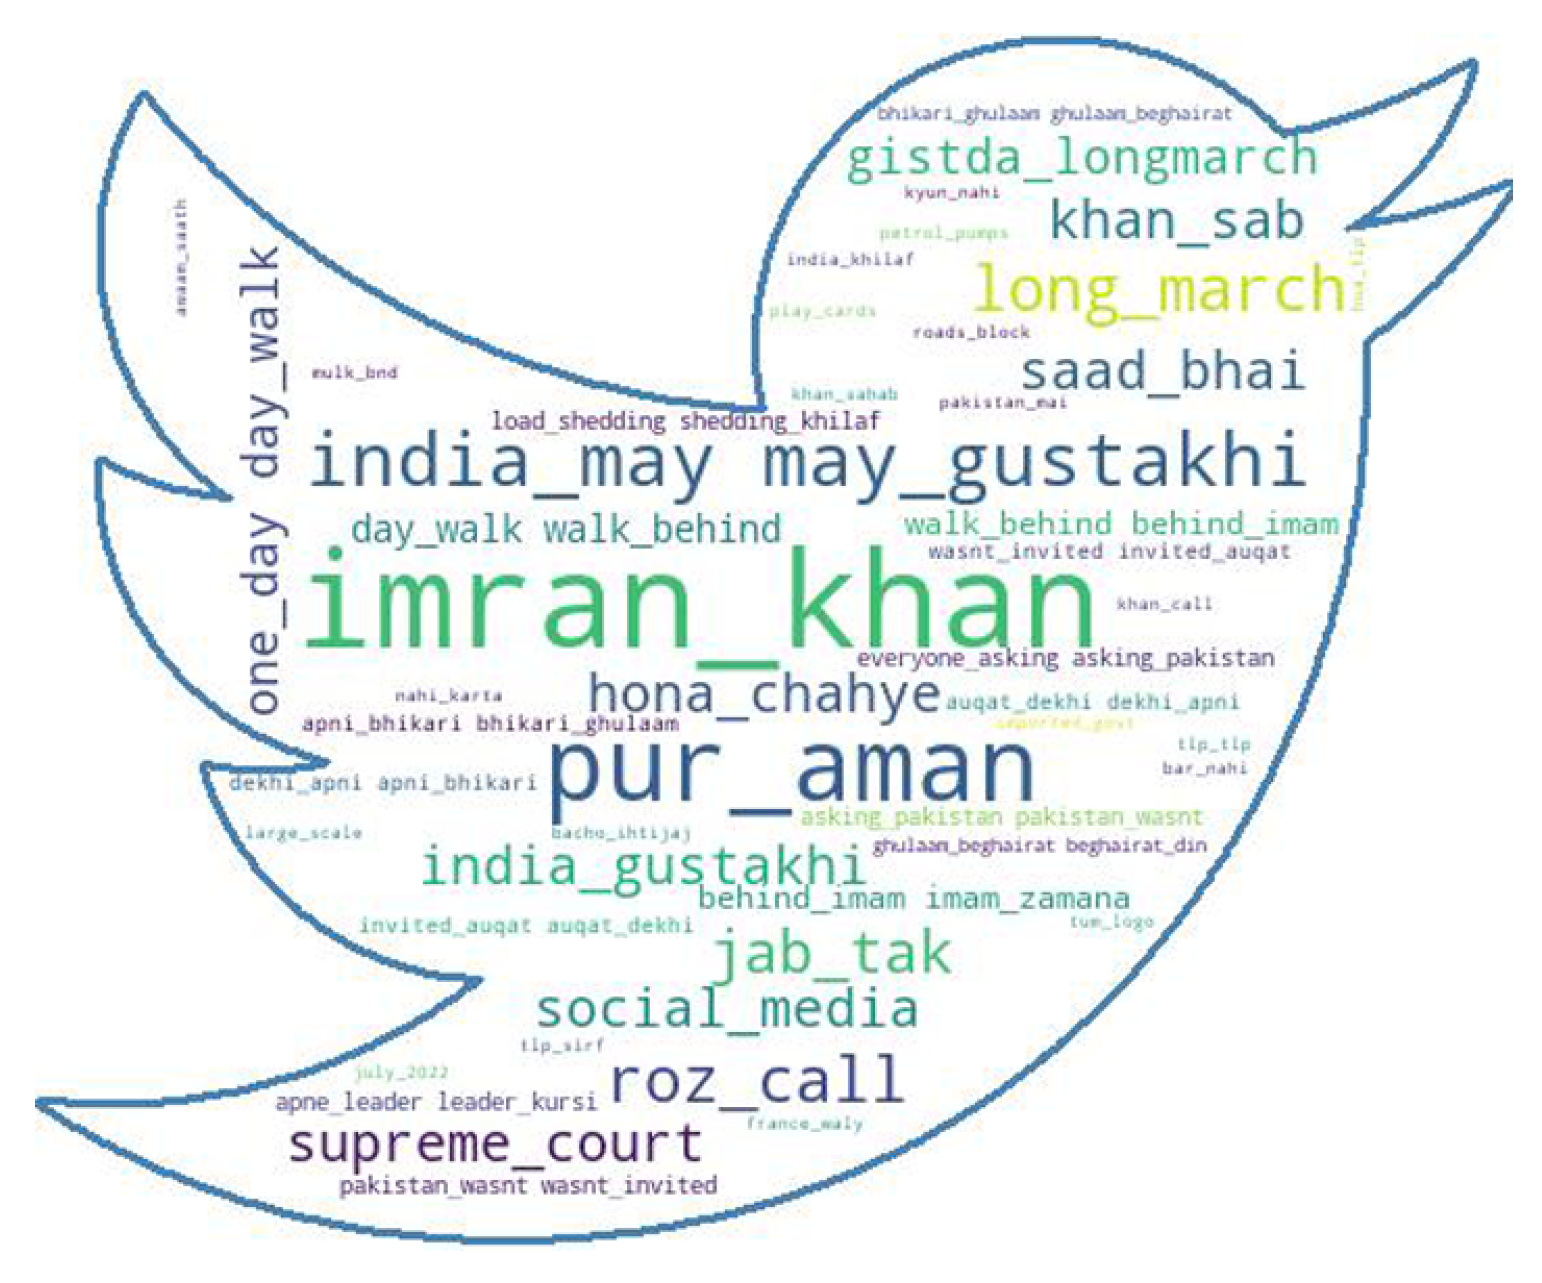
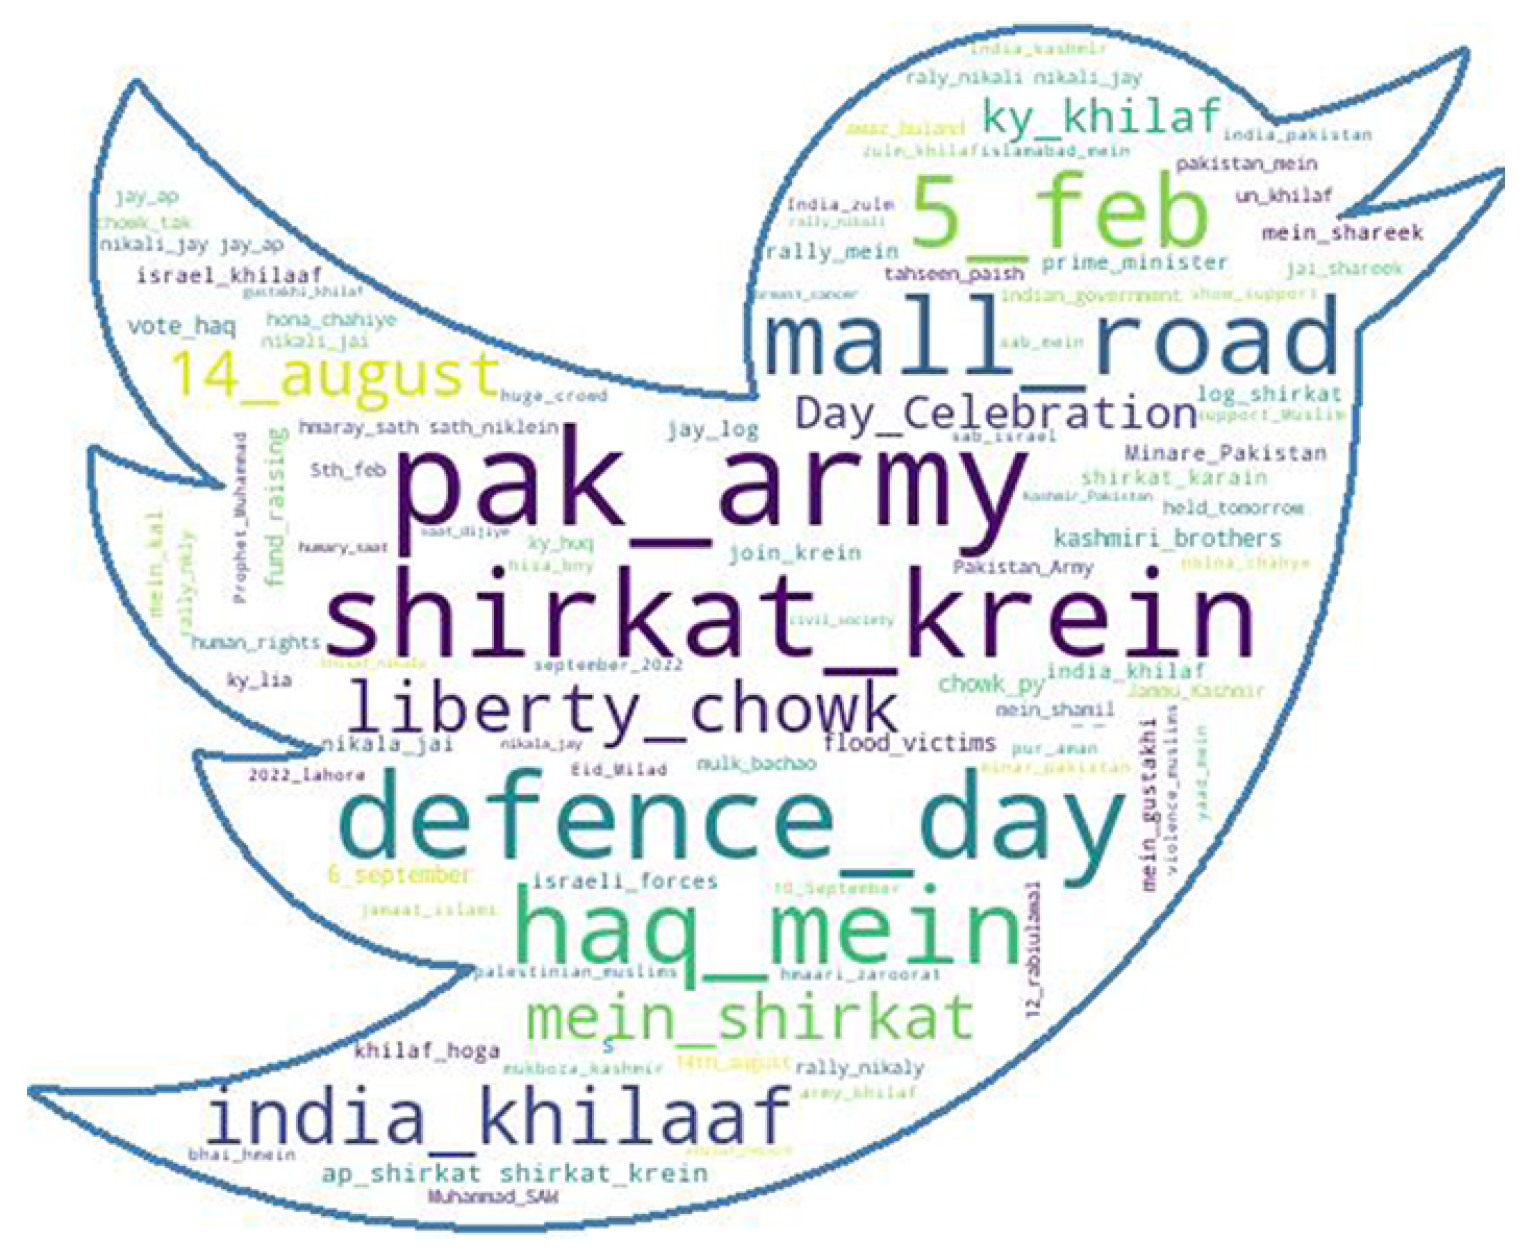
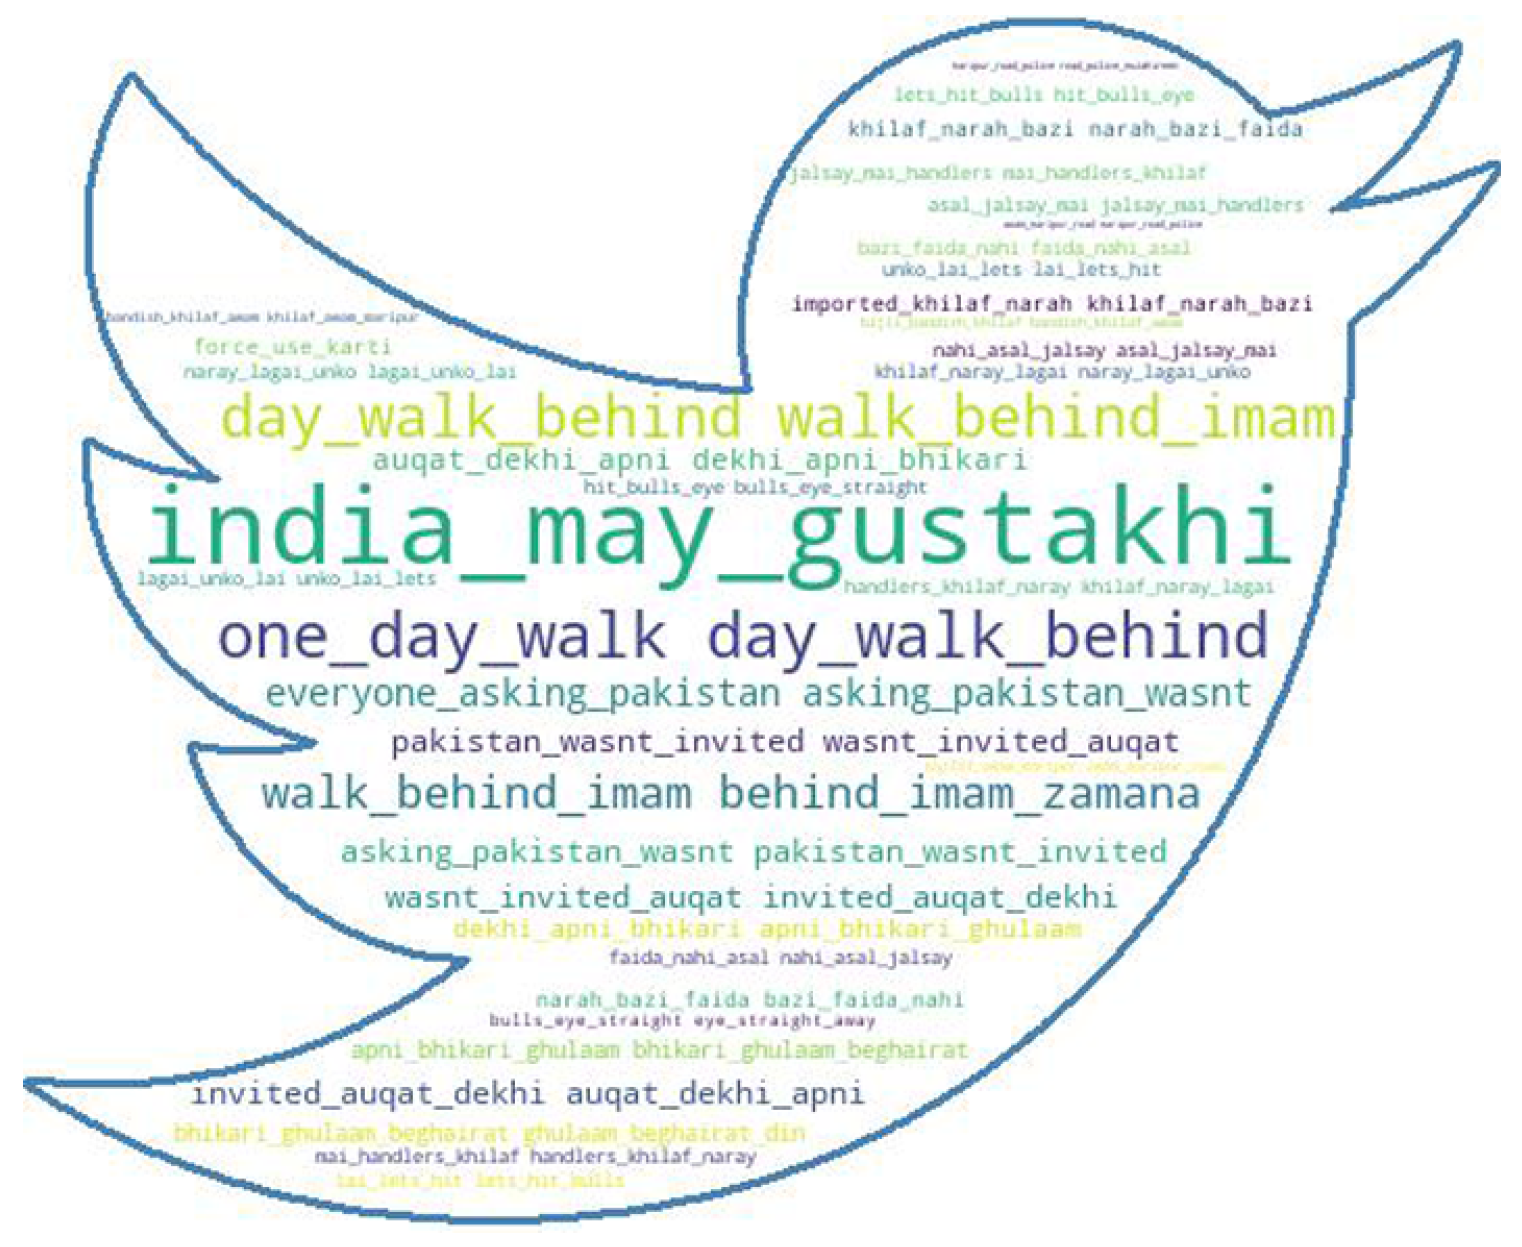
3.7. Data Visualization in Word Cloud Using Bigram and Trigram Models
A word cloud is a graphical depiction of data or information. It indicates the prevalence of words or phrases by making the most often used words larger or bolder in comparison to the other words. The most frequently used words in the Twitter data set obtained in the sense of negativity and positivity were visually represented in the form of the word cloud. The bigram word cloud gave two frequently used words consecutively, while trigram showed three consecutive frequently used words in our data sets. The word cloud was created in Roman Urdu. The English translation for the most frequent words in Roman Urdu is provided in
Table A2.
Equation (
8) is used to calculate the probability ’P’ of the N-gram model by n, where ’V’ represents the words.
To use the word count function, we changed the above Equation (
8) to Equation (
9) where C denotes the count of words v in the n-gram model n.
Figure 2 and
Figure 3 demonstrate the bigram word cloud model, which combines two frequently occurring words from our data set.
Figure 4 and
Figure 5 depict the trigram model, which combines three frequently occurring words that are used in both positive and negative contexts in our data set.
The word clouds with a single word were not meaningful enough to depict the frequently used words in our data set. Trigram models were more useful as compared to the bigram depiction in our case.
4. Results and Discussion
After cleaning the data, the data set was manually annotated by annotators. Five machine learning (ML) algorithms along with two vectorization techniques were applied for the sentiment classification. The data were divided into a ratio of 80% for training and 20% for testing purposes, respectively. The classifiers used were RF, DT, MNB, GNB, and SVM. All classifiers were implemented in Python.
At first, the models were applied to a data set of one thousand (1000) annotated tweets, divided into 80–20 ratios for testing and training purposes. Considered a small data set, the accuracy of RF was better as compared to other classifiers on small data sets consisting of Roman Urdu. As shown in
Figure 6, the accuracy of the RF count vectorization was 0.82 and RF-TFIDF showed an accuracy of 0.80.
In our investigation, classifiers on small data sets produced stable results using both vectorization techniques. RF with fewer features in a smaller data set in combination with count vectorization produced better outcomes than RF with TFIDF. When using the DT classifier on a small data set, the results accuracy outperformed those of SVM, MNB, and GNB. Although results with vectorization in combination with DT were stable, DT with count vectorization showed better accuracy (0.78) compared to DT with TFIDF (0.72). SVM performed better than MNB and GNB on the small data set. As shown in
Figure 6, SVM-TFIDF gave an accuracy of 0.75 and the SVM count showed an accuracy of 0.67. MNB in the small data set performed better than GNB. MNB-TFIDF yielded better results compared to the MNB count vectorization, i.e., 0.72 and 0.67, respectively. The GNB results with both vectorization techniques were not outstanding; GNB-TFIDF was 0.54 and the GNB count was 0.51 in the results.
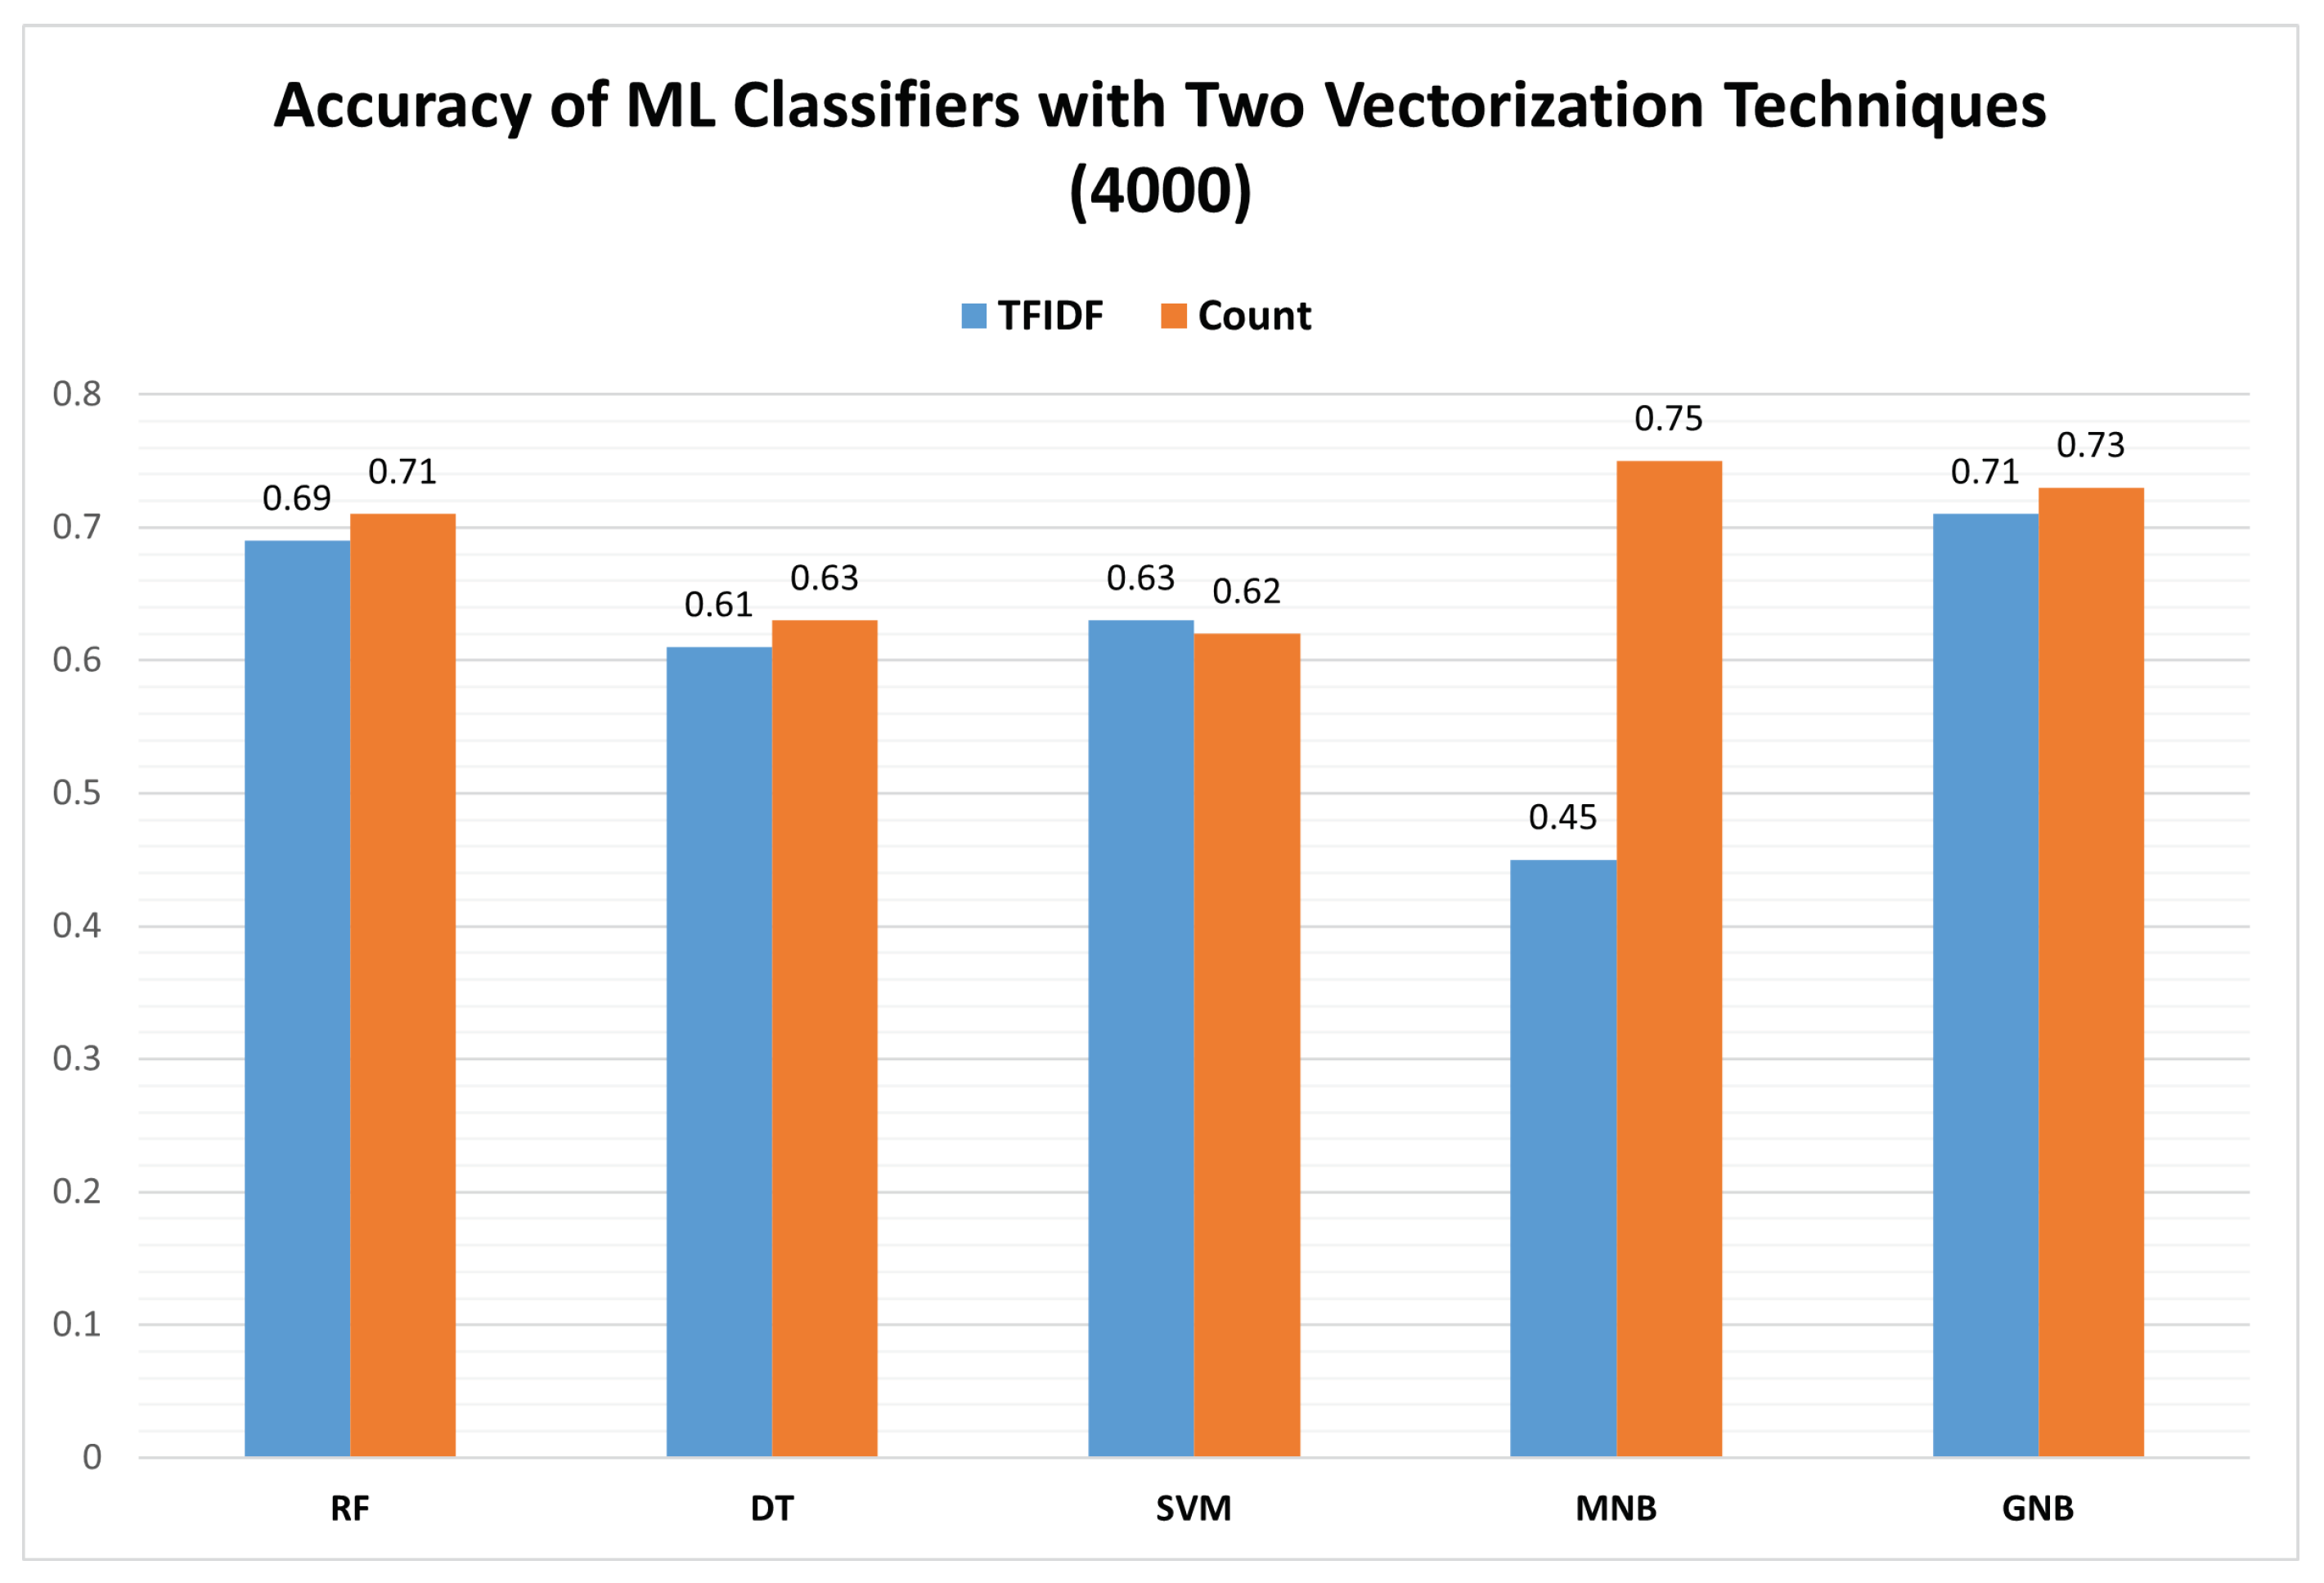
In the second phase, we increased the data set to four thousand (4000) annotated tweets in Roman Urdu, considered a large data set; the tweet data set was divided into 80–20% ratios for testing and training sets, i.e., 3200 and 800, respectively.
Figure 7 illustrates the accuracy of the large data set. The accuracy of the large data set showed variations when compared to the small data set as Bayesian classifiers outperformed trees. MNB with count vectorization outperformed all other classifiers with an accuracy of 0.75 in the large data set while MNB-TFIDF vectorization showed an accuracy of 0.45. Other than MNB, there was no significant difference in accuracy when applying the same classifier but there was a different vectorization technique for the large data set. The accuracy of GNB was improved in the large data set, although it showed stable results with both vectorization techniques. The GNB count performed better in the large data set with an accuracy of 0.73 and a GNB-TFIDF of 0.71. In the large data set, the RF count showed an accuracy of 0.71; with RF-TFIDF, it had an accuracy of 0.69. DT with the large data set was not considered the best compared to the small data set; the DT-count and DT-TFIDF showed accuracies of 0.63 and 0.61, respectively. The SVM count and SVM-TFIDF showed accuracies of 0.62 and 0.63, respectively.
We found that random forest (RF) and count vectorization performed best on the small data set related to anti-government gatherings in Roman Urdu, obtained from Twitter, for the task of sentiment analysis. The accuracy achievement was 0.82. In our study, we found that random forest (RF) performed well when applied to the small data set of Roman Urdu tweets related to protests, with an accuracy of around 80%. This is in line with previous research that suggests that RF is a suitable algorithm for handling high-dimensional and sparse data, as well as unbalanced data sets [
32]. Additionally, by using count vectorization, our study is able to select the most informative features, which can further improve the performance of the classifier [
33]. These findings suggest that RF, in combination with count vectorization, is a promising approach for analyzing small data sets of Roman Urdu tweets related to protests in order to detect public sentiments.
In this research, we also found that multinomial naïve Bayes (MNB) and count vectorization performed best on a large data set related to anti-government gatherings in Roman Urdu, obtained from Twitter, for the task of sentiment analysis. The accuracy achieved was 0.75. This is in line with previous studies, such as by Shah and Zaman (2018), who found that MNB and count vectorization were effective for classifying tweets related to political protests, achieving an accuracy of 85% [
34]. A study on the sentiments of restaurant reviews [
35] showed that MNB outperformed other classifiers. The data set consisting of a few thousand applied with different ML techniques in Roman Urdu showed MNB as the best technique to follow [
36]. However, the novelty of our technique is that we used different vectorization methods to gain better results. Therefore, on our data set, the results of ML classifiers showed diversity, the highest accuracy was achieved by using MNB with the count vectorization technique while the lowest was with TFIDF. Another study claimed that the MNB outperformed in terms of precision in the experimental results for sentiment analysis for customer reviews on social media as compared to GNB and RF [
37].
The studies discussed above were conducted in Roman Urdu, English, and Chinese languages. Our data set was diverse as it was obtained from Twitter in real-time, and it contained mixed expressions of English and Roman Urdu. Roman Urdu does not follow a standardized form, so the public uses a variety of phrase patterns and spellings. The data set was multidimensional, which allowed us to gain a more accurate picture of the public’s sentiments toward protests. By utilizing the techniques mentioned above, we were able to provide a more comprehensive view of the public’s sentiments about protests and unrest in countries where Urdu is the primary language.
Table 2 and
Table 3 show the macro-averages (average of precision, recall, and F1 score) with TFIDF and count vectorization techniques and ML classifiers for the large data set. The overall results in terms of precision with count vectorization achieved were the best. MNB outperformed all other ML classifiers with a precision of 0.75 while RF and GNB followed up with averages (F1, Recall, Precision) of 0.72 and 0.71, respectively.
5. Conclusions
In our study, we evaluated the performances of several ML classifiers using two alternative vectorization approaches for the analysis of public sentiments about anti-government activities in English and Roman Urdu on Twitter data sets. The experimental results fluctuated with the change in the size of the data set, the number of features selected, and the language of the data set. In terms of accuracy, the performances of ML classifiers and vectorization approaches varied. Roman Urdu does not follow any standard form; our data set indicated a diverse range of our findings. We conclude that RF count vectorization works well with the small data set of Roman Urdu tweets as it tends to over-fit less when compared to other classifiers. It can also handle noisy data better and maintain accuracy due to bootstrapping. The MNB count vector outperformed other classifiers on the large data set as it makes the assumption that features are conditionally independent, given the class label, which makes it computationally more efficient. It can handle a large number of features effectively with low computational costs, which makes it a suitable choice for the large data set. The proposed study illustrates an analysis of Roman Urdu tweets, which is adequate for public sentiment analysis regarding forthcoming anti-government protests, demonstrations, assemblies, rallies, sit-ins, marches, etc. In addition, we observed that a large number of people in Pakistan tweet in pure Urdu. This study could be extended to pure Urdu tweets to improve the efficiency and effectiveness of sentiment analysis and gain valuable insight into public opinions.

 ,
, 


