1. Introduction
Metabolomics is one of the prospective approaches to the investigation of the etiology and pathogenesis of diseases and systemic pathologies. The objects of the study are the intermediate and final products of chemical reactions during metabolism in biological systems (cells, tissues, biological fluids, and the organism as a whole), in other words, metabolites [
1,
2]. In 2004, the Human Metabolome Project (HMP) (Canada) was launched, the purpose of which was to create a database of intermediate and final substances produced in the human body. An electronic, free database called the Human Metabolome Database (HMDB) was established [
3]. To date, this database contains more than one hundred and fourteen thousand metabolites of the human body identified in saliva, urine, blood, etc. For the detection of metabolites, gas chromatography, mass spectrometry, and IR spectroscopy have been primarily used.
In present-day otorhinolaryngology, the metabolomic approach is also gaining popularity for studying various pathologies of the ear-nose-throat (ENT) organs. However, biological fluids of the organism rather than tissues are most often used for searching for characteristic metabolites in pathologies. For example, in the review [
4], devoted to metabolic studies in pathologies of the inner ear, the main objects of research were blood, urine, and perilymph. Only in two of the thirteen works selected for the review were the studies performed on fluids: in one of them (on rats), metabolic changes were investigated in cerebral tissue after acoustic trauma, and in the other (on mice), metabolic changes were examined in the temporal bone at noise-induced hearing loss.
All the above data were obtained in experimental studies and were not aimed at constructing a metabolic profile with the identification of a characteristic marker that would allow optimizing the diagnosis, including determining the stage of the process and tracing the etiological moments of the onset of the disease at the biochemical level. The approach aimed at identifying changes in metabolism and the appearance of metabolites characteristic of pathologies is also starting to be used in the studies of pathologies of ENT organs in sinusitis. Ultra-performance liquid chromatography combined with mass spectrometry was used to study and compare the metabolic composition of the follicular fluid in patients with aspergilloma (fungal balls) in the maxillary sinus and in healthy patients; the presence of dysfunctional metabolism of glycerophospholipids and sphingolipids was revealed in the fungal sinusitis [
5].
At present, tissue metabolites and metabolites in pathological secretions obtained from the foci of inflammation and tumors have been studied only in a few works, and a database on them has not yet been created. Information about some substances being markers of pathology can be found in the Human Metabolome Database. However, to the best of our knowledge, there is no information in the database on the tissue metabolites of healthy and pathologically altered tissues. Our study of tissue metabolites in histologically verified material, taking into account comparison groups of apparently healthy tissue samples and pathology of the paranasal sinuses (cysts, polyps, and benign tumors), made it possible to identify patterns of changes in the metabolic profile and reveal certain chemical compounds as markers corresponding to a nosological unit or a group of diseases with similar biochemical structure [
6]. Thus, the study of tissue metabolites aimed at creating a metabolic profile and identifying markers of pathologies or tissue diseases for medical diagnosis is an urgent task since it will reveal pathogenetic mechanisms of disease development, prospects for the clinical course, and enable assessment of the efficiency of therapy.
An effective approach for studying multicomponent gas mixtures is molecular absorption spectroscopy with nonstationary effects (appearance and decay of macroscopic polarization). Spectrometers based on nonstationary effects have the best approximation to the theoretical limit of sensitivity; in the scanning mode, the sensitivity for specified gases is about 200 ppt with a spectral resolution limited by the Doppler effect [
7]. The most intense absorption lines of the rotational spectrum of molecules, including organic ones, lie in the terahertz (THz) range. That fact allows applying this approach for the study of various gas mixtures, including substances of biological origin [
8,
9,
10]. By identifying absorption lines in the spectra obtained under radiation influence on a multicomponent gas sample, one can reveal differences in the sample’s composition corresponding to different diseases and, consequently, potential markers of pathologies.
One of the human excretions investigated using THz high-resolution spectroscopy is exhaled breath. The high-resolution spectrometer (with a frequency range from 220 to 330 GHz) in scanning mode was used to reveal the 21 different molecular species in the exhaled breath samples of three volunteers [
10]. However, ENT organs were not studied using THz high-resolution methods earlier.
The goal of the work is to use high-resolution spectrometers to study the nonstationary effects of the THz frequency range and analyze the metabolites in the products of thermal decomposition of relatively healthy tissue and tissues in pathologies (paranasal sinus cysts and chronic polypoid rhinosinusitis) aimed at the identification of metabolites that are markers in a characteristic set of these pathologies.
2. Materials and Methods
The THz spectroscopy approach based on nonstationary effects is as follows: the radiation interacts with the molecules of gas under resonant conditions, and the macroscopic polarization is observed in a gas sample in this case, then the radiation is taken out of resonance (by switching off or changing the frequency or phase) with the time shorter than gas polarization relaxation times, the polarization signal will emit the same mode of electromagnetic field mode as the mode inducing the polarization. This approach is realized by periodic phase or frequency switching. The corresponding devices are implemented in two forms: a phase switching spectrometer and a fast frequency sweeping spectrometer [
7].
The phase switching mode enables the detection at a certain frequency of the rotational transition of a certain substance and is used for monitoring the dynamics of its concentration.
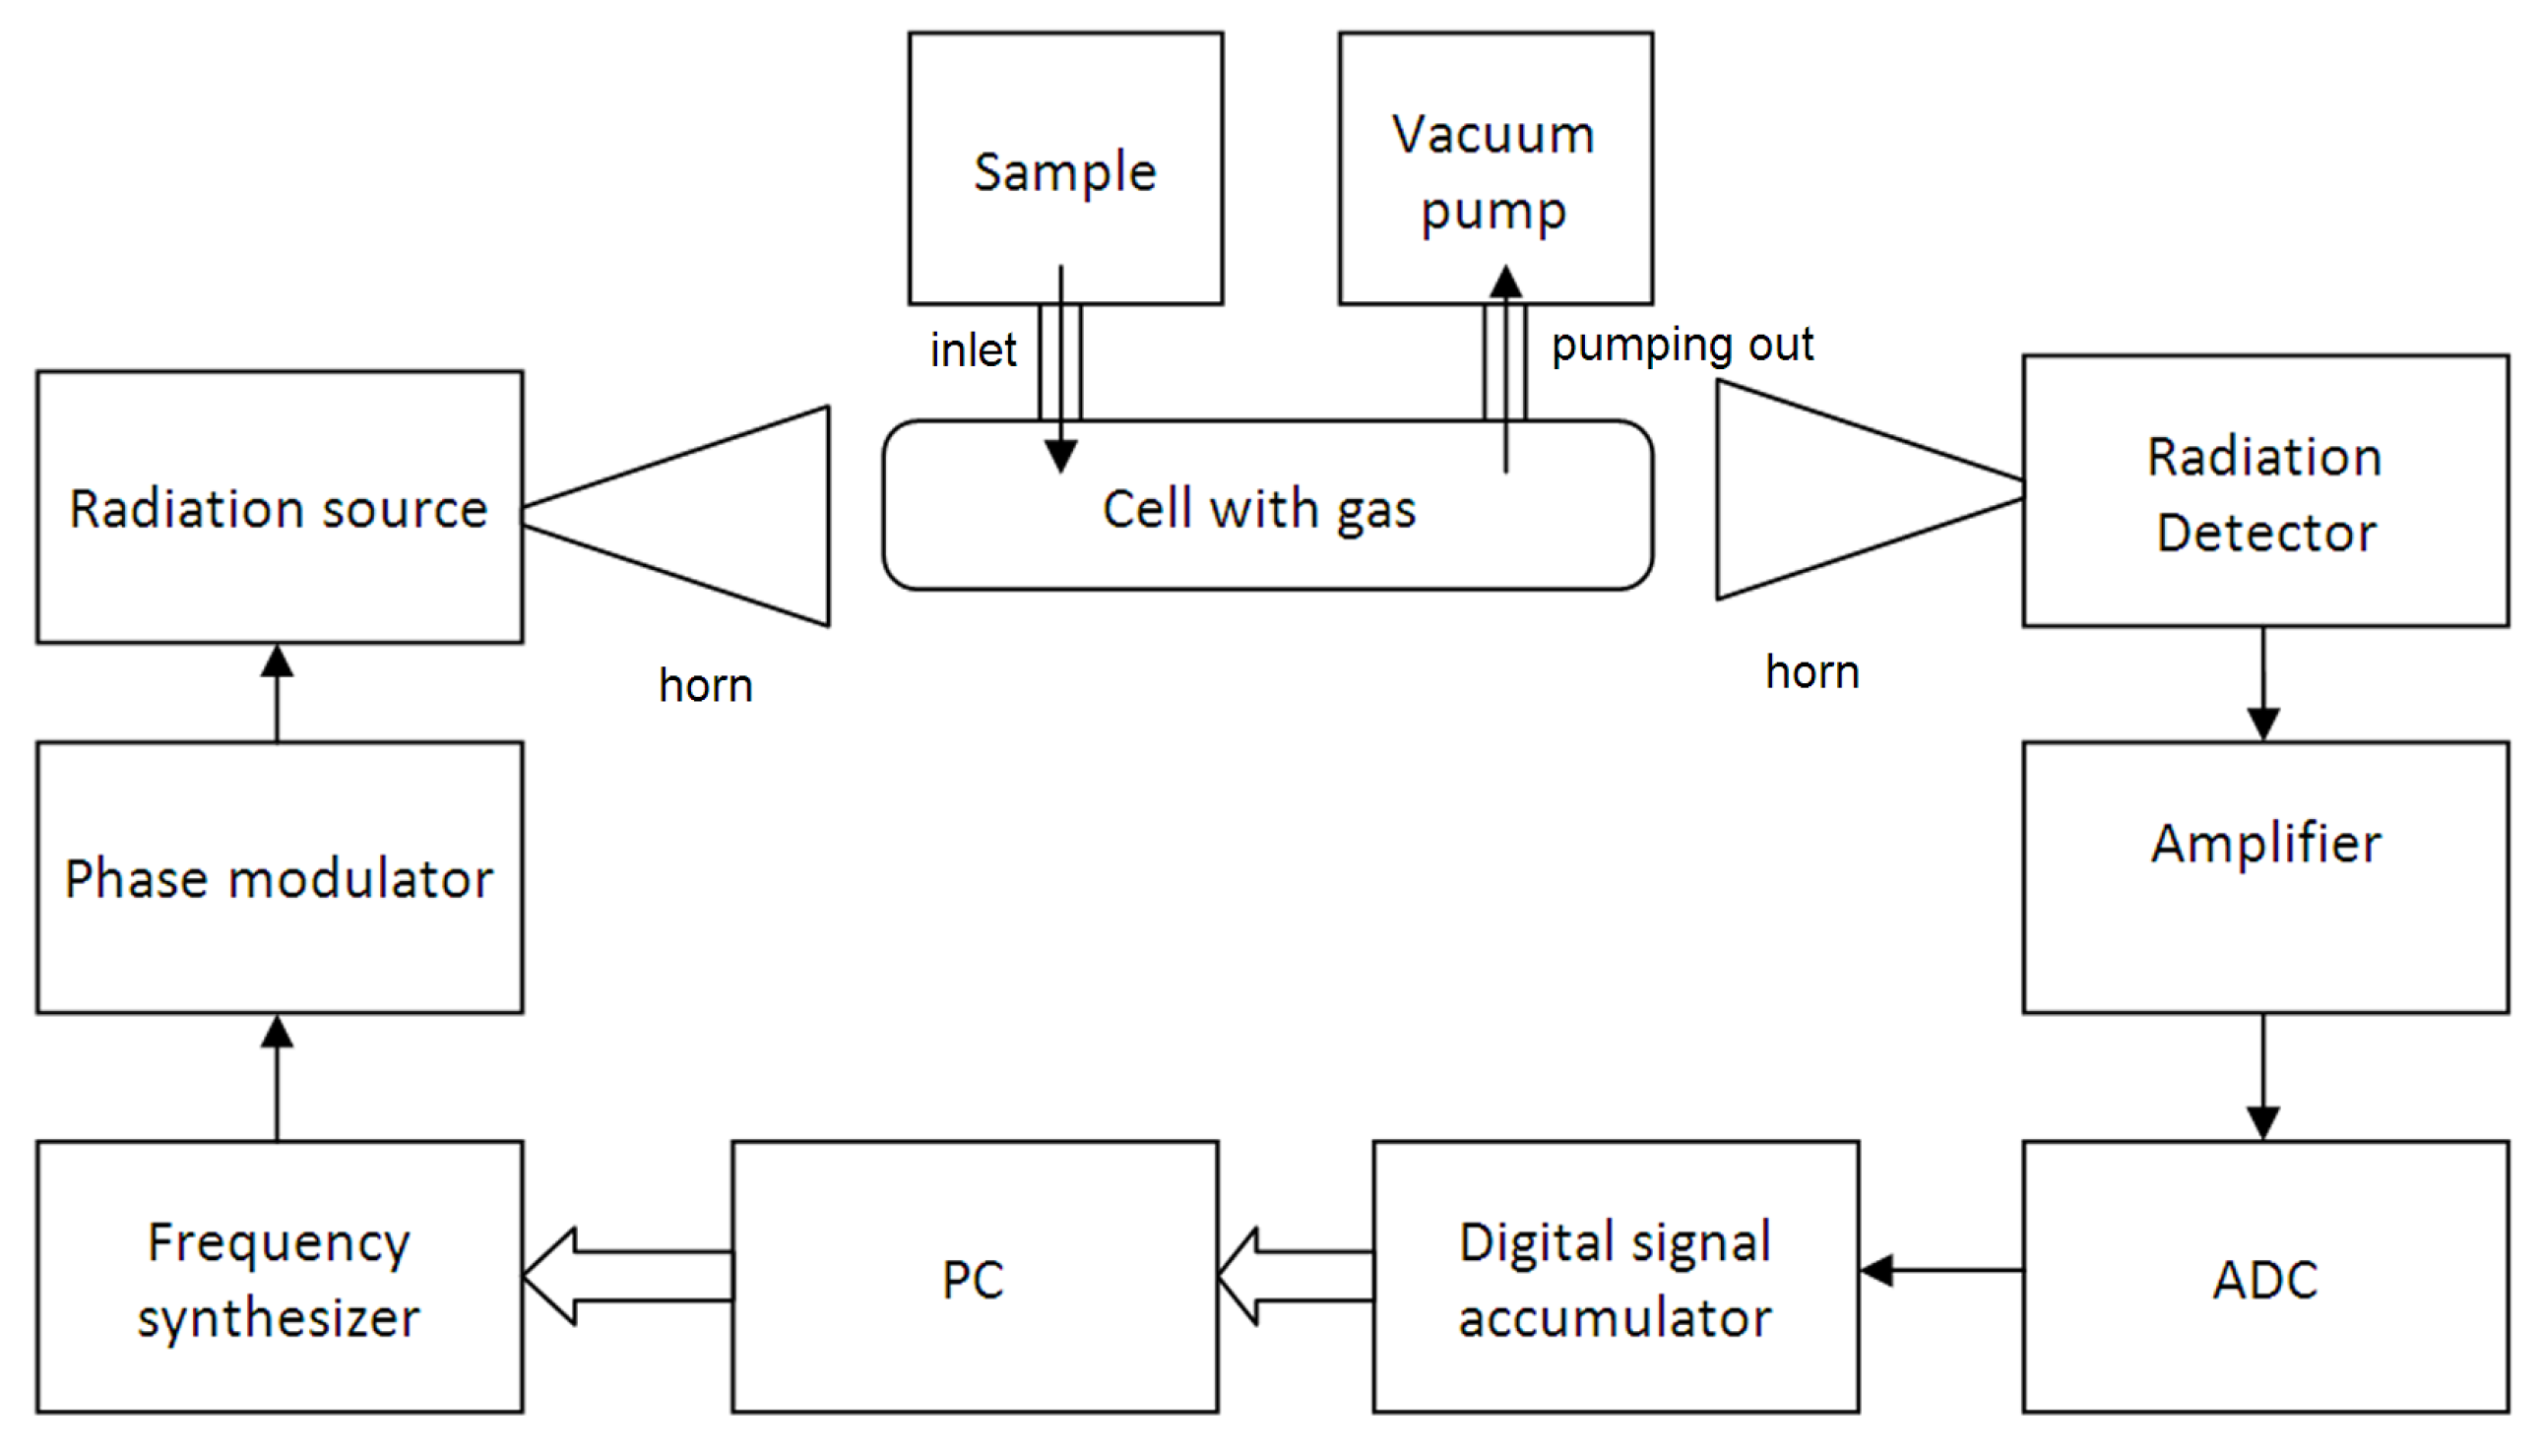
The spectrometer with phase switching of radiation influencing gas [
6] (the scheme is presented in
Figure 1) has the radiation source generating the frequency of the signal for probing, a phase modulator modulating the frequency of the radiation source, a frequency synthesizer setting this frequency, and a personal computer (PC) controlling the frequency synthesizer. The detector receives the signal after transferring through the gas cell with the sample of gas under study and after interacting with the gas molecules. This signal is recorded and then sent to the amplifier. After amplifying, it is digitized by an analogue-to-digital converter (ADC), and after that, the digital signal passes to the accumulator and is then recorded and processed in the PC. The information about the rotational absorption line is in the signal that arrived at the detector and will not be lost at the next manipulation.
There are two possible ways to record absorption lines:
- -
Choose the frequency of the absorption line center of the substances under study and record the dynamics of the line amplitude during the measurement time;
- -
Tune the radiation source frequency over the frequency band and record the rotational lines falling within this band.
In the first mode, the sensitivity (minimal absorption coefficient) of the phase switching spectrometer reaches 5 × 10
−10 cm
−1, and in the second case, 3 × 10
−9 cm
−1. If the absorption lines have integrated intensity of 0.001 nm
2 × MHz (the lgI = −3 presented in database [
11,
12]) as forH
2S (f = 168762.7624 MHz, lgI = −2.8376) [
11], the concentration sensitivity (for absorption coefficient sensitivities of spectrometers presented in our work) is approximately 8.3 ppb (for minimal absorption coefficient of 5 × 10
−10 cm
−1) and 50 ppb (for a minimal absorption coefficient of 3 × 10
−9 cm
−1). Most of the absorption lines in the range of 118–178 GHz detected in the gas mixture under study have the lgI at a level of −4 or −5. For those lines, the minimal concentration would be at the level of 100 ppb −1 ÷ 10 ppm. The levels of concentration sensitivities are better (for H
2S) or comparable (for some other substances) with the sensitivity (relative to concentration) in [
10,
13].
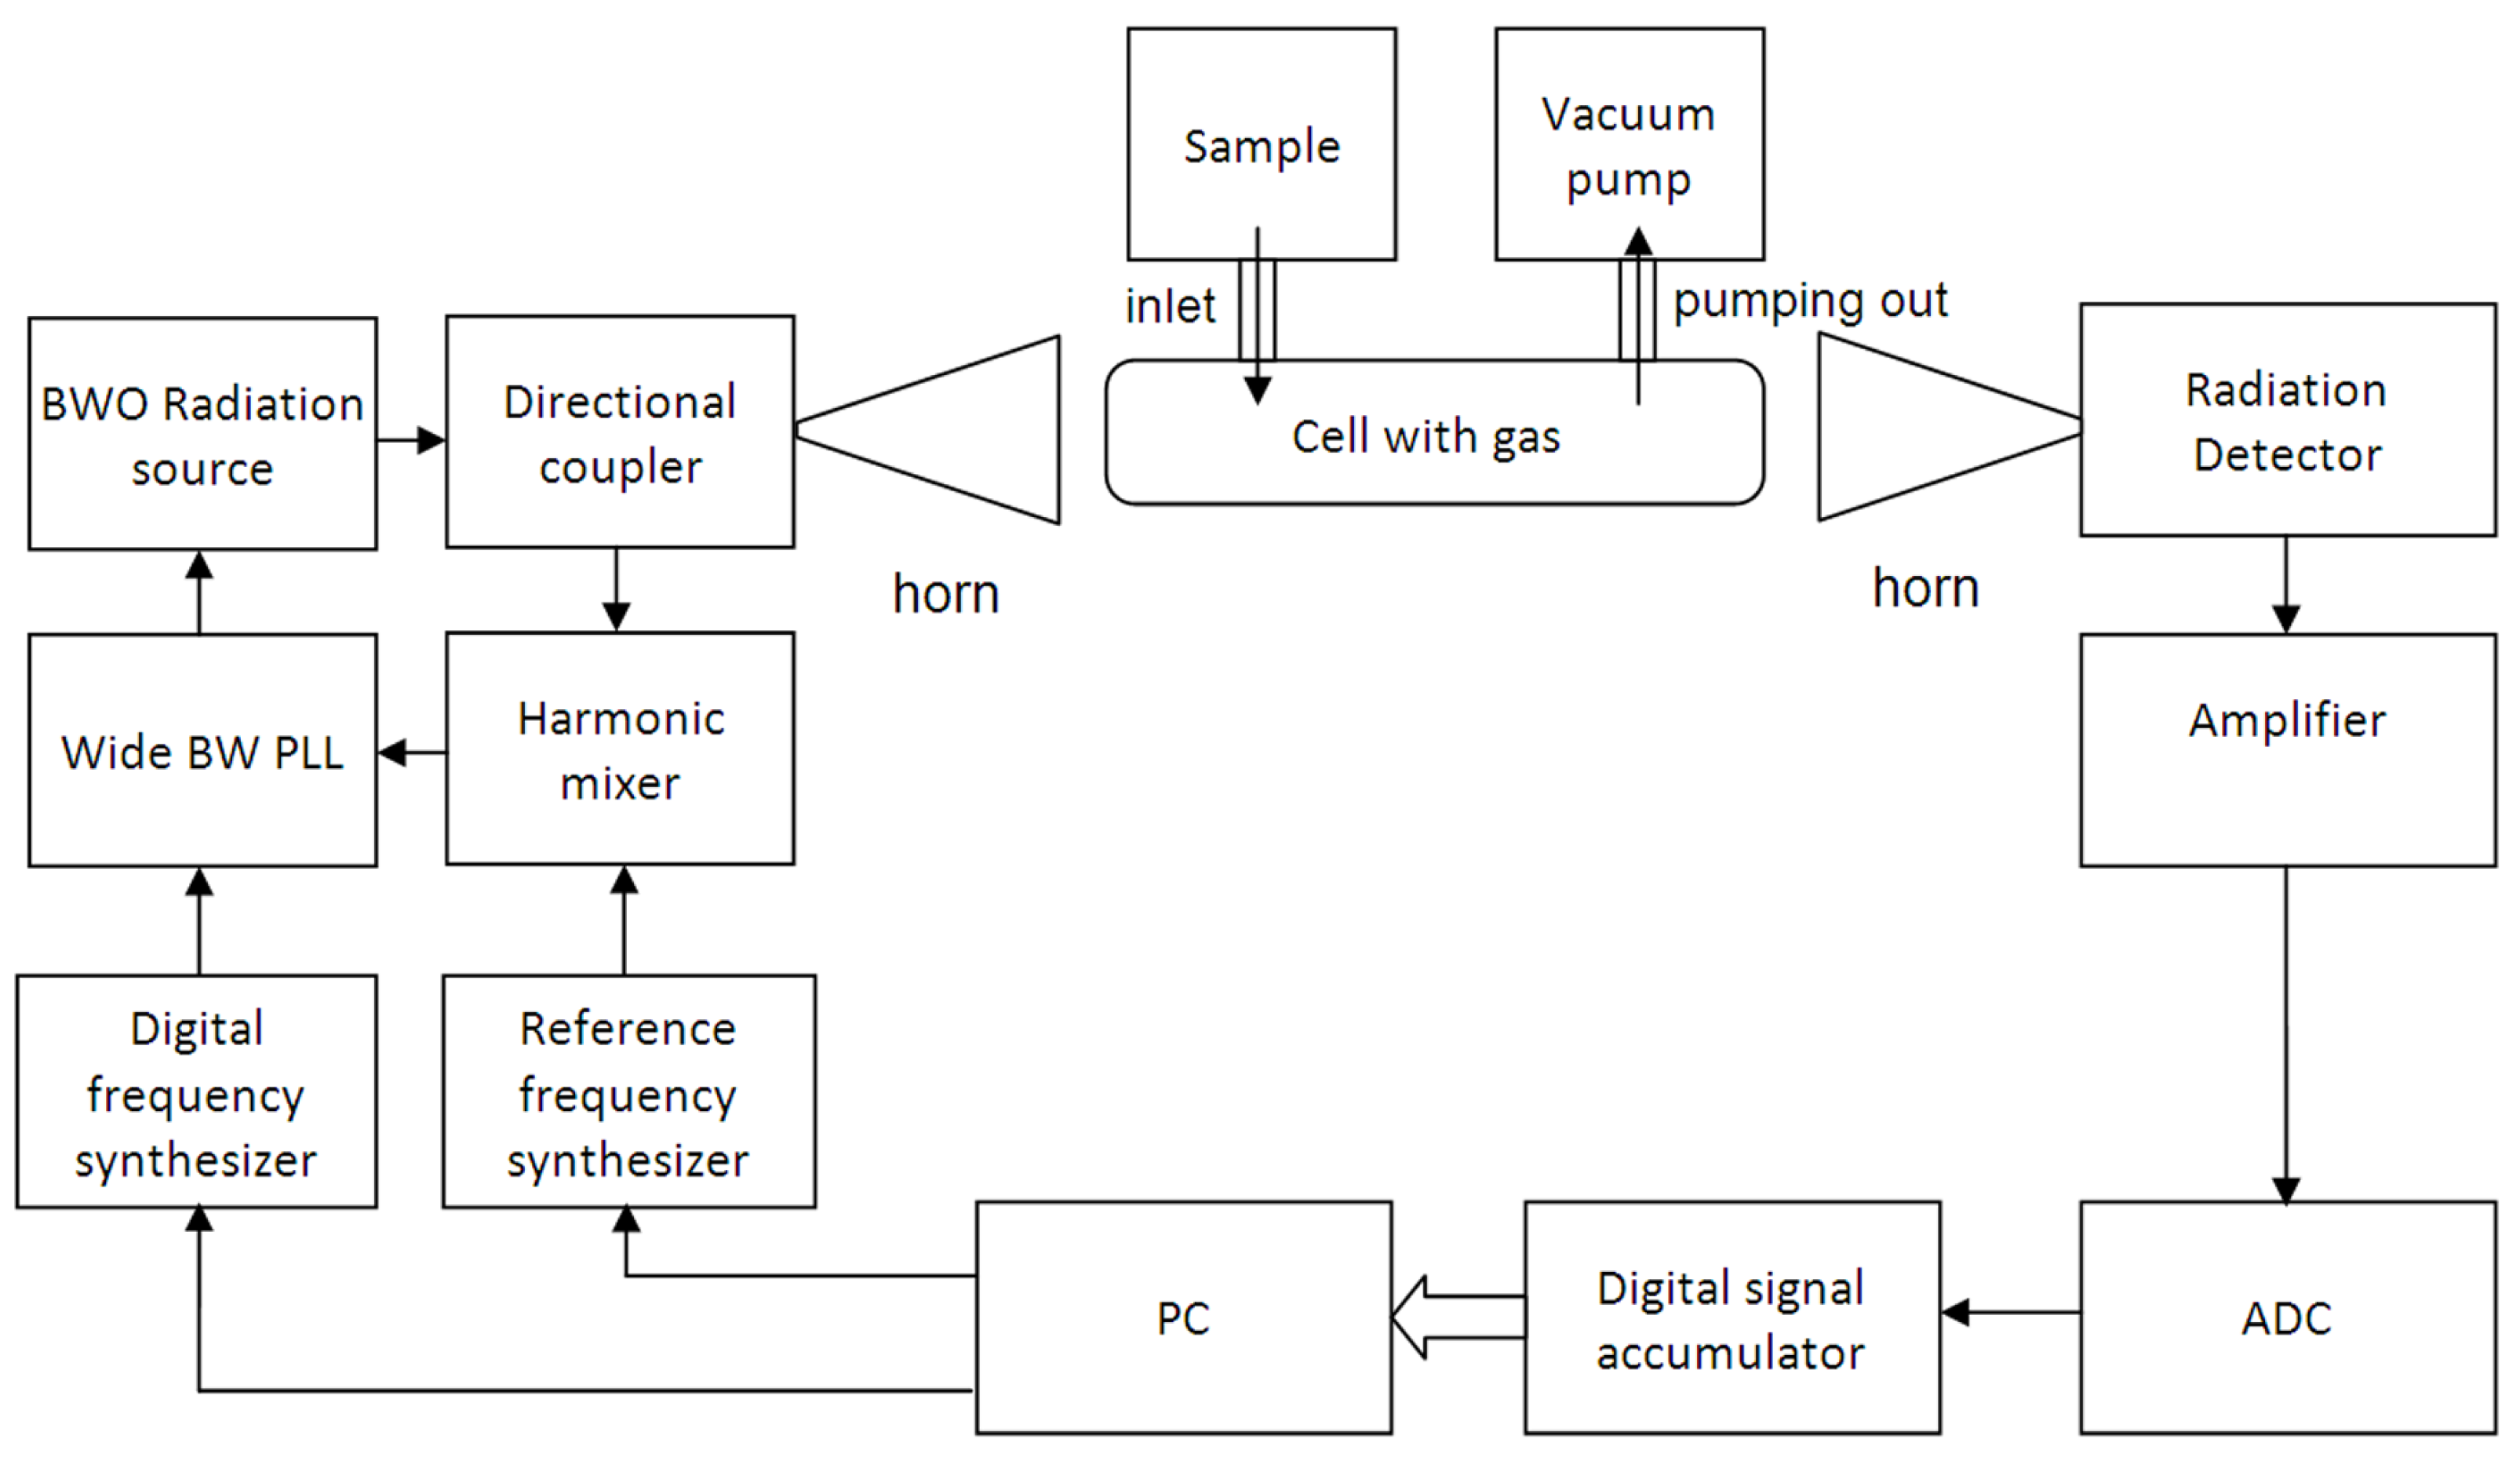
The approach based on a fast frequency sweep through the absorption line was used in the spectrometer with a radiation source on a backward wave oscillator operating in the range from 118 to 178 GHz [
14]. Fast sweeping allows for the recording of all the absorption lines throughout the spectrometer’s frequency range and detecting several substances simultaneously. The scheme of the fast frequency sweep spectrometer is shown in
Figure 2.
The radiation source has a built-in module consisting of a commercial reference frequency synthesizer, the LMX2594 (Texas Instruments, Dallas, TX, USA), used as the reference oscillator. A frequency-swept source signal is converted to the frequency range of the radiation source with a wideband phase-locked loop. The frequency bands are controlled by the PC. The radiation (as in the previous spectrometer presented above) transfers through the gas cell with the sample of gas under study and interacts with the gas molecules. The detector receives this signal. This signal is recorded and then sent to the amplifier. After amplifying, it is digitized by an analogue-to-digital converter (ADC), and afterwards, the digital signal passes to the accumulator and is then recorded and processed in the PC.
It takes the spectrometer 30 s to sweep the 118–178 GHz range. The sensitivity of the absorption coefficient with a cell length of 1 m is 10
−7 ÷ 1.5 × 10
−8 cm
−1. The sensitivities of concentration are 1.6 ppm ÷ 250 ppb for H
2S (f = 168762.7624 MHz, lgI = −2.8376) [
11] in this case.
To study the composition of vapors and of the thermal decomposition products of tissue samples aimed at detecting metabolites and potential markers of pathologies, the following tissue sections were used: a relatively healthy mucosa of the nasal cavity (n = 10) obtained as a result of standard access during a sphenotomy (fragments of the mucosa from the posterior ends of the inferior turbinates) and samples of pathological material obtained from the sphenoid sinus (n = 10), as well as from the maxillary sinus (n = 10). Part of the material (3–5 mg) was placed in a container with distilled water for analysis using the spectrometers described above.
In the laboratory, the sample tissue under study was put in a flask connected to a measuring cell pre-evacuated to 0.0005 mbar. The sample was dehydrated under low vacuum pressure, and then the flask was pre-evacuated to 0.005 mbar. After that, the flask was heated up to 200–250 °C, and the vapors and products of thermal decomposition of the sample were let into the measuring cell, increasing the pressure up to about 0.05 mbar (working pressure). The dynamics of substance concentration were monitored in the phase switching mode, and fast sweeping made it possible to track all absorption lines in a given range and detect the presence of various substances. With the use of two variants of devices, we obtained an optimal picture of the thermal decomposition of biological samples, taking into account the chemical composition of the gas mixture in a more complete version, including the dynamics of the formation of the compounds.
Substances were identified by the absorption lines using the electron databases [
11,
12]. The frequency range corresponding to the operating ranges of both spectrometers contains strictly fixed absorption lines for specific substances, which are unambiguous signs of the presence of this substance in the studied multicomponent gas mixture. The absorption coefficient of each specific line is proportional to the concentration of a specific substance that interacts with the radiation contained in the mixture under study [
15,
16]. Therefore, the number of lines recorded in measurements of the spectra of a multicomponent gas mixture of products at thermal decomposition for the compared samples when measurements are taken under the same conditions (maintaining working pressure in the cell at a certain level and the same stage of heating the sample)may be an informative sign for a qualitative analysis of changes in the composition (an increase or decrease in the relative concentration of substances from sample to sample). It is important to note that in our study we used identical (for the phase switching spectrometer) and working (for the fast frequency sweep spectrometer) frequency ranges, which made it possible to qualitatively compare the contents of substances by estimating the number of recorded absorption lines in the spectrum of the sample.
3. Results
To assess the combination of chemicals characteristic of various tissues, we analyzed the composition of products of decomposition at heating and compared the obtained spectrum of substances and the number of absorption lines in the spectra of samples of relatively healthy mucosa, polyps obtained from the sphenoid sinus, and cyst tissue obtained from the maxillary sinus.
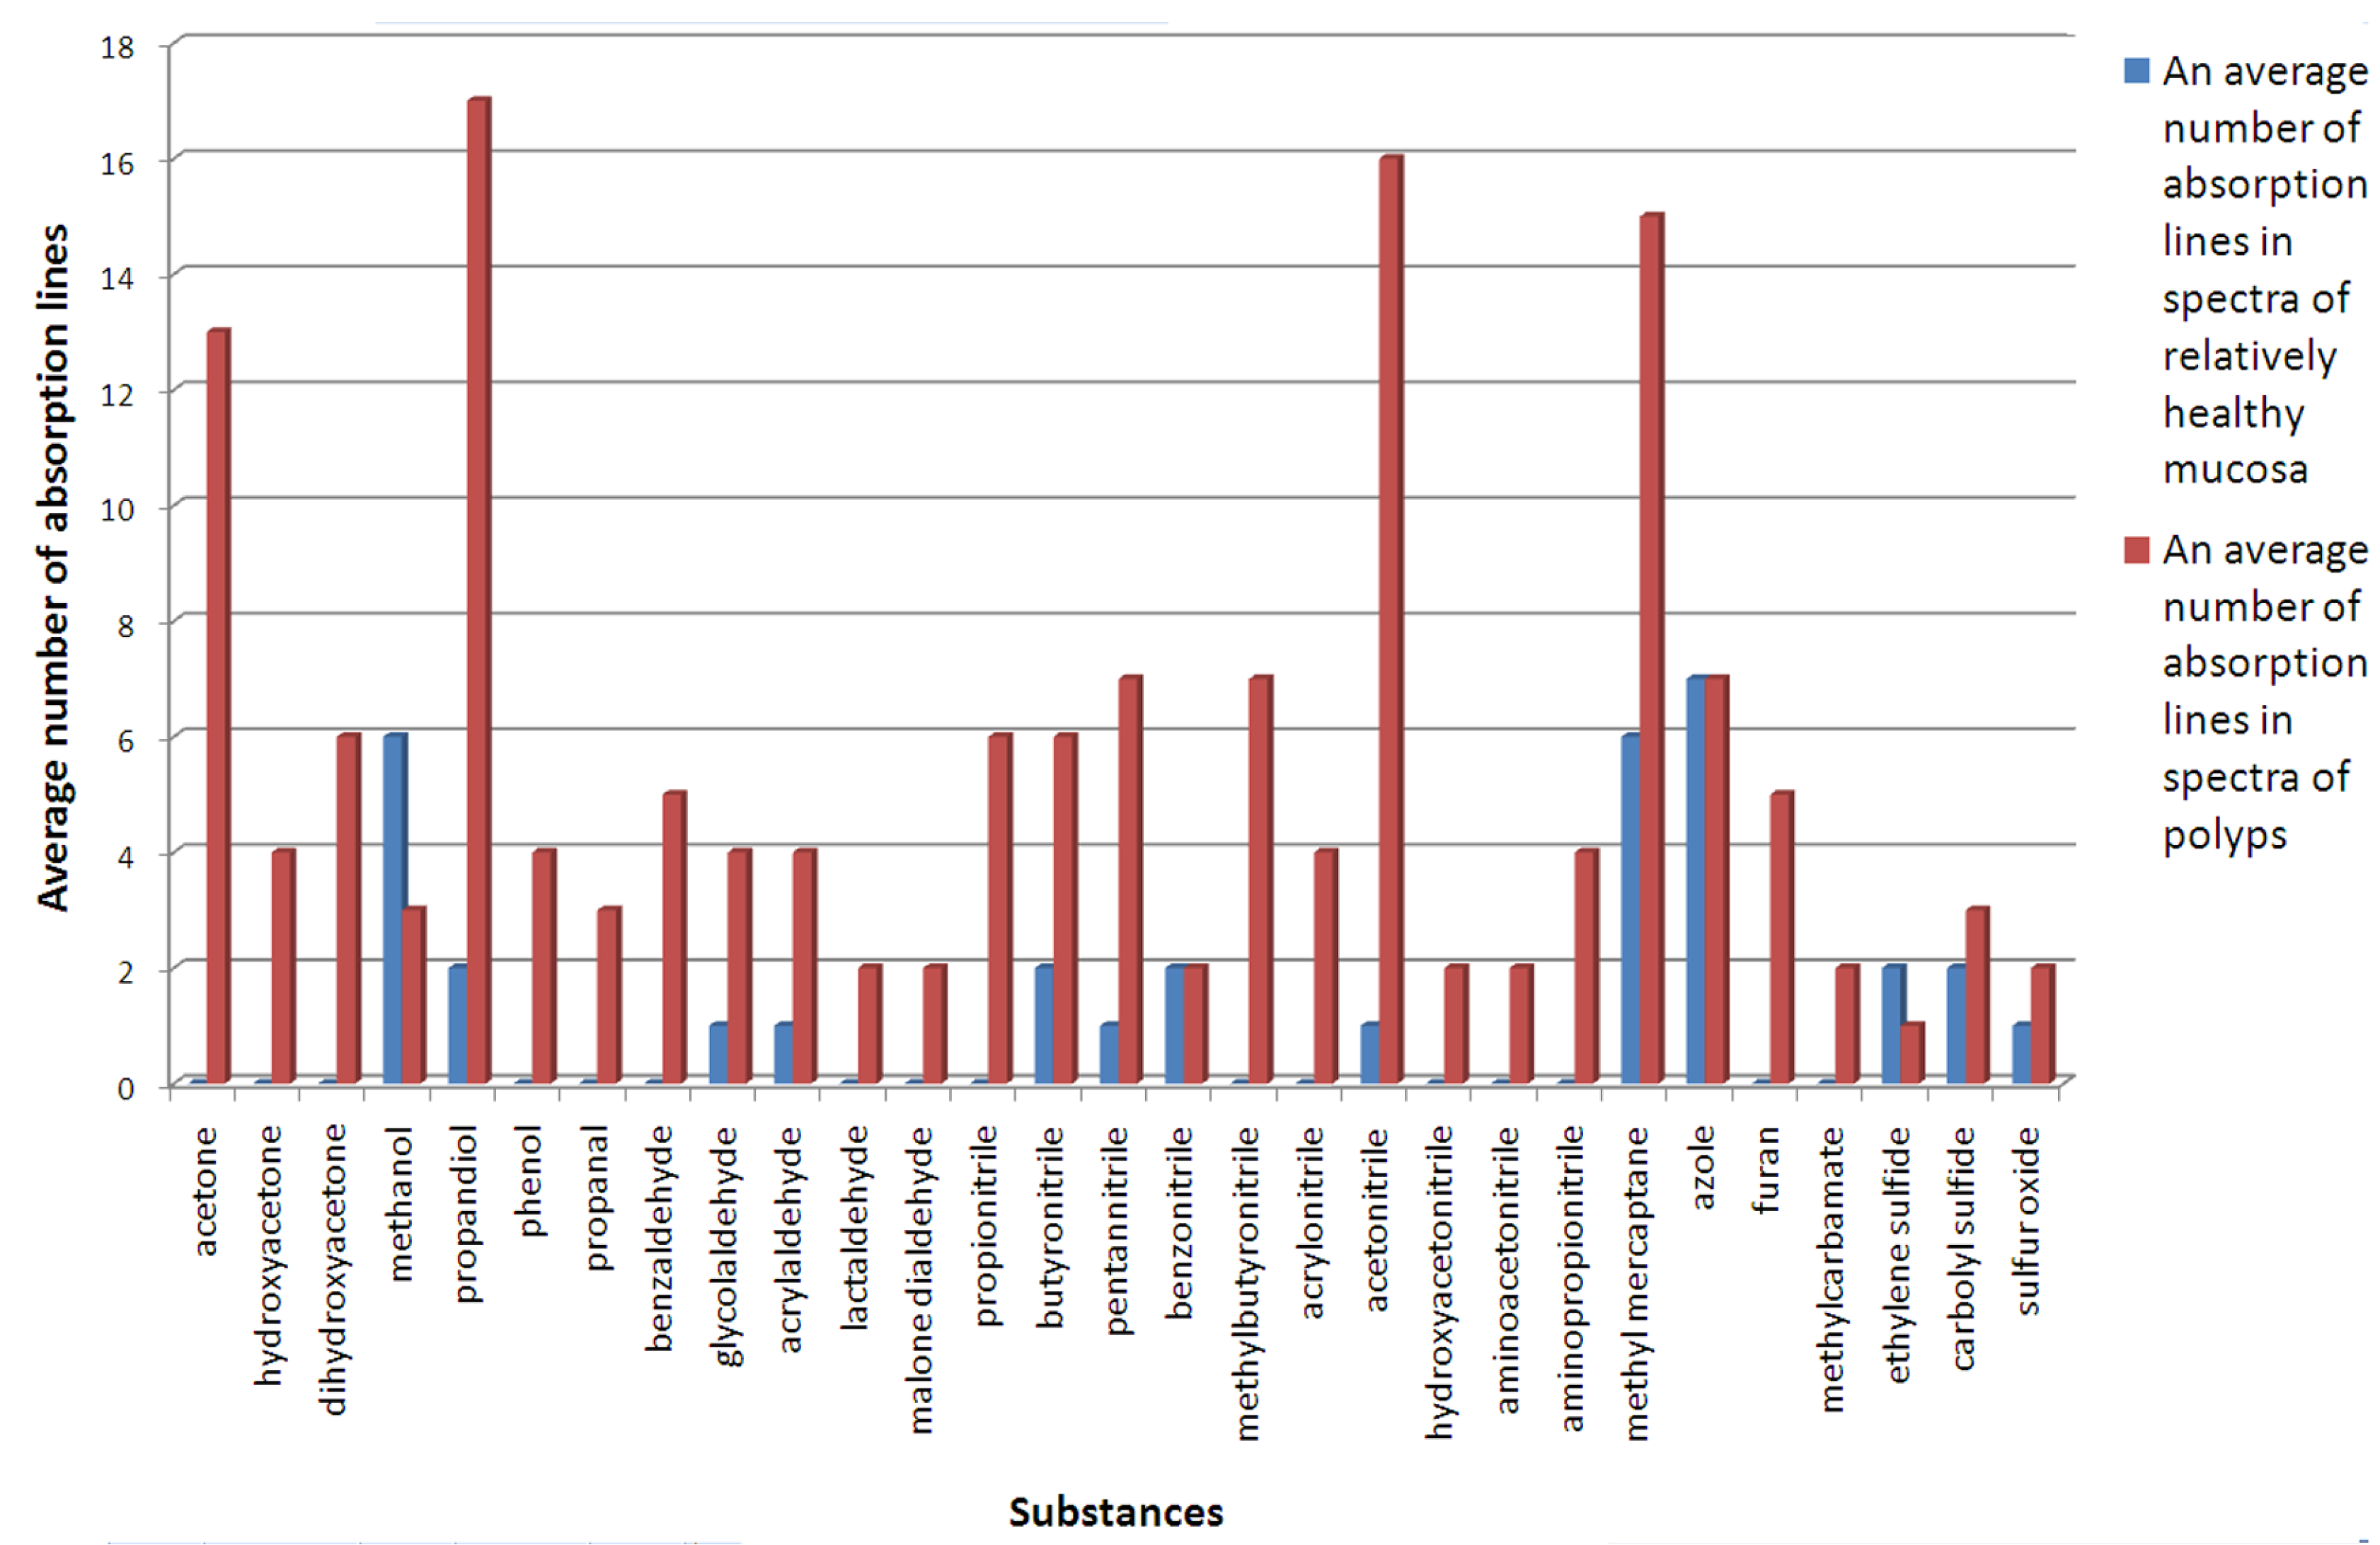
To determine potential markers of the pathological process and the subsequent creation of a metabolic profile in isolated sphenoiditis, we compared the indicators obtained for a relatively healthy mucosa and a polypous tissue. The data are given in
Figure 3.
The chemical composition of the gaseous products of the thermal decomposition of polyps is replenished with new substances that are not found in any sample of a relatively healthy mucosa (acetone, hydroxyacetone, dihydroxyacetone, propionitrile, including isotopologue with isotope C, aminopropionitrile, acetonitrile, monoethanolamine, alanine, pyridine, furan, and phenylacetylene), and the content of some substances (methyl mercaptan, acetaldehyde, methanol, propanediol, butyronitrile, pentannitrile, azole, diketene, sulfur dioxide, and ethylene sulfide) increases.
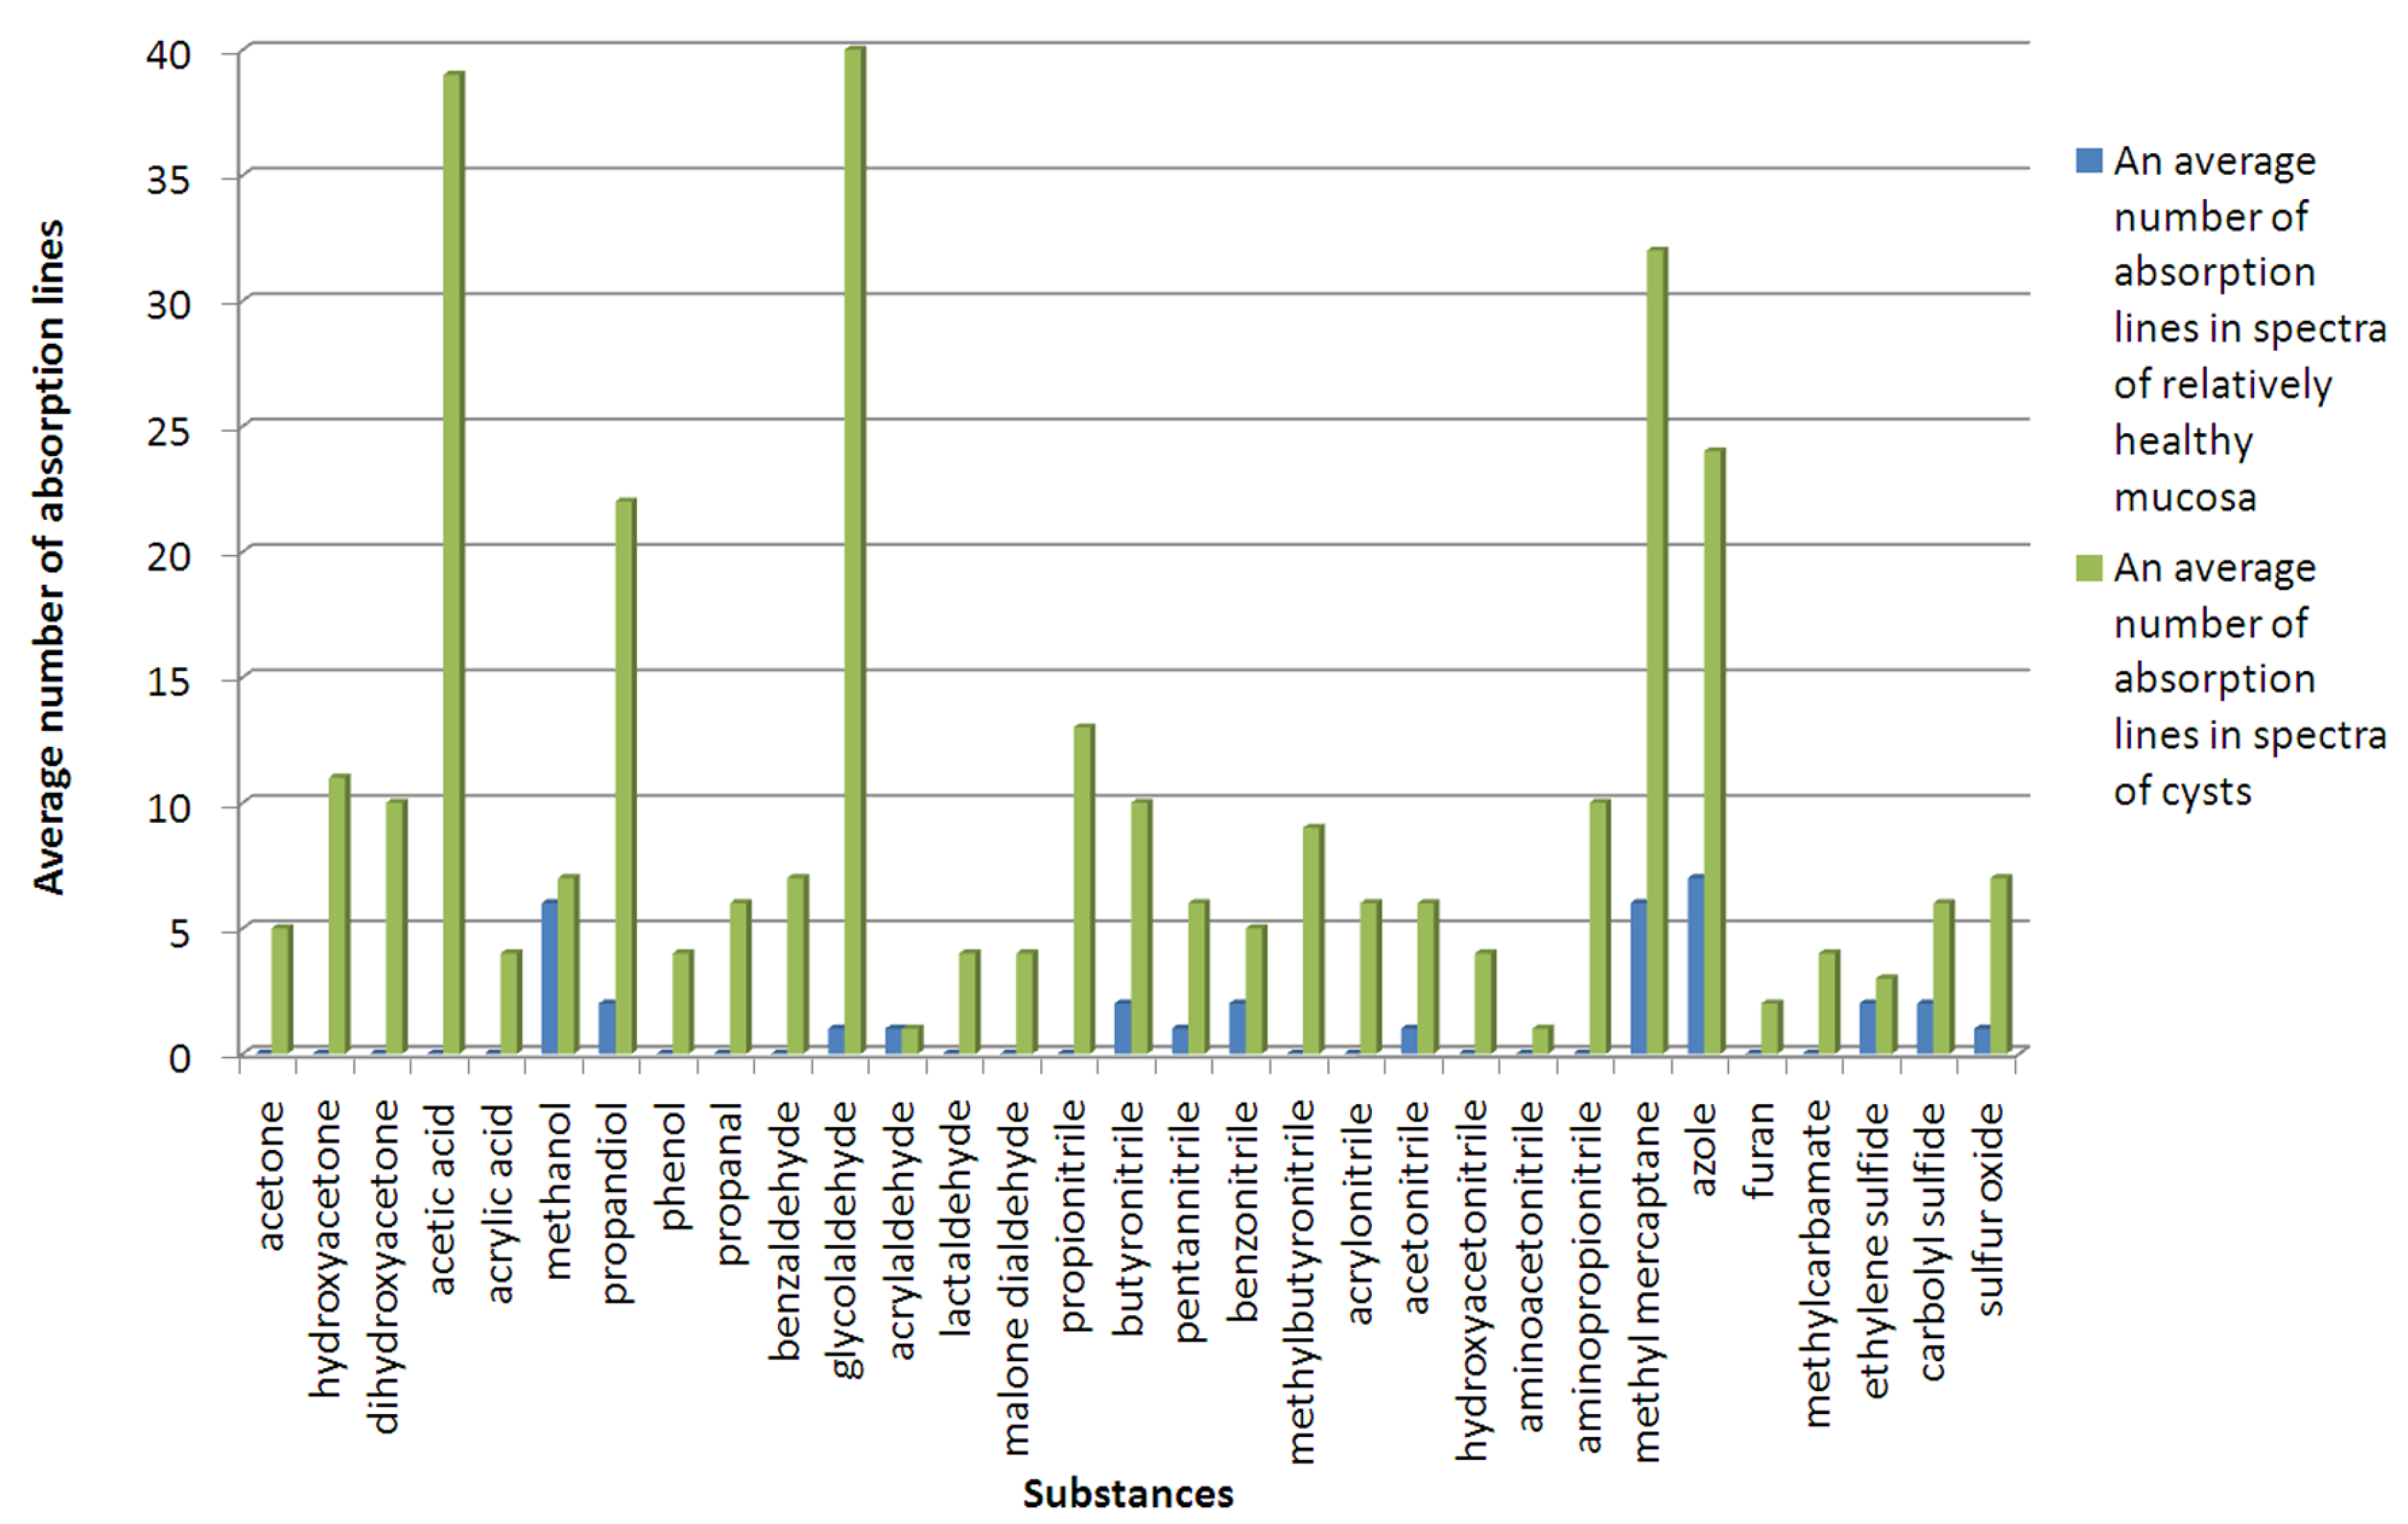
A similar comparison was performed for a relatively healthy mucosa and a cyst from a maxillary sinus (
Figure 4), as well as for a sphenoid sinus polyp and cyst from a maxillary sinus (
Figure 5). One can see a remarkable difference in metabolites in these tissue samples.
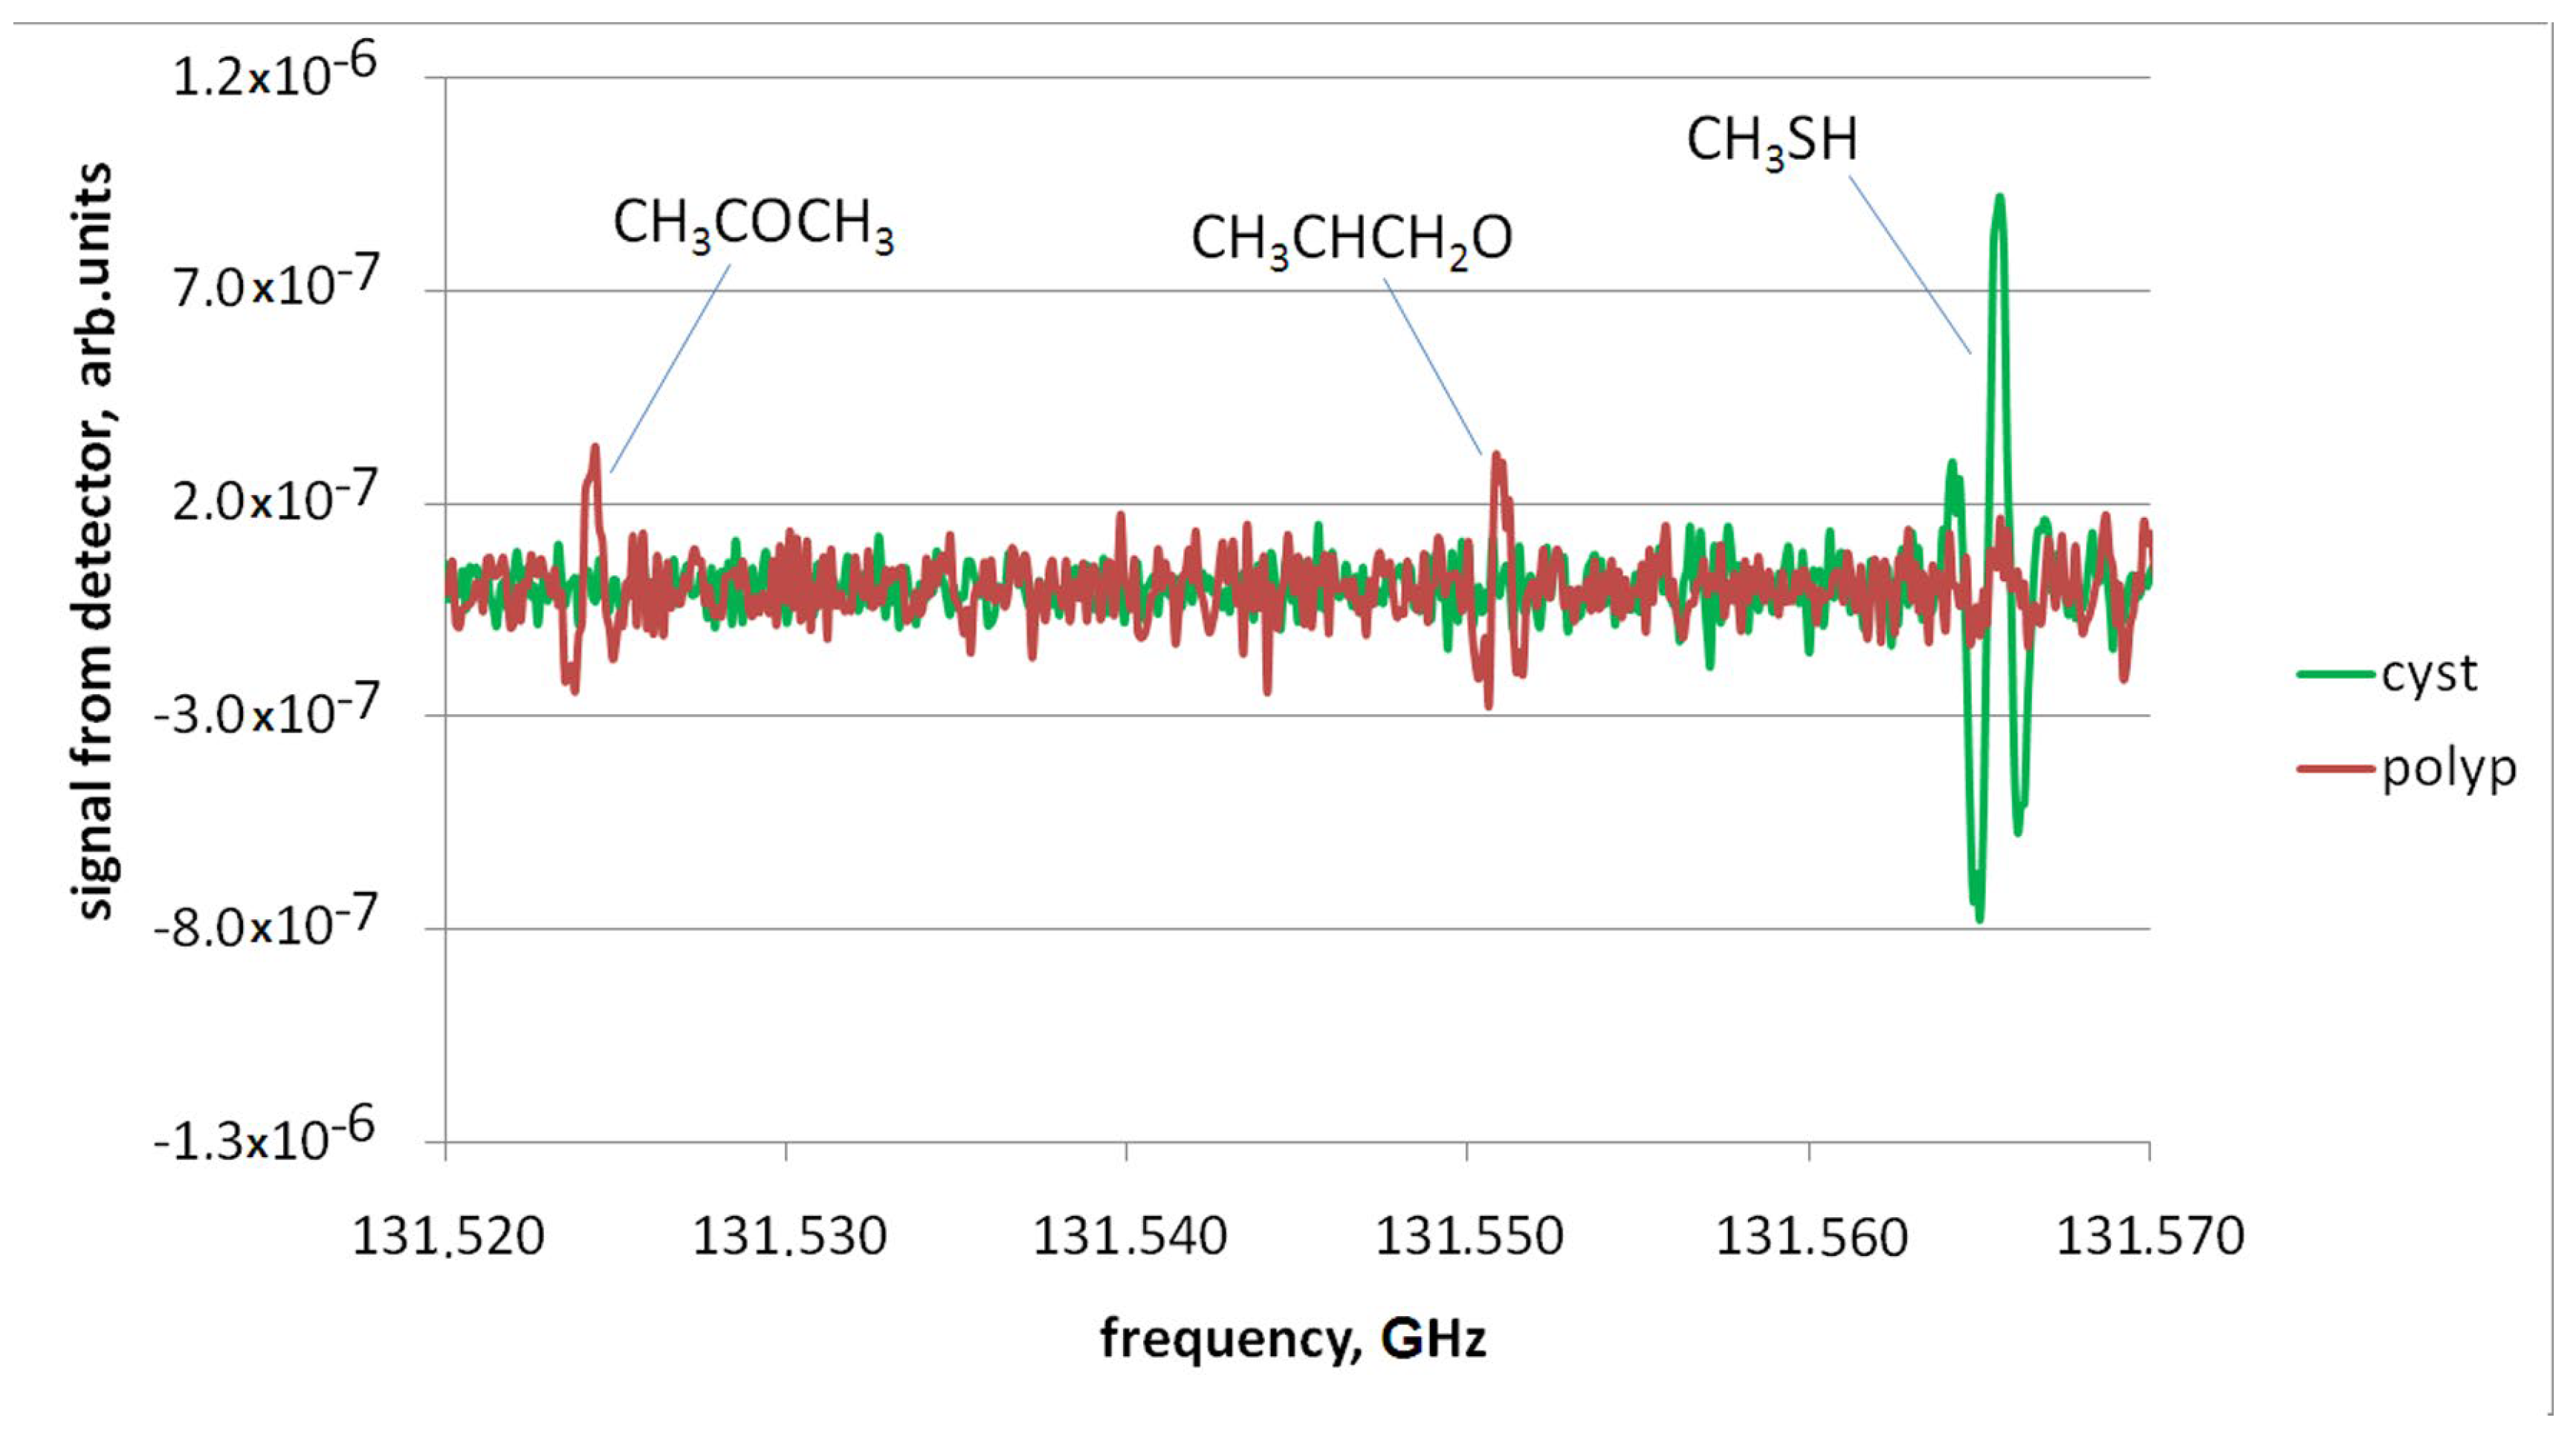
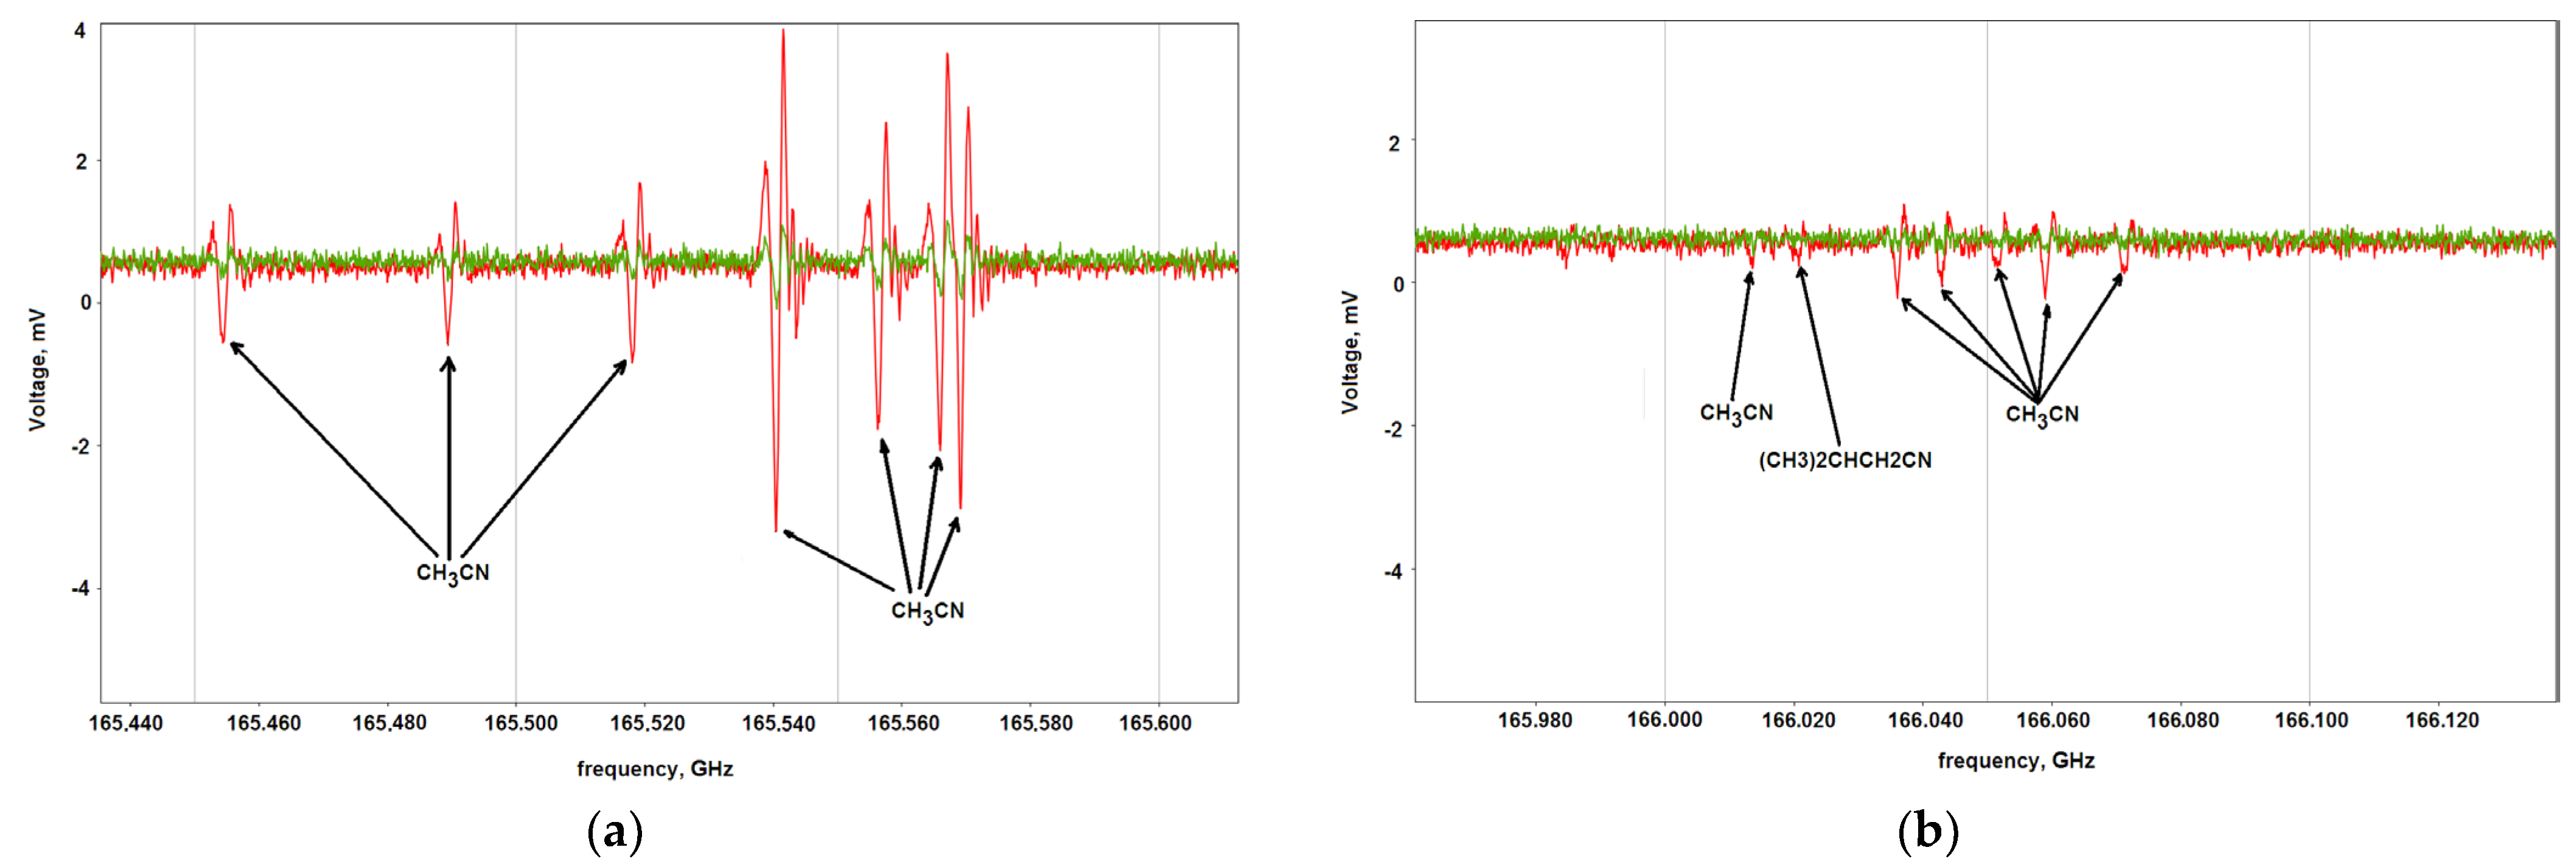
Examples of records of the spectrum section containing lines of individual substances present in the decomposition products of polyp and cyst samples obtained using a phase switching spectrometer and a fast frequency sweep spectrometer are presented in
Figure 6 and
Figure 7.
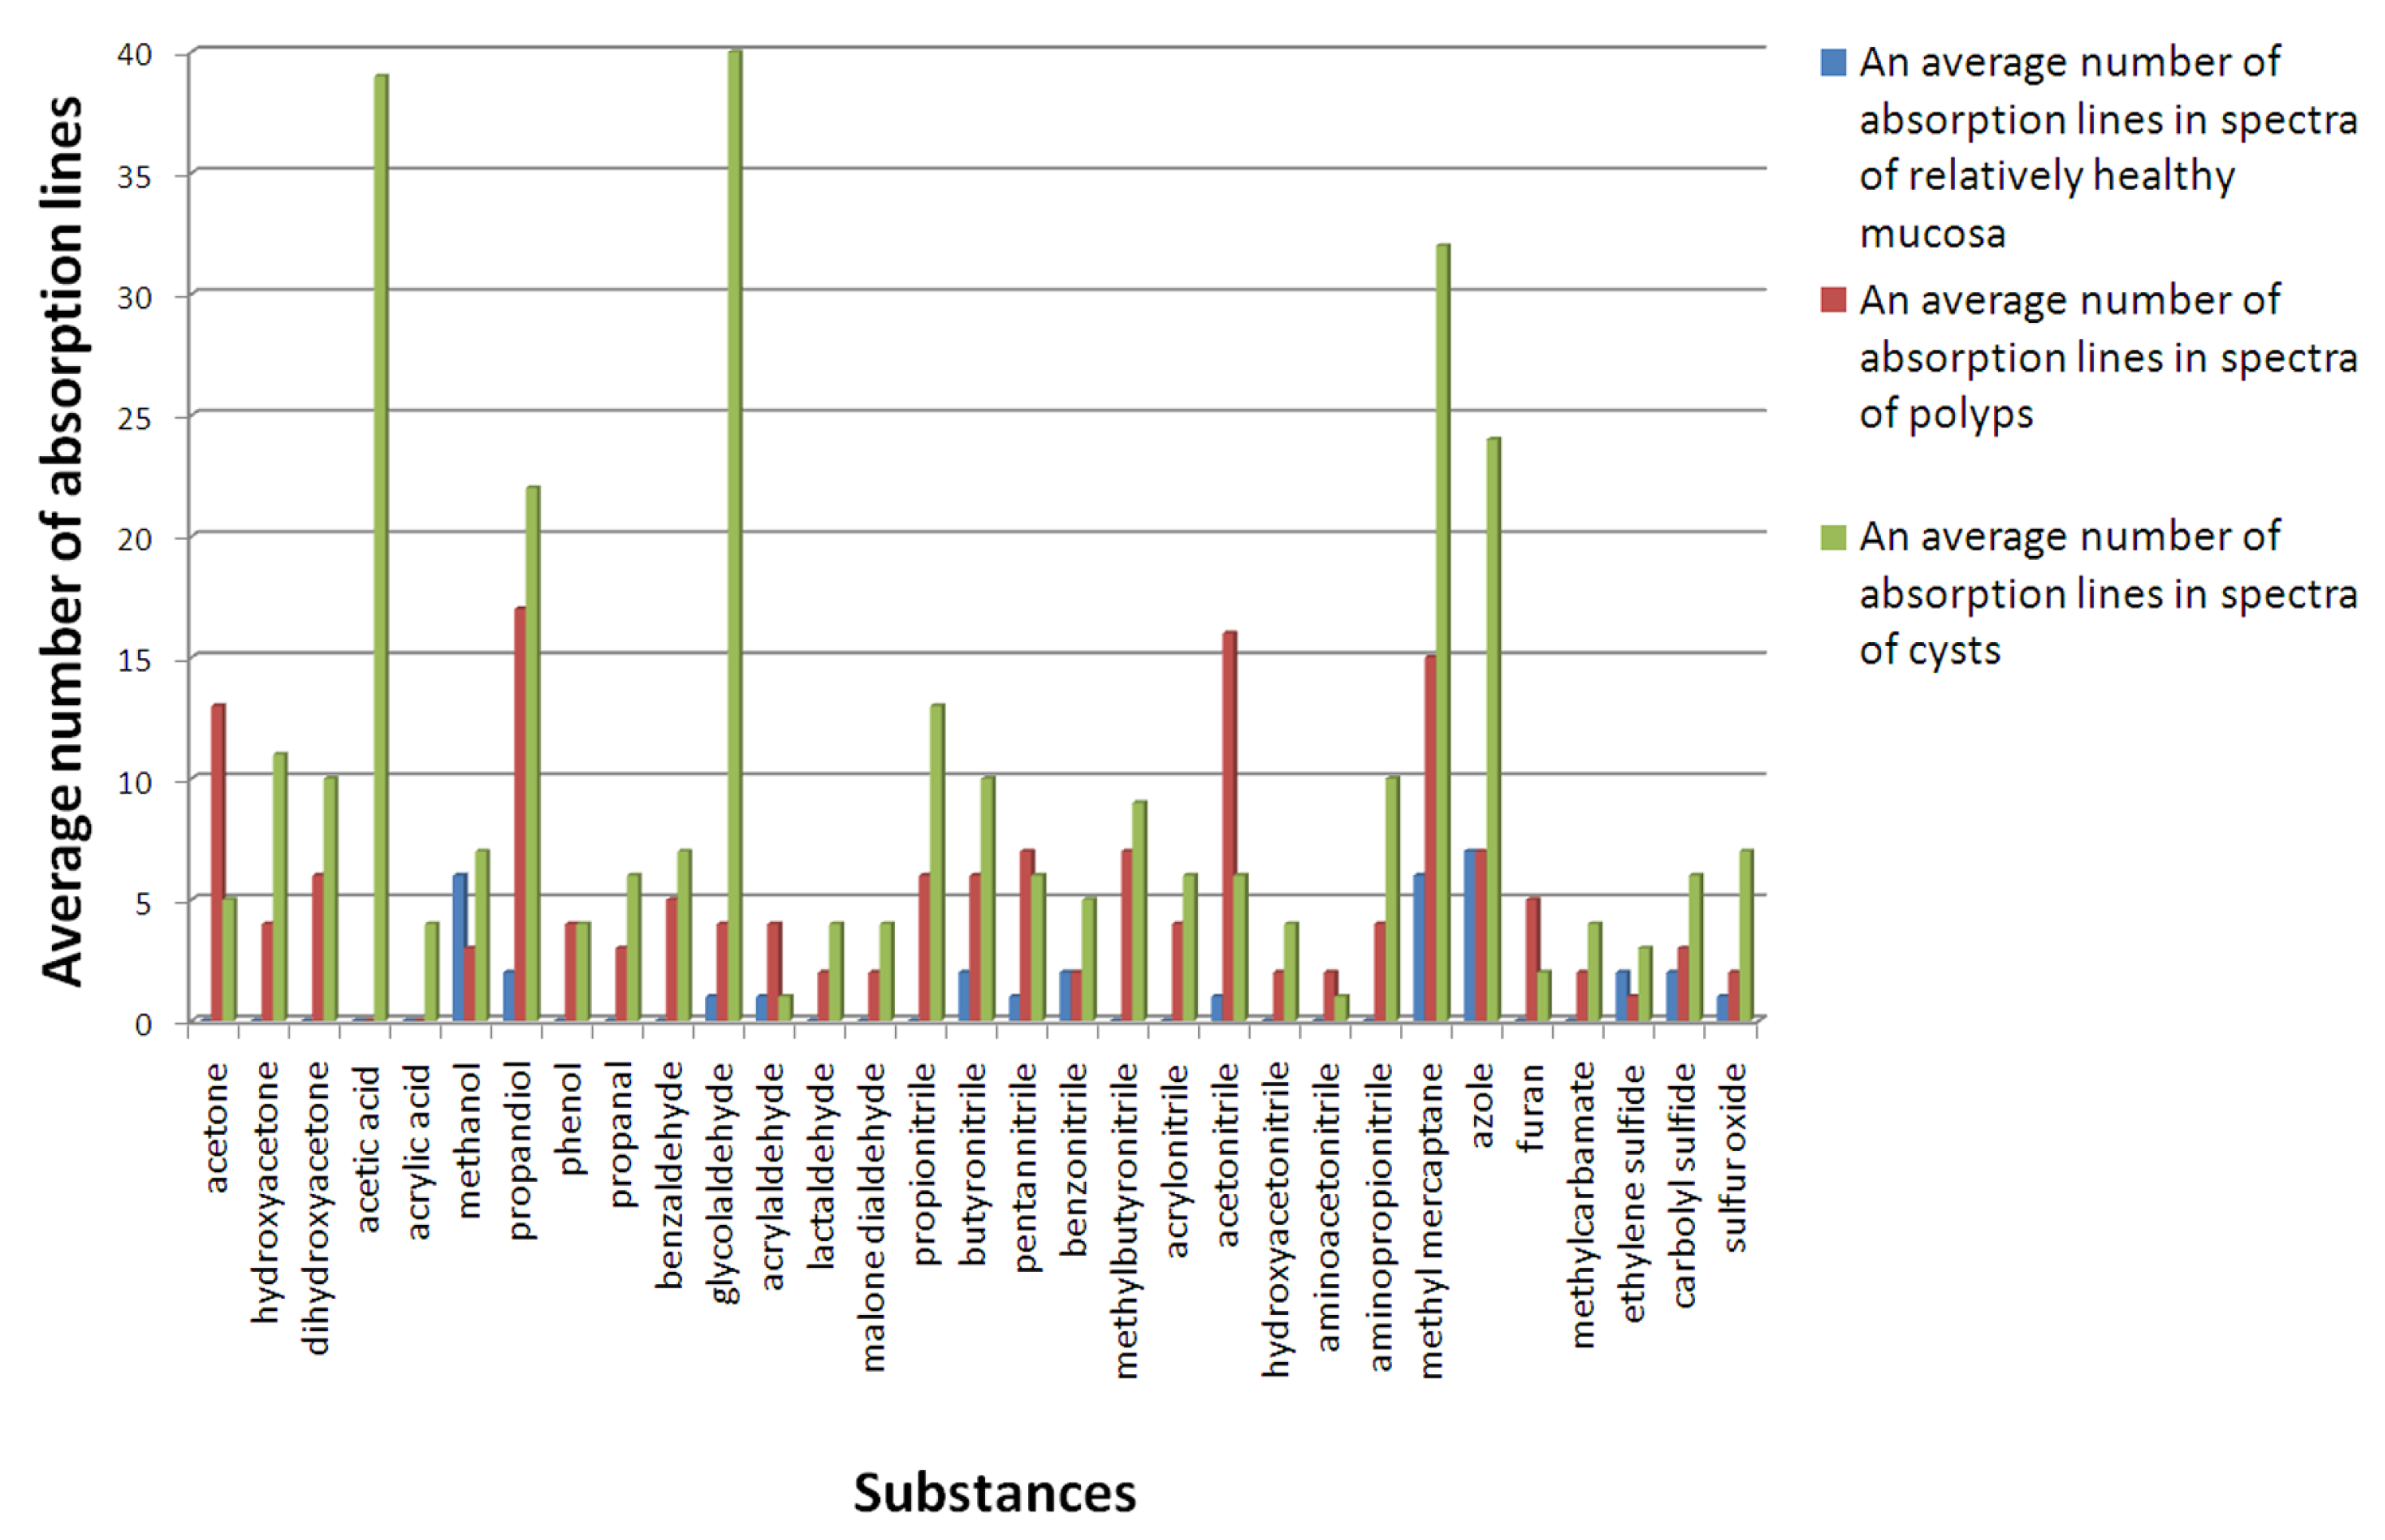
The chemical compositions of the products of thermal decomposition of relatively healthy mucosa, polyps, and cysts are compared in
Table 1 and in
Figure 8.
4. Discussion
Biological systems and objects have been traditionally studied using spectroscopy methods. However, as a rule, these studies pursued only utilitarian goals: tracing the appearance or changes of a given chemical substance during a pathological process. Metabolomics, a new scientific discipline that emerged at the end of the twentieth century, focuses on the study of the final and intermediate products of metabolism with the goal of compiling a metabolic profile that reflects the characteristics of the disease [
3]. From this point of view, an innovative method is high-resolution gas spectroscopy in the terahertz range that makes it possible to detect the largest number of metabolites in different media and tissues and, by analyzing the number of absorption lines, to trace markers characteristic of a particular pathological process [
6,
17].
We have analyzed an assembly of metabolites with the prospect of creating a characteristic metabolic profile with the detection of markers of the pathological process in the sphenoid and maxillary sinuses by the number of absorption lines.
First of all, it should be noted that the absorption lines of acetaldehyde, methyl mercaptan, propanediol, azole, benzonitrile, ethylene sulfide, sulfur oxide, and carbon sulfide are identified both in the spectra of samples of relatively healthy mucosa and in the spectra of polyp and cyst tissues. This allows us to conclude that these substances can be considered markers compiling the metabolic profile of healthy tissue. The analyses of the absorption spectra of polyp and cyst samples demonstrated that the concentration of these substances increases many times when compared to healthy tissue. In addition, during the thermal decomposition of pathological tissue samples, there appear substances such as acetone, hydroxyacetone, dihydroxyacetone, acetonitrile, aminopropionitrile, acrylonitrile, methylbutyronitrile, pentannitrile, and propionitrile, including those with isotopologues, acetic and acrylic acids, glycolaldehyde, and benzaldehyde, which can be regarded as potential markers of pathological tissue.
Thus, the detection in a spectroscopic investigation of a pathological process of chemical compounds whose concentrations differ significantly from those present or absent in a relatively healthy tissue allows us to conclude that there are decomposition products that characterize a certain disease.
5. Conclusions
A comparison of relatively healthy tissue and pathology tissues of the sphenoid and maxillary sinuses using high-resolution THz spectroscopy allows, on the basis of changes in the metabolic profile (different sets of metabolites and their relative content), the creation of a metabolome profile for various phenotypes. In the spectra of the polypous tissues of the sphenoid sinus for substances such as acetone, hydroxyacetone, methylbutironitrile, acetonitrile, pentannitrile, and furan, many times more absorption lines correspond than for relatively healthy mucosae and cysts of the maxillary sinus. A similar analysis was performed on cyst tissue, and potential markers of pathology were identified that did not coincide with the markers of the polyp. These are acetic and acrylic acids, methanol, propanediol, propanal, glycroaldehyde, butyronitril, methylmercaptan, and azole.
It is expected that in the future, this will enable the identification of targets for the treatment of such pathologies. Further studies are needed to obtain statistically significant results.
Author Contributions
Conceptualization, V.V. and A.A.; methodology, V.V., A.A. and E.D.; validation, V.V. and A.A.; formal analysis, E.D., M.C., A.A. and M.S.; investigation, V.A., E.D. and M.C.; resources, A.A., K.G. and R.L.; data curation, E.D., M.C. and A.A.; writing—original draft preparation, M.C., E.D. and A.A.; writing—review and editing, M.C., E.D., A.A. and V.V.; visualization, E.D. and M.C.; supervision, V.V. and A.A.; project administration, E.D. and A.A.; funding acquisition, V.V. All authors have read and agreed to the published version of the manuscript.
Institutional Review Board Statement
The study was conducted according to the operational guidelines for ethics committees that review biomedical research (TDR/PRD/ETHICS/2000.1, WHO, Swiss, Geneva, 2000), the consolidated guideline for Good Clinical Practice (GCP), the international ethical guidelines for health-related research involving humans (CIOMS, 2016) and was approved by the Review Board of Otorhinolaringology, Department of Privolzhsky Research Medical University (protocol code 12 from 10 October 2022).
Informed Consent Statement
Written informed consent has been obtained from the patients to publish this paper.
Data Availability Statement
The data is contained within the article and is partially available in a publicly accessible repository.
Conflicts of Interest
The authors declare no conflict of interest.
References
- Gowda, G.A.N.; Zhang, S.; Gu, H.; Asiago, V.; Shanaiah, N.; Raftery, D. Metabolomics-based methods for early disease diagnostics: A Review. Expert Rev. Mol. Diagn. 2008, 8, 617–633. [Google Scholar] [CrossRef] [PubMed] [Green Version]
- Amann, A.; de Lasy Castello, B.; Miekish, W.; Schubert, J.; Buszewski, B.; Pleil, J.; Ratcliffe, N.; Risby, T. The human volatilome: Volatile organic compounds (VOCs) in exhaled breath, skin emanations, urine, feces and saliva. J. Breath Res. 2014, 8, 034001. [Google Scholar] [CrossRef] [PubMed]
- Wishart, D.S.; Feunang, Y.D.; Marcu, A.; Guo, A.C.; Liang, K.; Vázquez-Fresno, R.; Sajed, T.; Johnson, D.; Li, C.; Karu, N.; et al. HMDB 4.0—The Human Metabolome Database for 2018. Nucleic Acids Res. 2018, 46, D608–D617. [Google Scholar] [CrossRef] [PubMed]
- Boullaud, L.; Blasco, H.; Trinh, T.-T.; Bakhos, D. Metabolomic Studies in Inner Ear Pathologies. Metabolites 2022, 12, 214. [Google Scholar] [CrossRef] [PubMed]
- Zhang, X.; Zhang, N.; Huang, Q.; Cui, S.; Liu, L.; Zhou, B. Analysis of metabolites of fungal balls in the paranasal sinuses. BMC Infect. Dis. 2022, 22, 733. [Google Scholar] [CrossRef] [PubMed]
- Vaks, V.; Aizenshtadt, A.; Anfertev, V.; Chernyaeva, M.; Domracheva, E.; Gavrilova, K.; Larin, R.; Pripolzin, S.; Shakhova, M. Analysis of the Thermal Decomposition Products of Pathological and Healthy Tissues in Paranasal Sinuses: A High-Resolution Terahertz Gas Spectroscopy Study. Appl. Sci. 2021, 11, 7562. [Google Scholar] [CrossRef]
- Vaks, V.L.; Anfertev, V.A.; Balakirev, V.Y.; Basov, S.A.; Domracheva, E.G.; Illyuk, A.V.; Kupriyanov, P.V.; Pripolzin, S.I.; Chernyaeva, M.B. High resolution terahertz spectroscopy for analytical applications. Phys. Uspekhi 2020, 63, 708–720. [Google Scholar] [CrossRef]
- Vaks, V.L.; Domracheva, E.G.; Sobakinskaya, E.A.; Chernyaeva, M.B. Exhaled breath analysis: Physical methods, instruments and medical diagnostics. Phys. Uspekhi 2014, 57, 684–701. [Google Scholar] [CrossRef]
- Lykina, A.A.; Anfertev, V.A.; Domracheva, E.G.; Chernyaeva, M.B.; Kononova, Y.A.; Toropova, Y.G.; Korolev, D.V.; Smolyanskaya, O.A.; Vaks, V.L. Terahertz high-resolution spectroscopy of thermal decomposition gas products of diabetic and non-diabetic blood plasma and kidney tissue pellets. J. Biomed. Opt. 2021, 26, 043008. [Google Scholar] [CrossRef] [PubMed]
- Rothbart, N.; Holz, O.; Koczulla, R.; Schmalz, K.; Hubers, H.-W. Analysis of Human Breath by Millimeter-Wave/Terahertz Spectroscopy. Sensors 2019, 19, 2719. [Google Scholar] [CrossRef] [PubMed] [Green Version]
- Pickett, H.M.; Cohen, E.A.; Drouin, B.J.; Pearson, J.C. Submillimeter, Millimeter, and Microwave Spectral Line Catalog. JPL Molecular Spectroscopy. California Institute of Technology. Available online: http://spec.jpl.nasa.gov/ftp/pub/catalog/catform.html (accessed on 9 October 2022).
- Endres, C.P.; Schlemmer, S.; Schilke, P.; Stutzki, J.; Müller, H.S.P. The Cologne Database for Molecular Spectroscopy, CDMS, in the Virtual Atomic and Molecular Data Centre, VAMDC. J. Mol. Spectrosc. 2016, 327, 95–104. [Google Scholar] [CrossRef] [Green Version]
- Schmalz, K.; Rothbart, N.; Eissa, M.H.; Borngraber, J.; Kissinger, D.; Hubers, H.-W. Transmitters and receivers in SiGeBiCMOS technology for sensitive gas spectroscopy at 222–270 GHz. AIP Adv. 2019, 9, 015213. [Google Scholar] [CrossRef] [Green Version]
- Vaks, V.L.; Anfertev, V.A.; Chernyaeva, M.B.; Domracheva, E.G.; Pripolzin, S.I.; Baranov, A.N.; Teissier, R.; Ayzenshtadt, A.A.; Gavrilova, K.A. On possibility of advance of non-stationary gas spectroscopy method realized with using fast frequency sweeping mode upward through the terahertz range. Radiophys. Quantum Electron. 2022, in press. [Google Scholar]
- Townes, C.H.; Schawlow, A.L. Microwave Spectroscopy; McGraw-Hill: New York, NY, USA, 1955; p. 720. [Google Scholar]
- Gordy, W.; Cook, R.L. Techniques of Chemistry. In Microwave Molecular Spectra; John Wiley & Sons: New York, NY, USA, 1984; Volume XVIII, p. 929. [Google Scholar]
- Vaks, V.L.; Domracheva, E.G.; Chernyaeva, M.B.; Anfertev, V.A.; Ayzenshtadt, A.A.; Gavrilova, K.A.; Larin, R.A. Application of high-resolution terahertz gas spectroscopy to the compositional analysis of the thermal decomposition products of paranasal sinus cyst tissue. J. Opt. Technol. 2021, 88, 166–168. [Google Scholar] [CrossRef]
| Disclaimer/Publisher’s Note: The statements, opinions and data contained in all publications are solely those of the individual author(s) and contributor(s) and not of MDPI and/or the editor(s). MDPI and/or the editor(s) disclaim responsibility for any injury to people or property resulting from any ideas, methods, instructions or products referred to in the content. |
© 2023 by the authors. Licensee MDPI, Basel, Switzerland. This article is an open access article distributed under the terms and conditions of the Creative Commons Attribution (CC BY) license (https://creativecommons.org/licenses/by/4.0/).

 ,
, 


