
A Comparative Study in Forming Behavior of Different Grades of Steel in Cold Forging Backward Extrusion by Integrating Artificial Neural Network (ANN) with Differential Evolution (DE) Algorithm

 , ,
, ,
Abstract
:1. Introduction
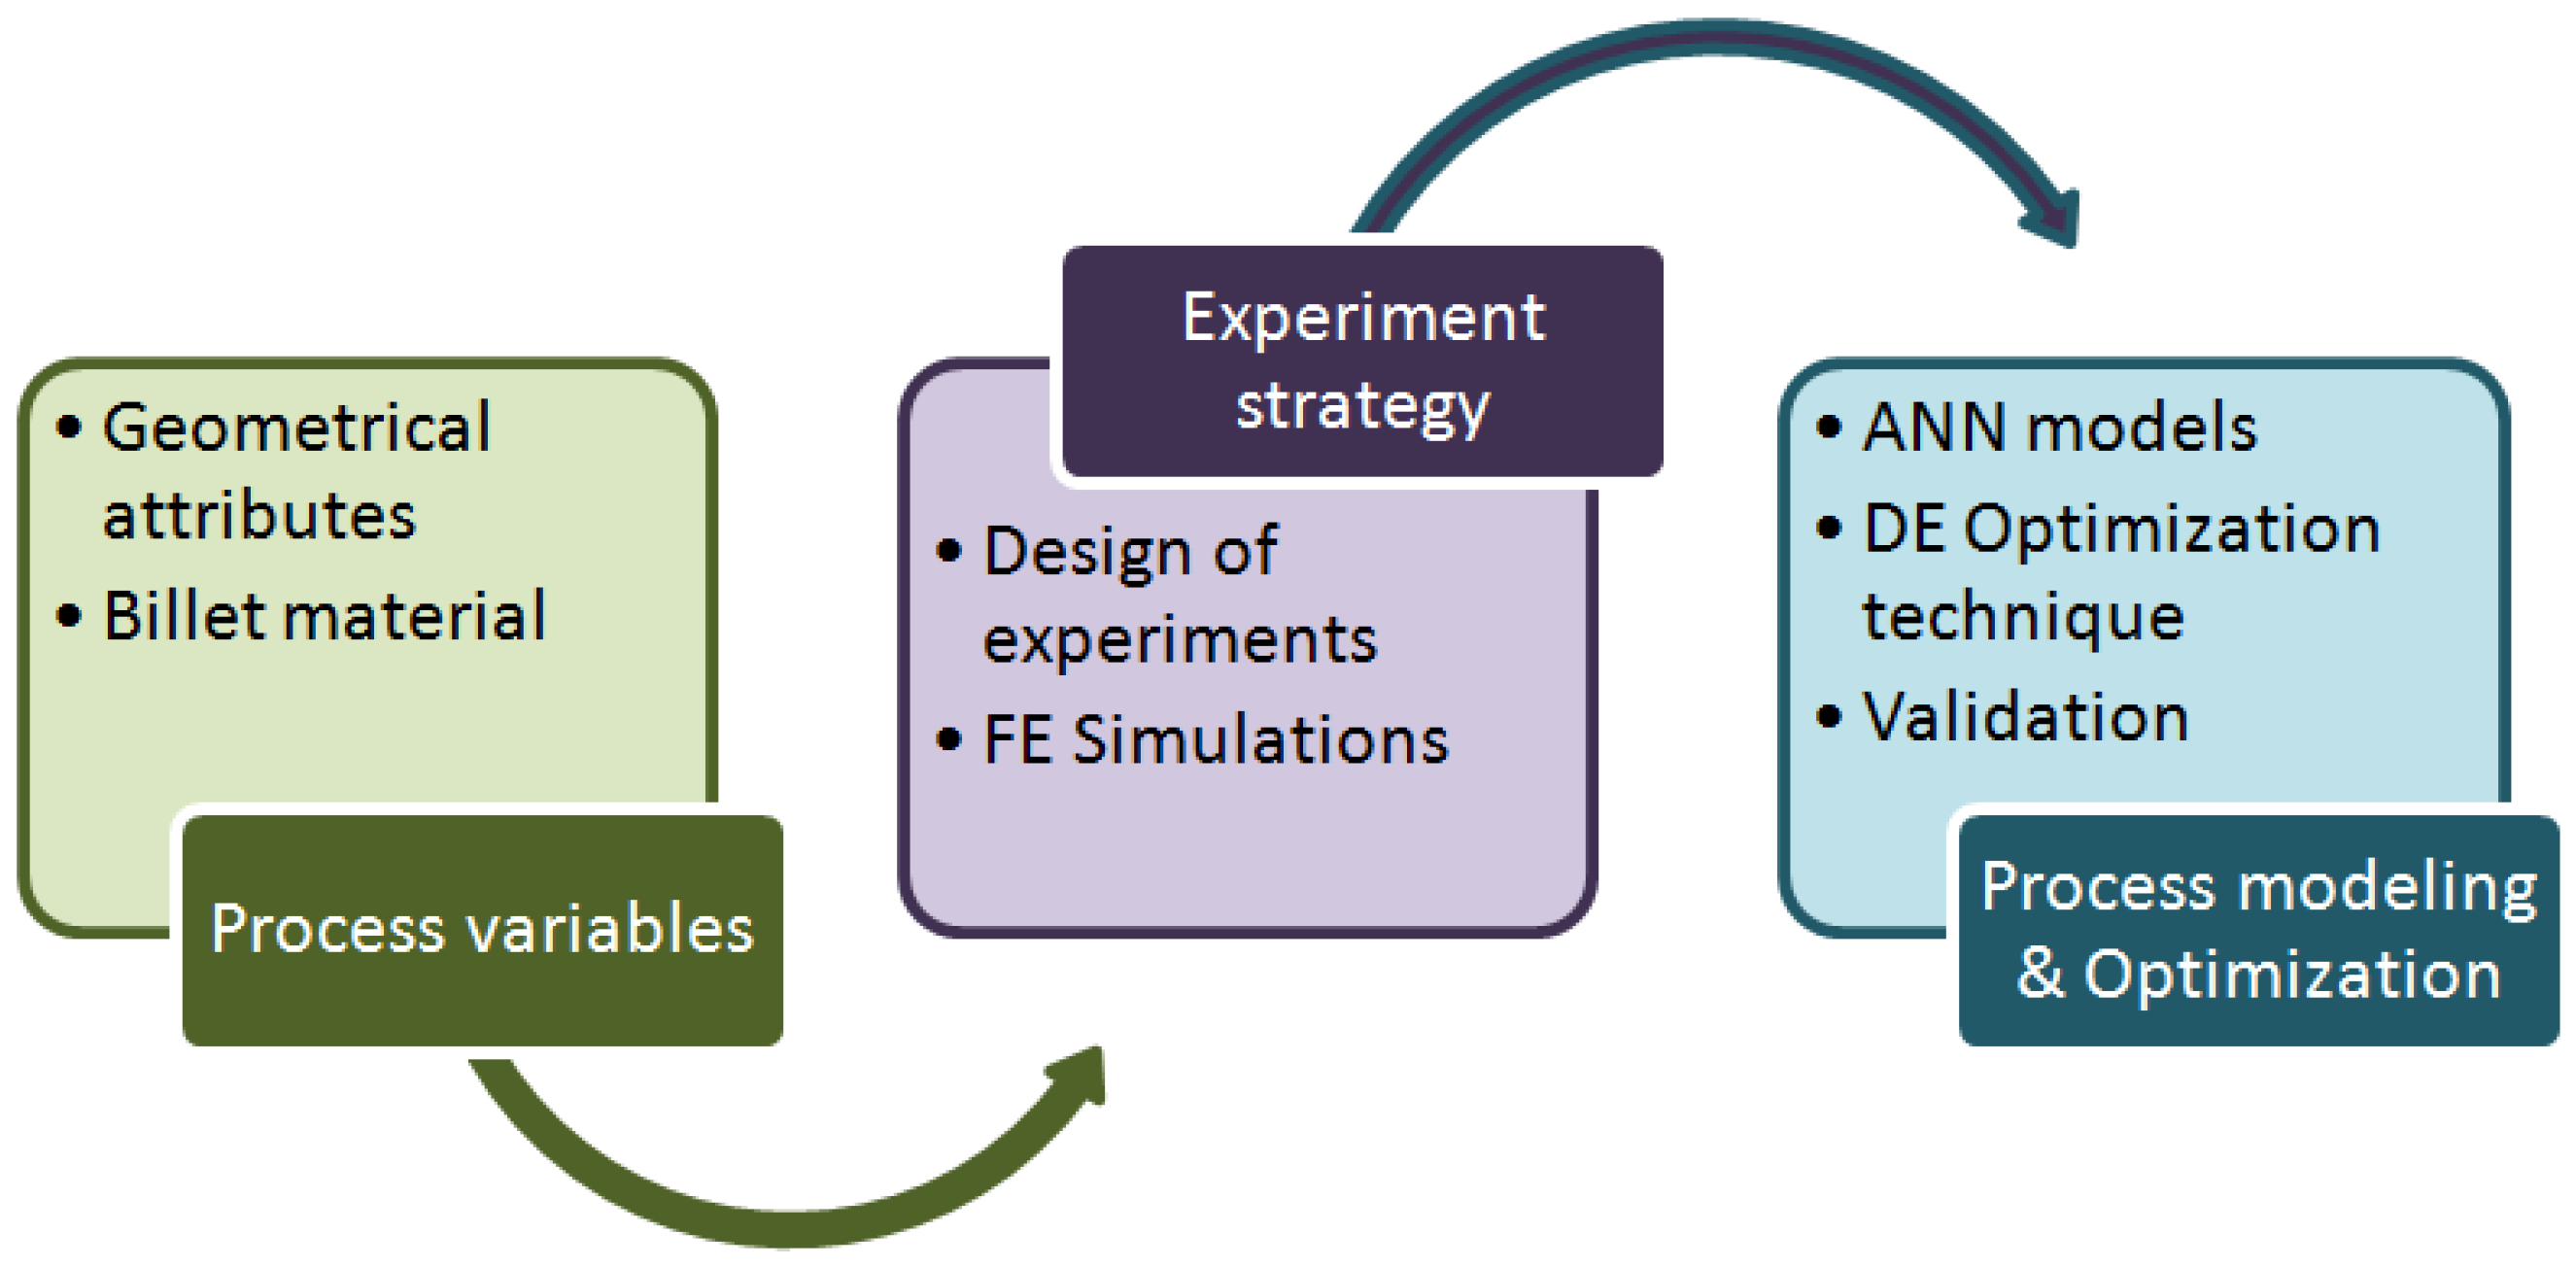
2. Method and Materials
2.1. Materials
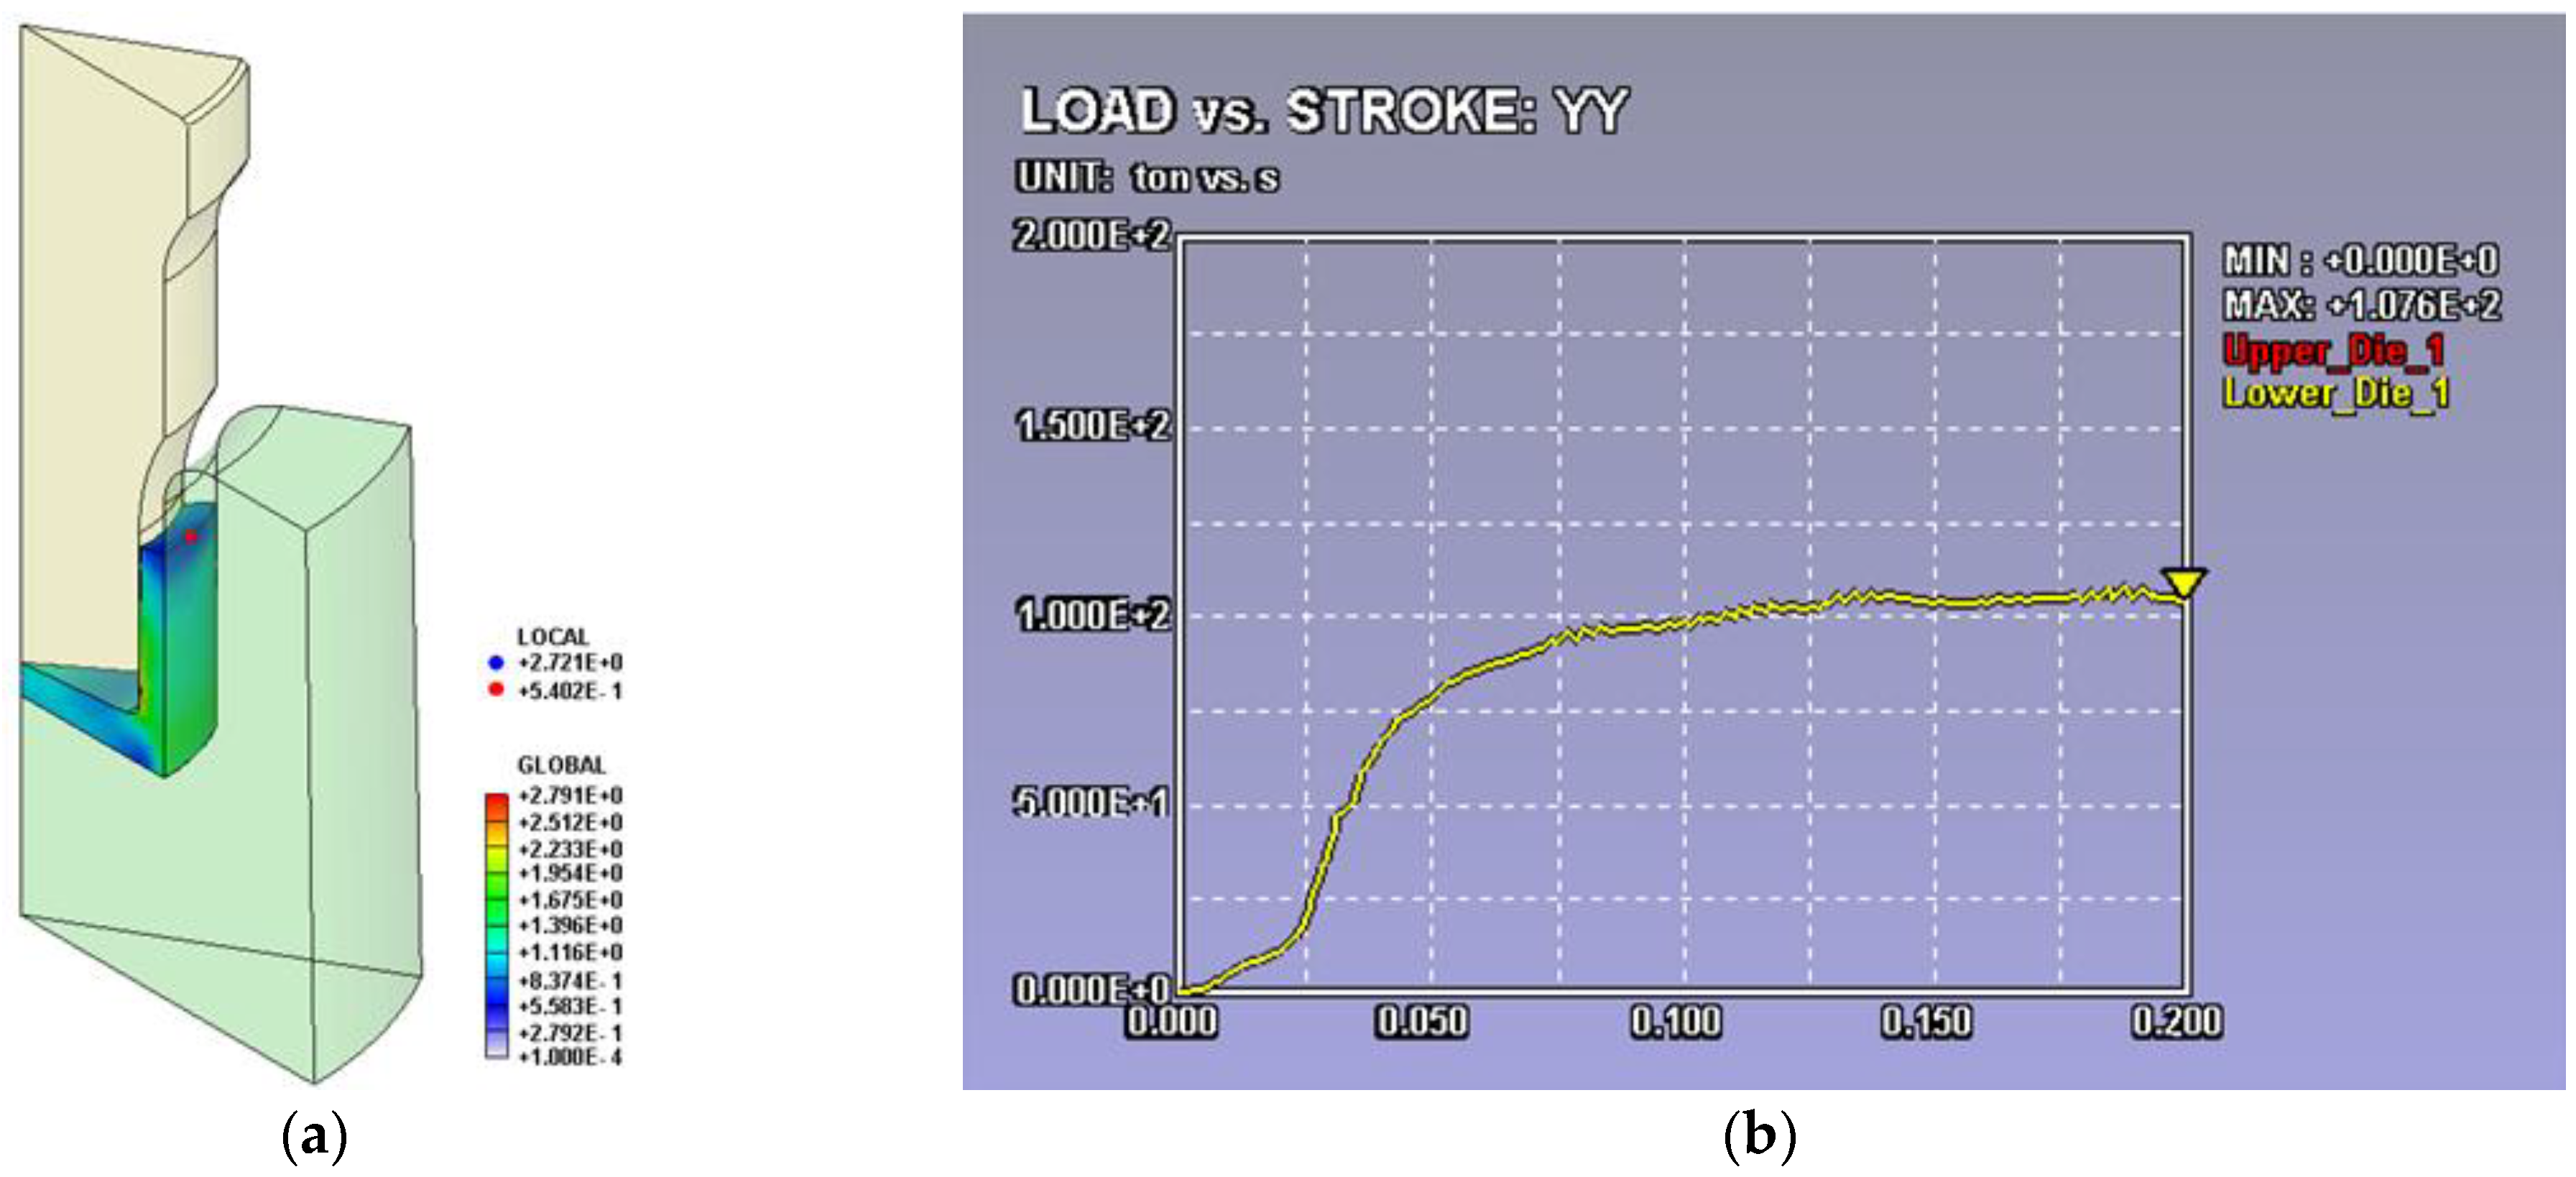
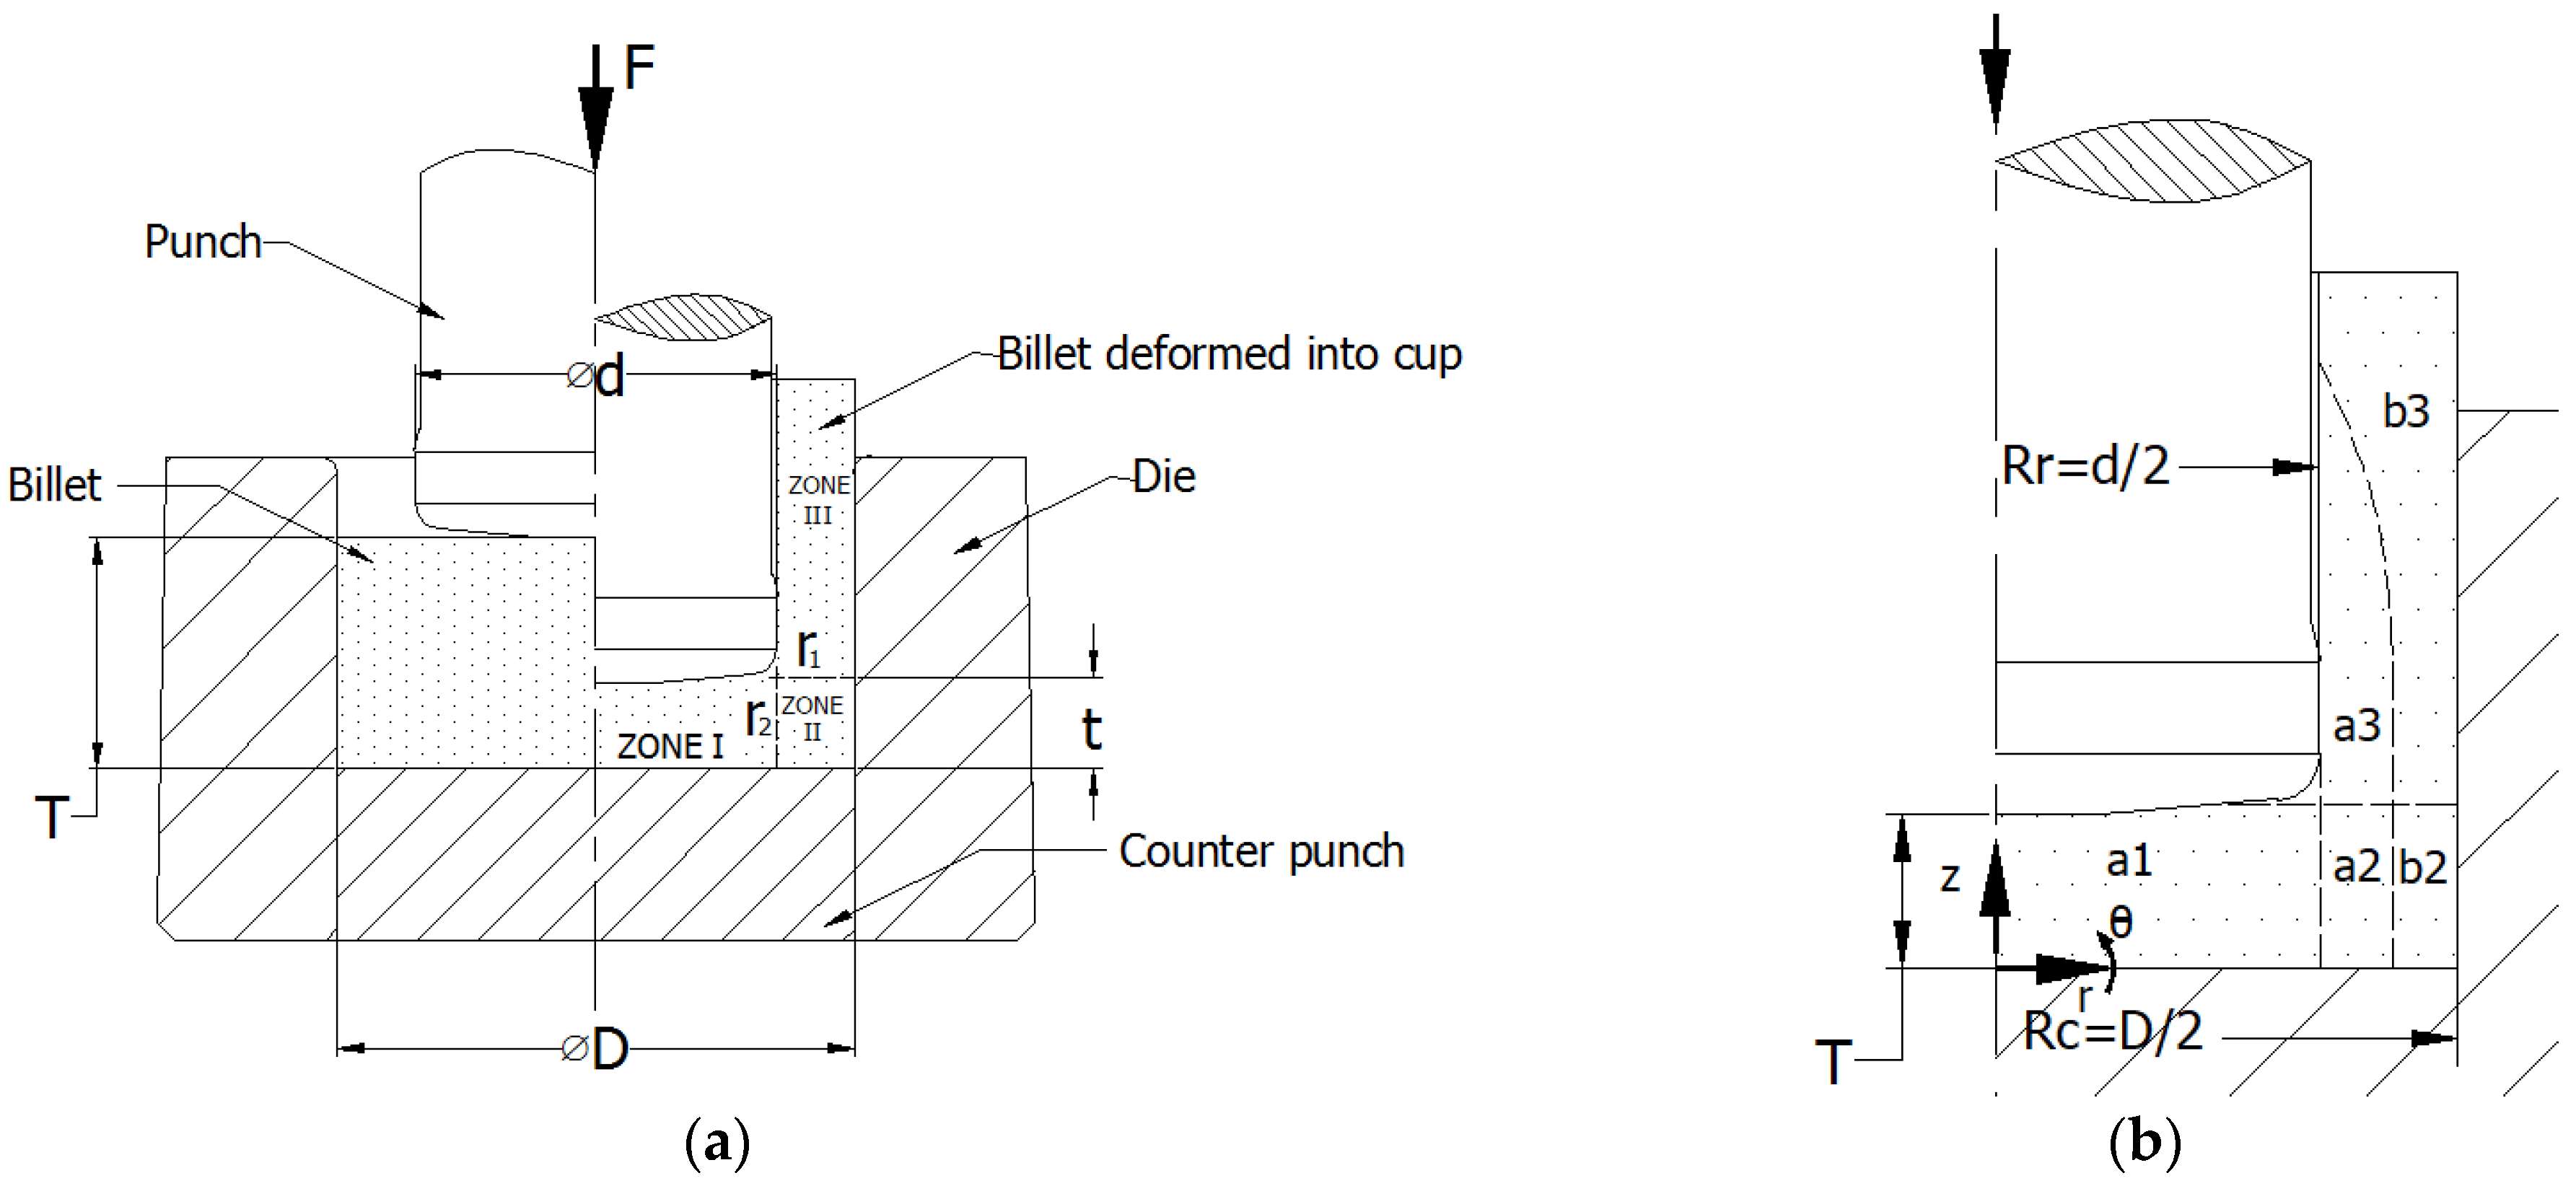
2.2. Process Variables and Finite Element Simulations
2.3. Process Modeling and Optimization
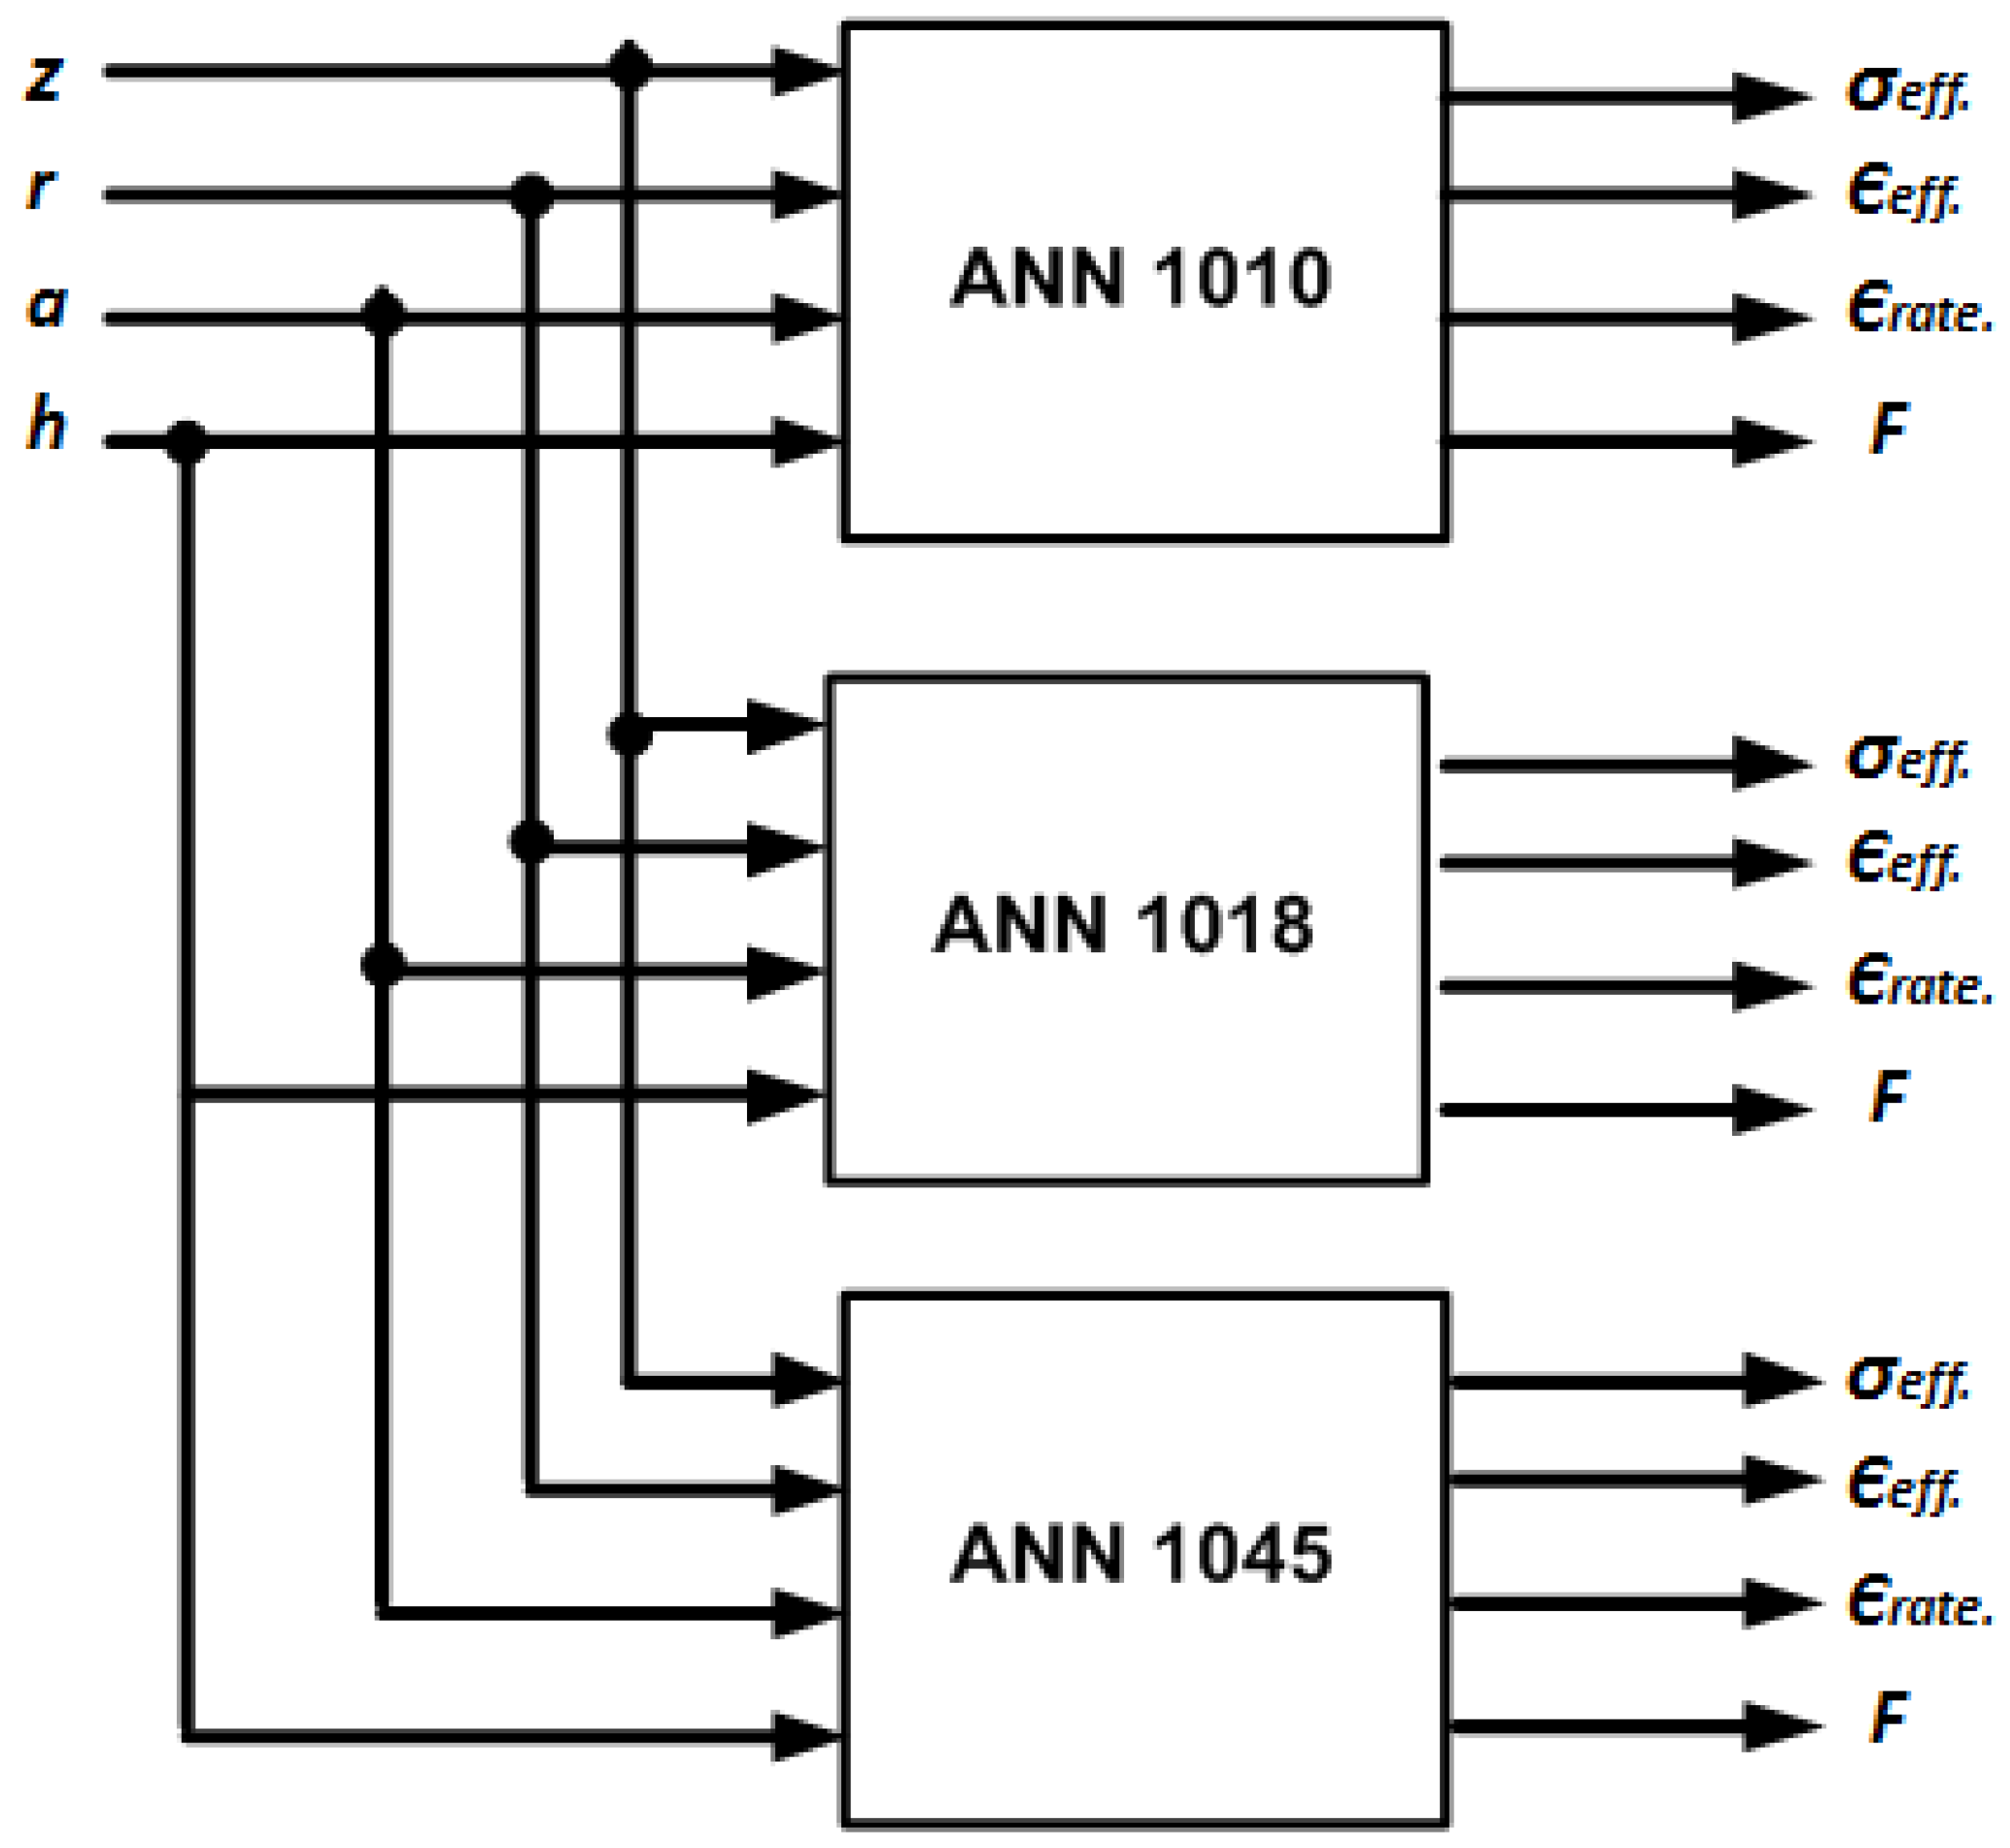
2.3.1. ANN Process Modeling
2.3.2. Methodology of DE Optimization
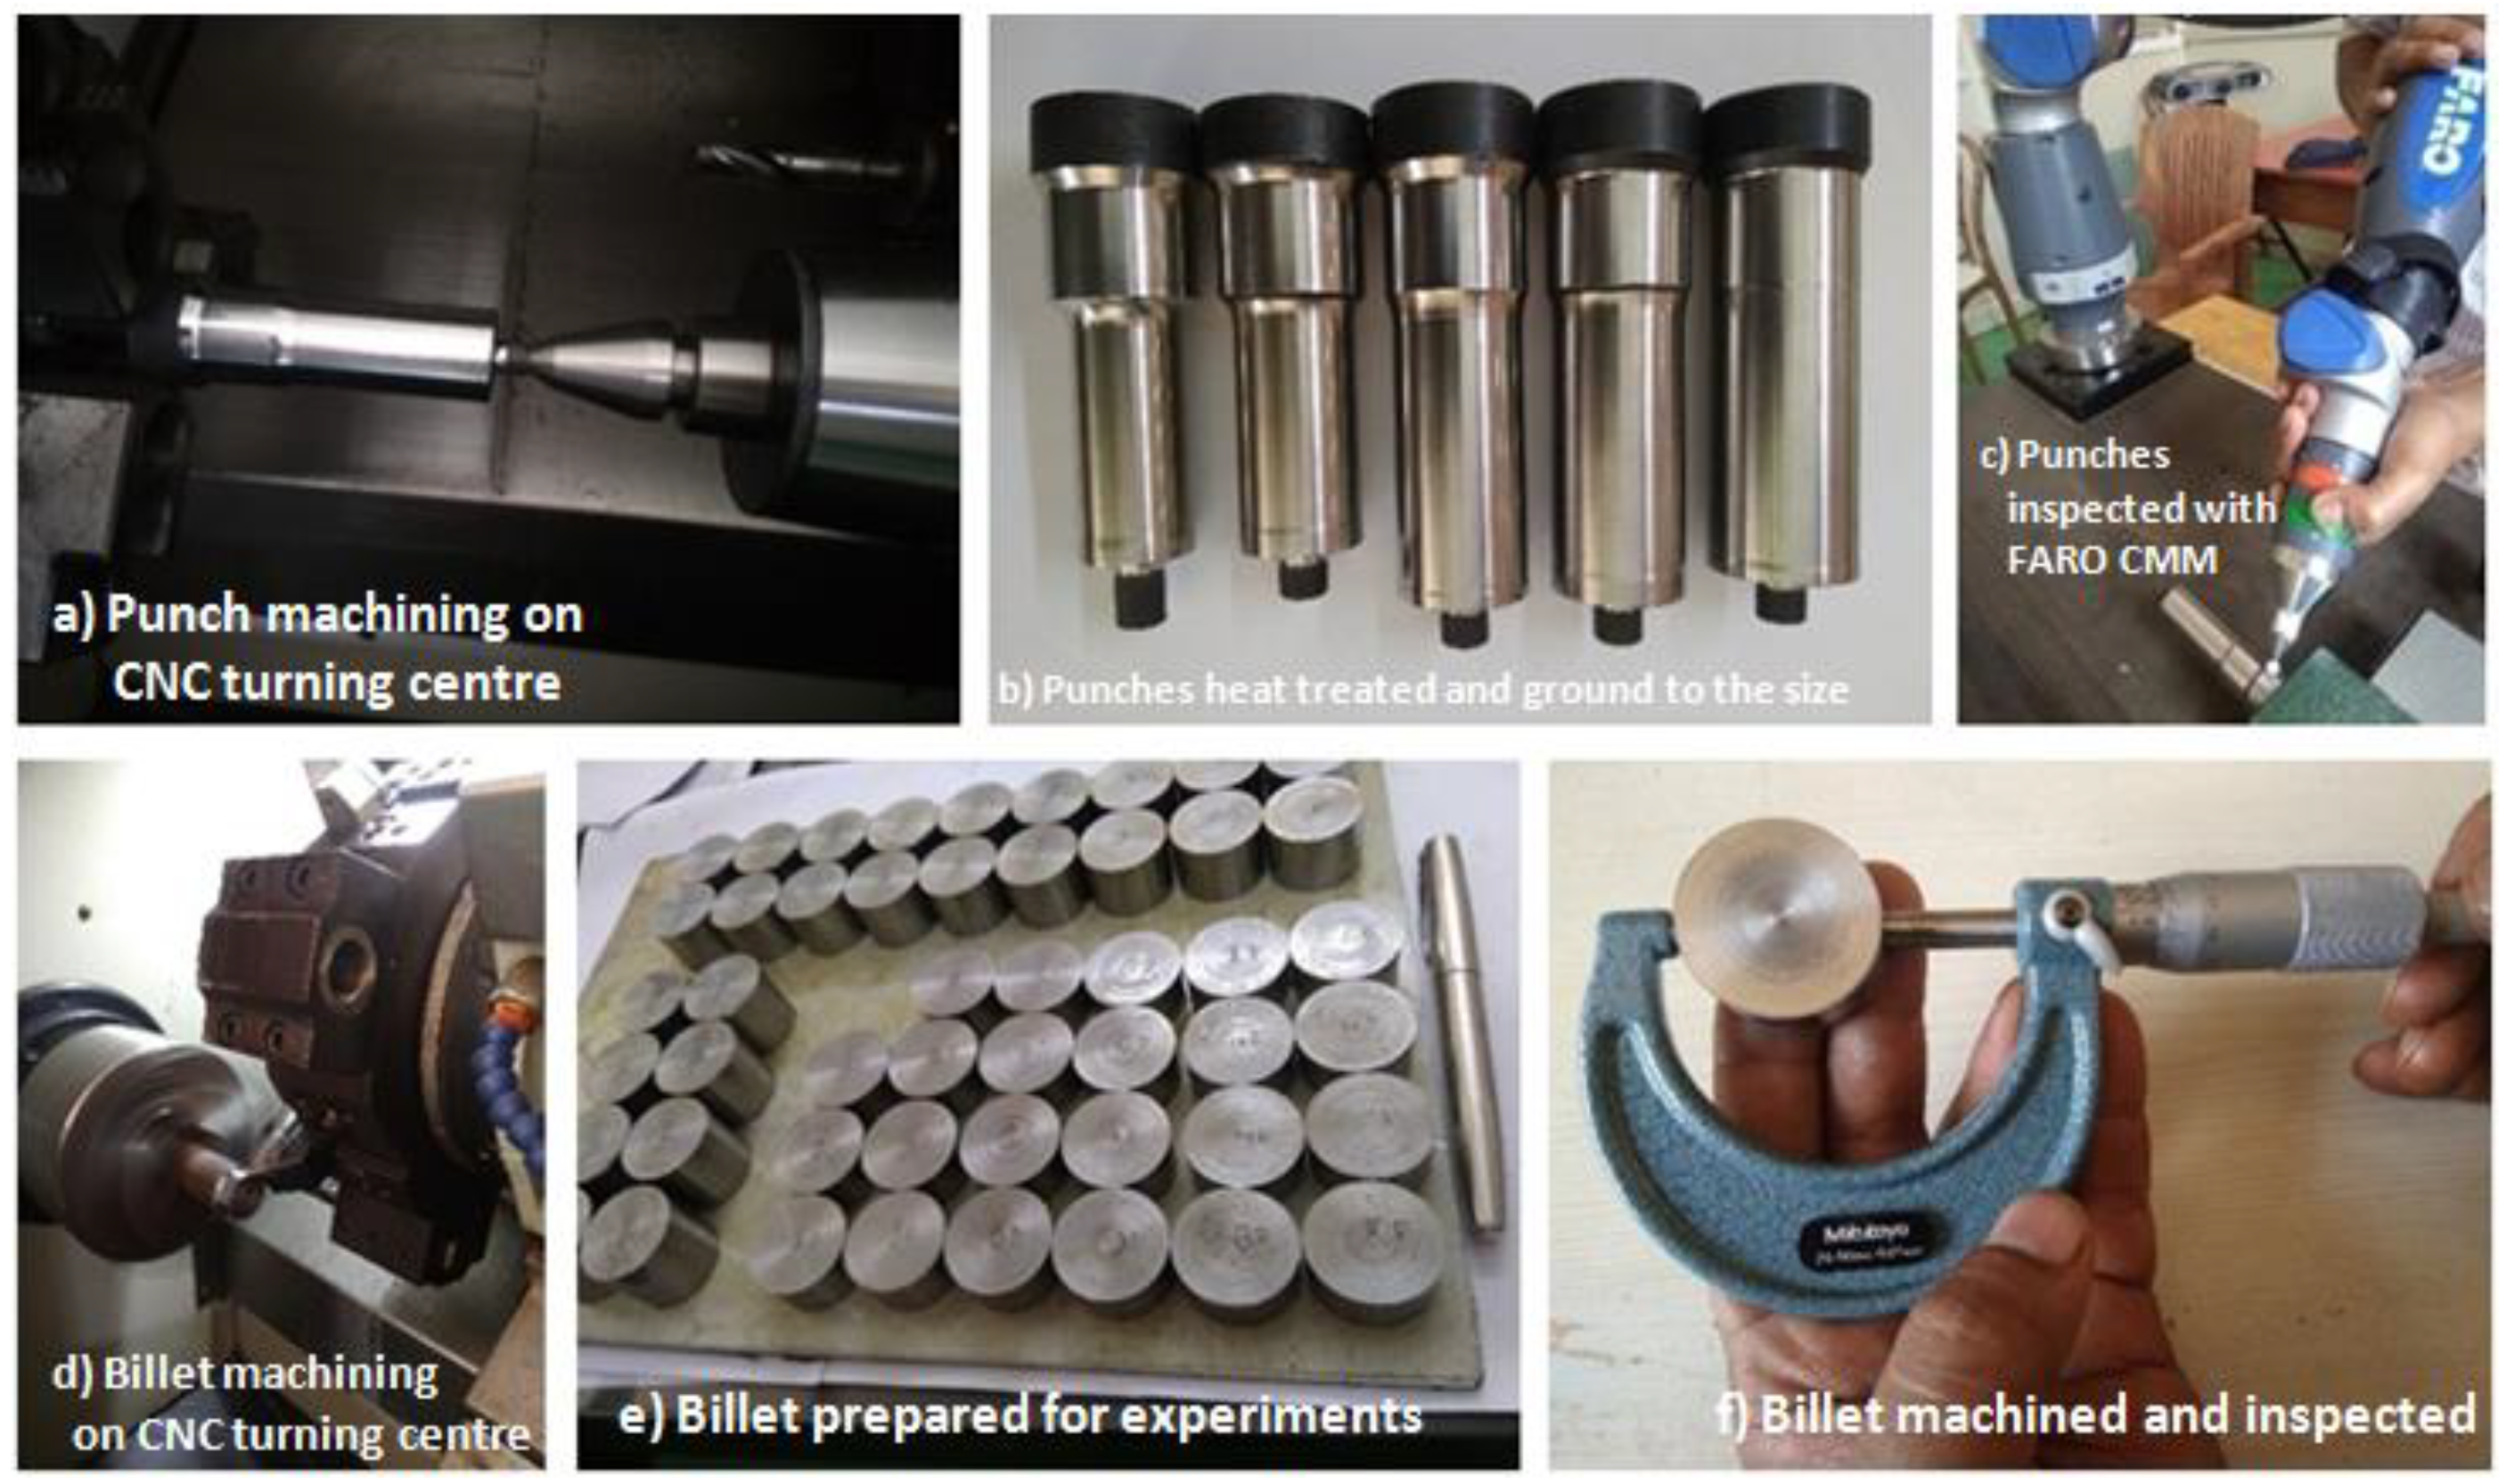
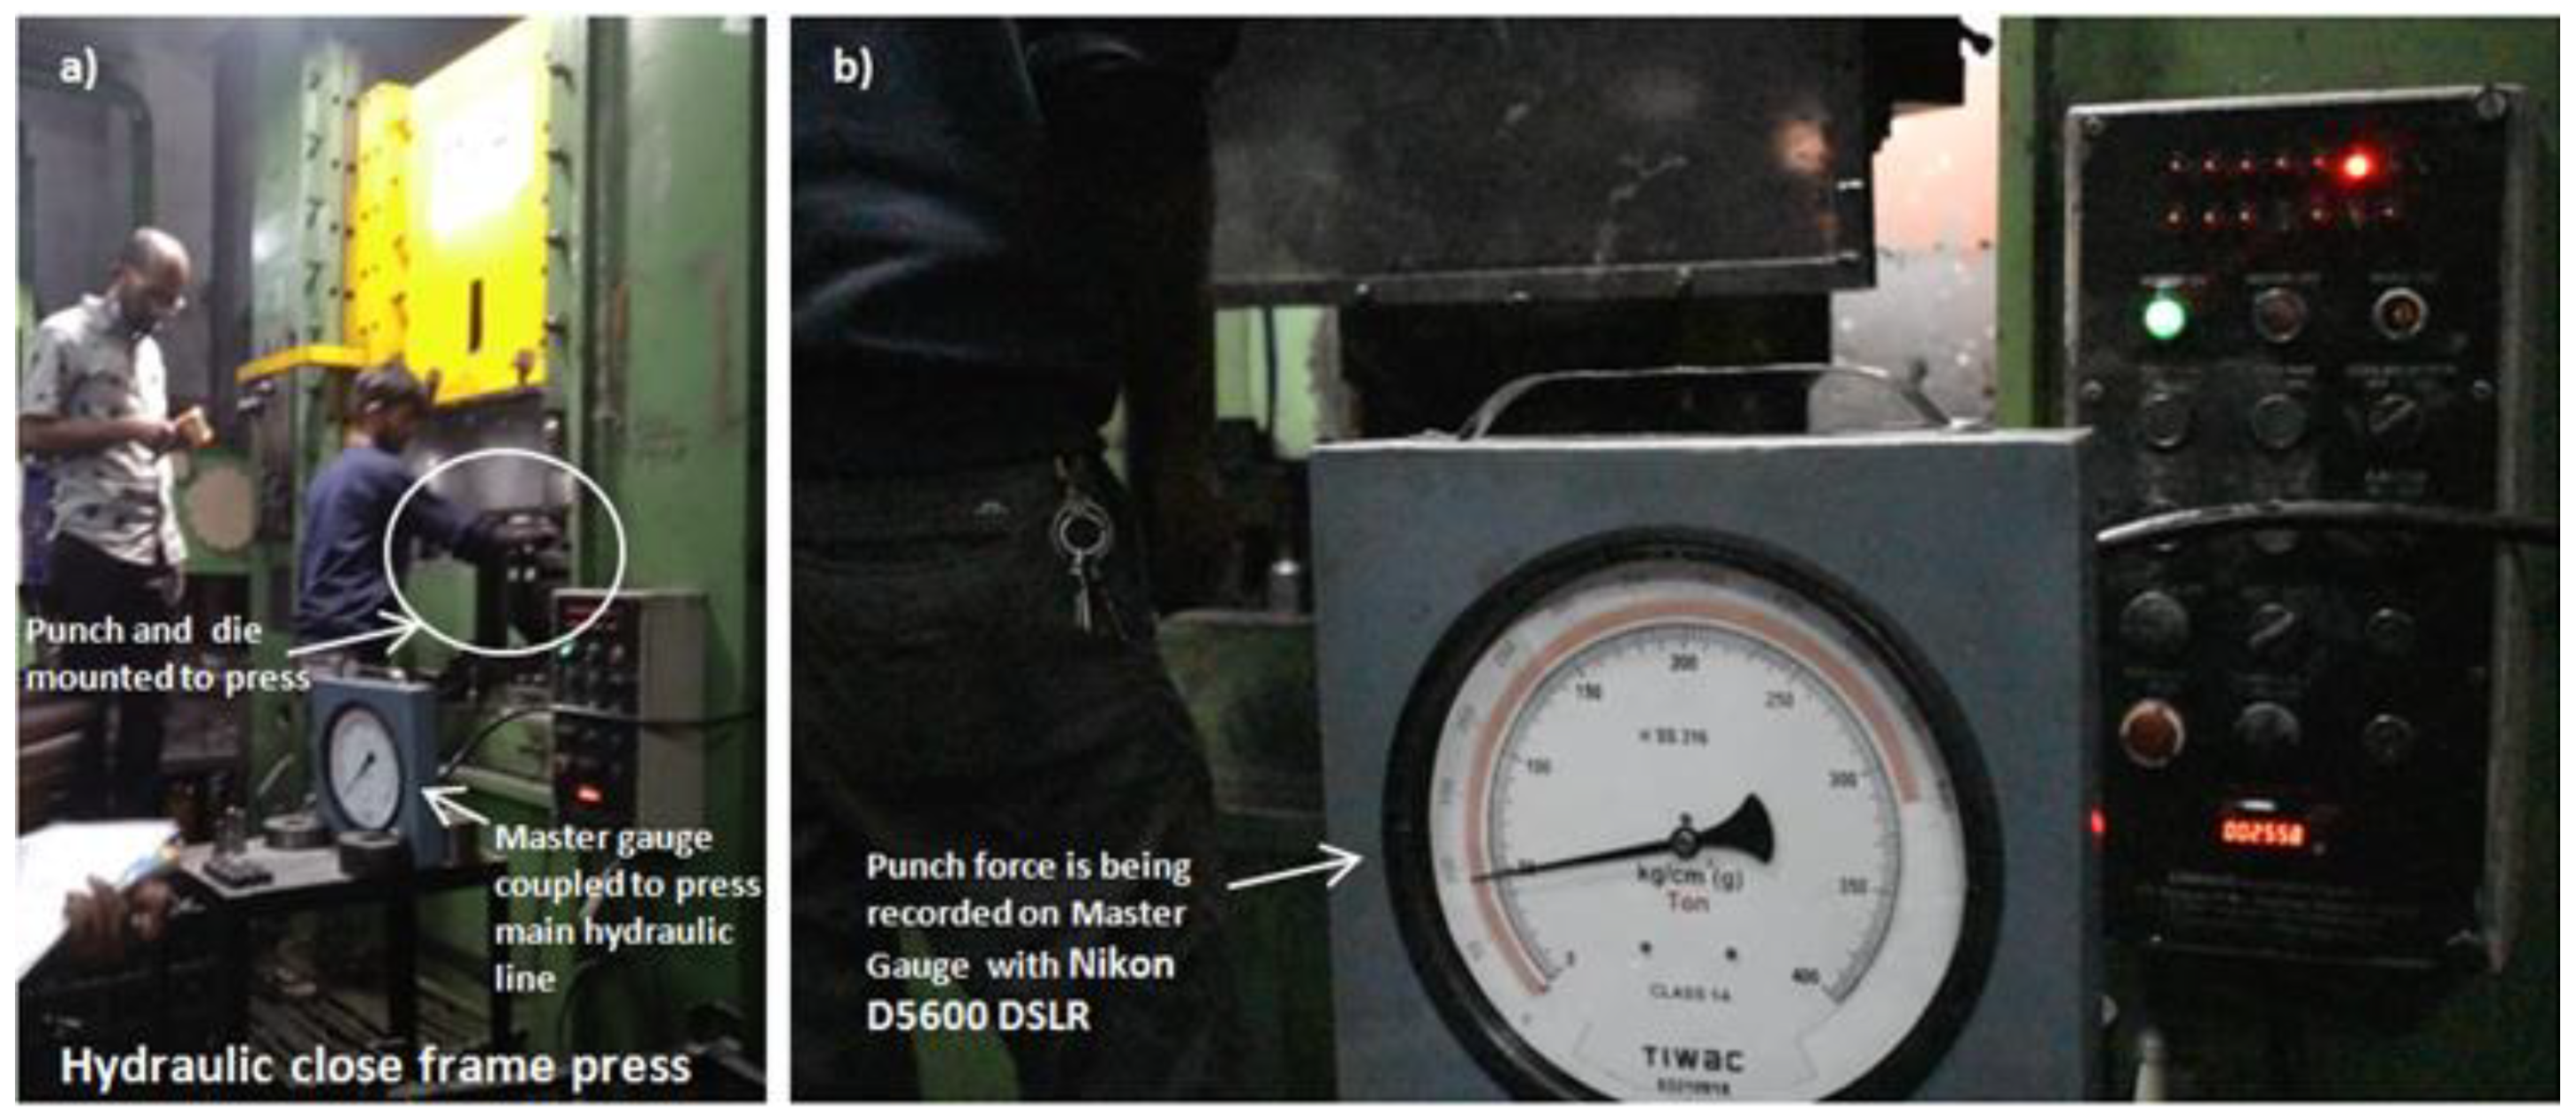
2.4. Experimental Details
3. Results and Discussions
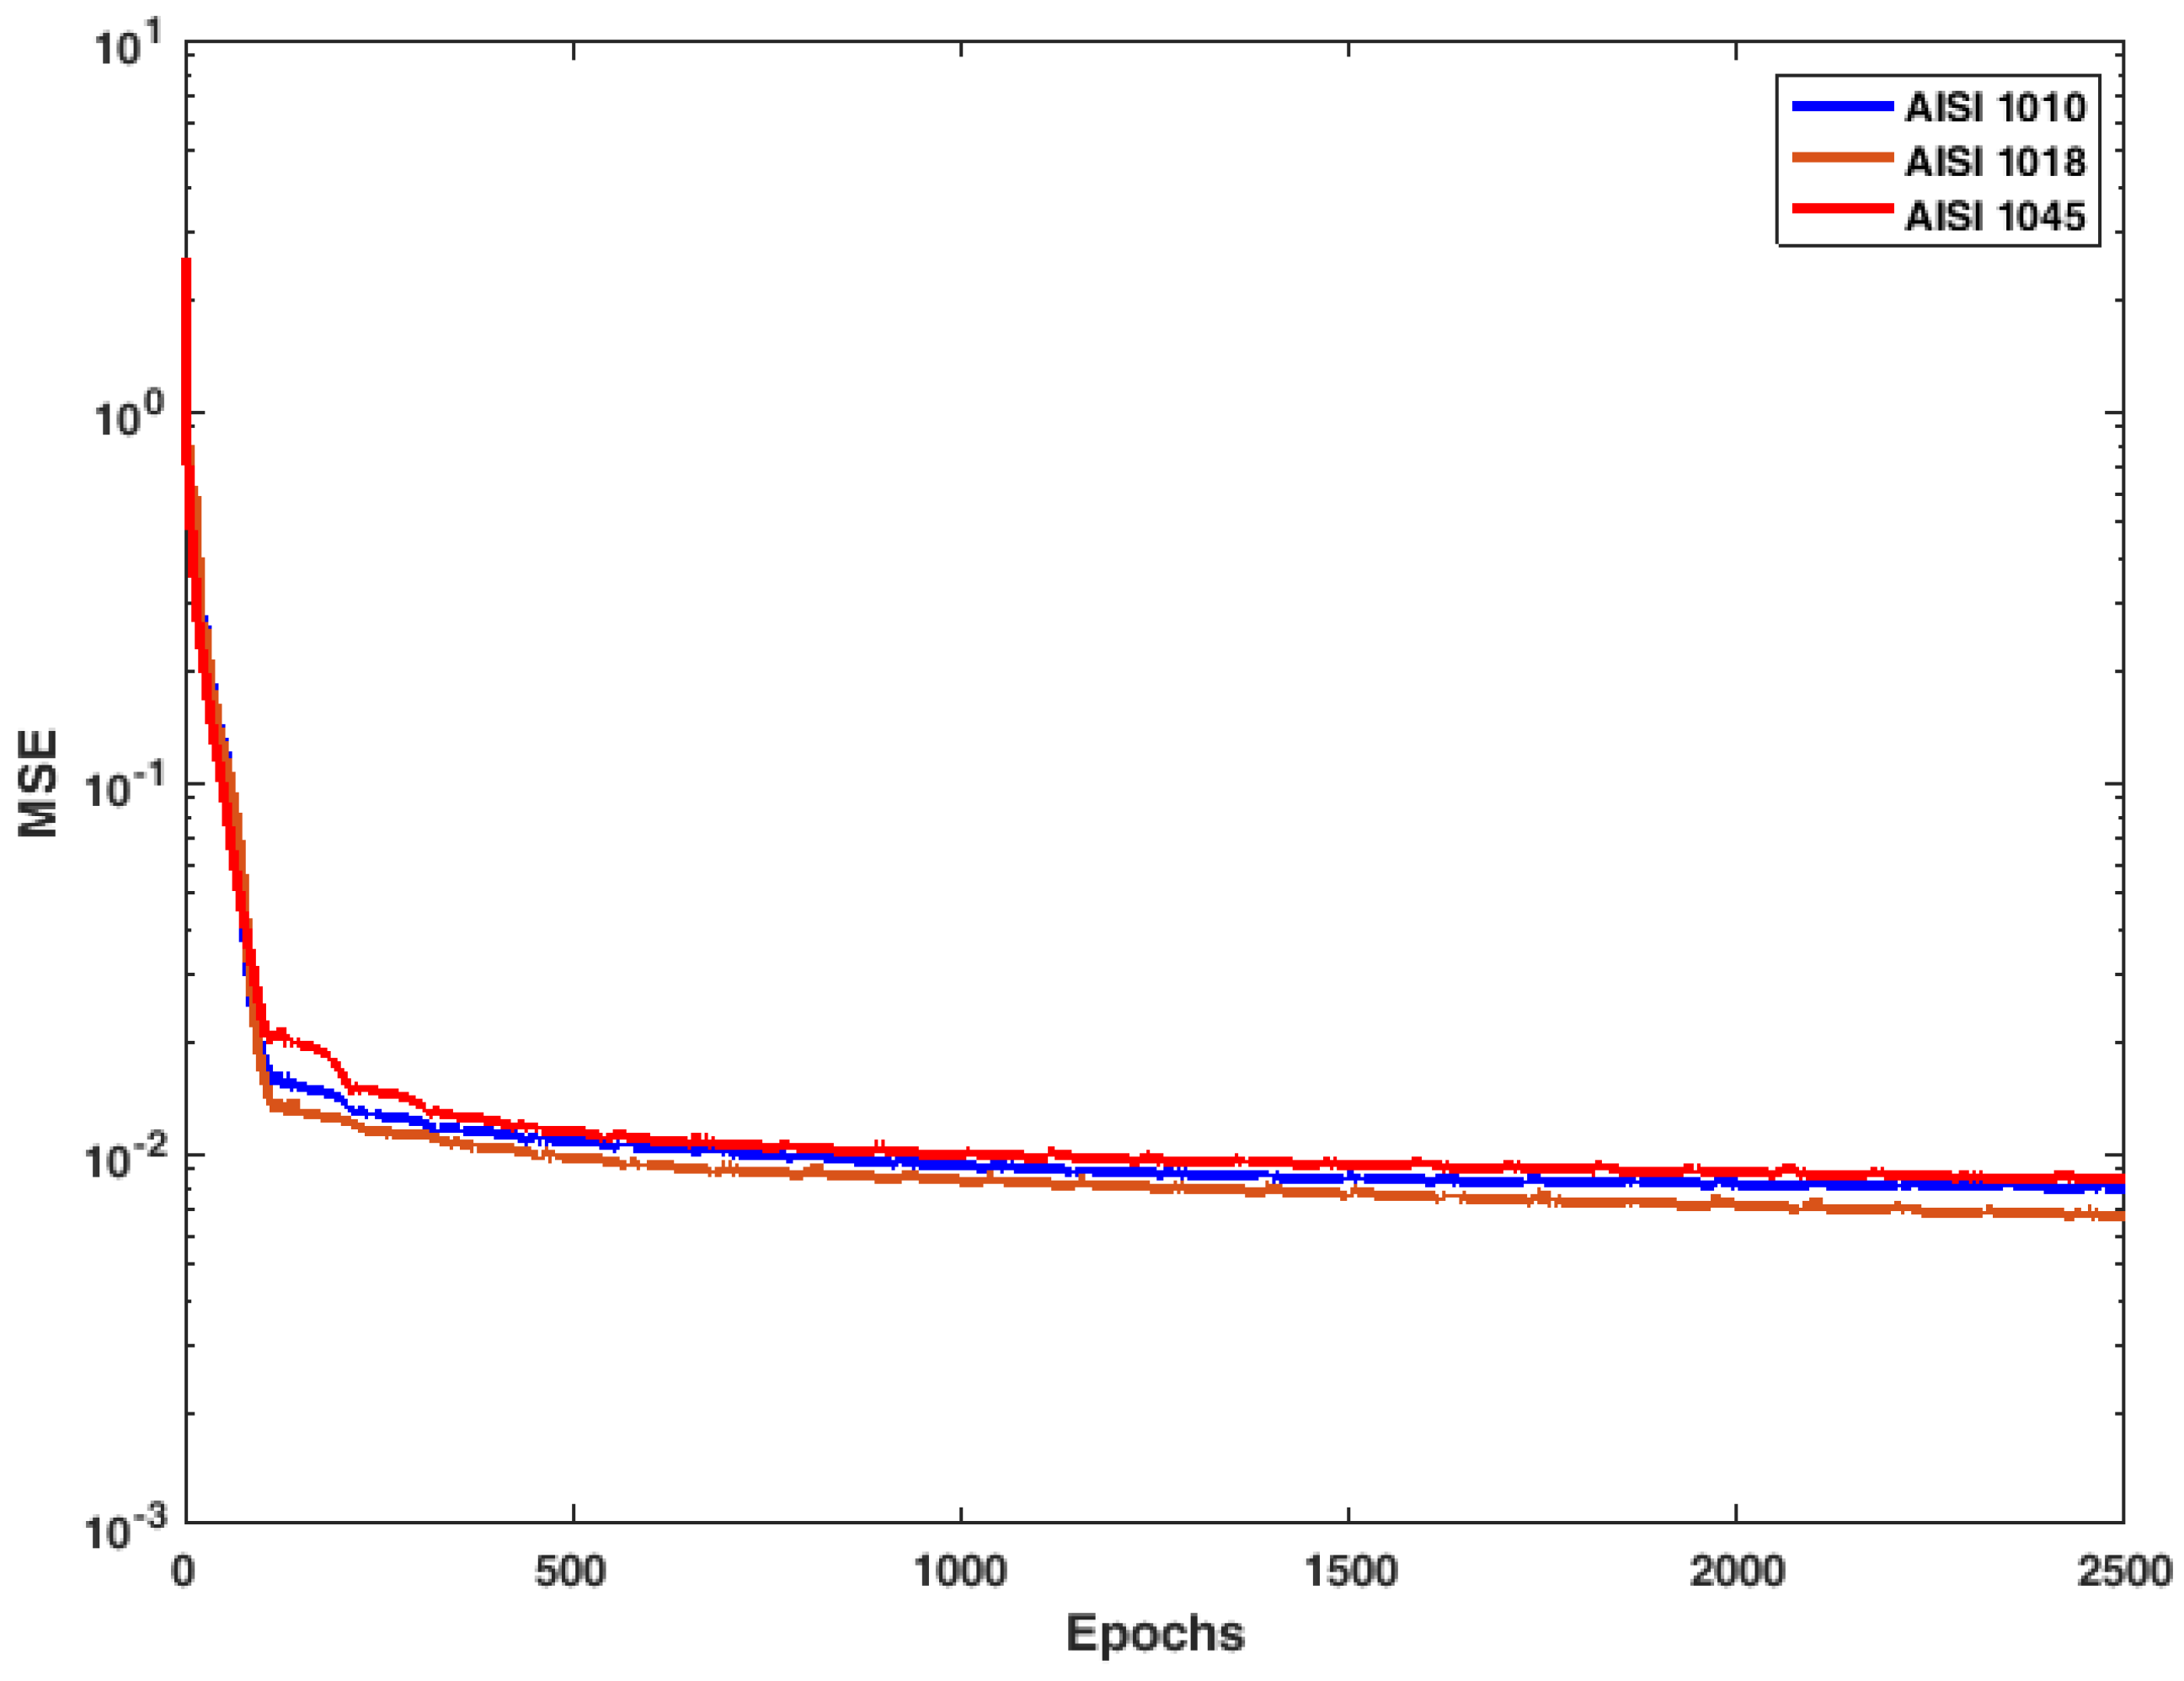
3.1. ANN Training Performance
3.2. Comparison of Forming Behavior of Steel
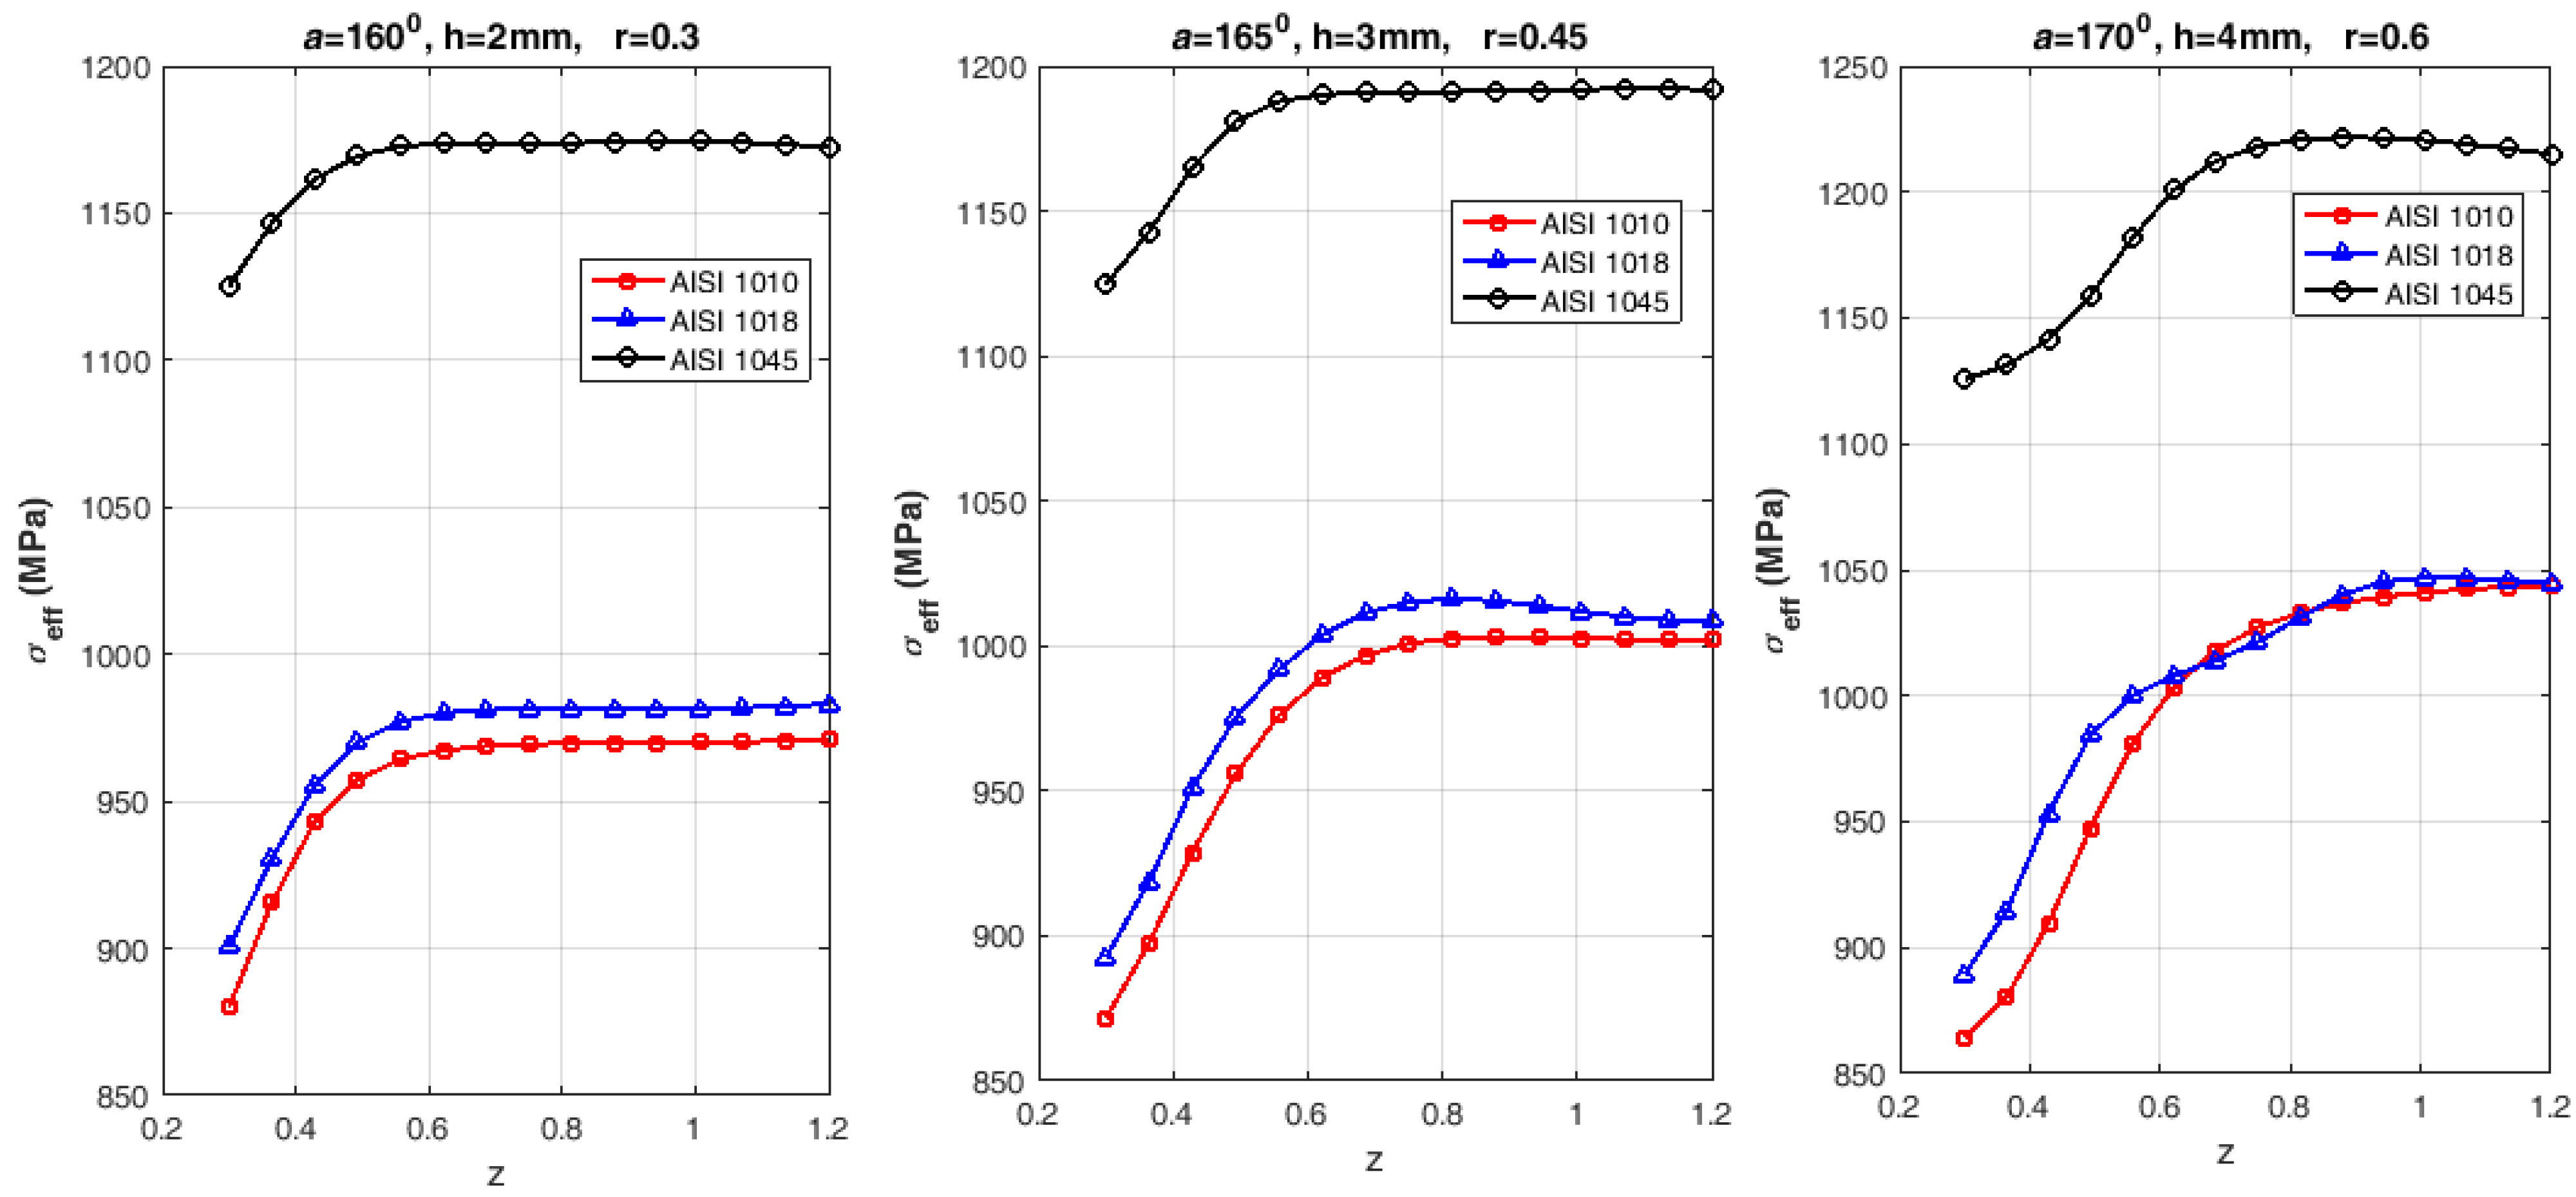
3.2.1. Comparison of Forming Response: Effective Stress
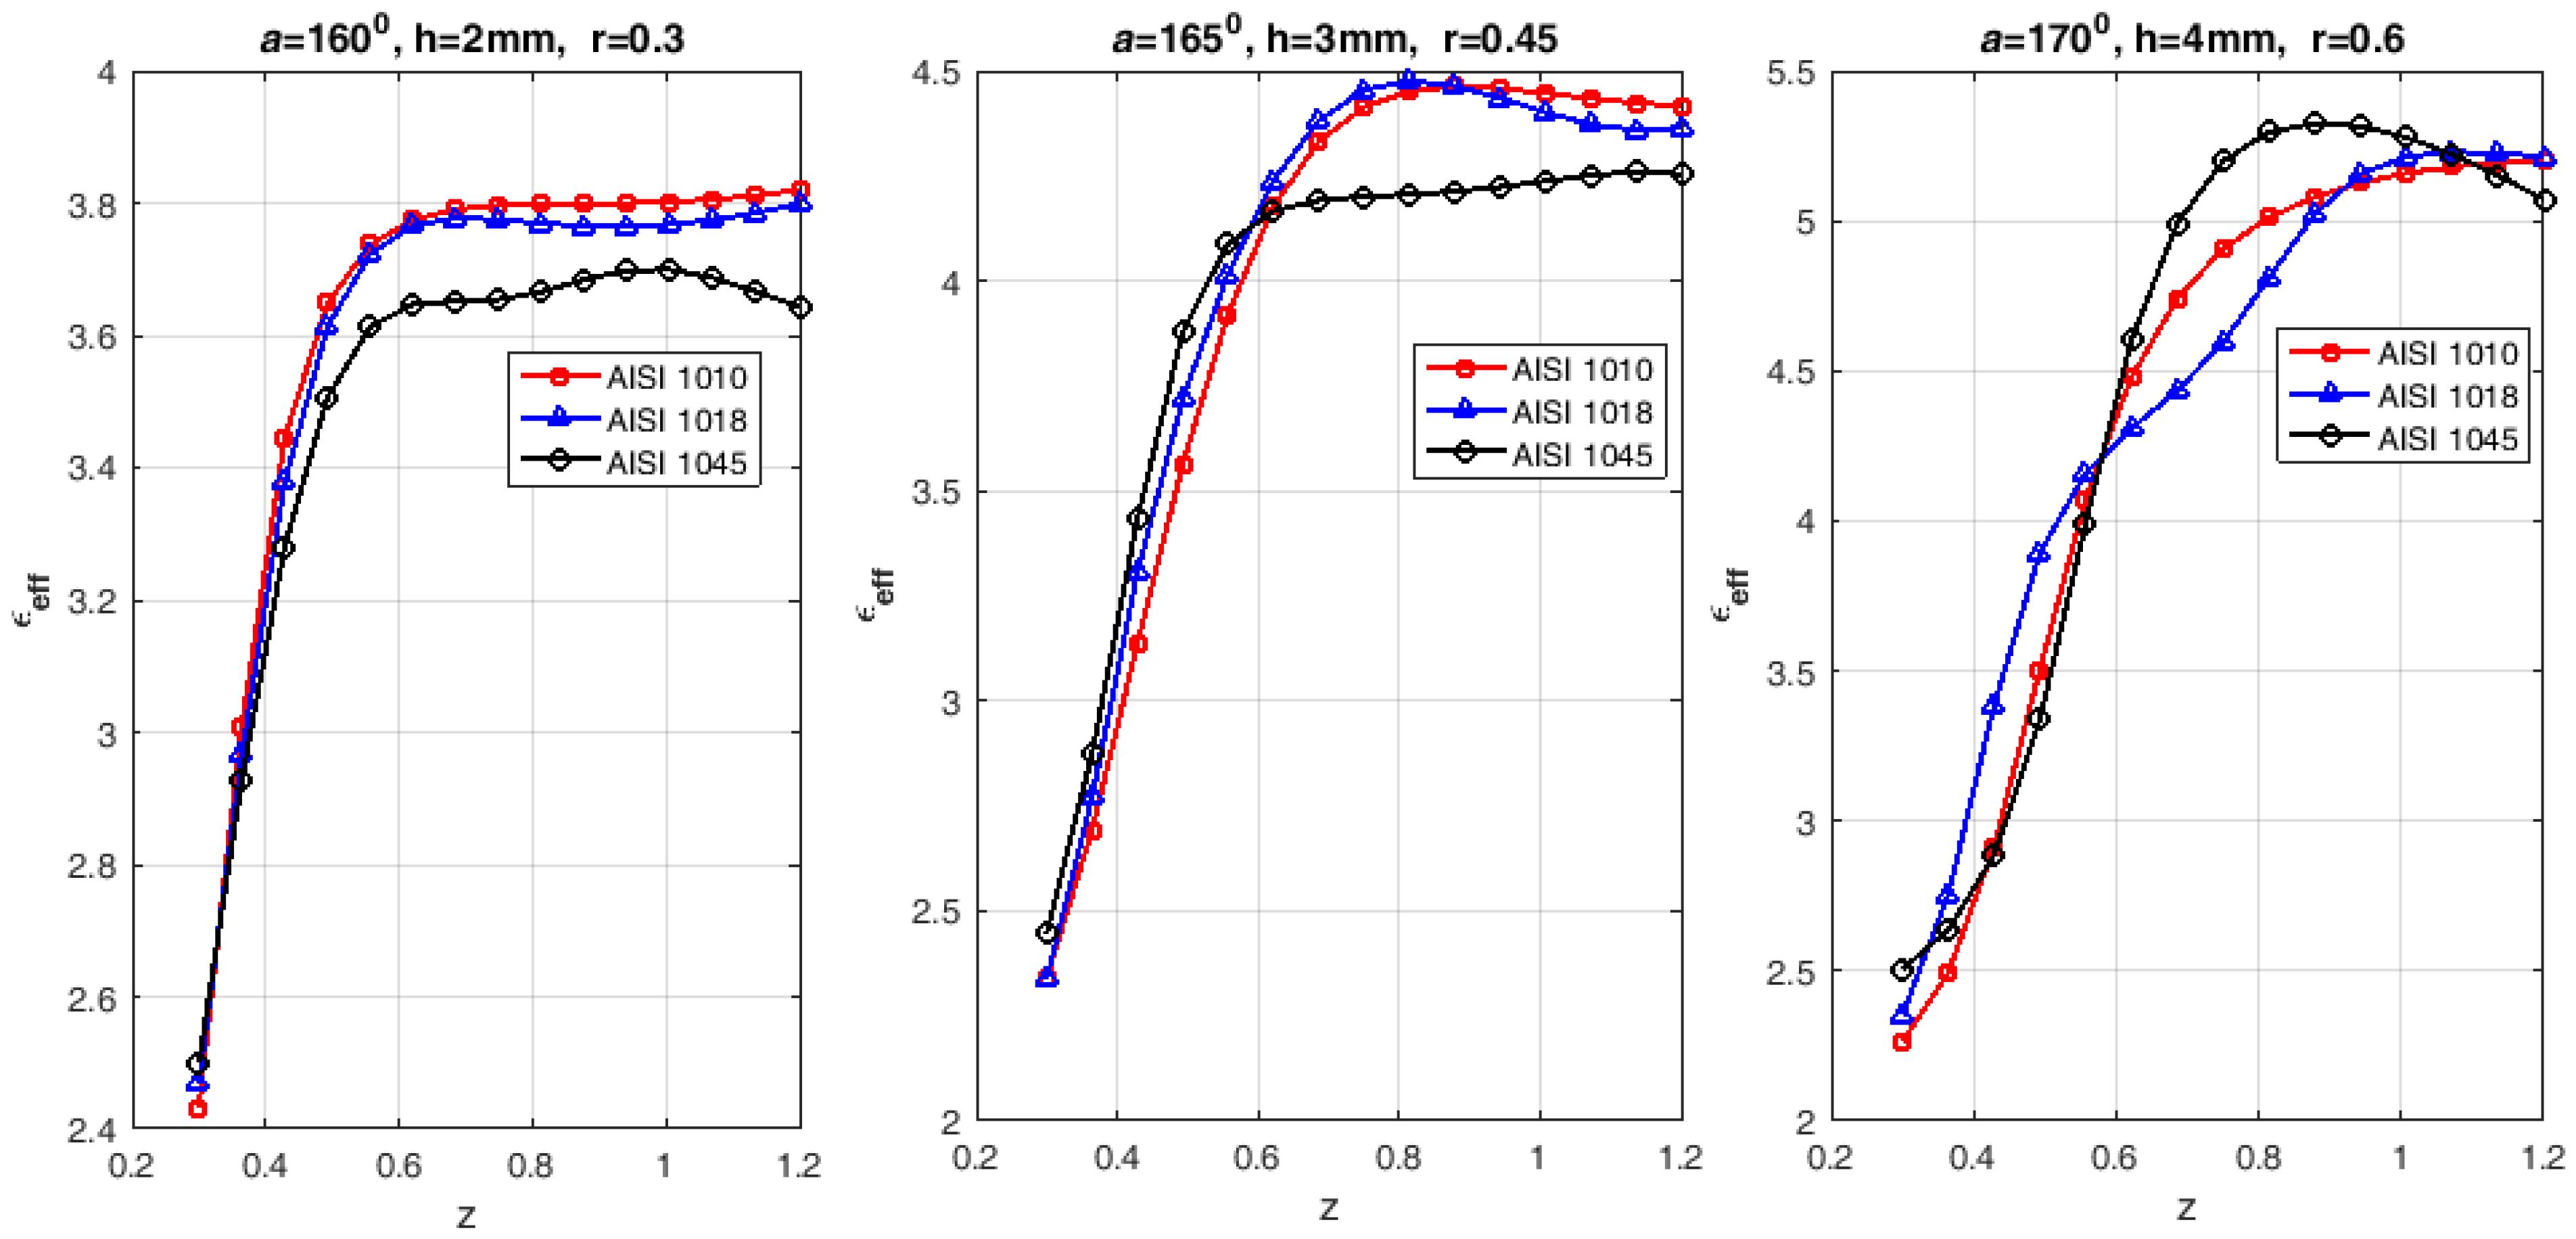
3.2.2. Comparison of Forming Response: Effective Strain
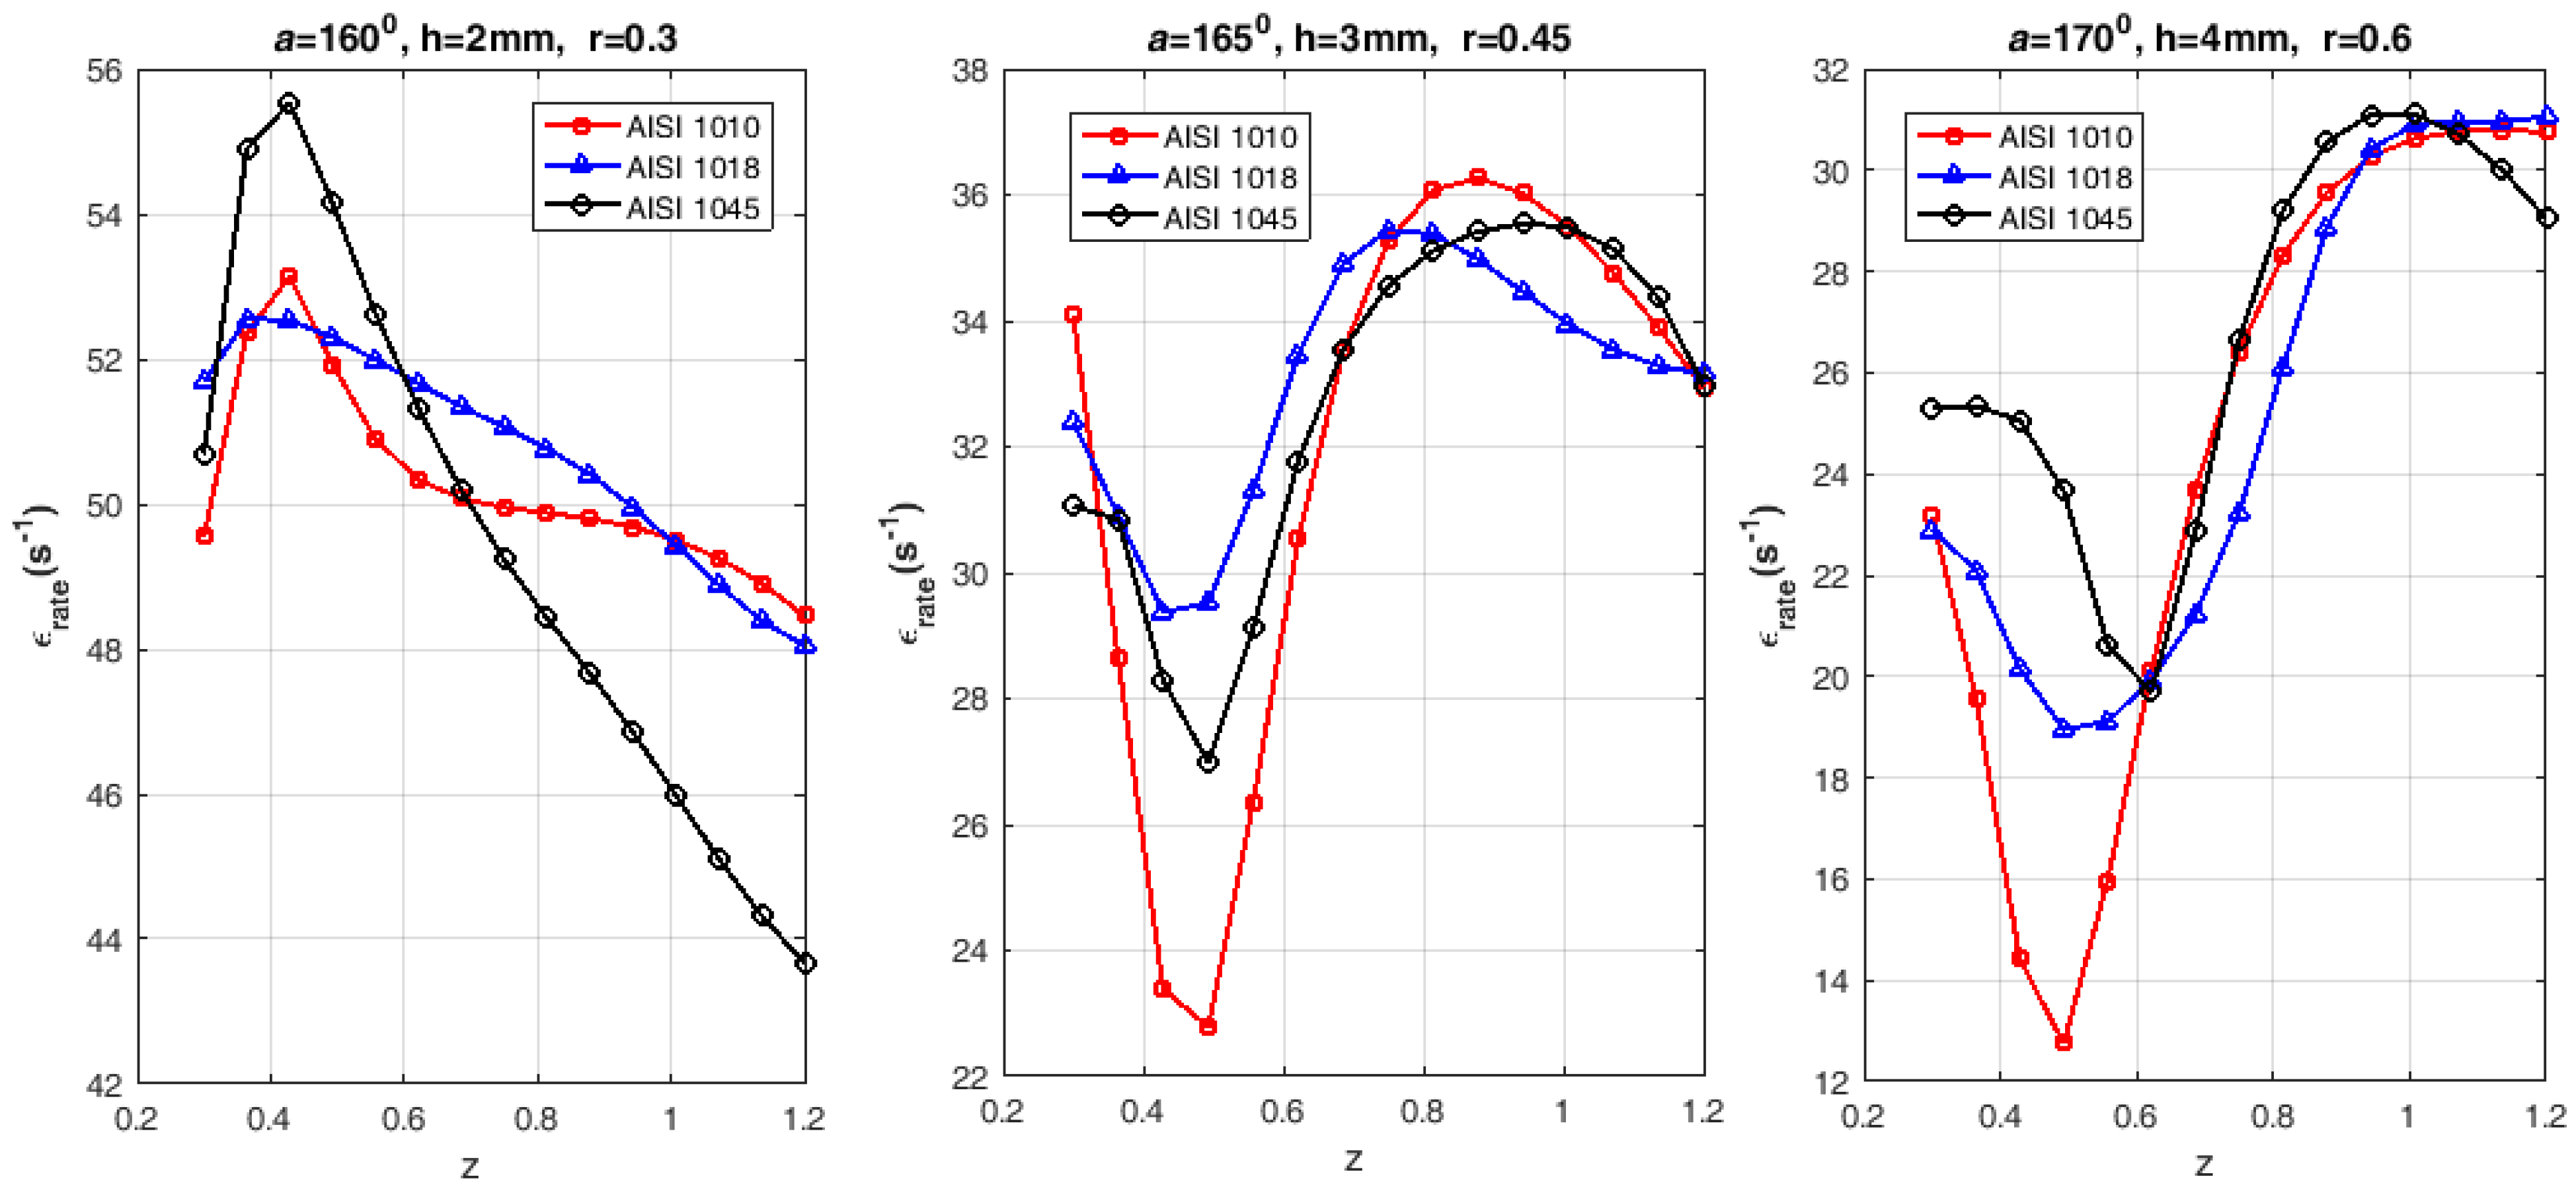
3.2.3. Comparison of Forming Response: Effective Strain Rate
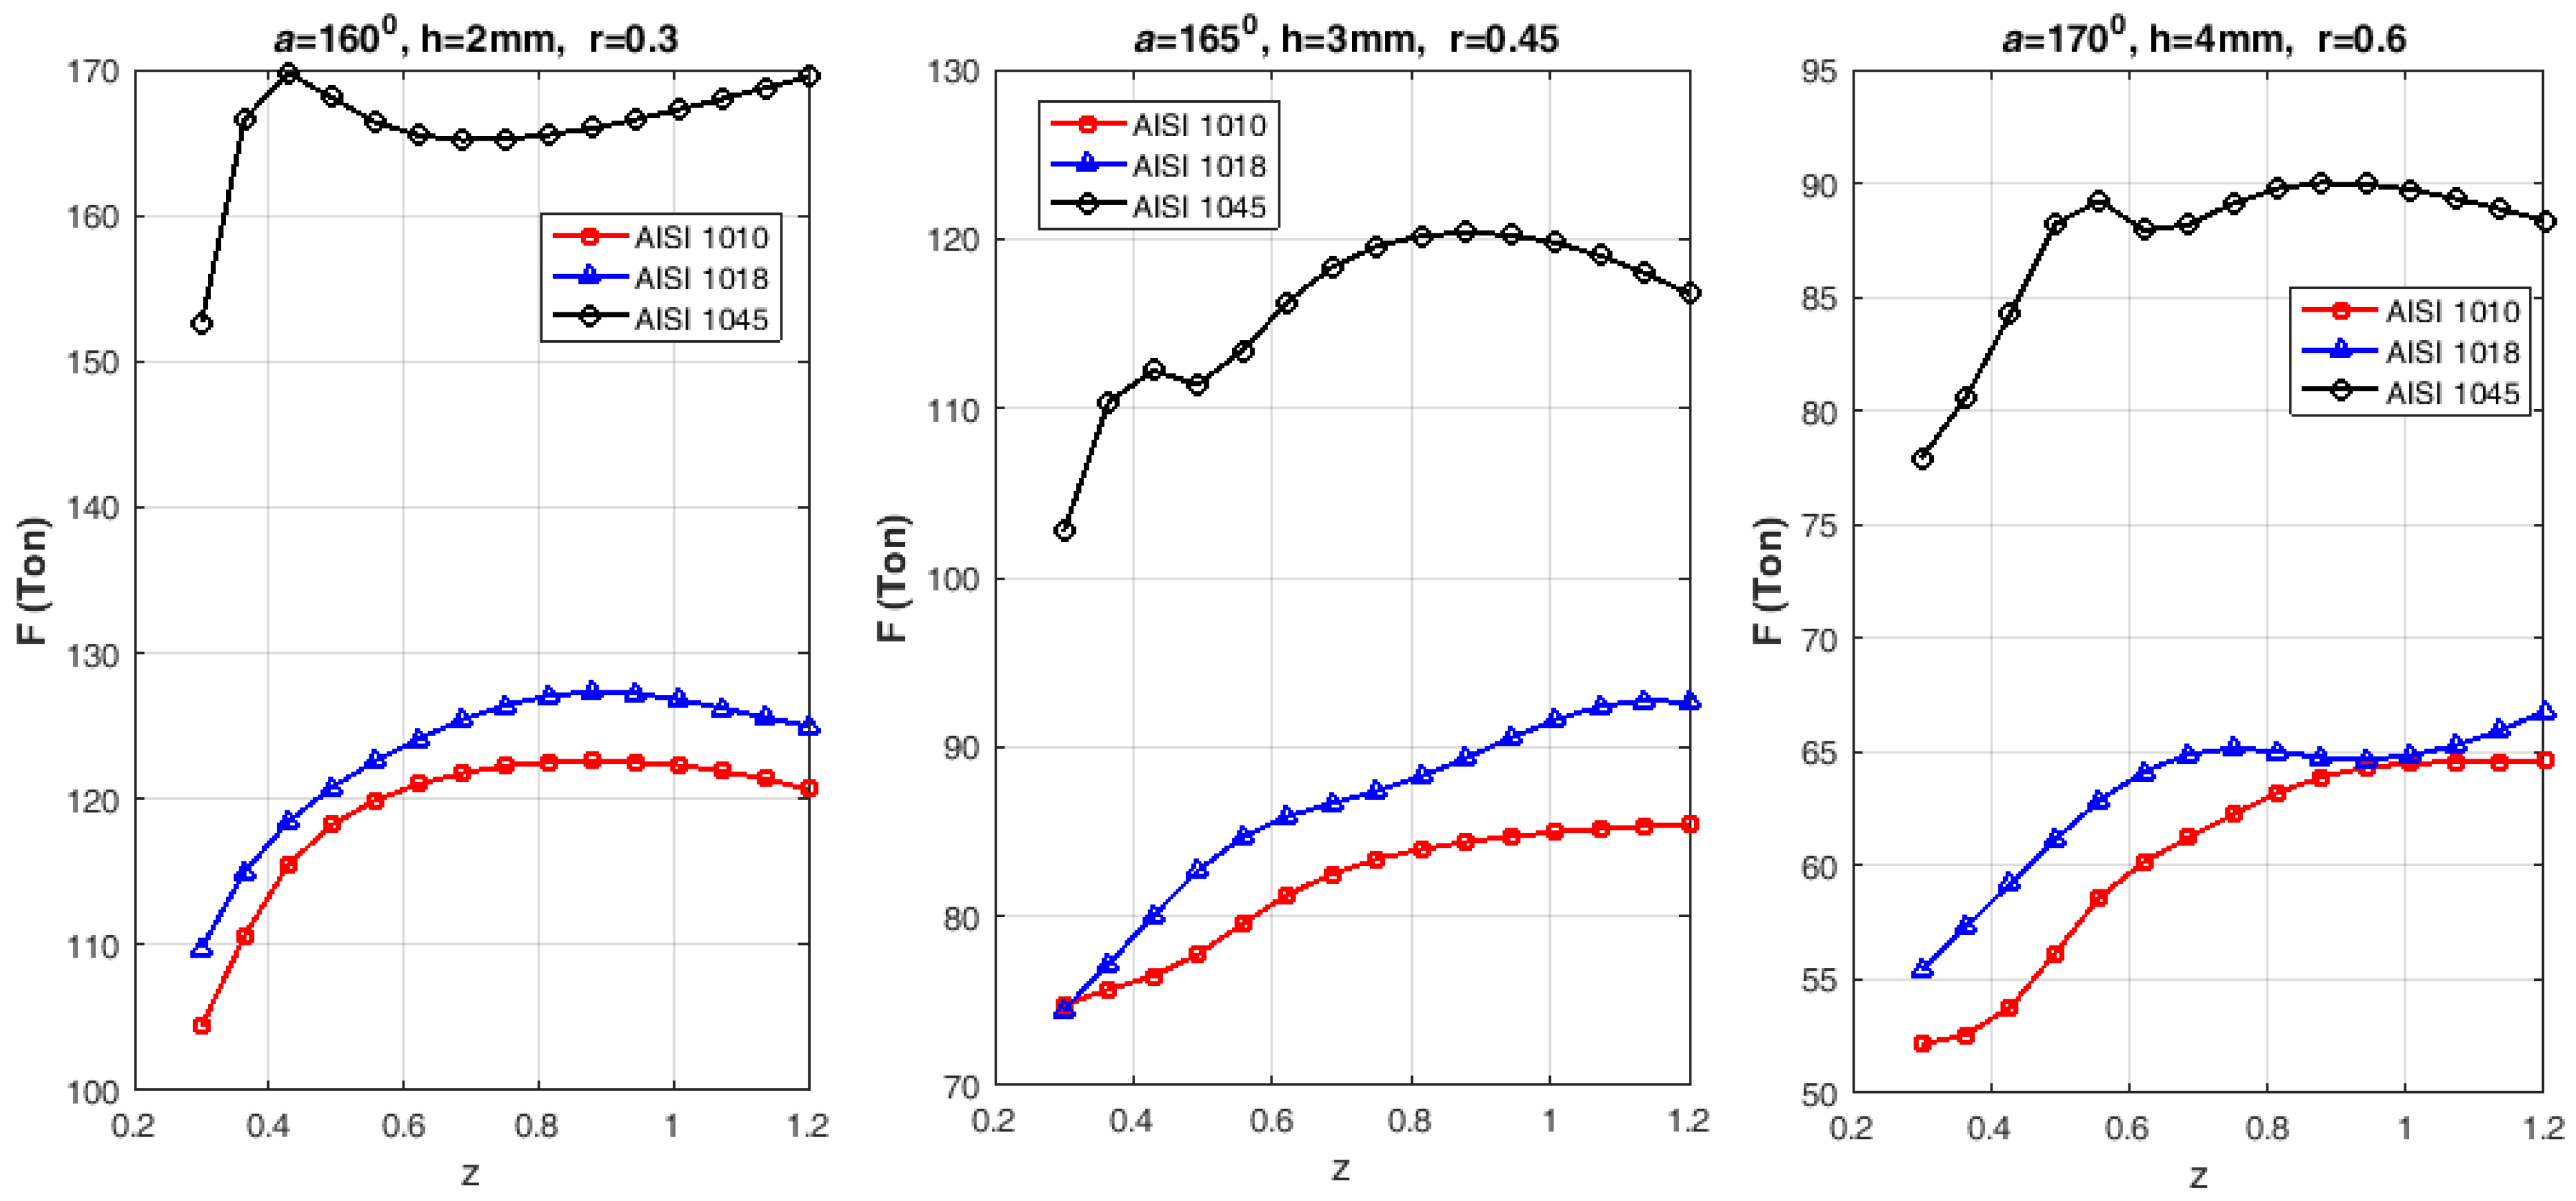
3.2.4. Comparison of Forming Response: Punch Force
3.3. Analysis of DE Optimization Parameters
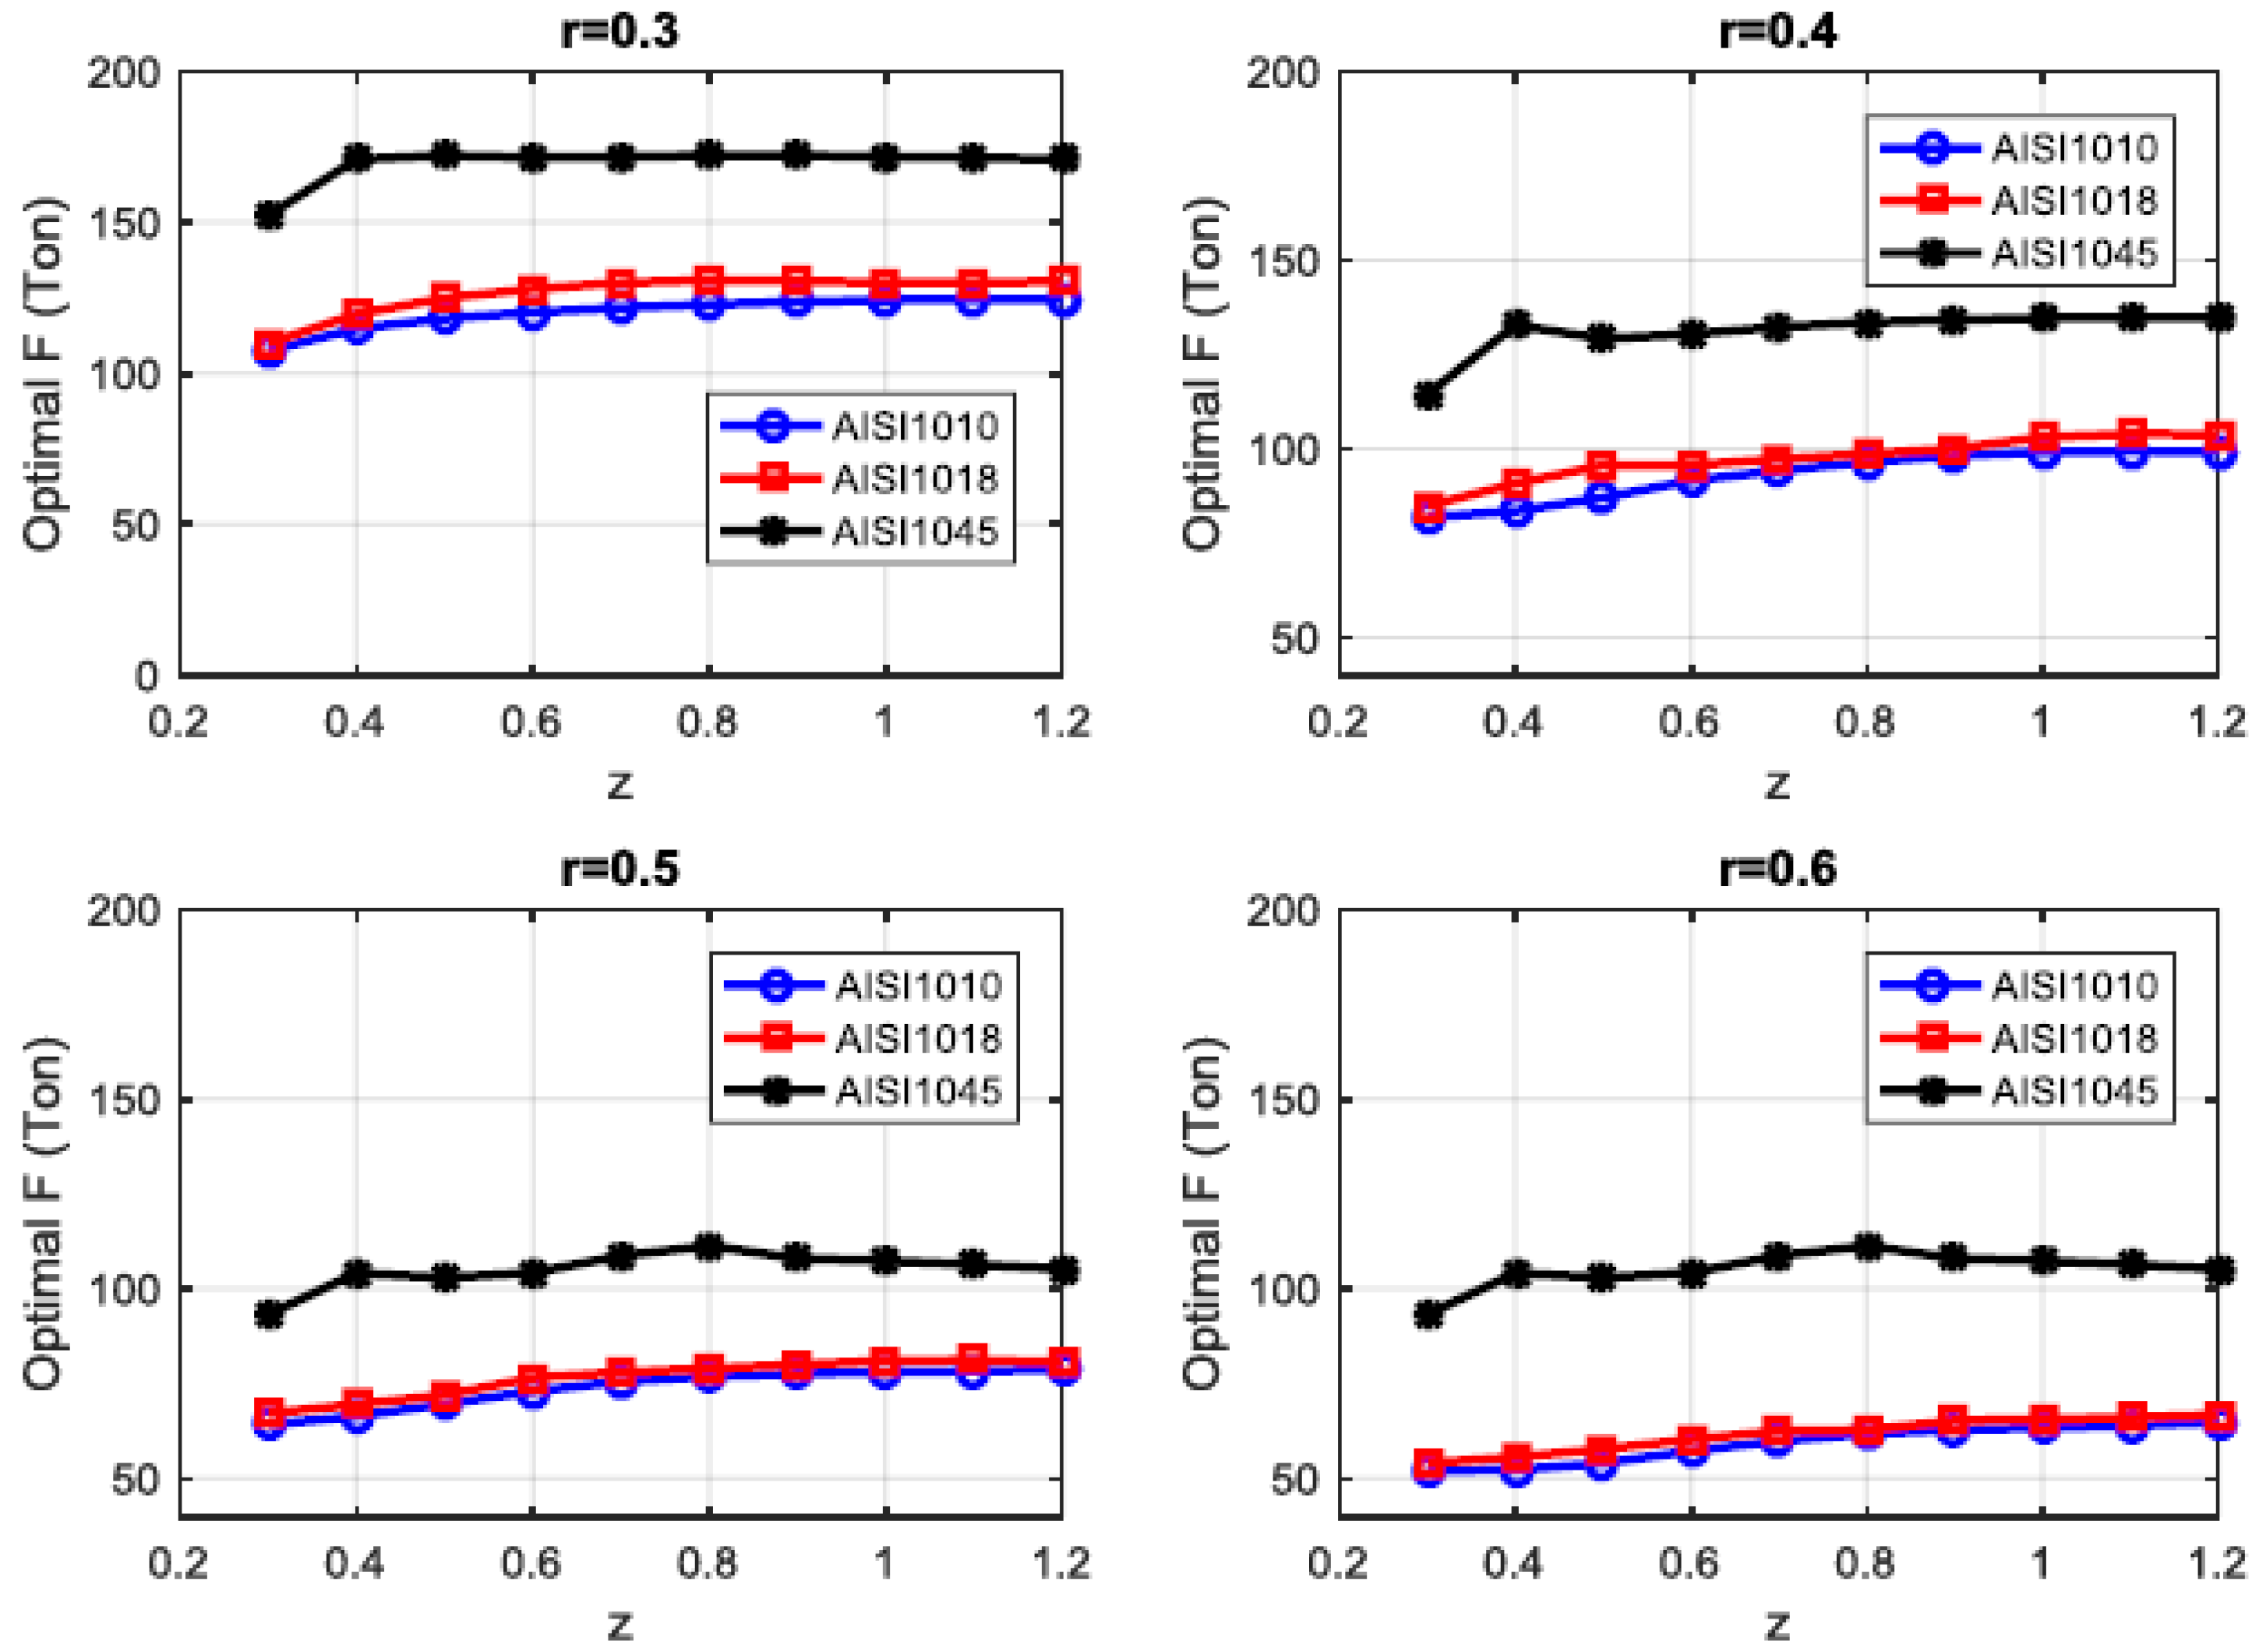
Comparison of Steel for Optimal Response Factors
- Optimal response factor comparison: effective stress
- Optimal response factor comparison: effective strain
- Optimal response factor comparison: effective strain rate
- Optimal response factor comparison: punch force
3.4. Experimental Validation
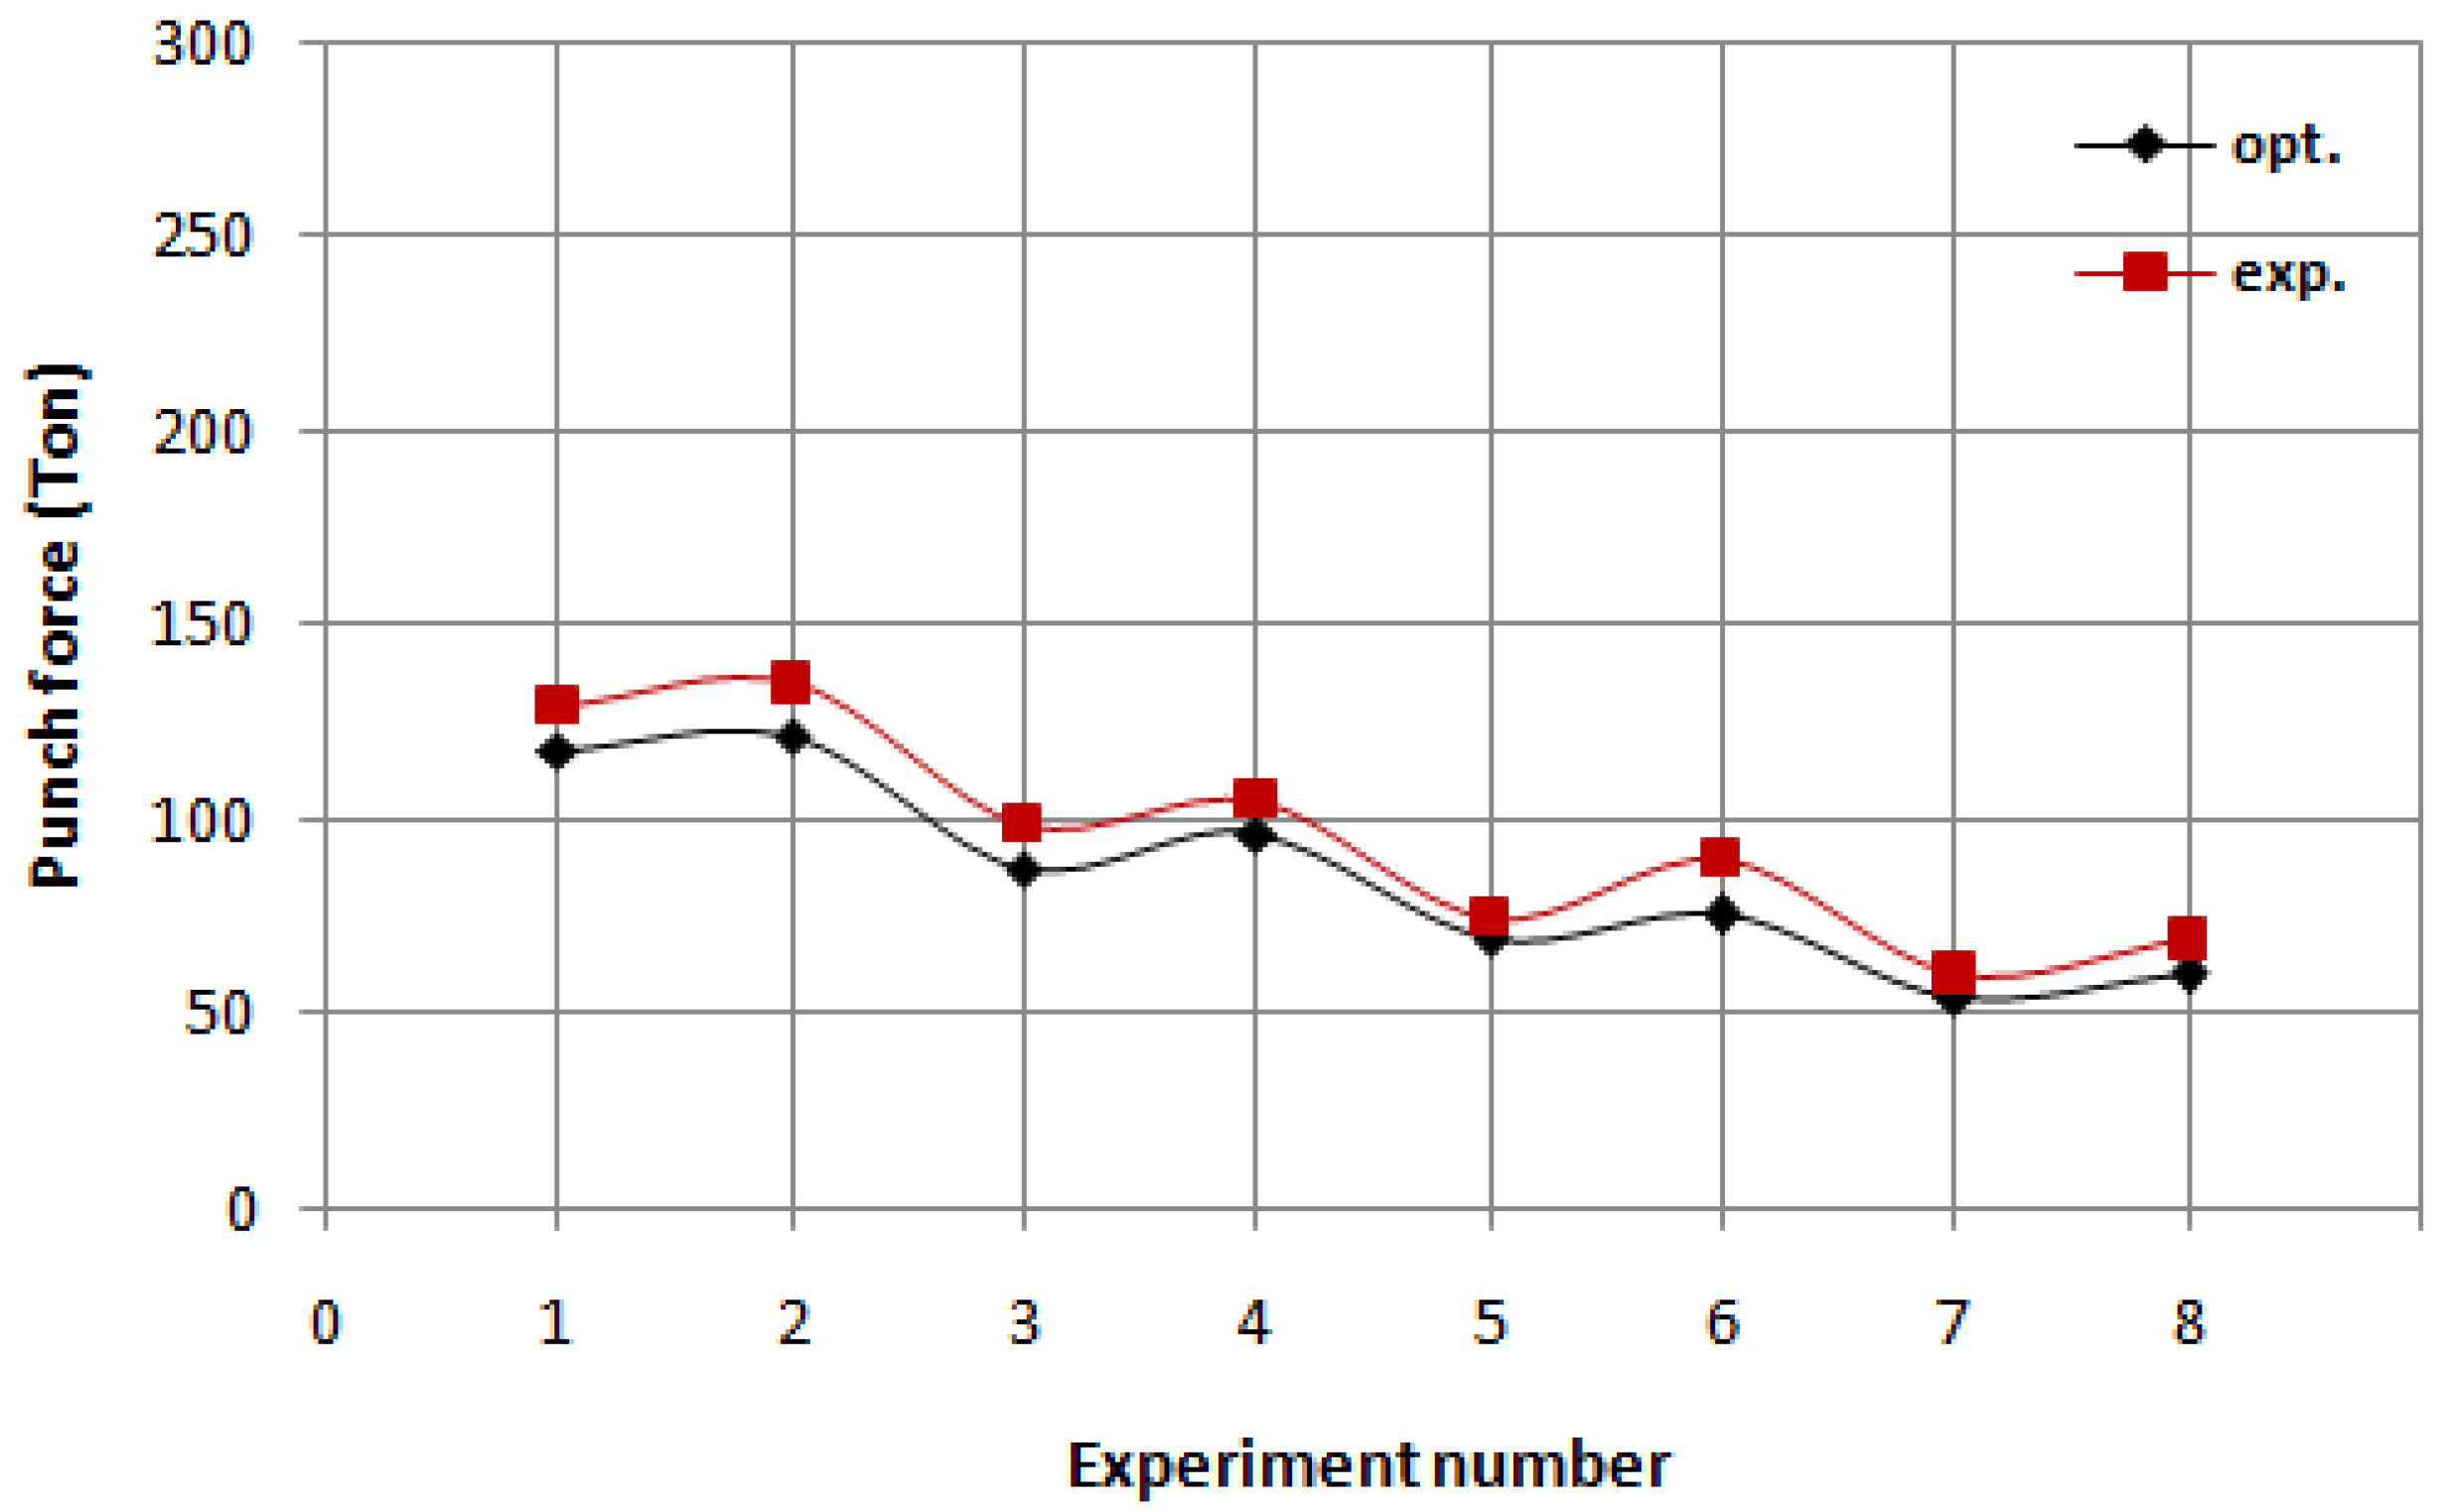
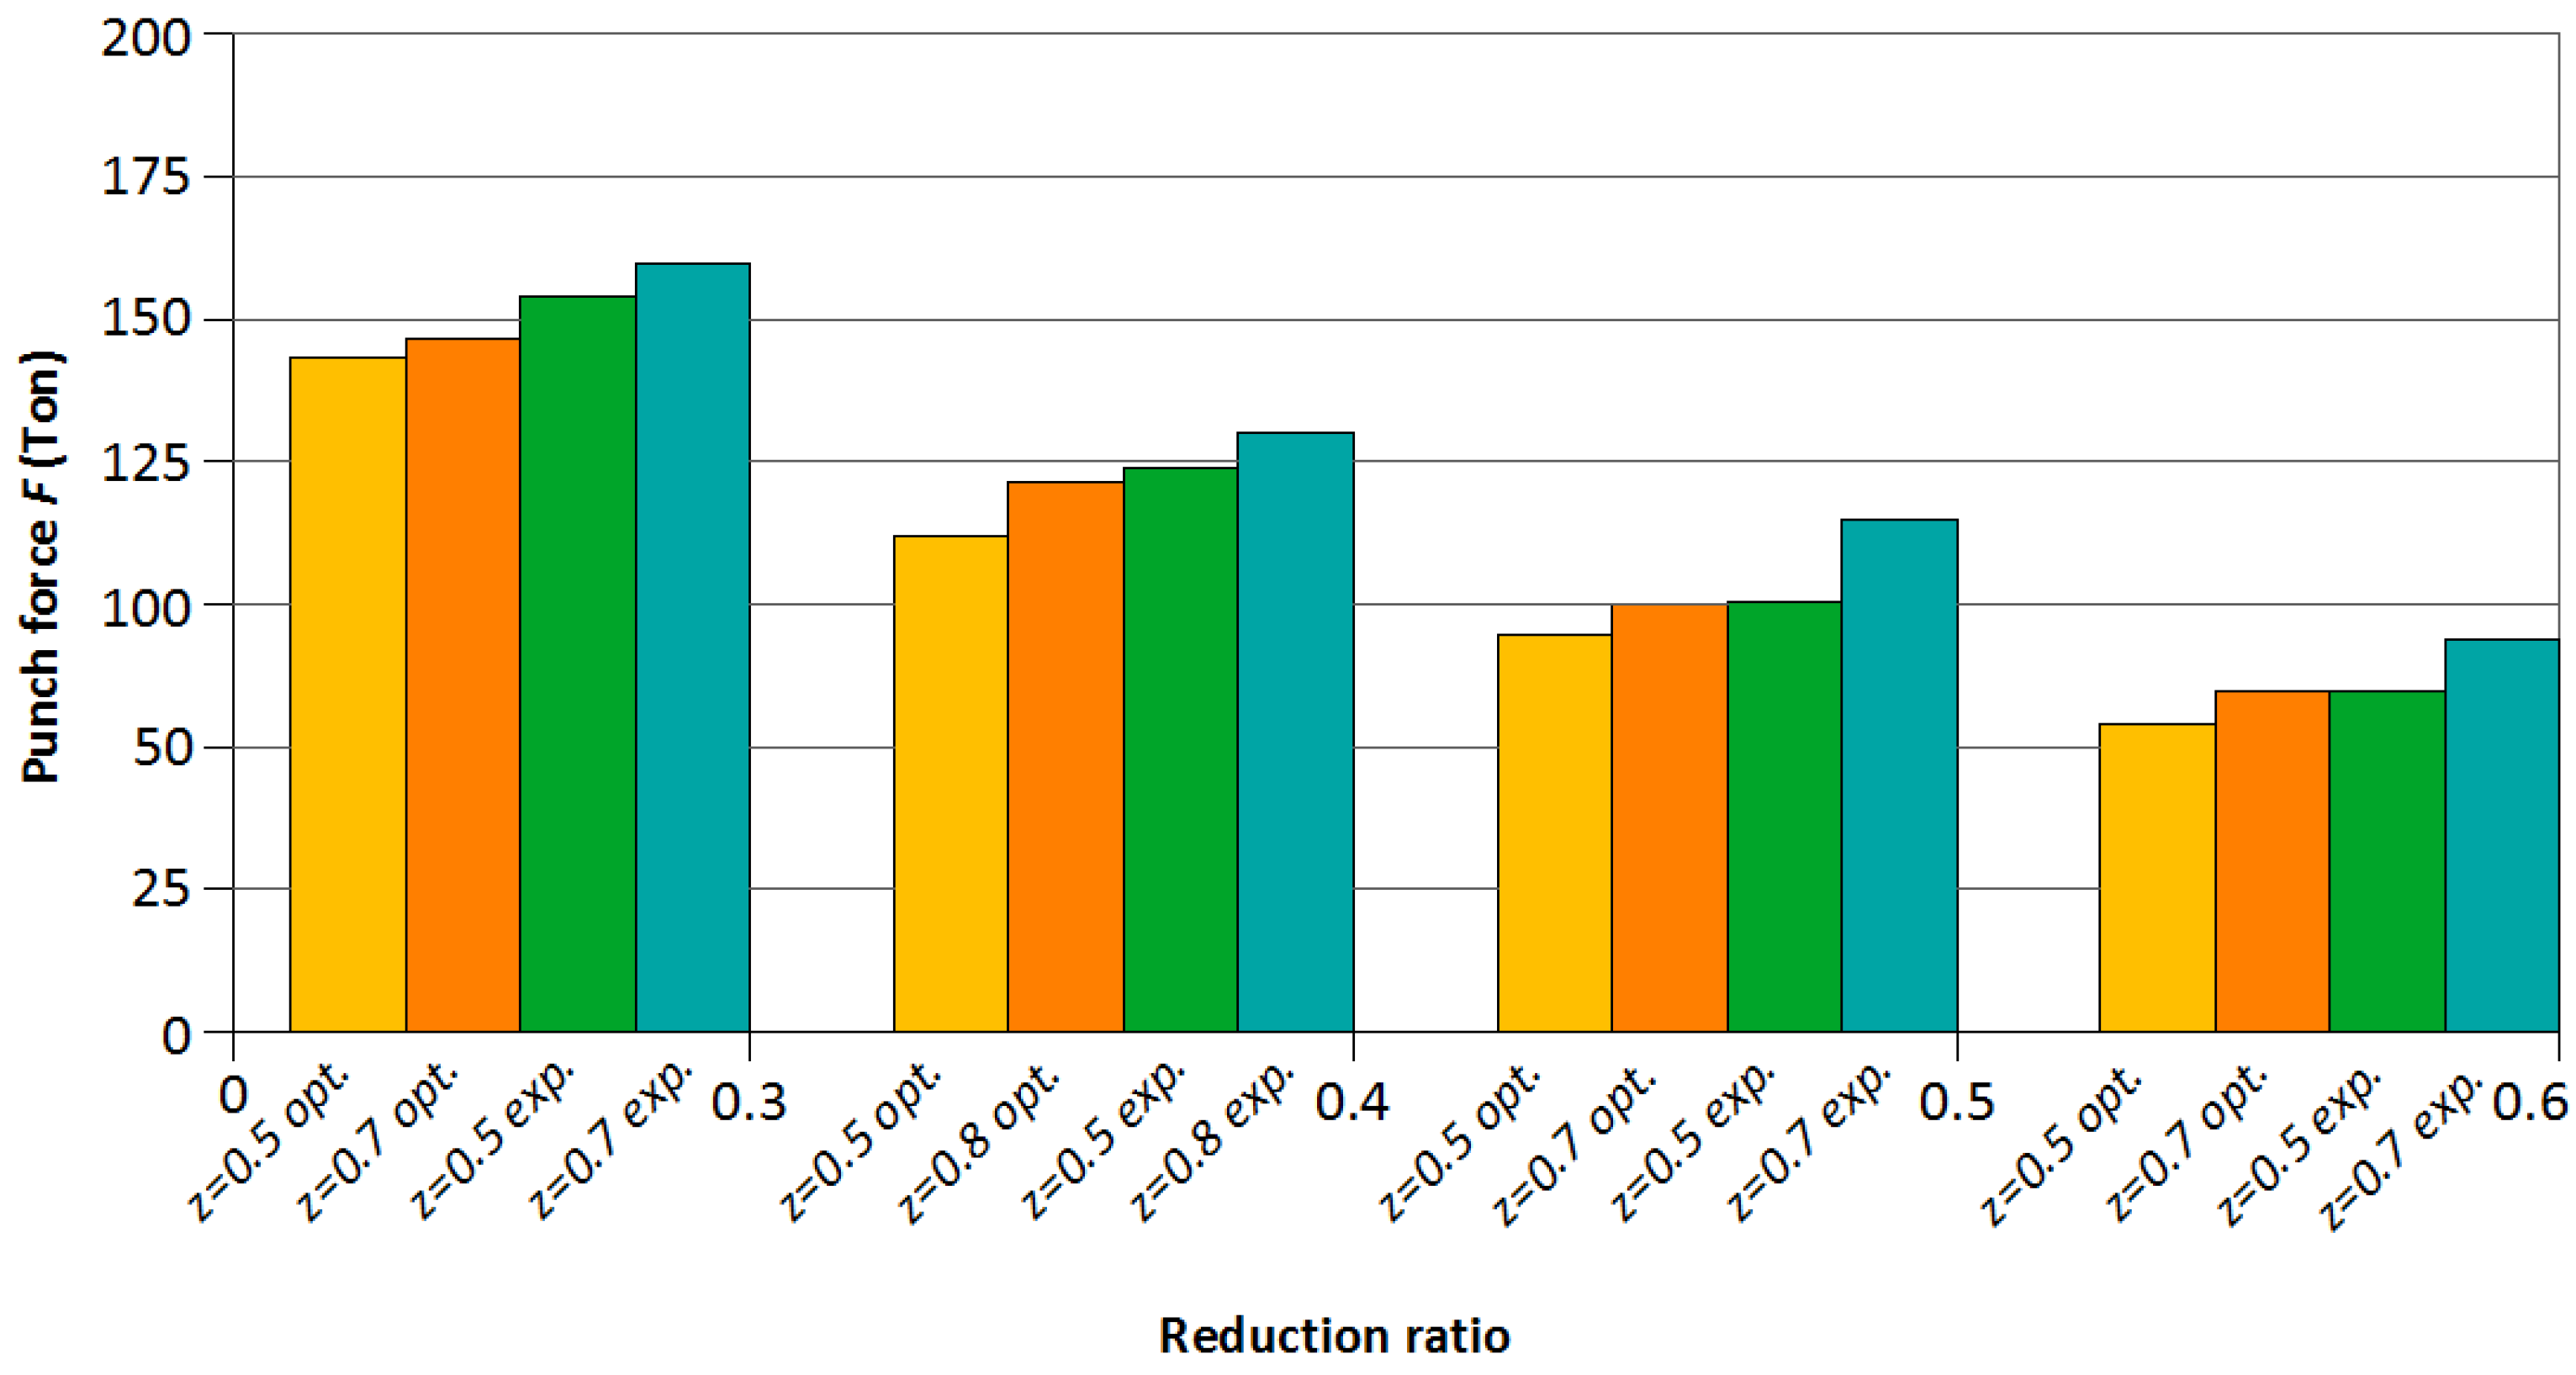
3.4.1. Punch Force Estimation
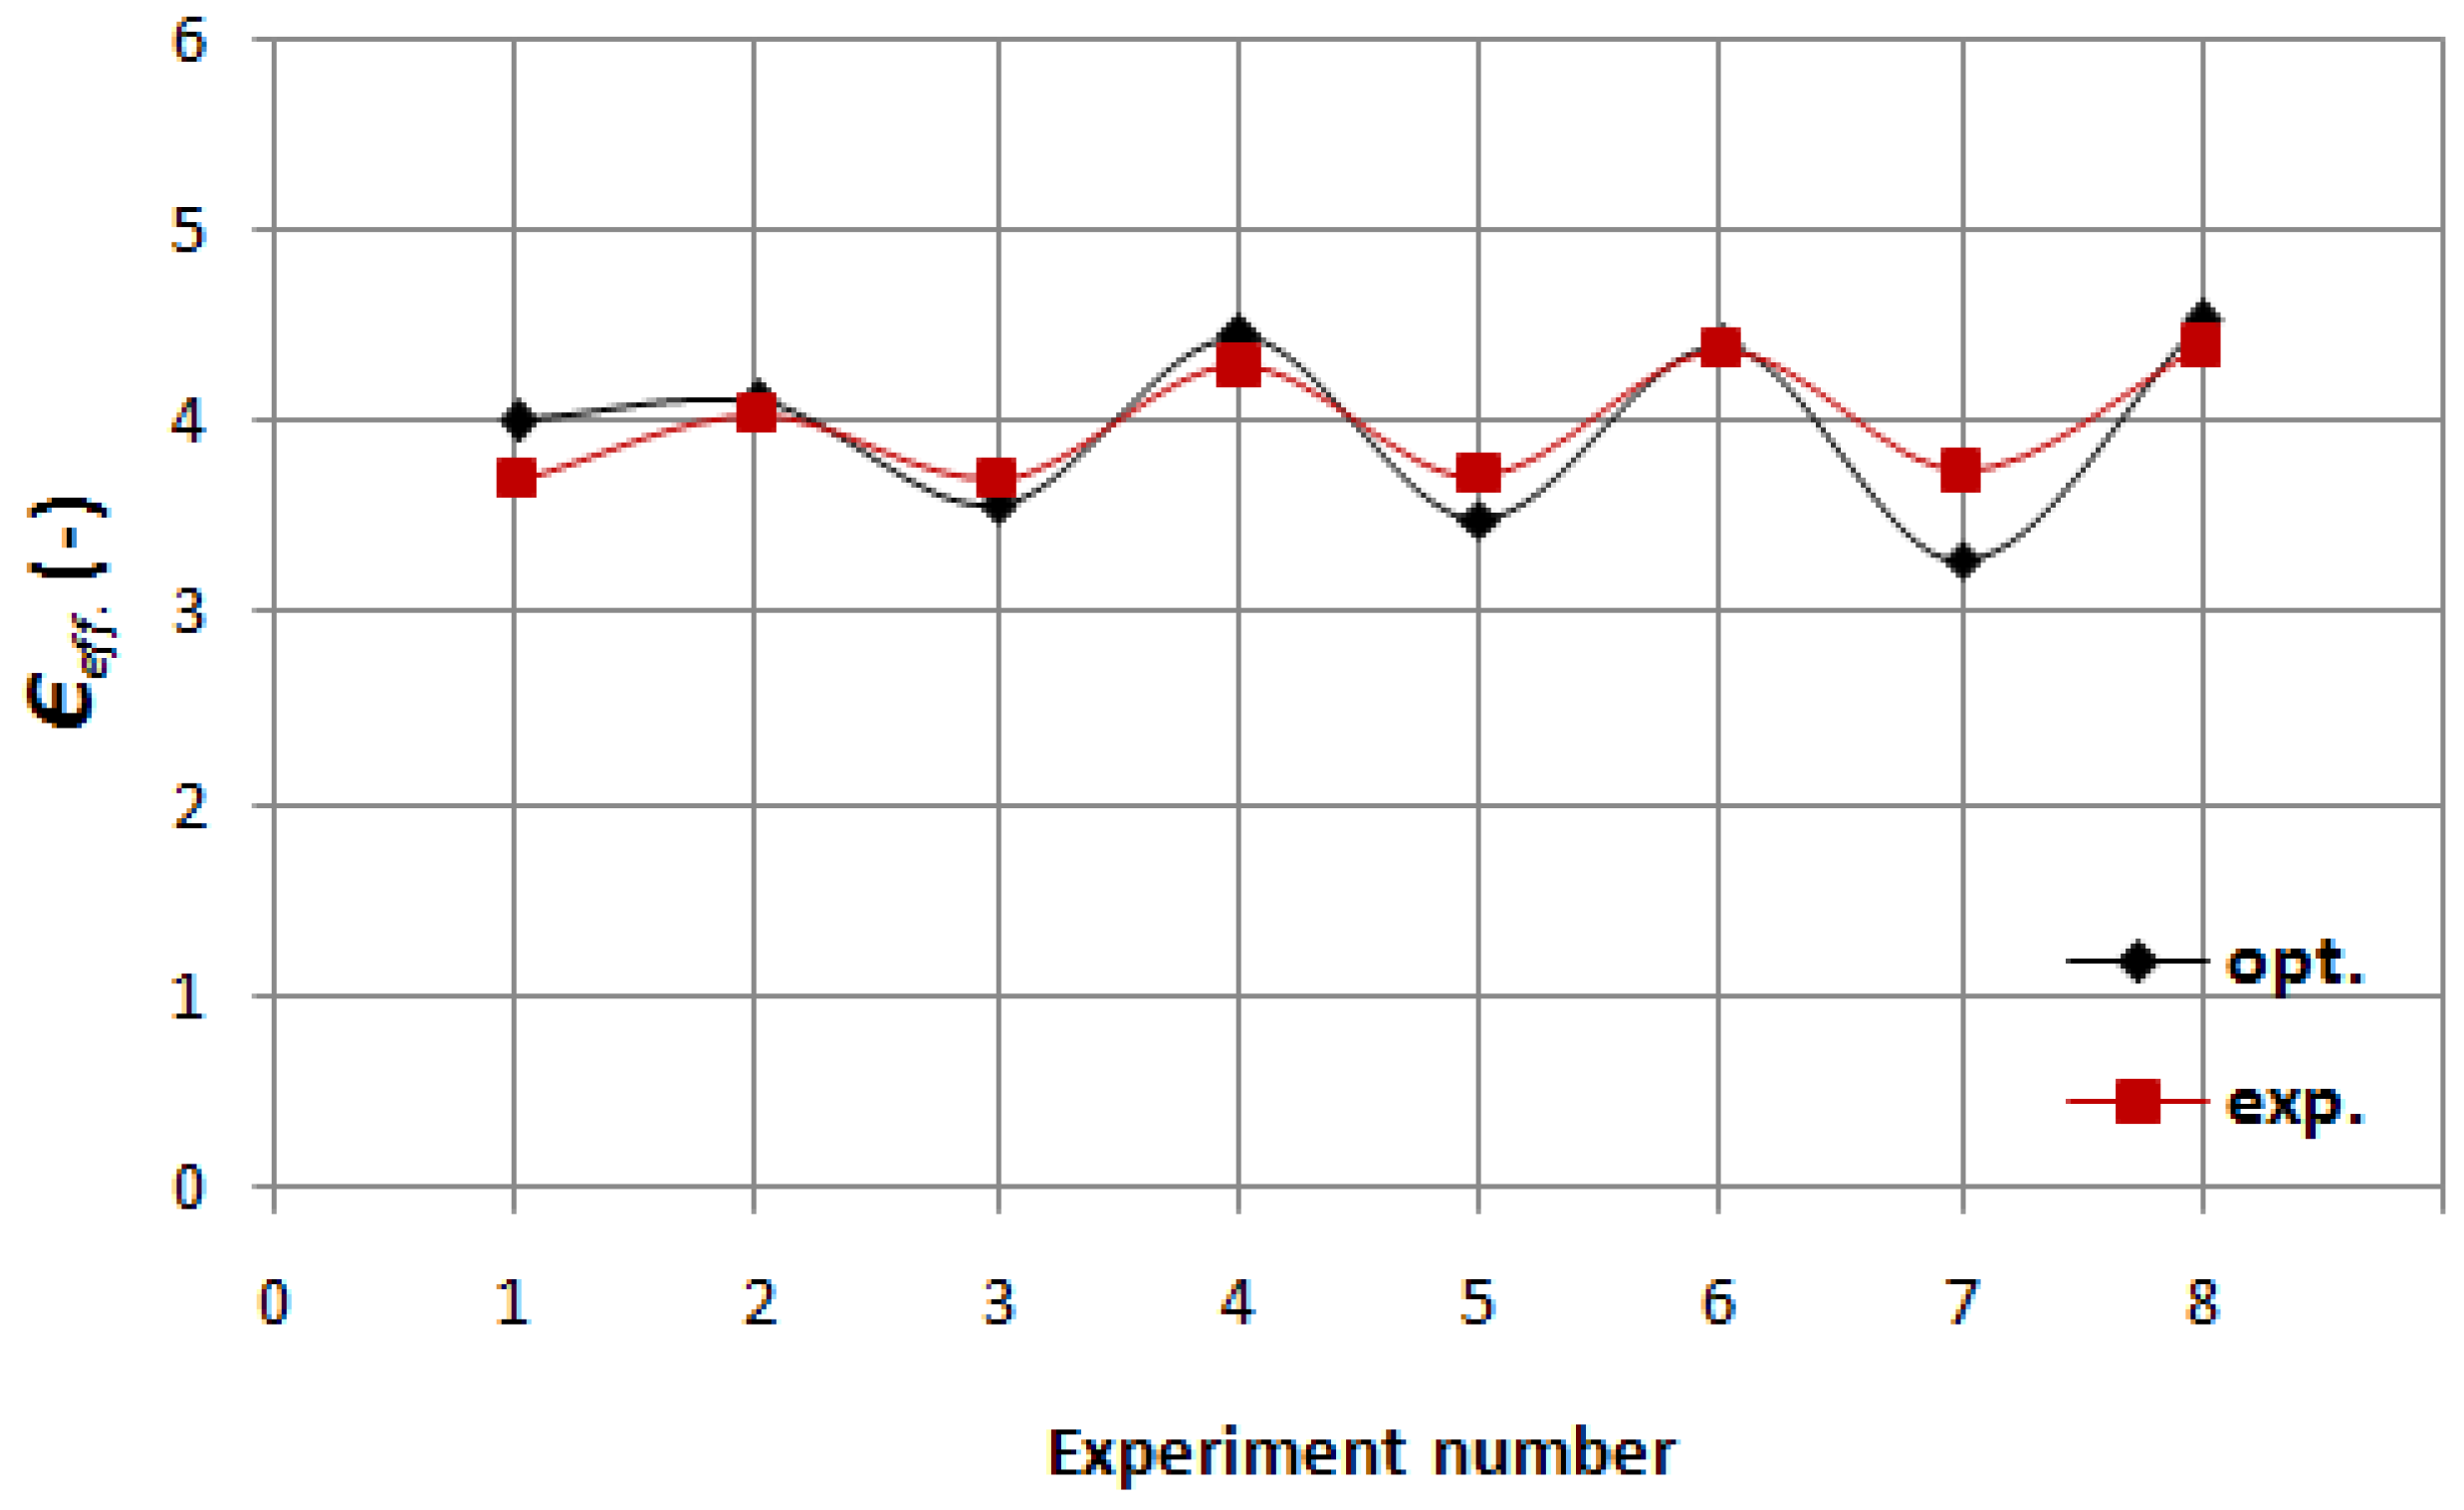
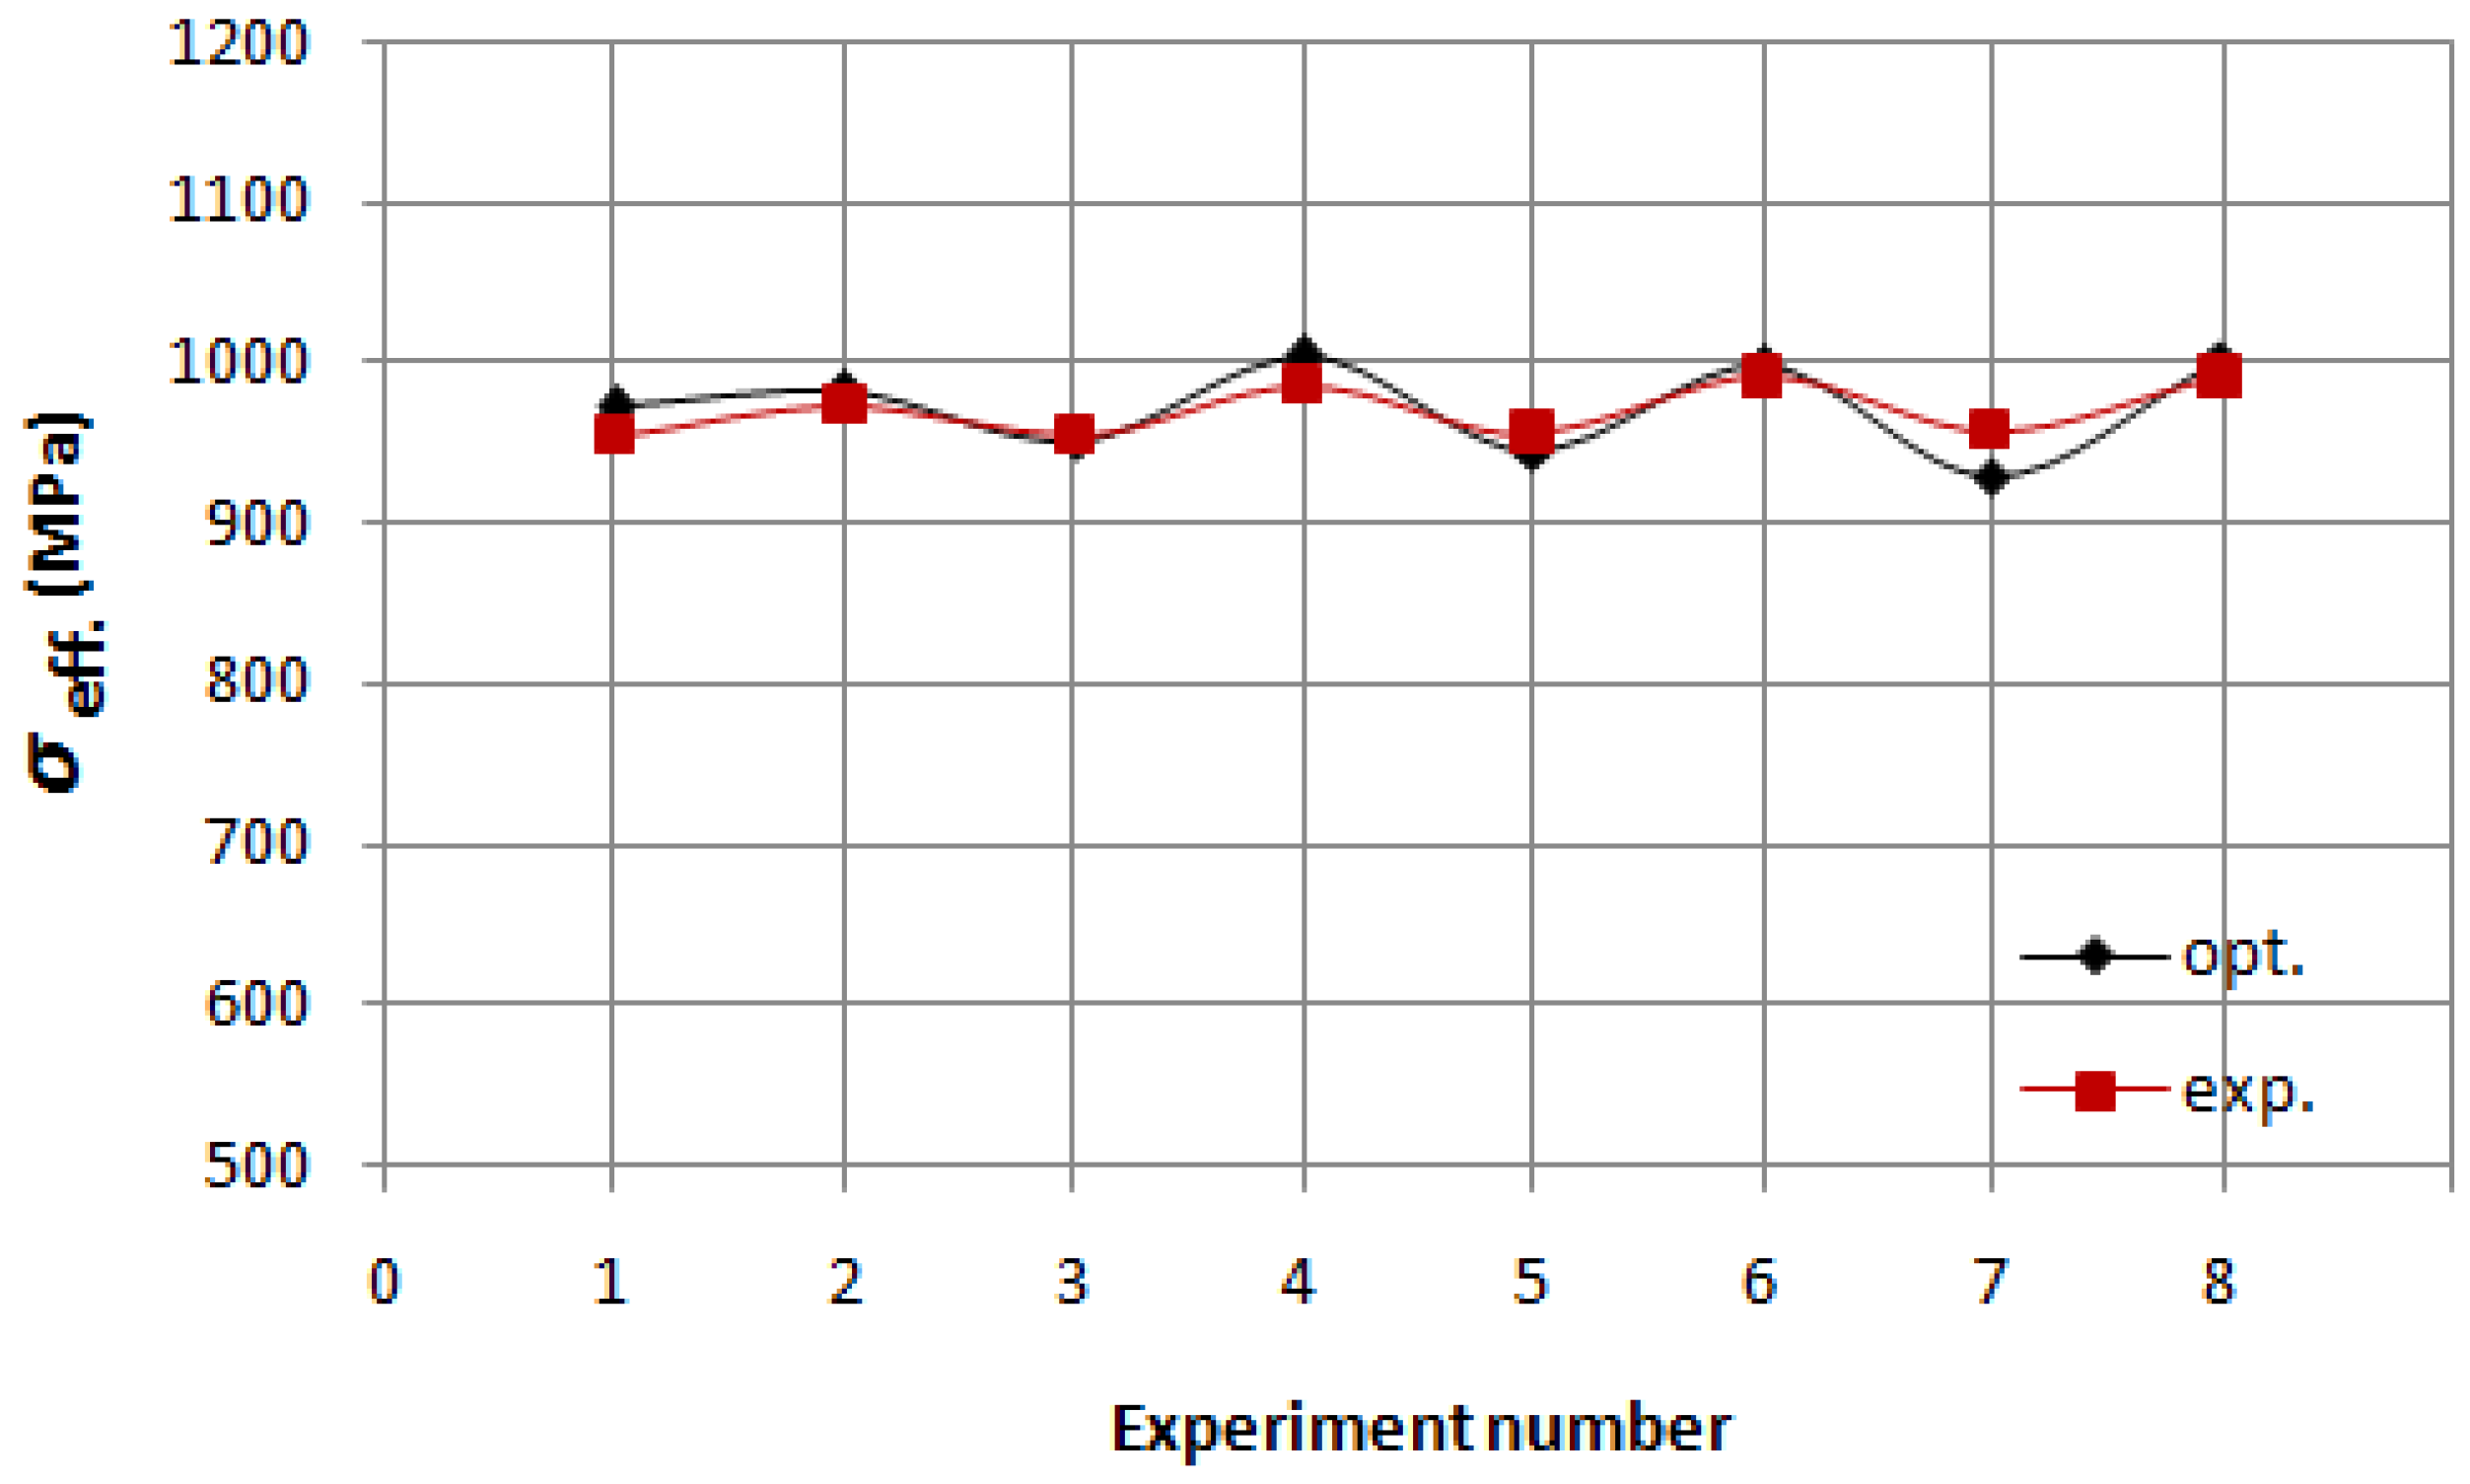
3.4.2. Effective Strain and Stress Estimation
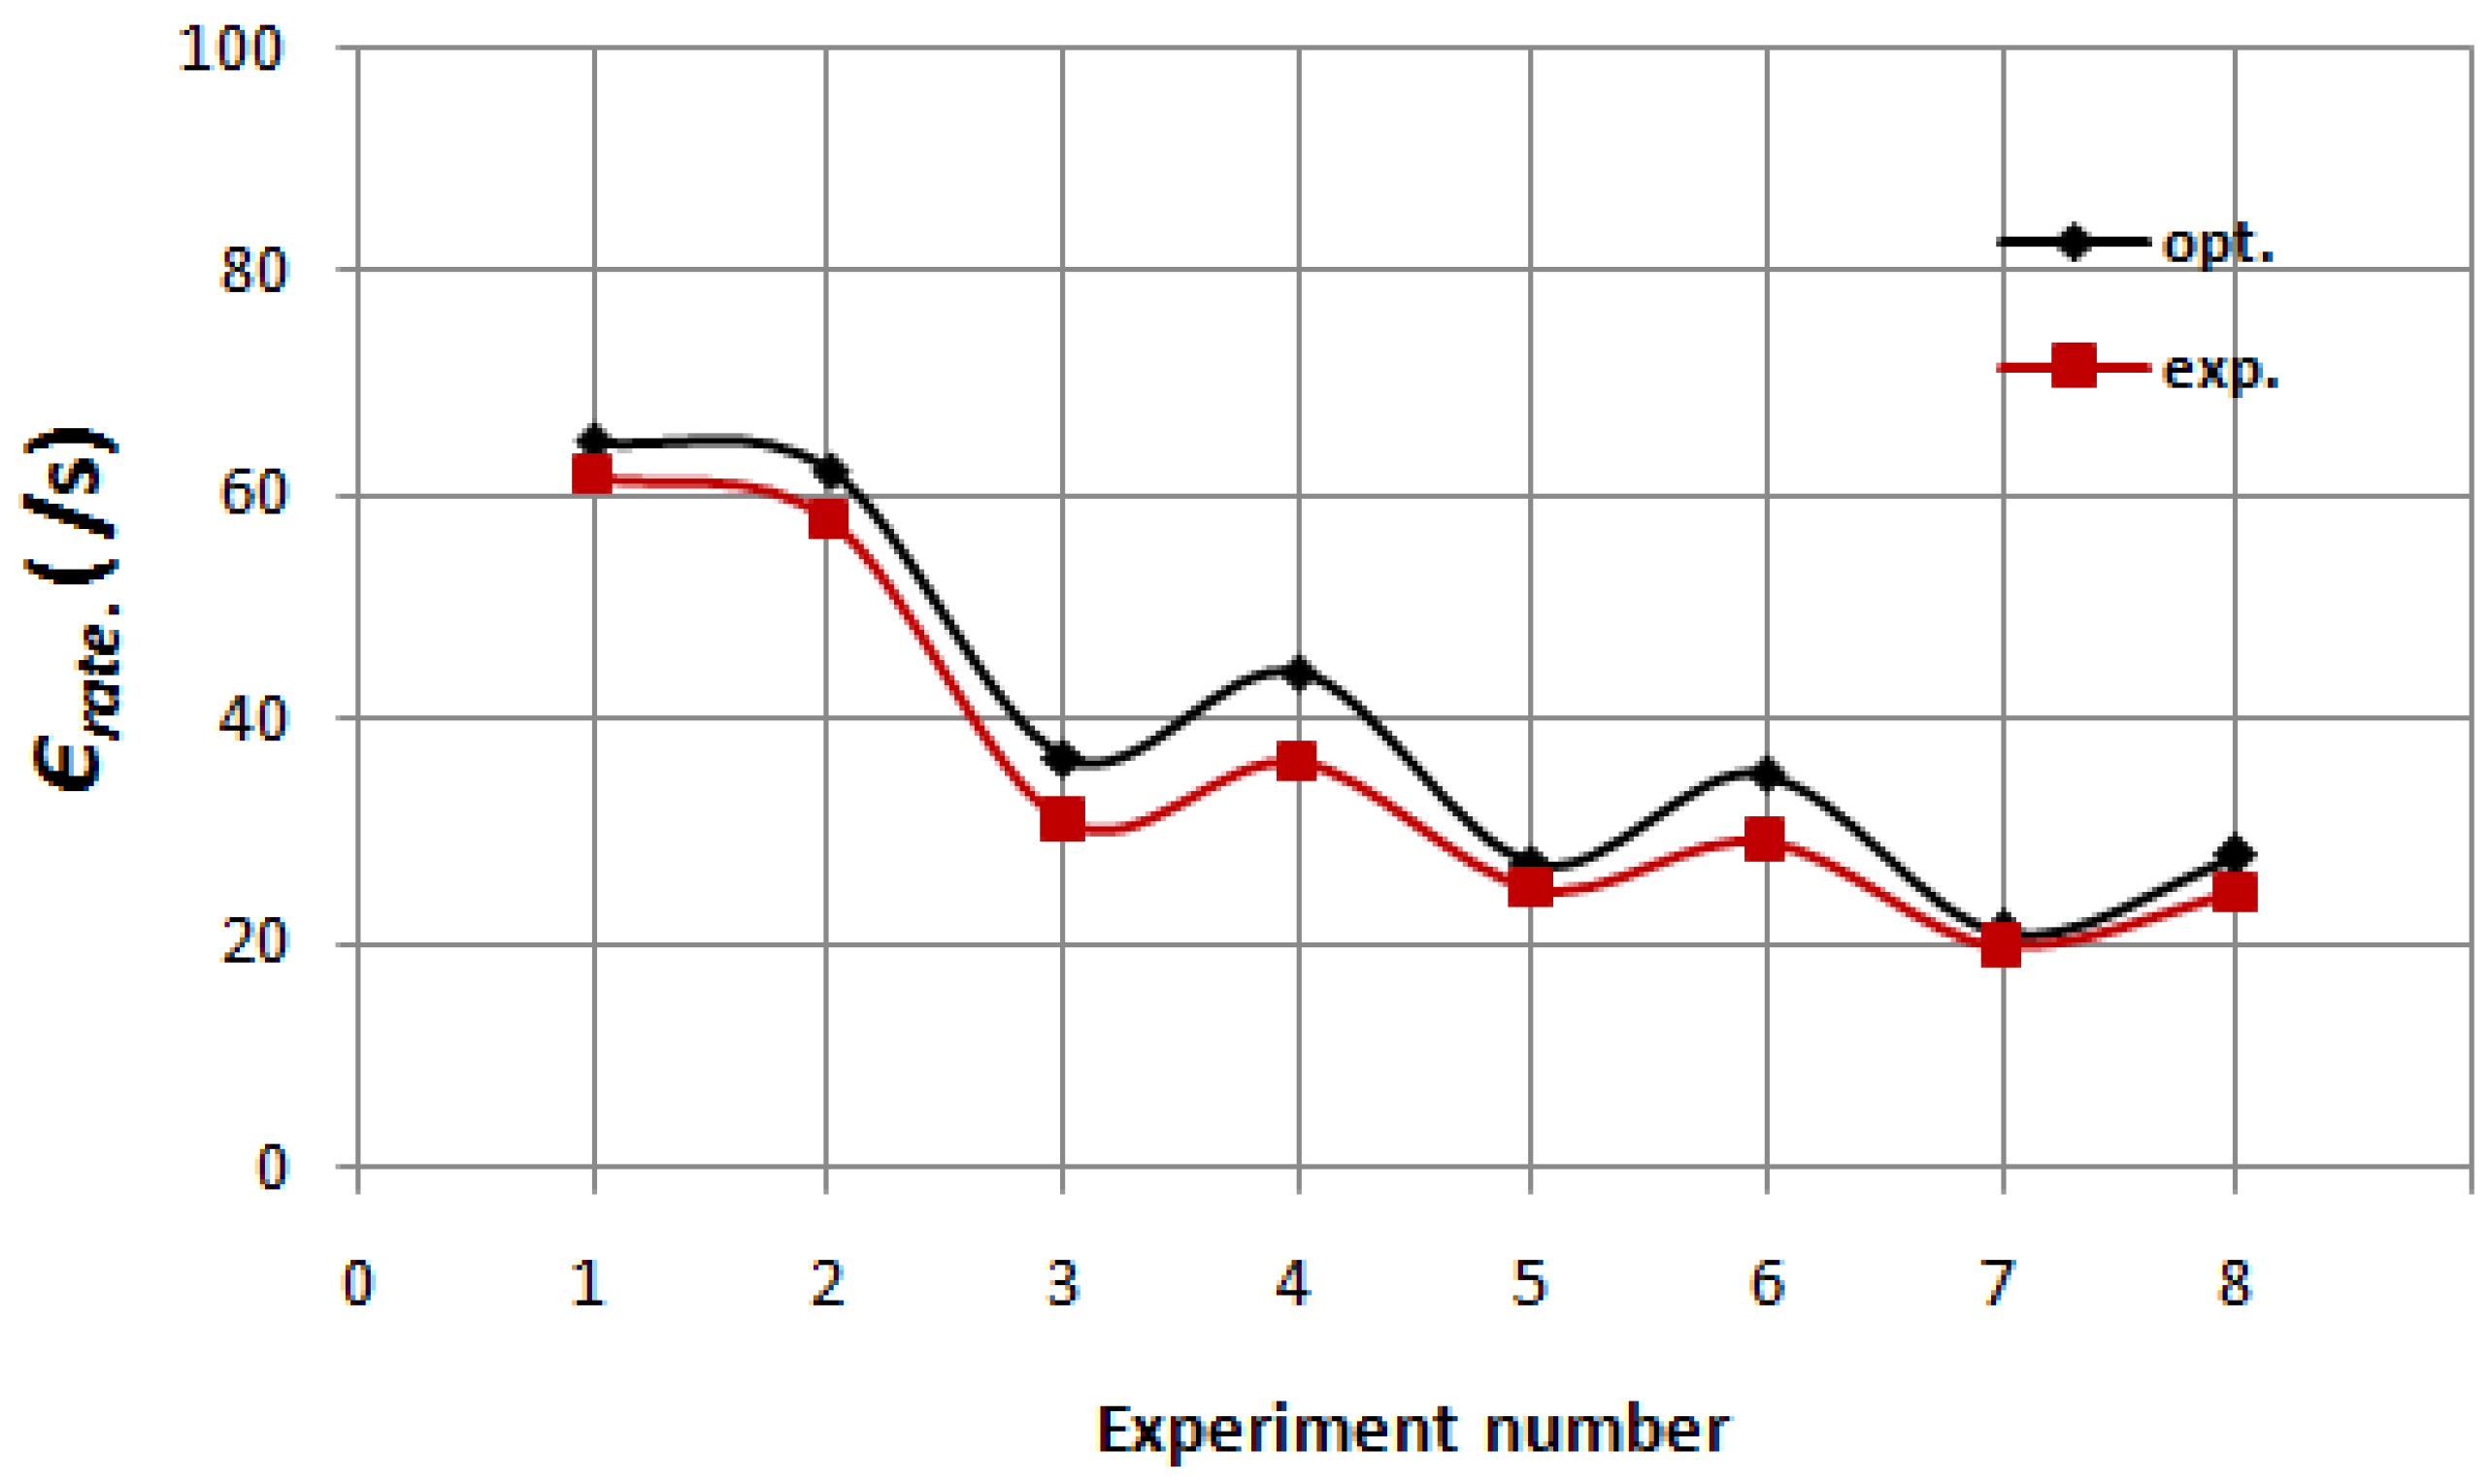
3.4.3. Effective Strain Rate Estimation
3.5. Microstructural Observation
4. Conclusions
- The forming responses are observed to be majorly affected by the reduction ratio, whereas, the marginal influence of the punch angle and land height is witnessed. However, punch angle and land height are major concerns in deciding the service life of the punches in cold forging backward extrusion. The effect of the billet size ratio is seen in the range from 0.3 to 0.6, and a further increase in the volume merely increases the values of forming responses. The deformation is also largely affected by the carbon content of the steel, as evidenced by AISI 1010, 1018, and 1045 steel materials.
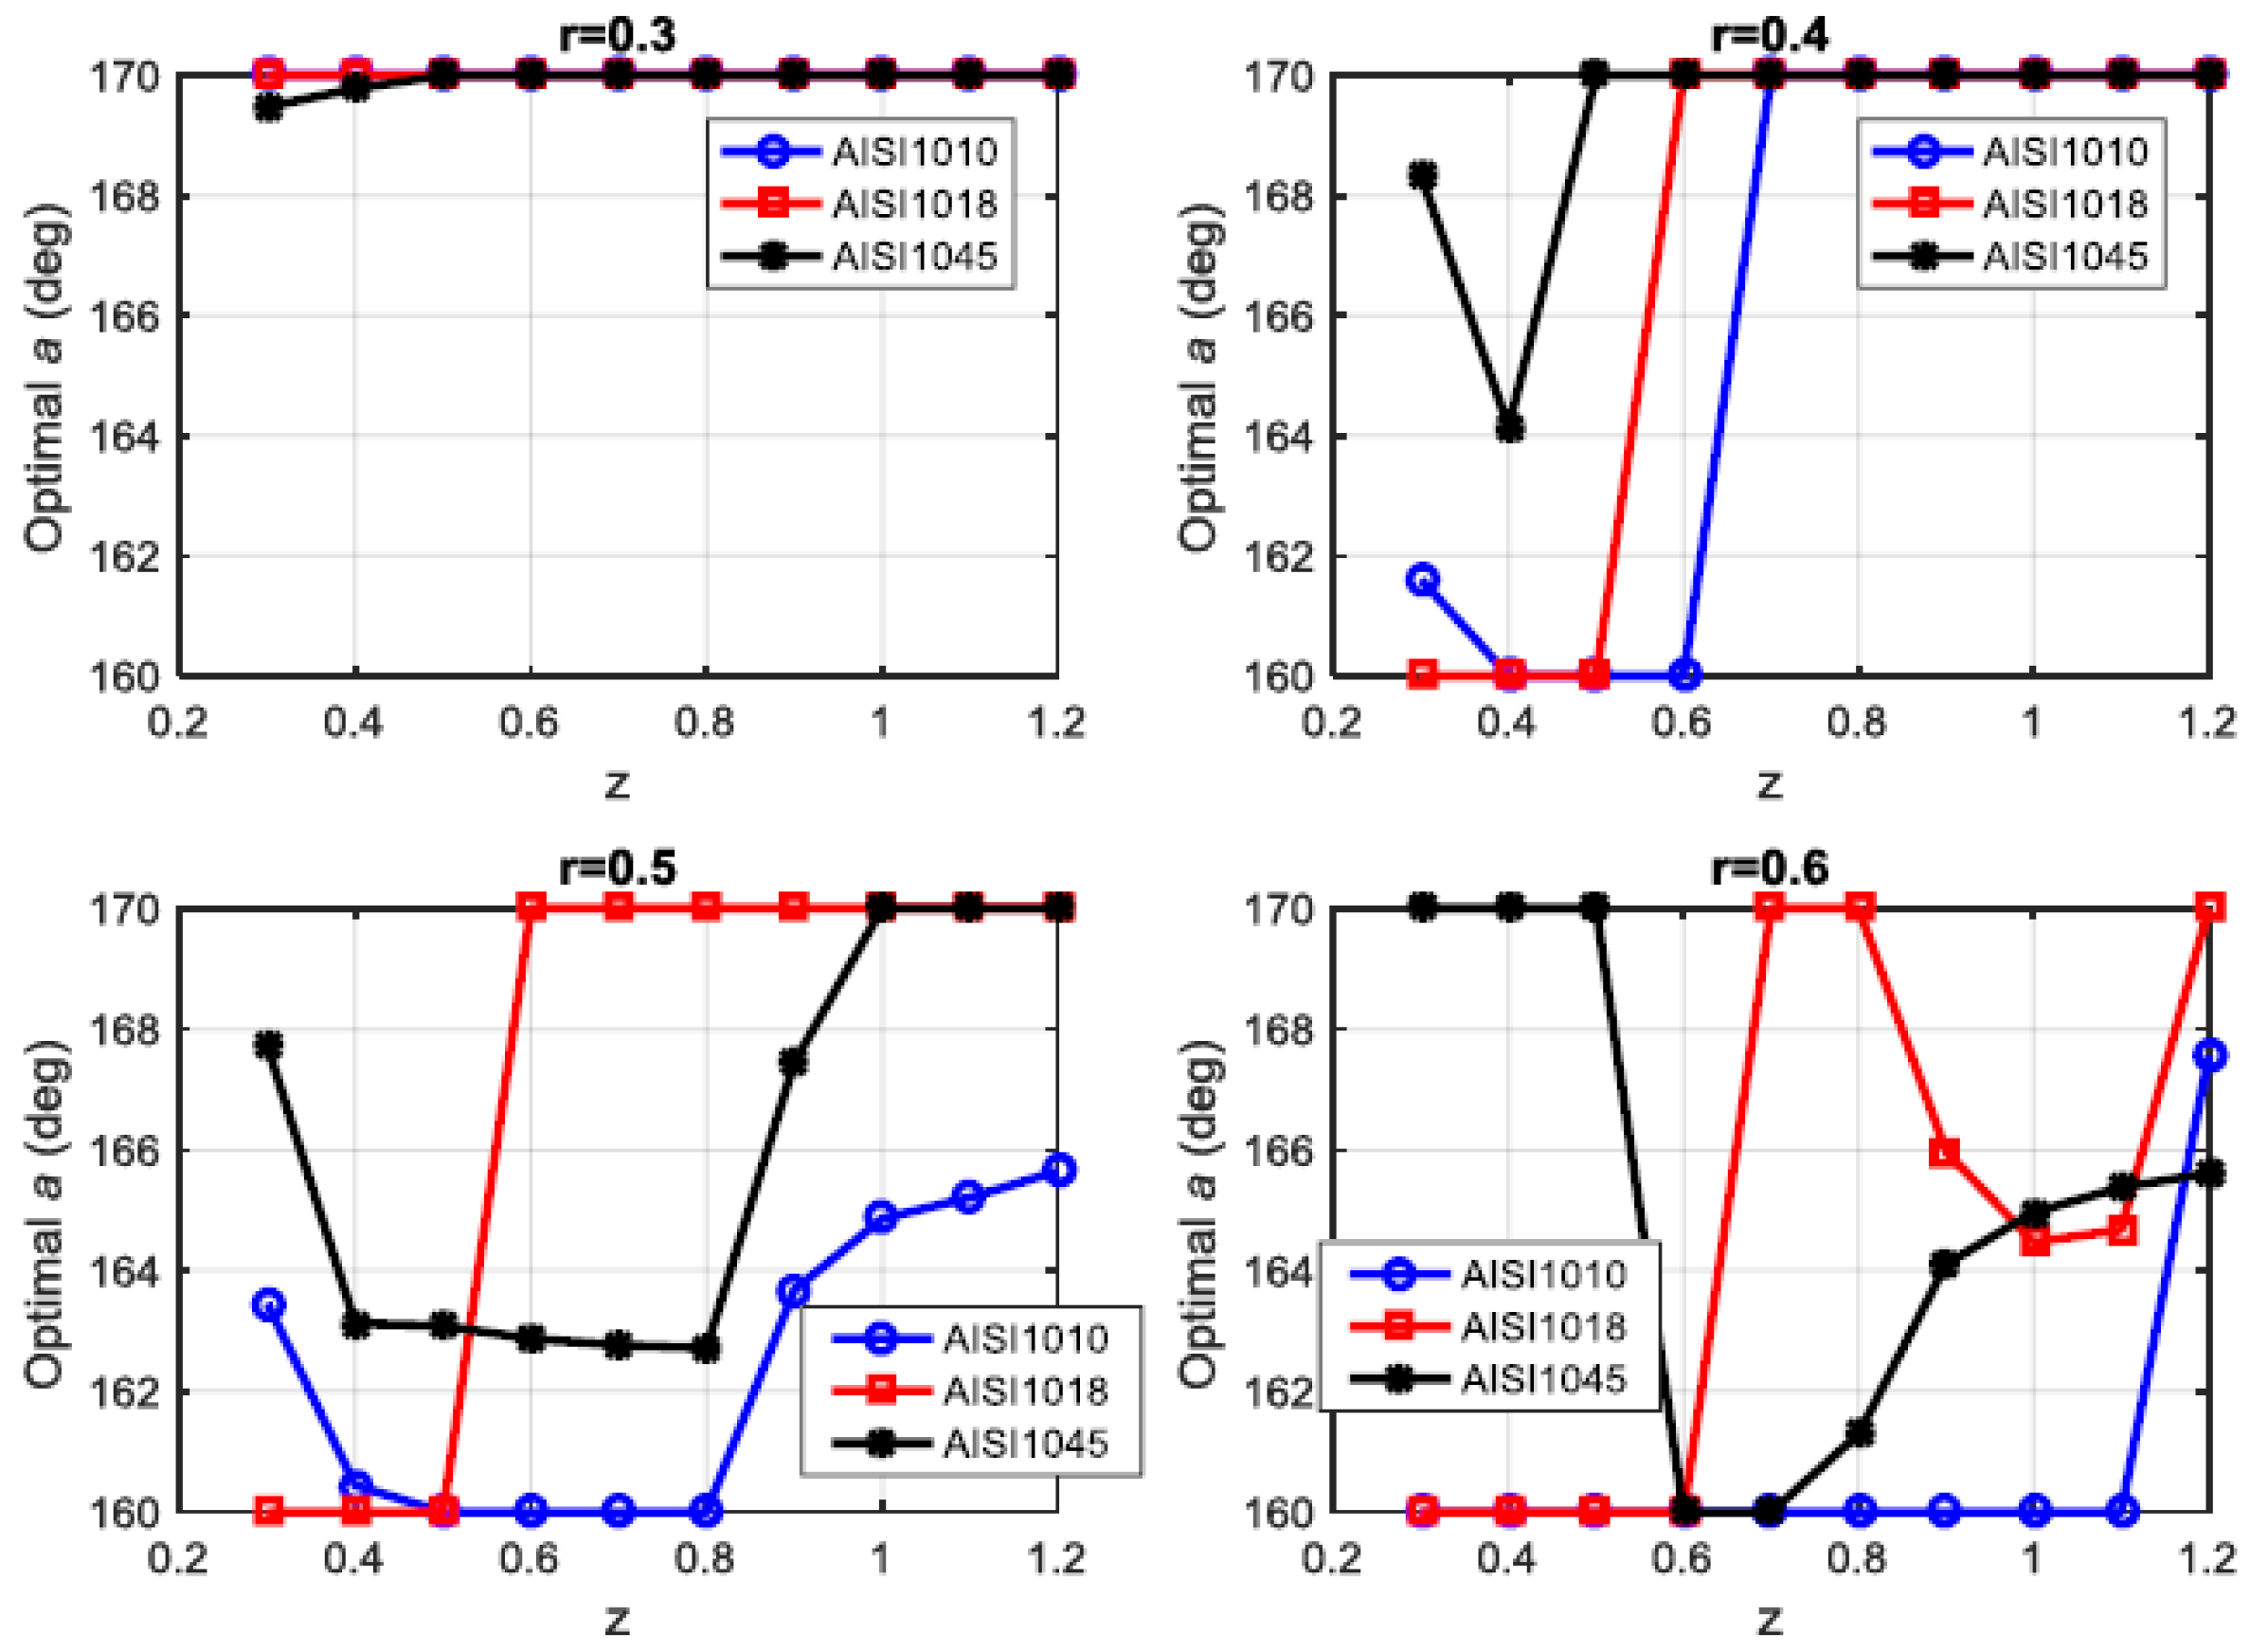
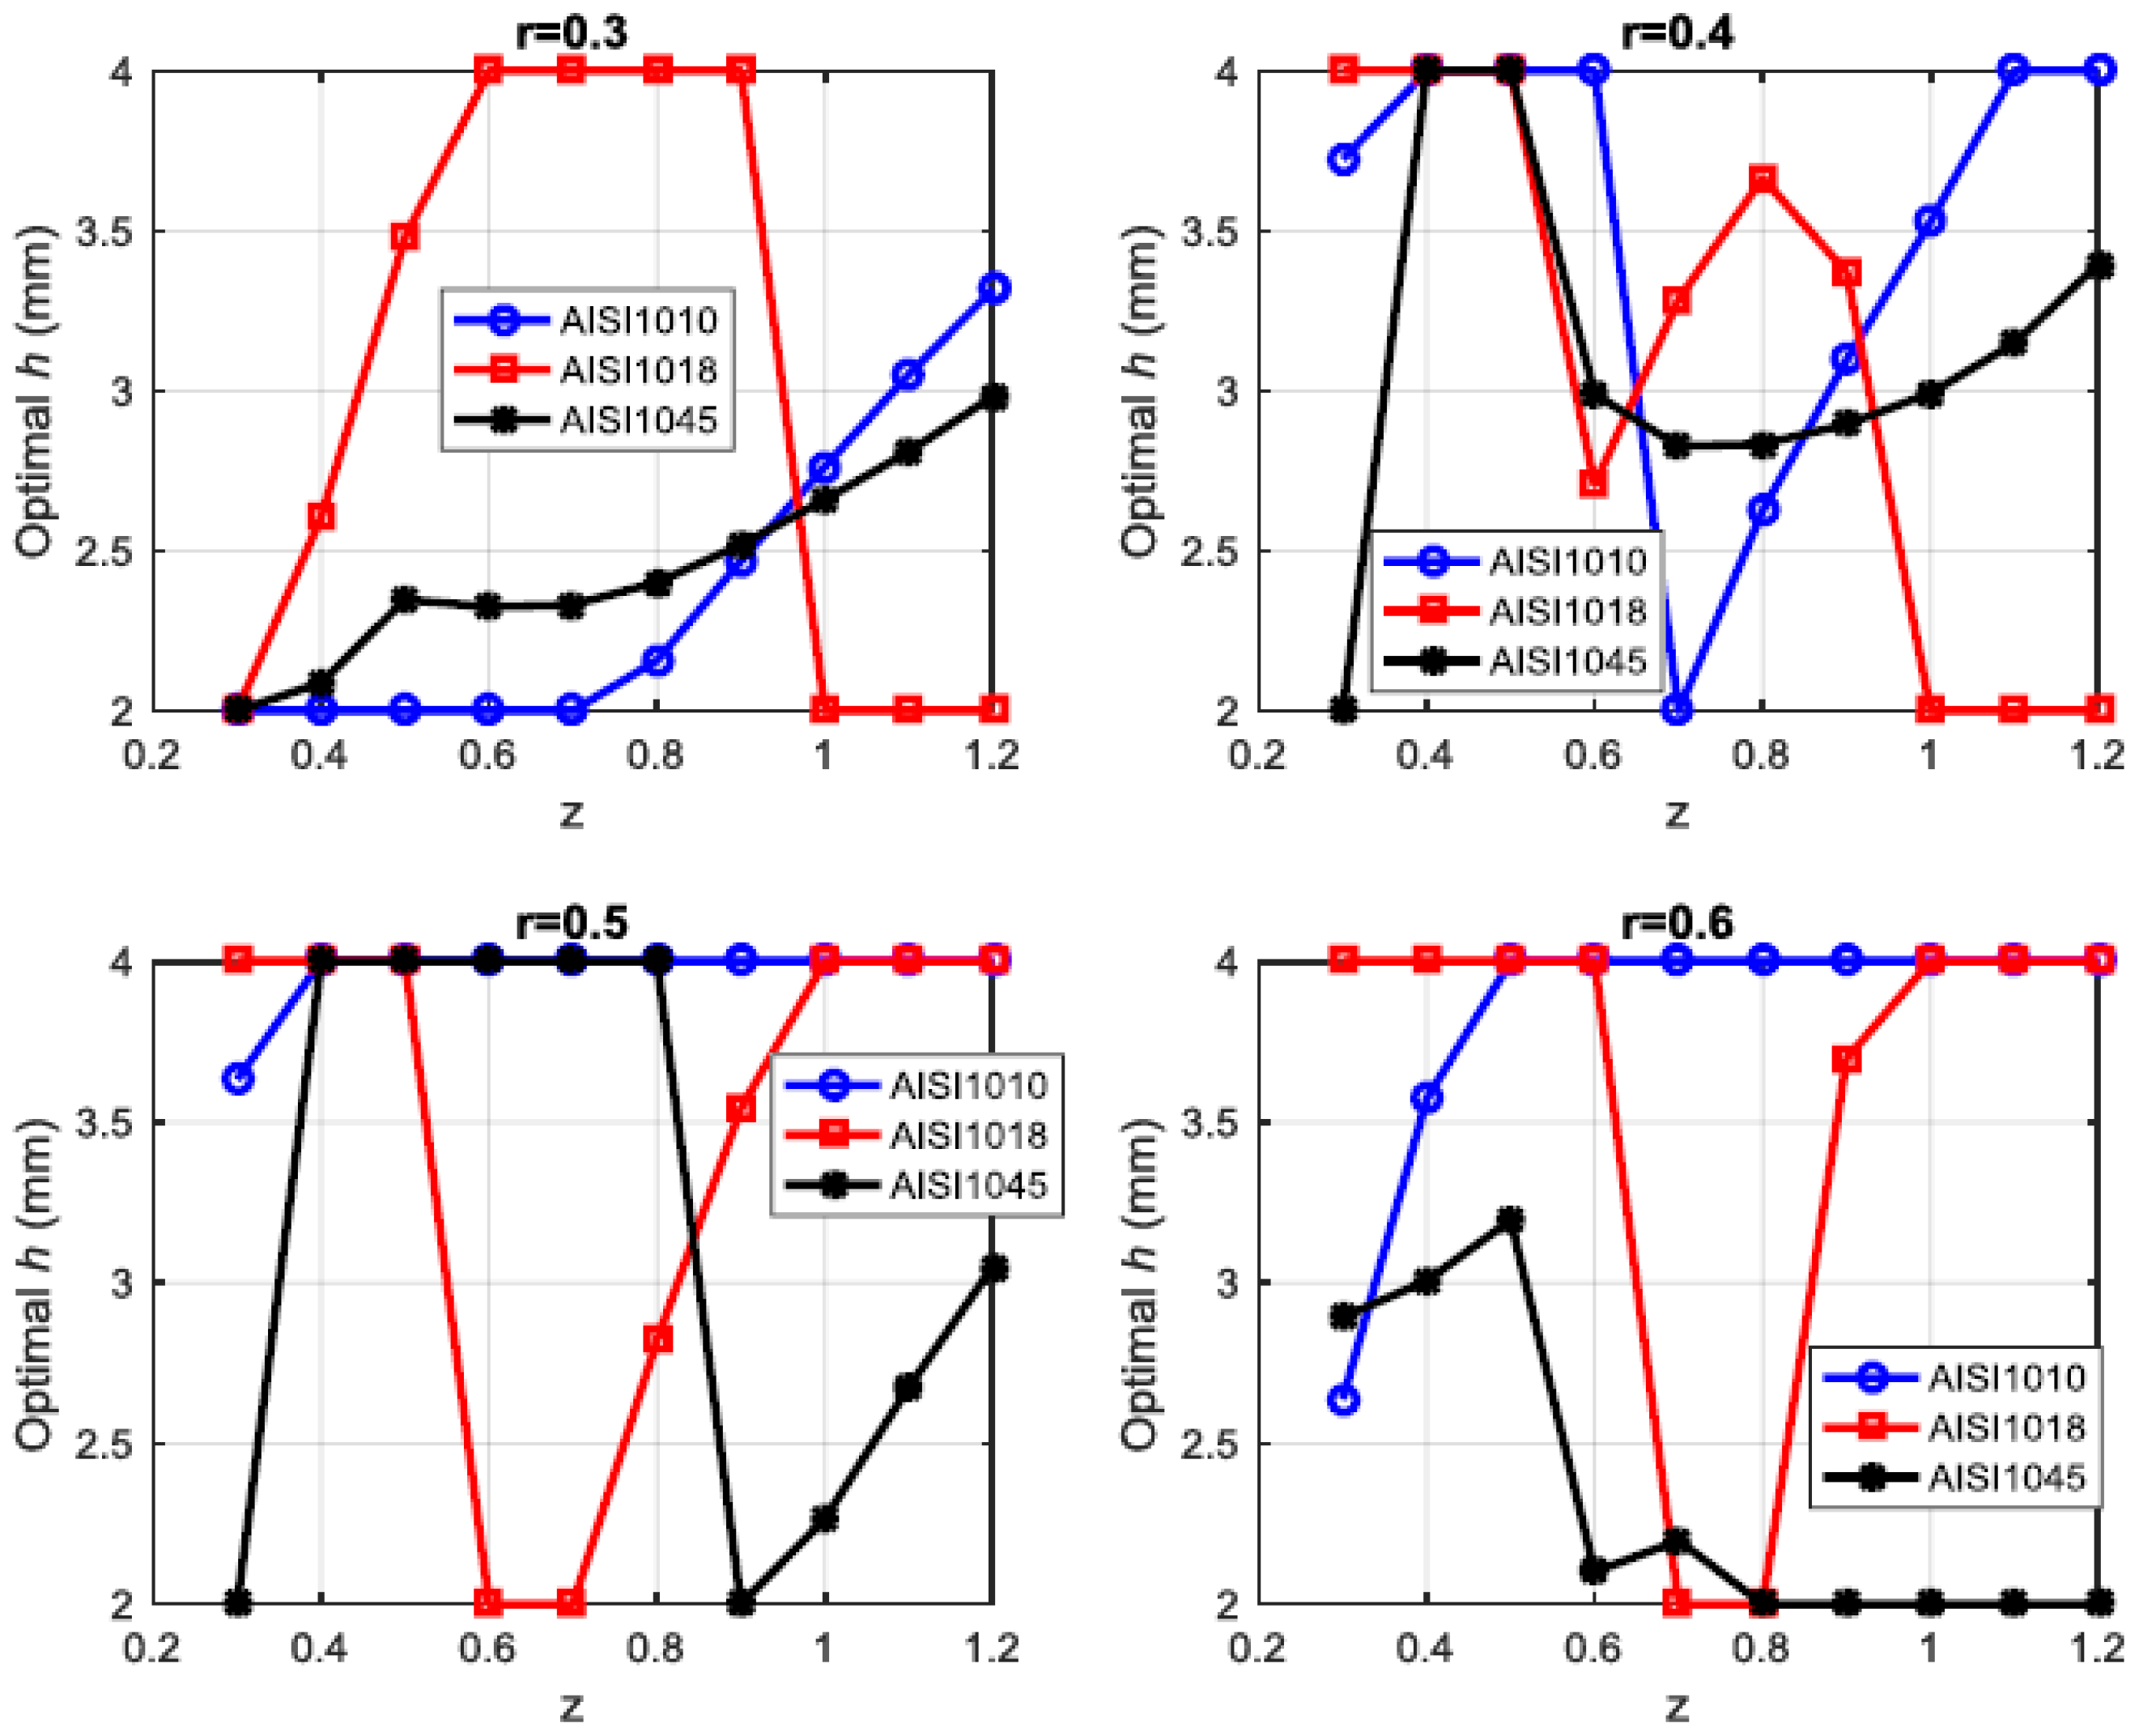
- The optimal punch angle for a reduction ratio of 0.3 is at 170° irrespective of the billet size ratio and type of AISI grade chosen steels tested. However, the punch angle is highly susceptible to the carbon content of the steel, reduction, and billet size ratio. Similarly, optimal land height is found to be closer to around 4 mm for AISI 1010 and 1018, whereas minimal (about 2 mm) for AISI 1045 for the increased reduction and billet size ratios. Hence, it is clear that steel’s formability is majorly affected by the steel’s carbon content, while land height and punch angle are decided based on the internal profile of the component and has a bearing upon punch service life.
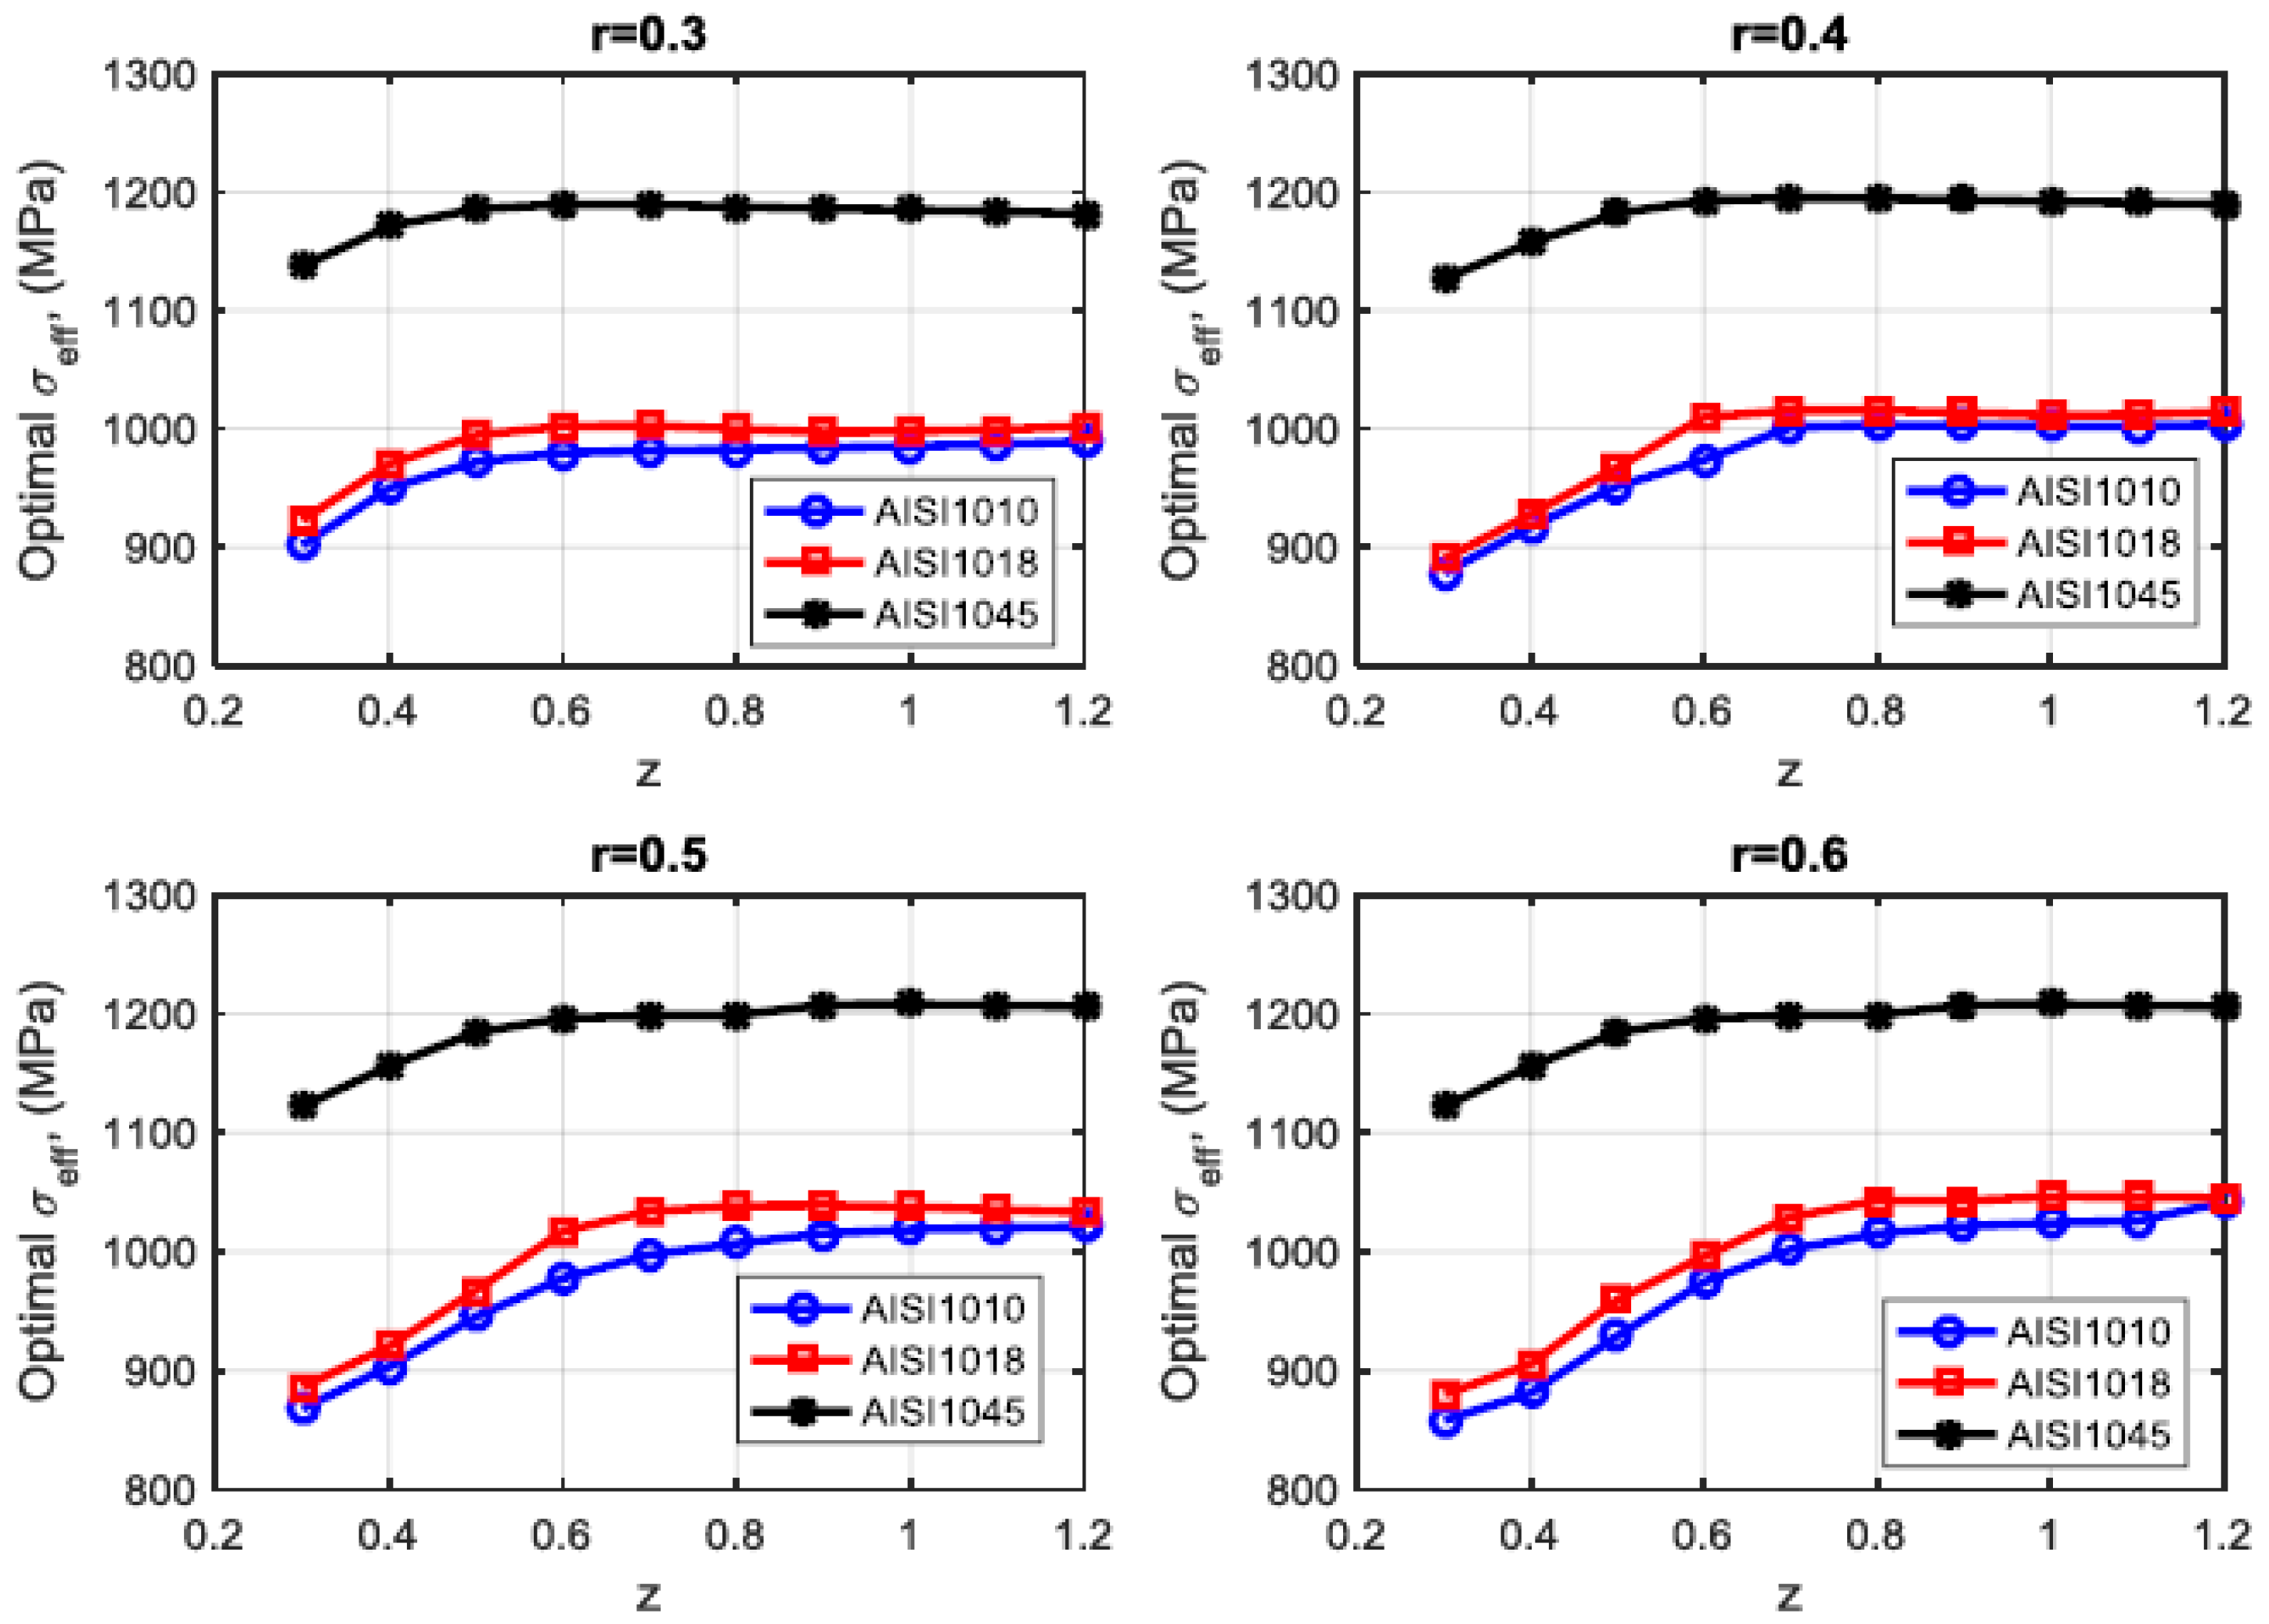
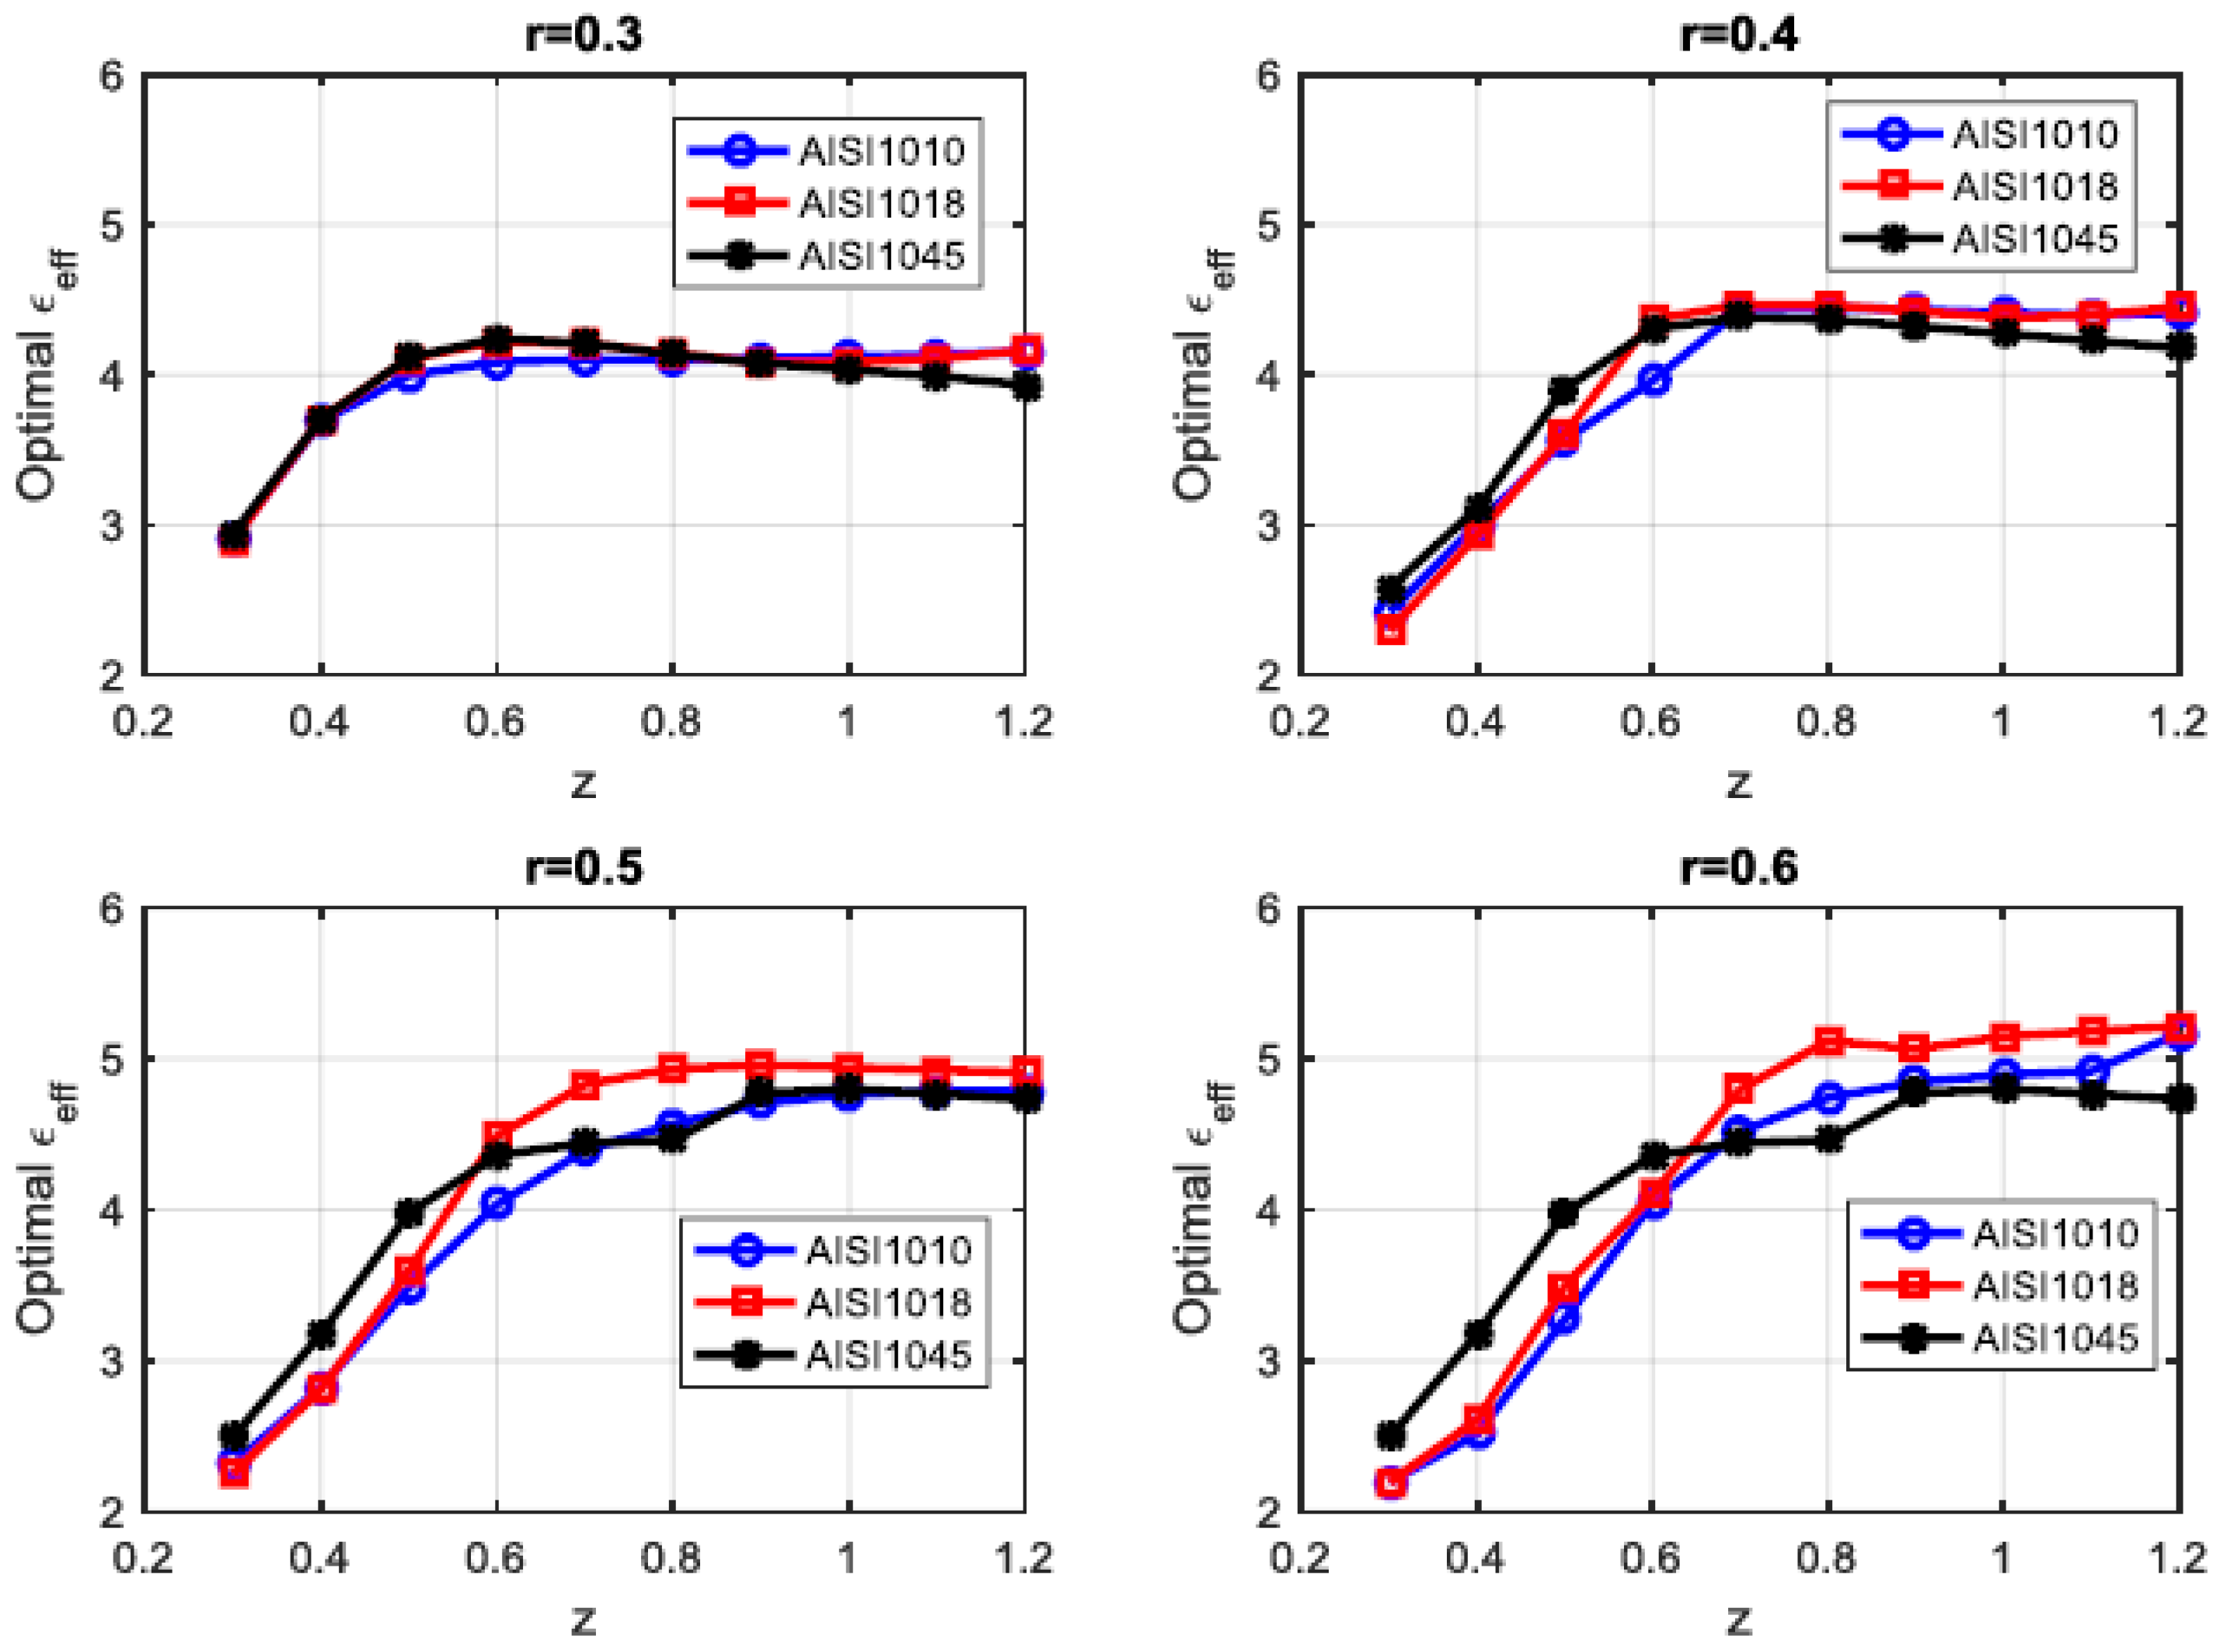
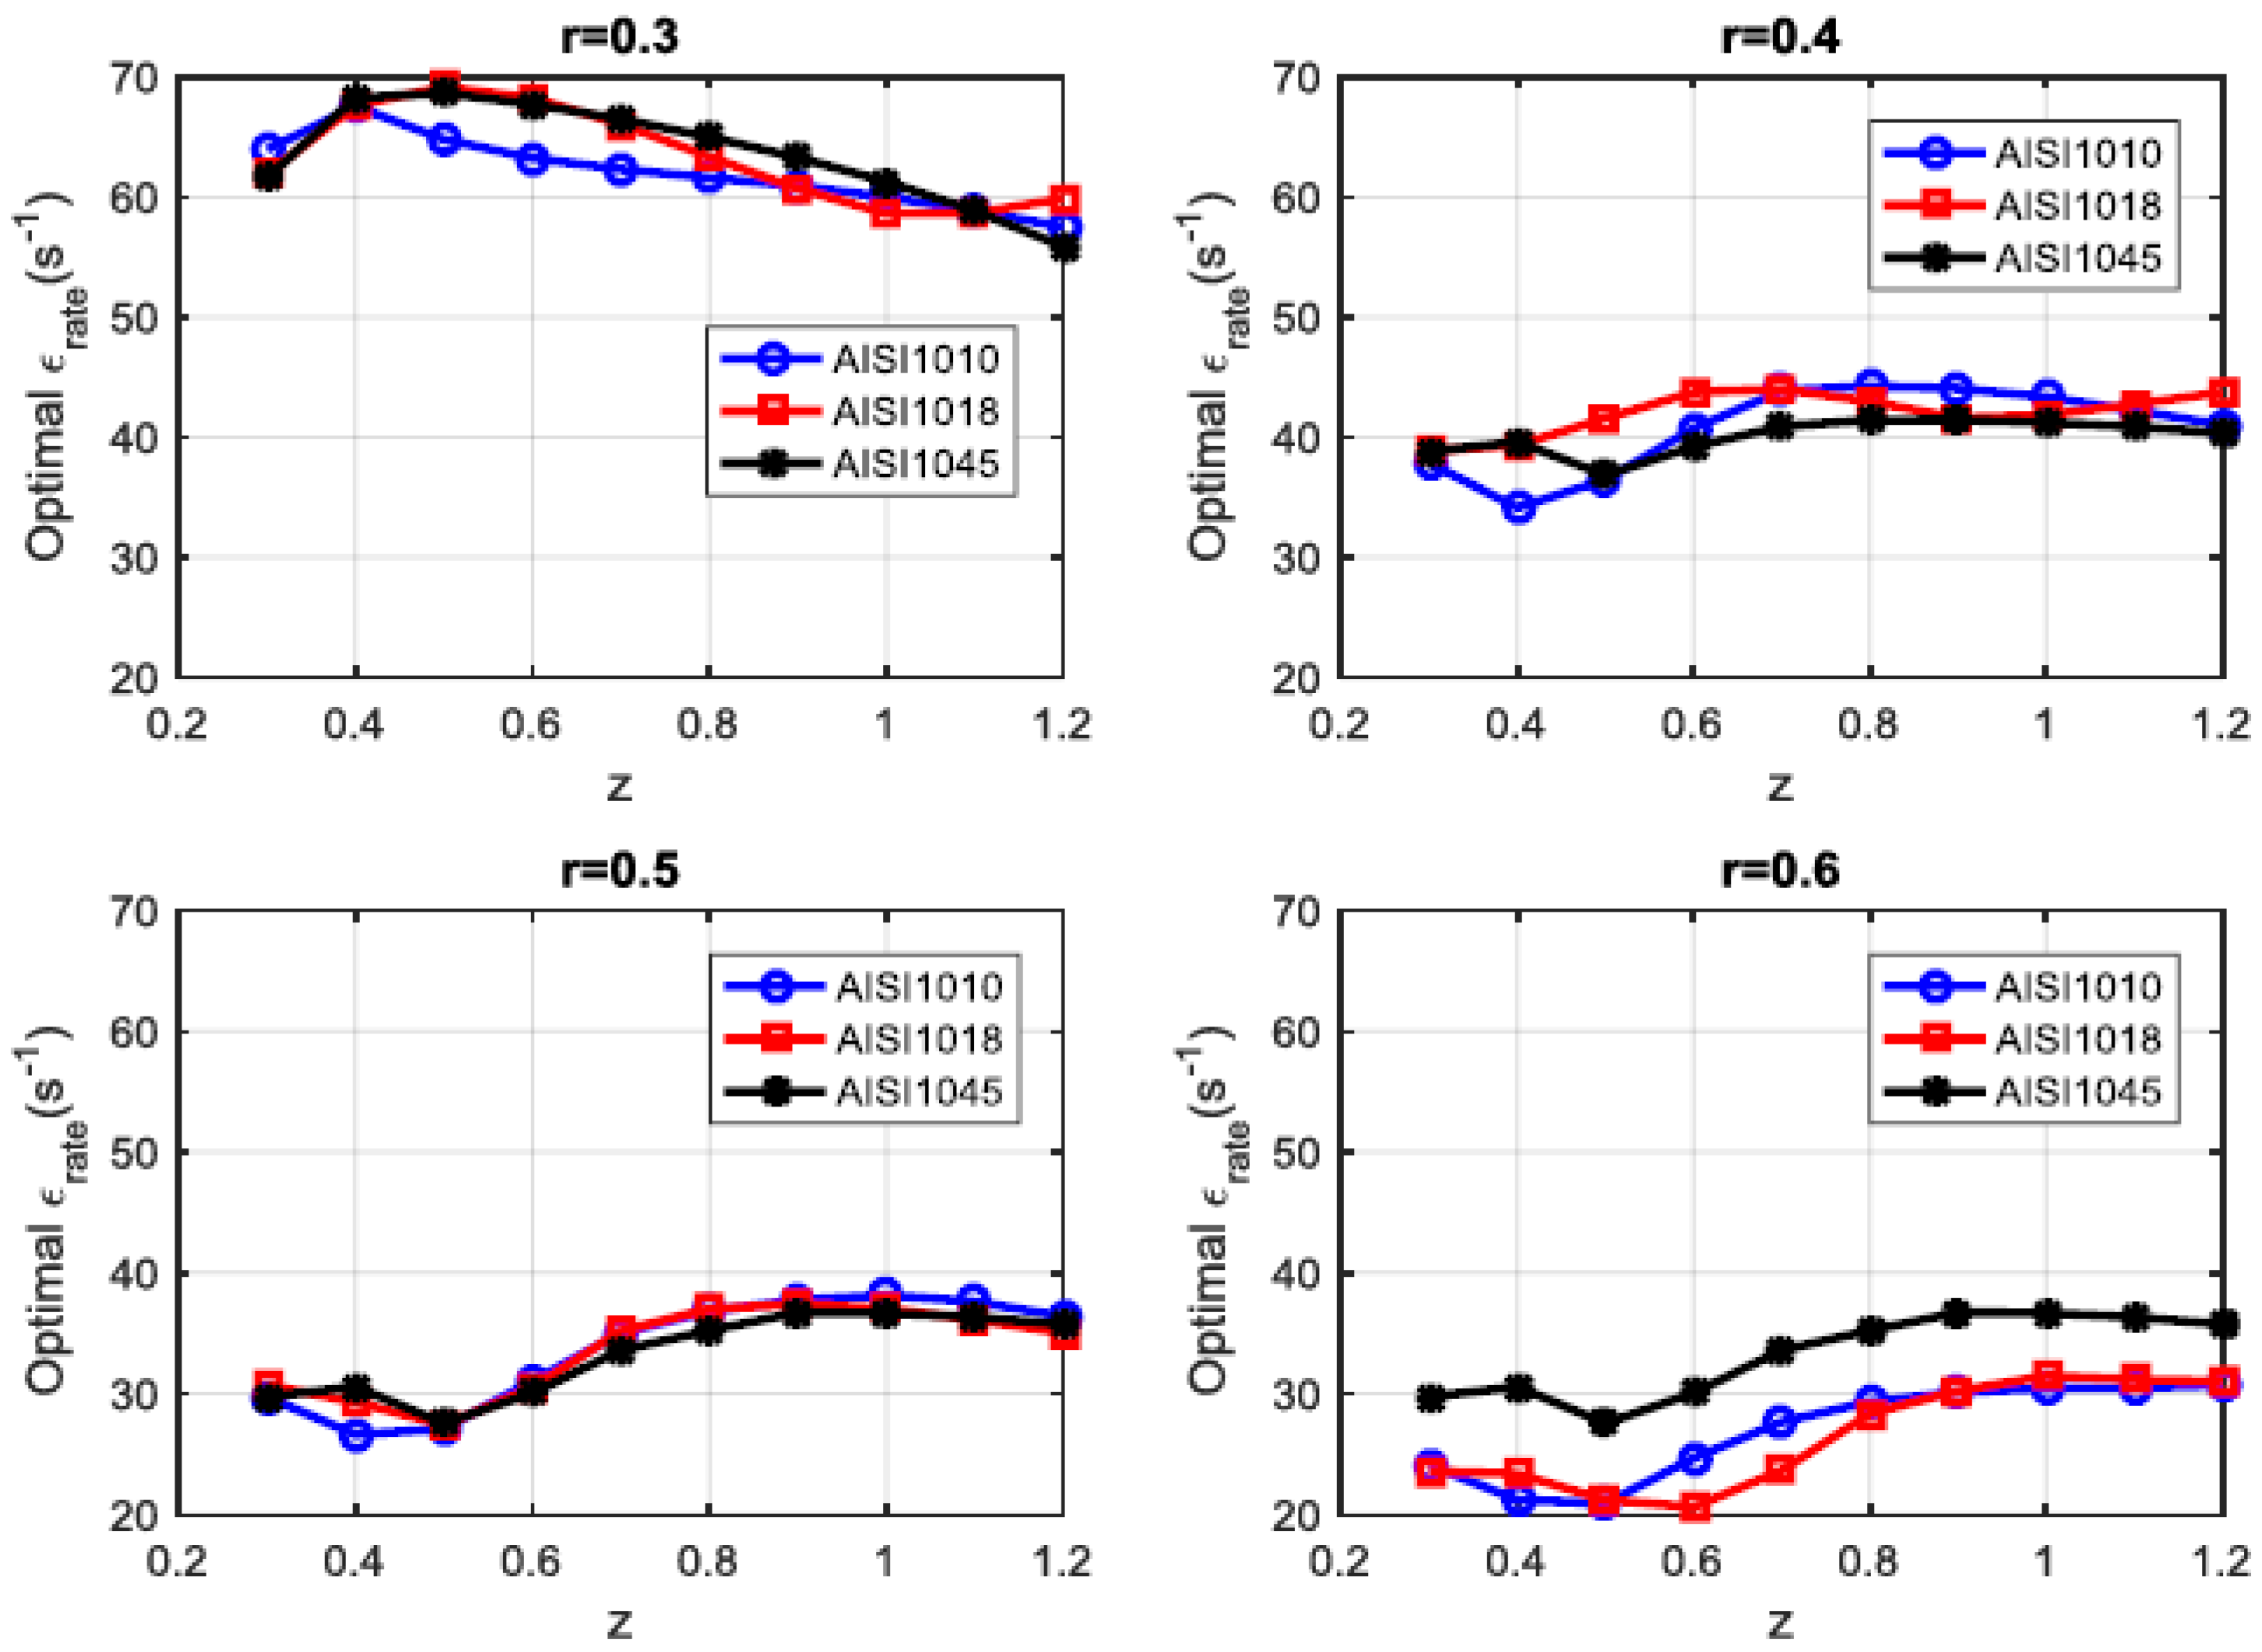
- Effective stress and strain optimal values obtained from optimization were observed to be of a similar trend and increased with reduction and billet size ratios. However, effective strain and punch force optimal values were reported to increase with decreased reduction ratios and remain marginally affected by billet size ratios. For the estimation of effective stress experimentally, the deformation or the strain is determined during cold forging and an analytical model comprising of the slab and power analysis has been implemented to arrive at the effective stress. The effective stress and strain values from experiments and those from the FE simulation and DE method are in good agreement.
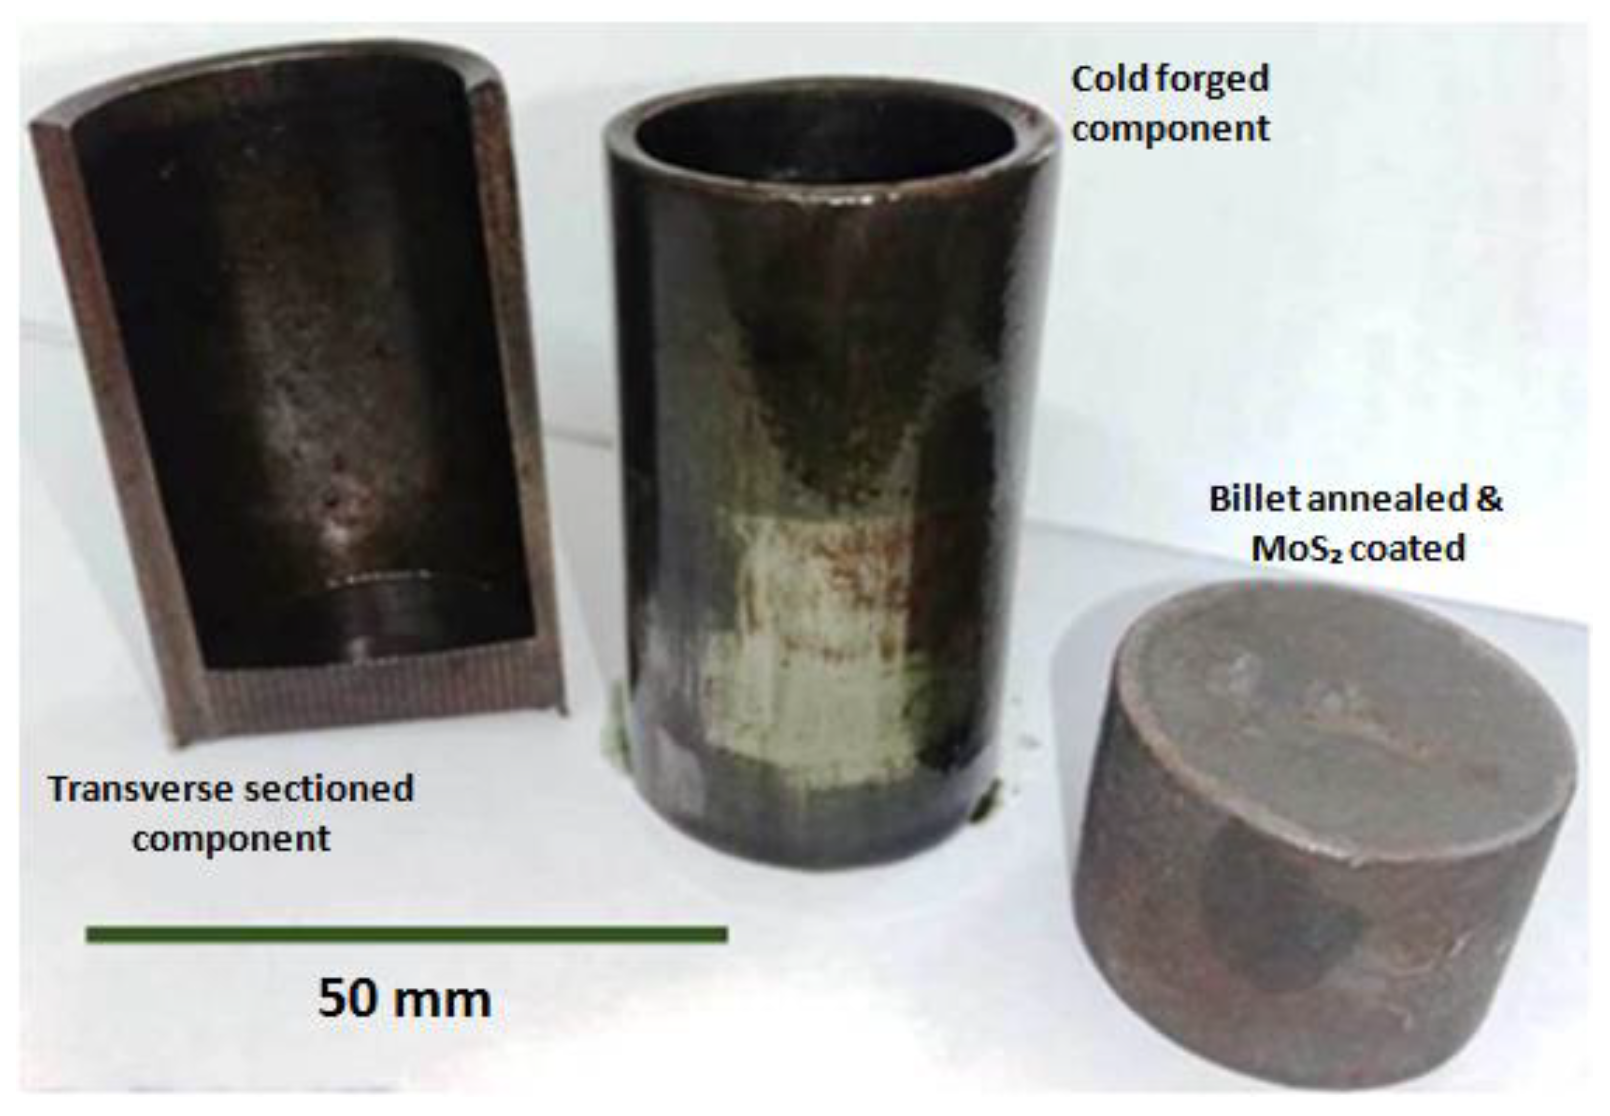
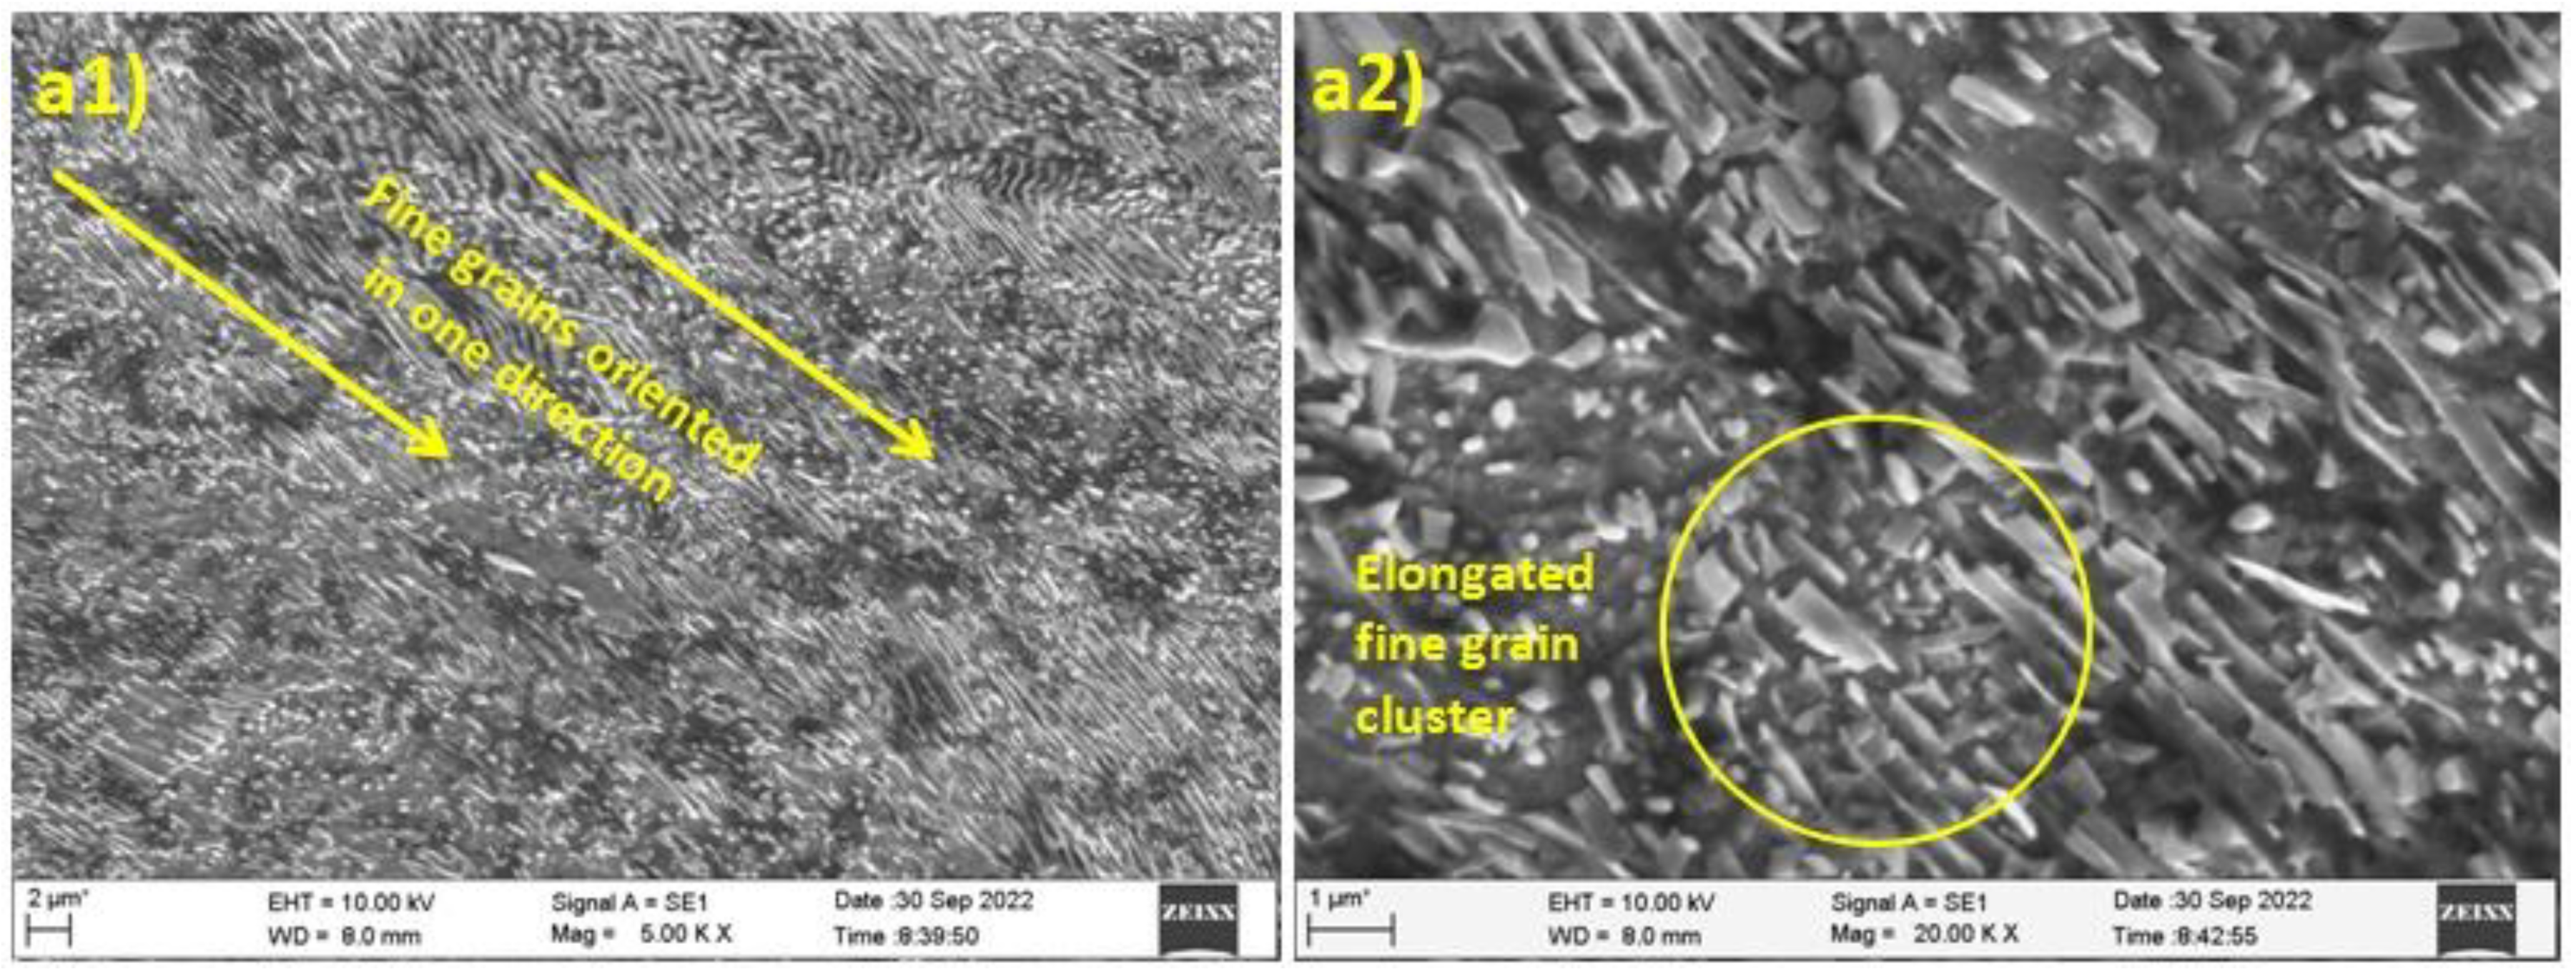
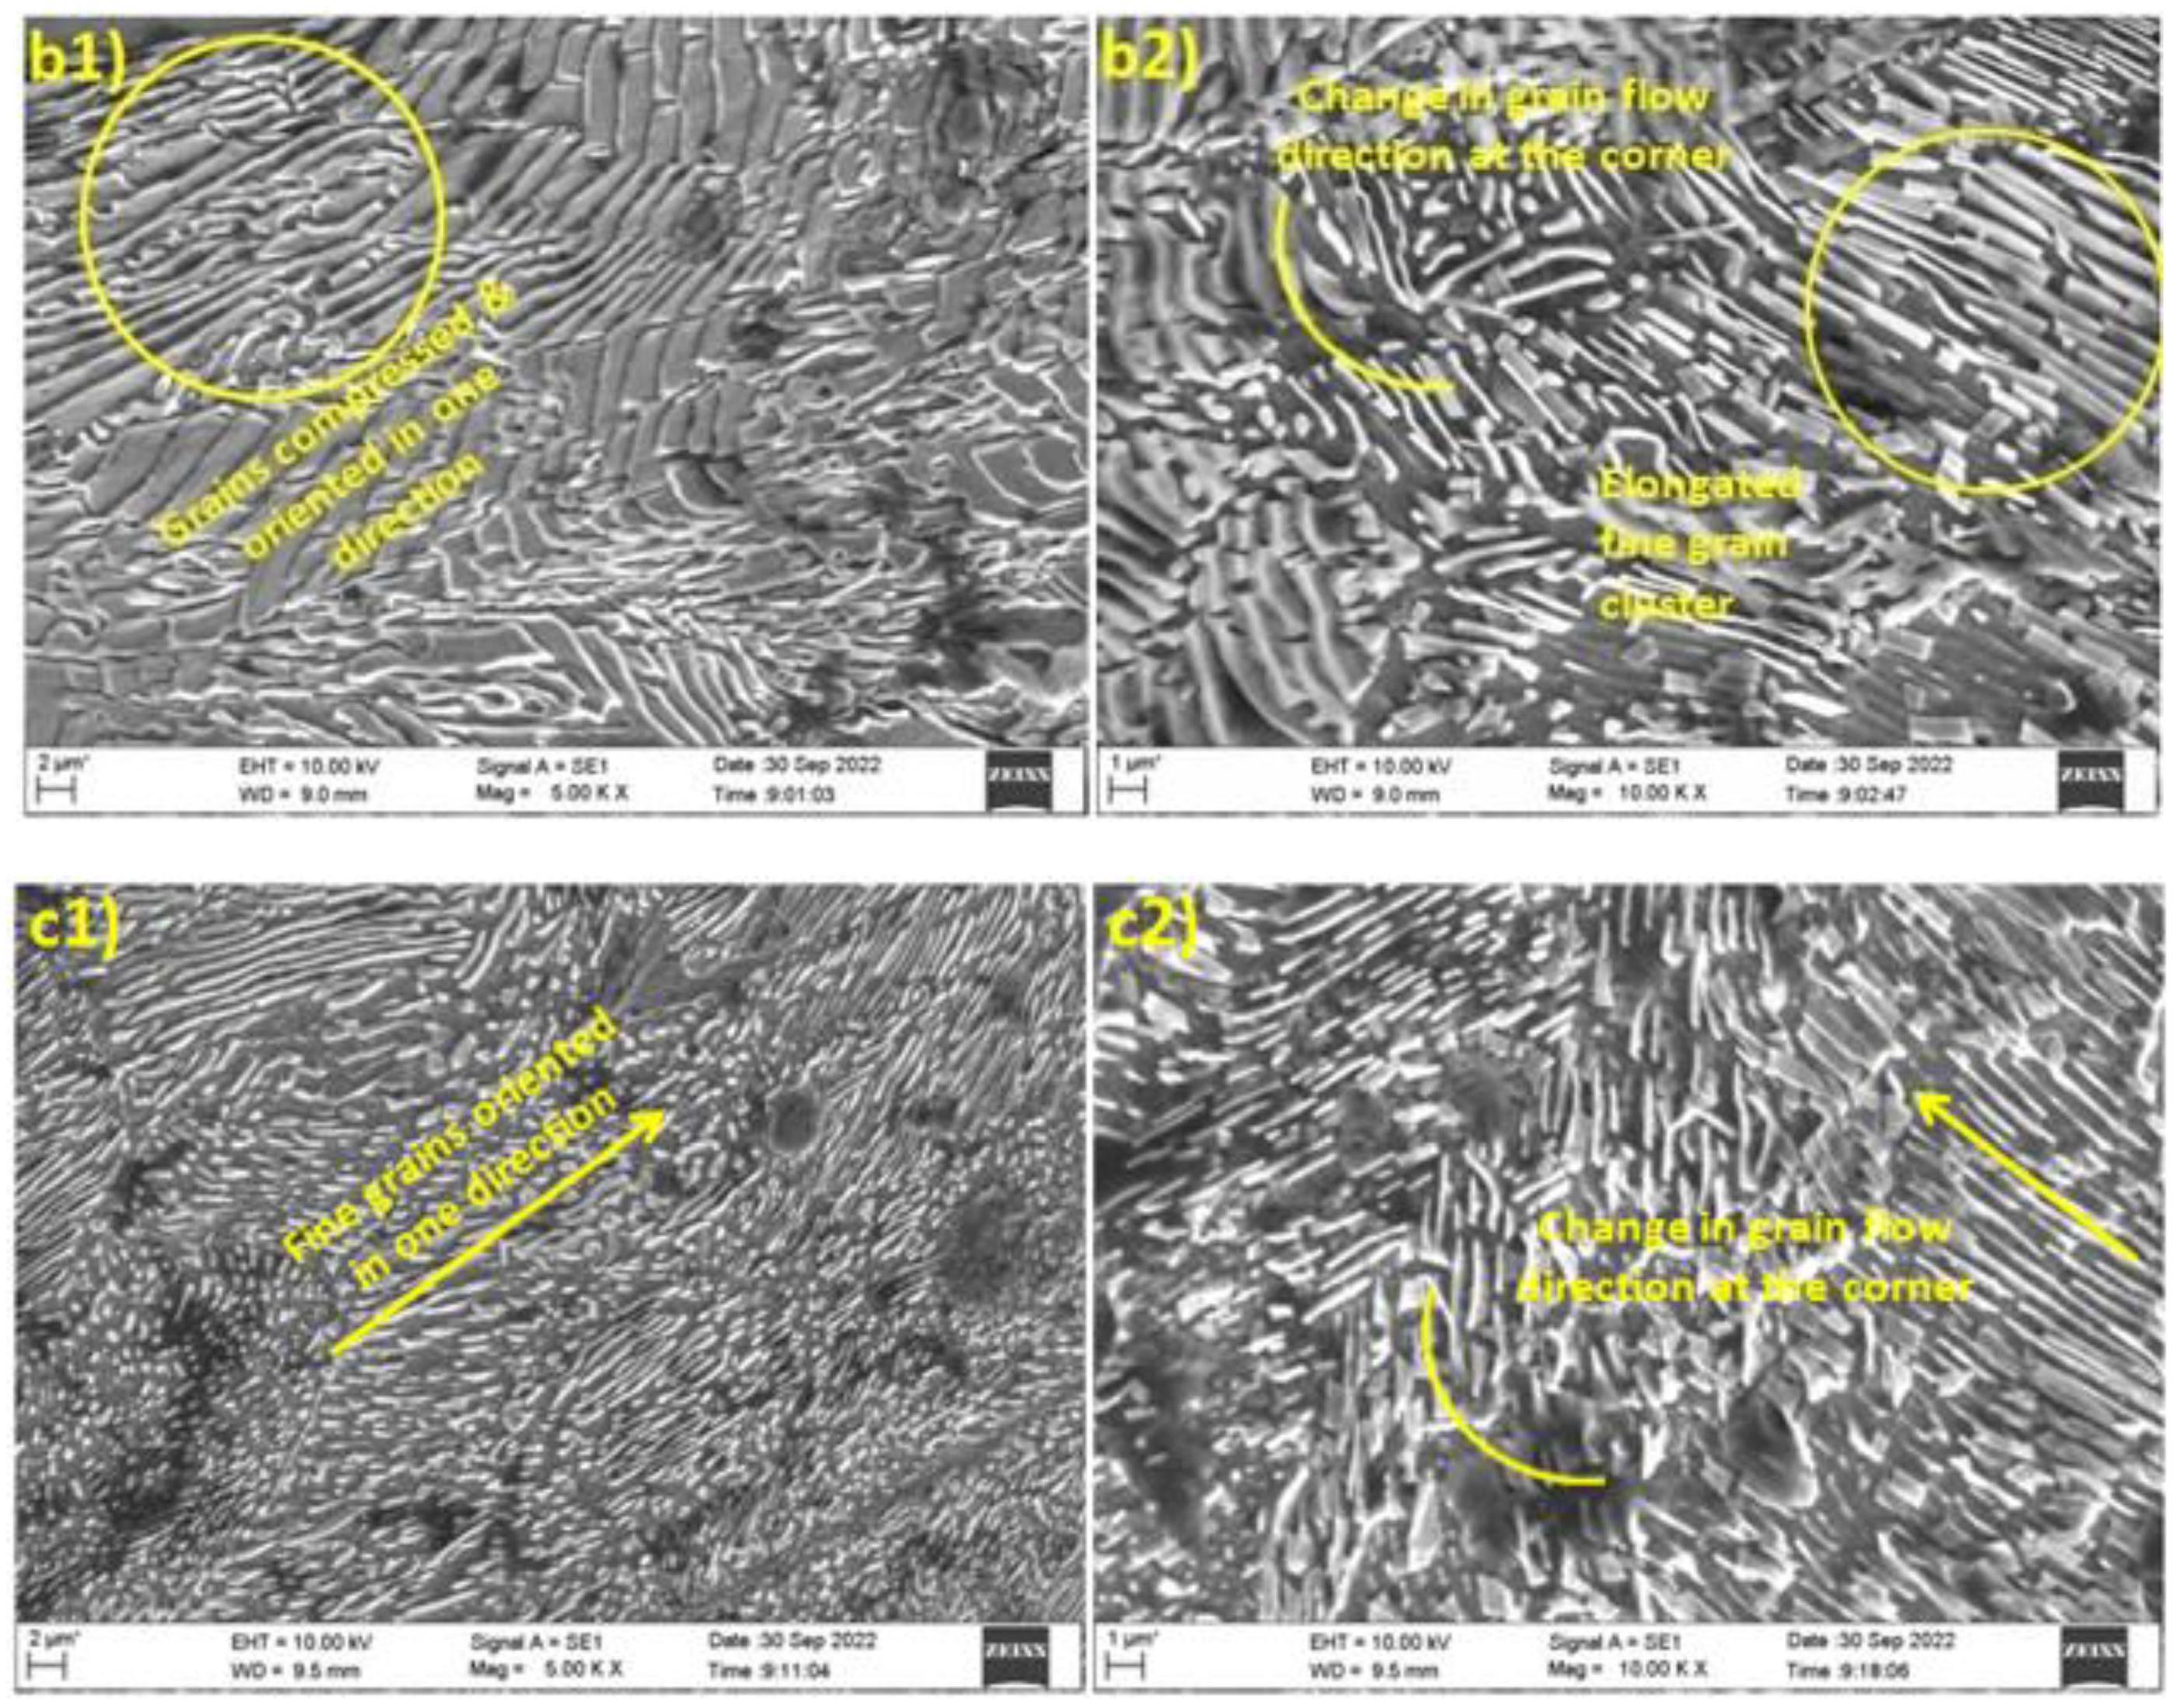
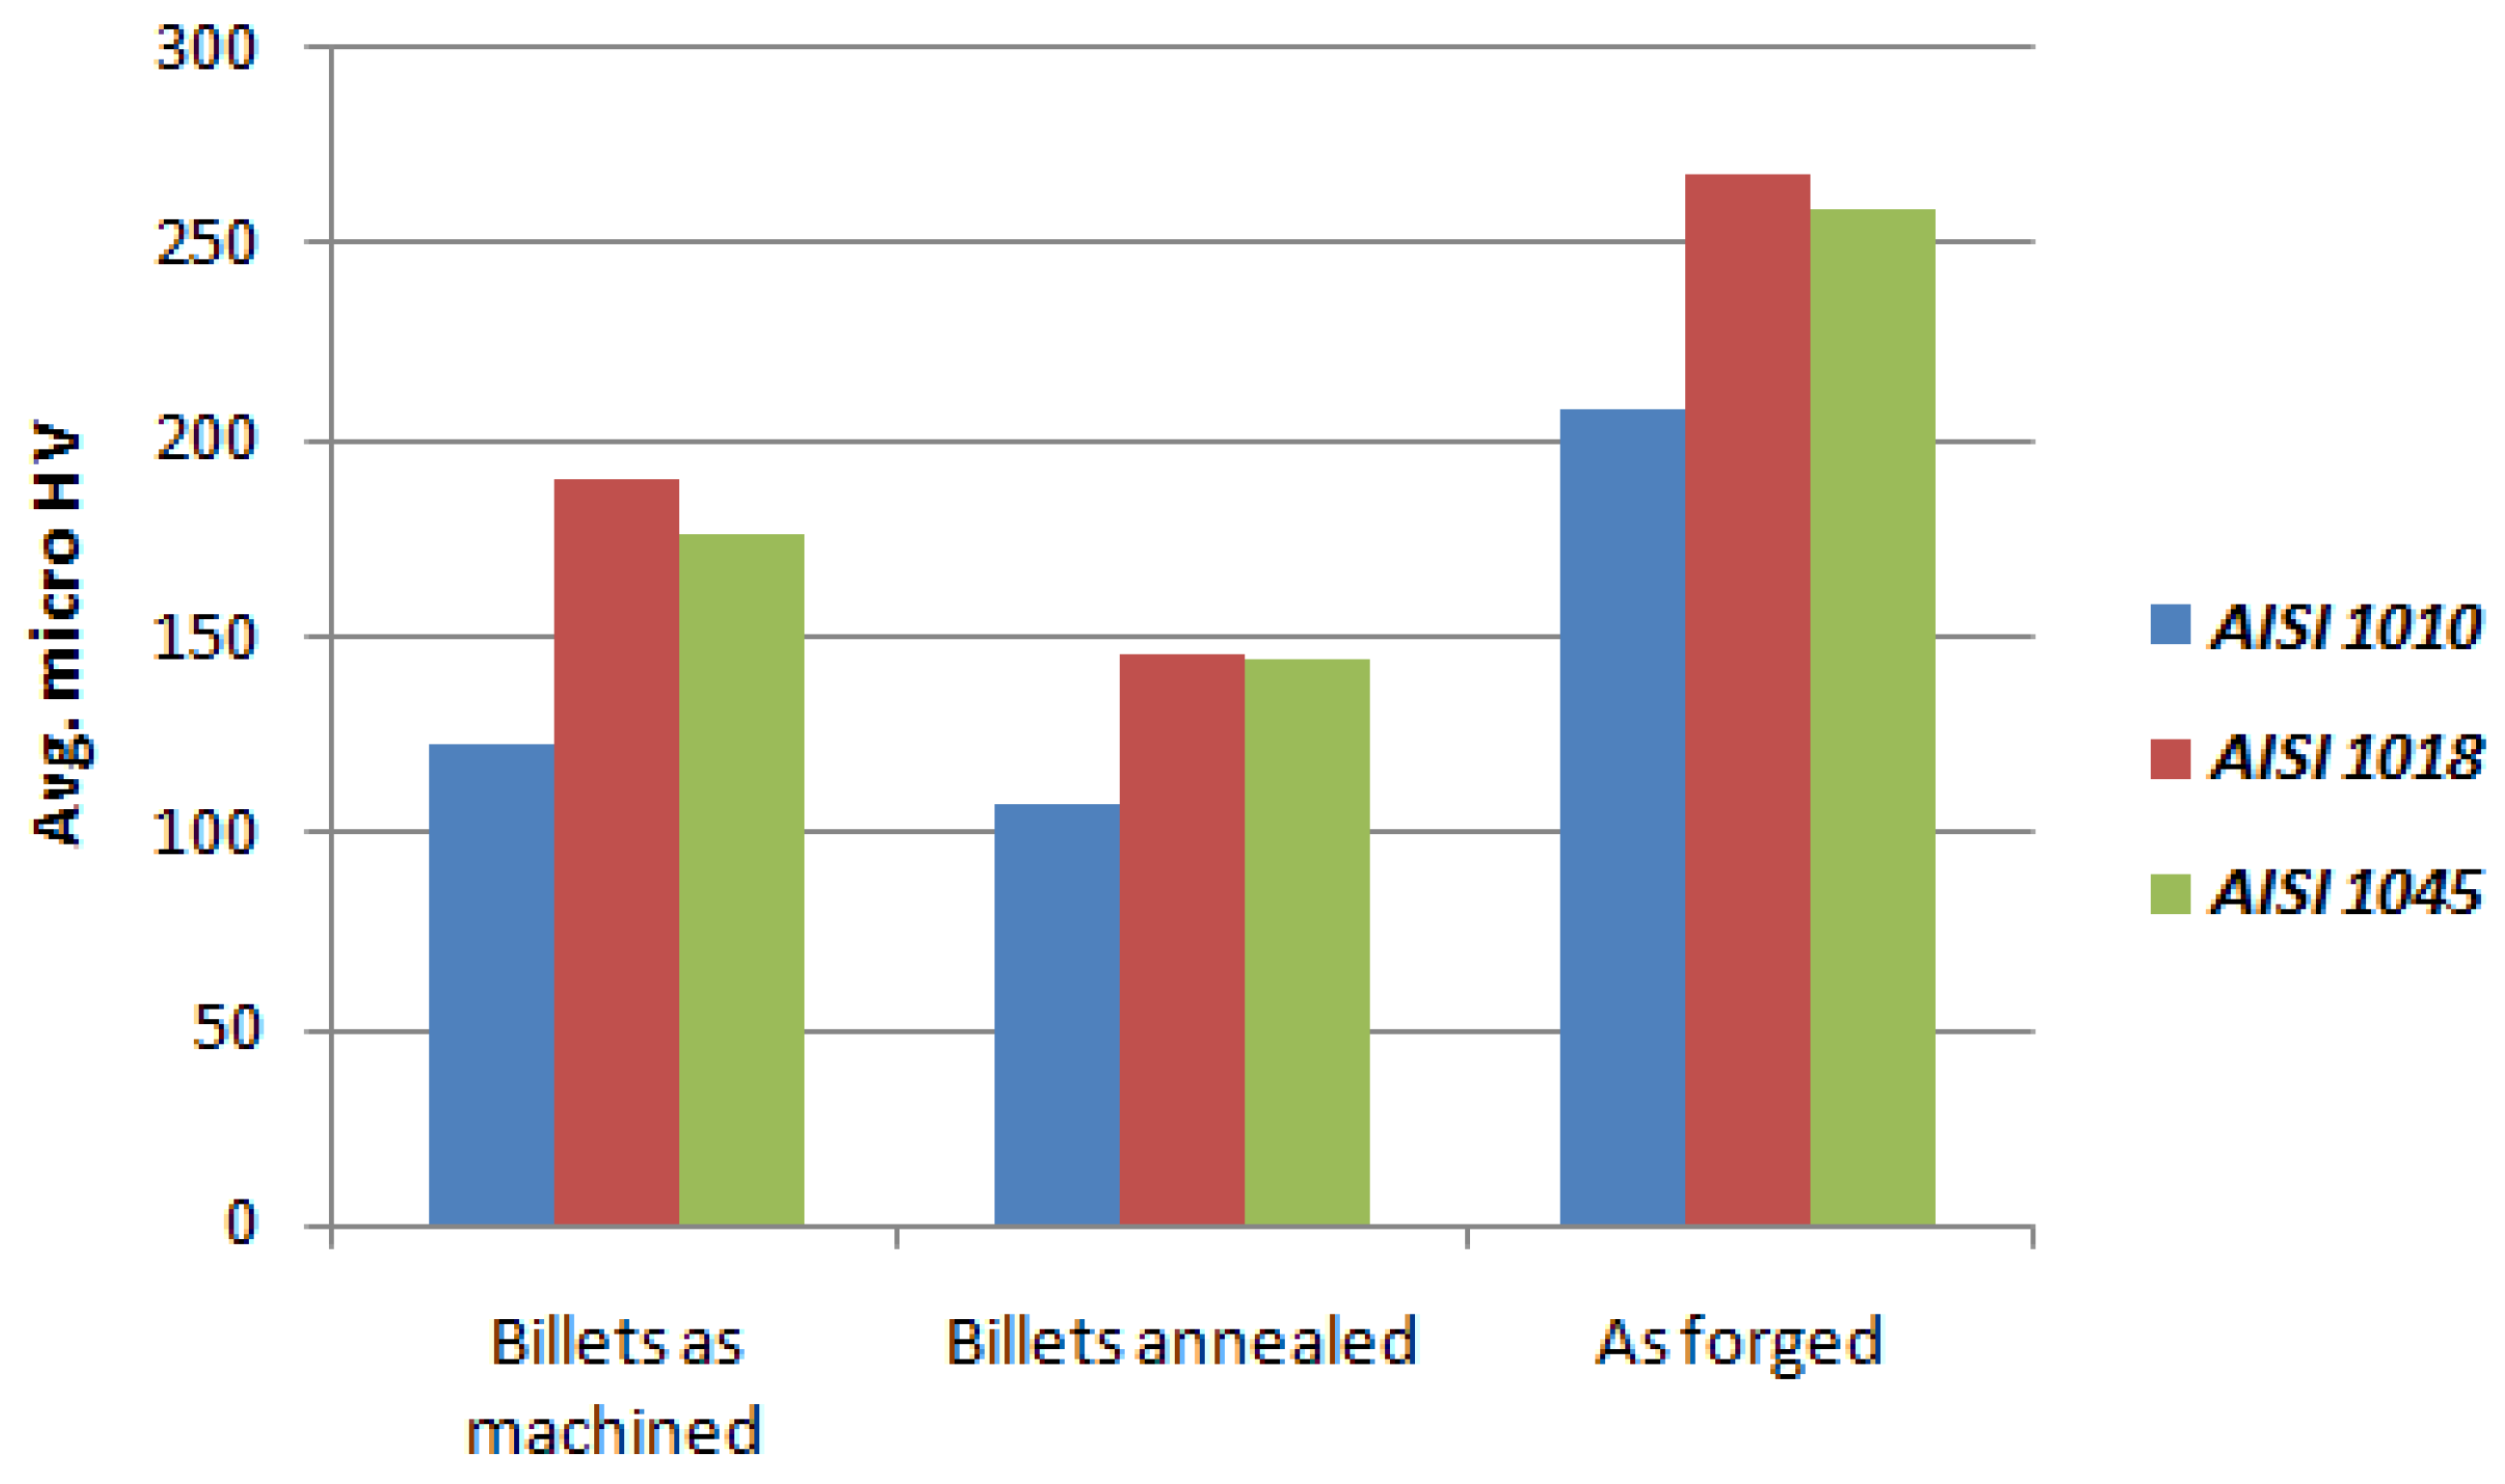
- The cold forging backward extruded components have also been examined for better mechanical soundness, which eventually confirms the appropriateness of the identified variables. The microstructural observations for forged parts split in transverse sections revealed directionally oriented grain refinement. The micro-hardness along the transverse section for the cold forging backward extruded AISI grade steels were analyzed and it was observed that the average micro-hardness value of AISI 1018 was 267 Hv when comparatively higher than AISI 1010 and AISI 1045 steels. However, the cold forging backward extrusion resulted in an overall increase in average hardness and might be attributed to the fact that cold forging backward extrusion complies with the production of superior parts with good strength.
Author Contributions
Funding
Institutional Review Board Statement
Informed Consent Statement
Data Availability Statement
Acknowledgments
Conflicts of Interest
References
- Altan, T.; Ngaile, G.; Shen, G. Cold and Hot Forging: Fundamentals and Applications; ASM International: Almere, The Netherlands, 2004; Volume 1. [Google Scholar]
- Meidert, M.; Hänsel, M. Net shape cold forging to close tolerances under QS 9000 aspects. J. Mater. Process. Technol. 2000, 98, 150–154. [Google Scholar] [CrossRef]
- Marini, D.; Cunningham, D.; Corney, J.R. Near net shape manufacturing of metal: A review of approaches and their evolutions. Proc. Inst. Mech. Eng. Part B J. Eng. Manuf. 2018, 232, 650–669. [Google Scholar] [CrossRef] [Green Version]
- Arreola-Herrera, R.; Cruz-Ramírez, A.; Suárez-Rosales, M.; Sánchez-Álvarado, R.G. The effect of cold forming on structure and properties of 32 CDV 13 steel by radial forging process. Mater. Res. 2014, 17, 445–450. [Google Scholar] [CrossRef] [Green Version]
- Gronostajski, Z.; Hawryluk, M. The main aspects of precision forging. Arch. Civ. Mech. Eng. 2008, 8, 39–55. [Google Scholar] [CrossRef]
- Sun, M.C.; Tzou, G.Y.; Zheng, L.A. Study on multi-stage cold forging of stainless automotive battery fastener. In Applied Mechanics and Materials; Trans Tech Publications Ltd.: Wollerau, Switzerland, 2013; Volume 284, pp. 211–215. [Google Scholar]
- Kosec, B.; Brezigar, M.; Kosec, G.; Bernetic, J.; Bizjak, M. Heat treatment of cold formed steel forgings for the automotive industry. J. Achiev. Mater. Manuf. Eng. 2007, 22, 87–90. [Google Scholar]
- Ku, T.-W.; Kim, L.-H.; Kang, B.-S. Multi-stage cold forging and experimental investigation for the outer race of constant velocity joints. Mater. Des. 2013, 49, 368–385. [Google Scholar] [CrossRef]
- Min, D.-K.; Kim, M.-E. A study on precision cold forging process improvements for the steering yoke of automobiles by the rigid–plastic finite-element method. J. Mater. Process. Technol. 2003, 138, 339–342. [Google Scholar] [CrossRef]
- Khaleed, H.M.T.; Samad, Z.; Othman, A.R.; Mujeebu, M.A.; Arshad, M.R.; Ab-Kadir, A.R.; Hussaini, M.A.; Abdullah, A.B. Finite element analysis and experimental validation of flashless cold forging of propeller hubs and blade of autonomous underwater vehicle. Proc. Inst. Mech. Eng. Part B J. Eng. Manuf. 2010, 224, 1455–1467. [Google Scholar] [CrossRef]
- Yoon, J.; Jeon, H.; Lee, J. Process design of cold forging with thick plate for seat recliner parts. Mater. Des. 2013, 49, 449–455. [Google Scholar] [CrossRef]
- Engel, U.; Groenbaek, J.; Hinsel, C.; Kroiß, T.; Meidert, M.; Neher, R.; Schrader, T. Tooling Solutions for Challenges in Cold Forging; Eder, W.K., Ed.; UTF Science: Bamberg, Germany, 2011. [Google Scholar]
- Vazquez, V.; Hannan, D.; Altan, T. Tool life in cold forging–an example of design improvement to increase service life. J. Mater. Process. Technol. 2000, 98, 90–96. [Google Scholar] [CrossRef]
- Handbook, M. American Society for Metals. In Forming and Forging; ASM International: Novelty, OH, USA, 1996; Volume 14, pp. 1376–1400. [Google Scholar]
- Barišić, B.; Ungureanu, N.; Car, Z. Investigation of Forming Force at Backward Extrusion Process on Different Aluminum Materials. Sci. Bul. Ser. C 2008, 22, 21–27. [Google Scholar]
- Ebara, R.; Takeda, K.; Ishibashi, Y.; Ogura, A.; Kondo, Y.; Hamaya, S. Microfractography in failure analysis of cold forging dies. Eng. Fail. Anal. 2009, 16, 1968–1976. [Google Scholar] [CrossRef]
- MacCormack, C.; Monaghan, J. Failure analysis of cold forging dies using FEA. J. Mater. Process. Technol. 2001, 117, 209–215. [Google Scholar] [CrossRef]
- Yang, D.Y.; Kim, Y.U.; Lee, C.M. Analysis of center-shifted backward extrusion of eccentric tubes using round punches. J. Mater. Process. Technol. 1992, 33, 289–298. [Google Scholar] [CrossRef]
- Mori, T.; Li, S. A new definition of complexity factor of cold forging process. Precis. Eng. 2009, 33, 44–49. [Google Scholar] [CrossRef]
- Kaur, J.; Pabla, B.S.; Dhami, S.S. A review on field areas of research in forging process using FEA. Int. J. Eng. Res. Technol. 2016, 5, 383–393. [Google Scholar]
- Ryu, C.H.; Joun, M.S. Finite element simulation of the cold forging process having a floating die. J. Mater. Process. Technol. 2001, 112, 121–126. [Google Scholar] [CrossRef]
- Khaleed, H.M.T.; Samad, Z.; Othman, A.R.; Mujeebu, M.A.; Abdullah, A.B.; Zihad, M.M. Work-piece optimization and thermal analysis for flash-less cold forging of AUV propeller hubs—FEM simulation and experiment. J. Manufac.-Turing Process. 2011, 13, 41–49. [Google Scholar] [CrossRef]
- Jun, B.Y.; Kang, S.M.; Lee, M.C.; Park, R.H.; Joun, M.S. Prediction of geometric dimensions for cold forgings using the finite element method. J. Mater. Process. Technol. 2007, 189, 459–465. [Google Scholar] [CrossRef]
- Sedighi, M.; Hadi, M.; Kolahdouz, S. Optimization of Preform in Close Die Forging by Combination of Neural Network and Genetic Algorithm 1. World Appl. Sci. J. 2009, 7, 1464–1473. [Google Scholar]
- Ciancio, C.; Citrea, T.; Ambrogio, G.; Filice, L.; Musmanno, R. Design of a high performance predictive tool for forging operation. Procedia CIRP 2015, 33, 173–178. [Google Scholar] [CrossRef] [Green Version]
- Ku, T.W. A study on two-stage cold forging for a drive shaft with internal spline and spur gear geometries. Metals 2018, 8, 953. [Google Scholar] [CrossRef] [Green Version]
- Ku, T.-W. A Combined Cold Extrusion for a Drive Shaft: A Parametric Study on Tool Geometry. Materials 2020, 13, 2244. [Google Scholar] [CrossRef] [PubMed]
- Bringas, J.E. Handbook of Comparative World Steel Standards, 3rd ed.; ASTM International: West Conshohocken, PA, USA, 2004. [Google Scholar]
- Petkar, P.M.; Gaitonde, V.N.; Karnik, S.R.; Kulkarni, V.N.; Raju, T.K.G.; Davim, J.P. Analysis of Forming Behavior in Cold Forging of AISI 1010 Steel Using Artificial Neural Network. Metals 2020, 10, 1431. [Google Scholar] [CrossRef]
- Montgomery, D.C. Design and Analysis of Experiments; John Wiley & Sons. Inc.: New York, NY, USA, 1997; pp. 200–201. [Google Scholar]
- Planchard, D. SOLIDWORKS, Tutorial with Video Instruction; SDC Publications: Mission, KS, USA, 2018. [Google Scholar]
- Joun, M. Recent Advances in Metal Forming Simulation Technology for Automobile Parts by AFDEX. IOP Conf. Ser. Mater. Sci. Eng. 2020, 834, 012016. [Google Scholar] [CrossRef]
- Schalko, R.B. Artificial Neural Networks; McGraw-Hill: Singapore, 1997. [Google Scholar]
- MATLAB. MATLAB NN Toolbox; Math Works Incorporation: Natick, MA, USA, 2016. [Google Scholar]
- Ahmad, M.F.; Isa, N.A.M.; Lim, W.H.; Ang, K.M. Differential evolution: A recent review based on state-of-the-art works. Alex. Eng. J. 2021, 61, 3831–3872. [Google Scholar] [CrossRef]
- Kulkarni, V.N.; Gaitonde, V.N.; Karnik, S.R.; Manjaiah, M.; Davim, J.P. Machinability analysis and optimization in wire EDM of medical grade NiTiNOL memory alloy. Materials 2020, 13, 2184. [Google Scholar] [CrossRef]
- Kroiß, T.; Engel, U.; Merklein, M. Comprehensive approach for process modeling and optimization in cold forging considering interactions between process, tool and press. J. Mater. Process. Technol. 2013, 213, 1118–1127. [Google Scholar] [CrossRef]
- Krušič, V.; Arentoft, M.; Mašera, S.; Pristovšek, A.; Rodič, T. A combined approach to determine workpiece-tool-press deflections and tool loads in multistage cold-forging. J. Mater. Process. Technol. 2011, 211, 35–42. [Google Scholar] [CrossRef]
- Miłek, T. The analysis of distributions of effective strain and flow stress in longitudinal sections of cold backward extruded copper cans for different punch-face shapes. ITM Web Conf. 2017, 15, 07014. [Google Scholar] [CrossRef] [Green Version]
- Dipper, M. Das Fließpressen von Hülsen in Rechnung und Versuch. Arch. Eisenhüttenwes. 1949, 20, 275–286. [Google Scholar] [CrossRef]
- Sillekens, W.H. Backward Can Extrusion and Materials Behavior; Technische Universiteit Eindhoven: Eindhoven, The Netherlands, 1992. [Google Scholar]


| Chemical Composition-Specifications as per BS 970-1955, (Inspected % Weight) | ||||
| Elements | AISI 1010 | AISI 1018 | AISI 1045 | |
| C | 0.08–0.13 (0.008) | 0.15–0.20 (0.180) | 0.43–0.45 (0.410) | |
| Si | 0.15–0.35 (0.195) | <0.300 (0.190) | <0.300 (0.300) | |
| Mn | 0.30–0.60 (0.545) | 0.60–0.90 (0.690) | 0.60–0.90 (0.710) | |
| P | 0.04 Max. (0.013) | 0.04 Max. (0.022) | 0.04 Max. (0.025) | |
| S | 0.05 Max. (0.003) | 0.05 Max. (0.09) | 0.05 Max. (0.006) | |
| Mechanical Properties | ||||
| Tensile strength (MPa) Yield (Ultimate) | 180 (325) | 220 (410) | 310 (565) | |
| Hardness Vickers (Brinell no.) | 105 (108) | 131 (126) | 170 (163) | |
| Reduction area (%) | 50 | 40 | 40 | |
| Elongation (%) | 28 | 25 | 17 | |
| Elastic modulus (GPa) | 200 | 200 | 200 | |
| Bulk modulus (GPa) | 140 | 140 | 140 | |
| Shear modulus (GPa) | 80 | 80 | 80 | |
| Geometrical Attribute | Designation and Unit | Levels | |||
|---|---|---|---|---|---|
| I | II | III | IV | ||
| Billet size ratio | z- | 0.3 | 0.6 | 0.9 | 1.2 |
| Reduction ratio | r- | 0.3 | 0.4 | 0.5 | 0.6 |
| Punch angle | a-deg | 160 | 163 | 167 | 170 |
| Land height | h-mm | 2.0 | 2.7 | 3.3 | 4.0 |
| Particulars | Multi-Layer Feed Forward ANN Model | ||
|---|---|---|---|
| AISI 1010 | AISI 1018 | AISI 1045 | |
| Number of input and output variables | 4, 4 | 4, 4 | 4, 4 |
| Number of neurons in 1st hidden layer | 8 | 8 | 8 |
| Number of neurons in 2nd hidden layer | 6 | 6 | 12 |
| Learning rate (α) | 0.1 | 0.1 | 0.1 |
| Momentum constant (β) | 0.9 | 0.9 | 0.9 |
| Learning rate increment | 1.05 | 1.05 | 1.05 |
| Maximum number of epochs | 2500 | 2500 | 2500 |
| Particulars | MSE at the End of 2500 Epochs |
|---|---|
| AISI 1010 model | 0.00804 |
| AISI 1018 model | 0.00679 |
| AISI 1045 model | 0.00847 |
| Sl. No. | Reduction Ratio (r) | Billet Size Ratio (z) | Punch Diameter (d-mm) | Billet Size (mm) | Punch Angle (a-deg) | Land Height (h-mm) |
|---|---|---|---|---|---|---|
| 1 | 0.3 | 0.5 | 25 | Ø30 × 15 | 170 | 2.0 |
| 2 | 0.3 | 0.7 | 25 | Ø30 × 21 | 170 | 2.0 |
| 3 | 0.4 | 0.5 | 23 | Ø30 × 15 | 170 | 4.0 |
| 4 | 0.4 | 0.8 | 23 | Ø30 × 24 | 170 | 2.6 |
| 5 | 0.5 | 0.5 | 21 | Ø30 × 15 | 160 | 4.0 |
| 6 | 0.5 | 0.7 | 21 | Ø30 × 21 | 160 | 4.0 |
| 7 | 0.6 | 0.5 | 19 | Ø30 × 15 | 160 | 4.0 |
| 8 | 0.6 | 0.7 | 19 | Ø30 × 21 | 160 | 4.0 |
| Maximum Absolute Prediction Error (%) | ||||||||||||
|---|---|---|---|---|---|---|---|---|---|---|---|---|
| AISI 1010 | AISI 1018 | AISI 1045 | ||||||||||
| seff. | Єeff. | Єrate. | F | seff. | Єeff. | Єrate. | F | seff. | Єeff. | Єrate. | F | |
| Training patterns (226) | 2.22 | 9.98 | 30.15 | 8.53 | 1.89 | 10.81 | 29.08 | 6.18 | 5.24 | 11.99 | 29.16 | 7.75 |
| Testing patterns (30) | 3.30 | 13.72 | 29.05 | 5.36 | 11.42 | 8.88 | 24.09 | 4.88 | 1.05 | 8.94 | 27.16 | 4.94 |
Disclaimer/Publisher’s Note: The statements, opinions and data contained in all publications are solely those of the individual author(s) and contributor(s) and not of MDPI and/or the editor(s). MDPI and/or the editor(s) disclaim responsibility for any injury to people or property resulting from any ideas, methods, instructions or products referred to in the content. |
© 2023 by the authors. Licensee MDPI, Basel, Switzerland. This article is an open access article distributed under the terms and conditions of the Creative Commons Attribution (CC BY) license (https://creativecommons.org/licenses/by/4.0/).
Share and Cite
Petkar, P.M.; Gaitonde, V.N.; Kulkarni, V.N.; Karnik, R.S.; Davim, J.P. A Comparative Study in Forming Behavior of Different Grades of Steel in Cold Forging Backward Extrusion by Integrating Artificial Neural Network (ANN) with Differential Evolution (DE) Algorithm. Appl. Sci. 2023, 13, 1276. https://doi.org/10.3390/app13031276
Petkar PM, Gaitonde VN, Kulkarni VN, Karnik RS, Davim JP. A Comparative Study in Forming Behavior of Different Grades of Steel in Cold Forging Backward Extrusion by Integrating Artificial Neural Network (ANN) with Differential Evolution (DE) Algorithm. Applied Sciences. 2023; 13(3):1276. https://doi.org/10.3390/app13031276
Chicago/Turabian StylePetkar, Praveenkumar M., Vinayak N. Gaitonde, Vinayak N. Kulkarni, Ramesh S. Karnik, and João Paulo Davim. 2023. "A Comparative Study in Forming Behavior of Different Grades of Steel in Cold Forging Backward Extrusion by Integrating Artificial Neural Network (ANN) with Differential Evolution (DE) Algorithm" Applied Sciences 13, no. 3: 1276. https://doi.org/10.3390/app13031276