Article

Performance Comparison of Deep Learning Models for Damage Identification of Aging Bridges

1
Department of Future and Smart Construction Research, Korea Institute of Civil Engineering and Building Technology (KICT), Goyang-si 10223, Gyeonggi-do, Republic of Korea
2
Department of Multimedia Contents, Jangan University, Hwaseong-si 13557, Gyeonggi-do, Republic of Korea
*
Author to whom correspondence should be addressed.
Appl. Sci. 2023, 13(24), 13204; https://doi.org/10.3390/app132413204
Submission received: 13 November 2023 / Revised: 7 December 2023 / Accepted: 9 December 2023 / Published: 12 December 2023
(This article belongs to the Topic AI Enhanced Civil Infrastructure Safety)

Abstract

:
Currently, damage in aging bridges is assessed visually, leading to significant personnel, time, and cost expenditures. Moreover, the results depend on the subjective judgment of the inspector. Machine-learning-based approaches, such as deep learning, can solve these problems. In particular, instance-segmentation models have been used to identify different types of bridge damage. However, the value of deep-learning-based damage identification may be reduced by insufficient training data, class imbalance, and model-reliability issues. To overcome these limitations, this study utilized photographic data from real bridge-management systems for the inspection and assessment of bridges as the training dataset. Six types of damage were considered. Moreover, the performances of three representative deep learning models—Mask R-CNN, BlendMask, and SWIN—were compared in terms of loss–function values. SWIN showed the best performance, achieving a loss value of 0.000005 after 269,939 training iterations. This shows that bridge-damage-identification performance can be maximized by setting an appropriate learning rate and using a deep learning model with a minimal loss value.

1. Introduction

1.1. Research Background

Bridges sustain structural damage and undergo wear and tear over time. Consequently, their strength and stability deteriorate, increasing the risk of accidents. As bridges are major road facilities used over a long period, extending their service life through proper management and maintenance is essential. Restricting traffic on an aging bridge (or closing the bridge entirely) because of safety concerns may have a significant and adverse societal and economic impact. Hence, mandatory periodic inspections and maintenance activities are conducted consistently. However, the current method of doing this, which relies on on-site inspection by human workers, has several drawbacks. First, there is a shortage of inspectors. Most bridges are large and complex; hence, field inspection and diagnosis require significant investments of personnel and time. If the number of qualified professionals available is limited or insufficient, it can be difficult to inspect all bridges accurately. Second, the method is fundamentally subjective. Because different inspectors may assess the condition of a given bridge differently, based on their experience and knowledge, the results may be inconsistent. Third, as bridges are frequently located in remote places, conducting personnel-based on-site inspections is time-consuming and expensive. Lastly, structural defects in aging bridges often occur in very hard-to-access areas of the bridge. The risky work environment during on-site inspections means that the safety of the inspectors is a major issue. For all these reasons, there is a growing demand for methods that utilize new technologies to inspect aging bridges.
For example, a system that can remotely monitor the condition of bridges using sensors and Internet-of-Things (IoT) technologies for the analysis of data and the detection of anomalies in real time can assist in providing accurate information and building early warning systems [1]. IoT refers to the technology and concept where everyday objects around us are connected to each other through the Internet and exchange information. Non-destructive examination technologies, such as ultrasound and X-rays, can quickly check for internal defects and damage within structures without causing further damage themselves; moreover, they enable precise analysis of data and prediction of defects [2]. Research is also underway that proposes a defect recognition model to recognize four typical defects of phased-array ultrasonic testing (PA-UT) images for electrofusion (EF) joints [3]. If big data and artificial intelligence (AI) technologies are used, it is possible to identify patterns and trends from large datasets and establish preventive maintenance plans [4,5,6]. In a study that analyzed and verified images acquired with ground-penetrating radar (GPR) to determine the location of underground utilities (UU) with an end-to-end deep learning model based on a core-regression model, it was possible to optimize parameters [7]. Drones and robot-based systems can inspect and evaluate the condition of structures, even in low or hard-to-access areas. Drones capture photos and image data from the air, which are then used to assess the overall condition of structures; robots can enter narrow or hazardous areas to perform detailed defect detection and take appropriate corrective measures [8].
Studies are presently underway to identify and quantify bridge damage by analyzing image data captured by drones or by on-site inspectors [9]. Similar studies are being conducted in various fields; the goal is to identify the damage automatically and calculate its extent through the analysis of inspection images. Image-based crack detection and classification is an especially important research topic. Many studies have focused on methods to learn and detect crack patterns using convolutional neural networks (CNNs), which are a type of deep learning algorithm [10,11]. Research is also being conducted to quantify the size and area of defects using image processing and computer vision technology; this can not only enable accurate calculation of the extent of damage but also analyze trends. Further, efforts are being made to utilize images for three-dimensional modeling of facilities and the detection of deformations in them; changes in the shape of structures and the extent of deformations can be tracked and assessed in this way. Comprehensive assessments of damage by combining visible-wavelength image data with sensor data for other wavelengths (e.g., radar and infrared) can yield more accurate and comprehensive results. In recent years, identifying and predicting facility damage using AI technologies, especially algorithms such as deep learning and reinforcement learning, has become a highly active field of research.
However, the use of deep learning technology is not without problems. Performance varies depending on the training images, and classification can be challenging when the features of the target classes are limited or indistinct. For example, when classifying types of bridge damage such as efflorescence, corrosion, cracks, concrete scaling, and concrete spalling, deep learning may exhibit good performance in distinguishing efflorescence, which appears as a white powdery residue on bridges, from other damage types. However, it may have more difficulty differentiating among cracks, concrete scaling, and spalling, which are all similar in appearance.
Another problem is that previous studies have predominantly focused on cracks, the most common type of damage in concrete structures. This has resulted in a scarcity of training data for other types of bridge damage, such as water leaks, efflorescence, concrete scaling, concrete spalling, and corrosion of reinforcing steel. The nature of deep learning technology dictates that classification accuracy improves with an increase in training data [12].

1.2. Scope and Methods of Research

In this study, we apply three representative deep learning models—Mask R-CNN, BlendMask, and SWIN—that can automatically identify six typical types of damage found in aging bridges: cracks, water leaks, efflorescence, concrete scaling, concrete spalling, and corrosion of reinforcing steel. We analyze the performance of these models by comparing the loss values when training each model individually. The loss value measures the difference between the predicted results and the actual ground truth during the training process. It evaluates how accurately the model segments objects and identifies instances. Commonly used loss–functions include pixel-wise cross-entropy loss and dice loss, which are determined by calculating the pixel-level agreement between the predicted and actual masks. This value typically ranges between 0 and 1, with a lower value indicating better performance. To minimize the loss value, the model is updated to decrease the difference between the predicted mask based on the training data and the actual mask. Through this process, the model learns to accurately segment object boundaries and internal regions, training on features that allow the distinction of individual object instances. The loss value mainly distinguishes between the background and foreground (objects), taking into account classification accuracy and pixel-level agreement for both regions. Moreover, weight adjustments for overlapping areas can be incorporated to address overlaps between adjacent objects. In conclusion, the loss value in an instance-segmentation model is important for evaluating and optimizing the model’s performance. By minimizing this value, we can increase the model’s ability to segment and recognize objects with high accuracy and detail.
The paper is organized as follows: Section 2 introduces studies relevant to this paper; Section 3 describes the proposed technology; Section 4 explains the experimental results and evaluates the performance of the proposed technology; and Section 5 presents the conclusions.

2. Related Works

2.1. Bridge-Damage Identification Using Deep Learning

One previous study that attempted to develop an automated bridge-inspection system proposed using an unmanned aerial vehicle for bridge inspections and applying deep learning algorithms to the results [13]. Another study used deep learning to detect cracks in concrete structures used CNNs to develop a model for detecting damage in bridge structures, achieving high performance in identifying damaged areas from images of entire bridges [14,15]. Bukhsh et al. demonstrated that transfer learning could improve bridge-damage-detection models, even with a limited dataset [16]. They proposed a real-time bridge-damage-detection system using deep learning, employing Faster R-CNN to detect damage in bridge images and evaluate structural integrity instantly. Recent studies have also explored using generative adversarial networks for image generation and data augmentation to detect the extent of actual structural damage more accurately [17].
In addition, research focused on automatic crack detection in concrete using CNNs has led to the development of a deep learning-based method for detecting road defects from ground-penetrating radar images [18]. Avci et al. have discussed a method for identifying structural bridge damage utilizing deep learning with frequency-response-function data [19]. Another proposed model, CrackNet, is a deep learning-based approach for crack detection in structural materials that has produced high-accuracy results for various crack types and defects [20].

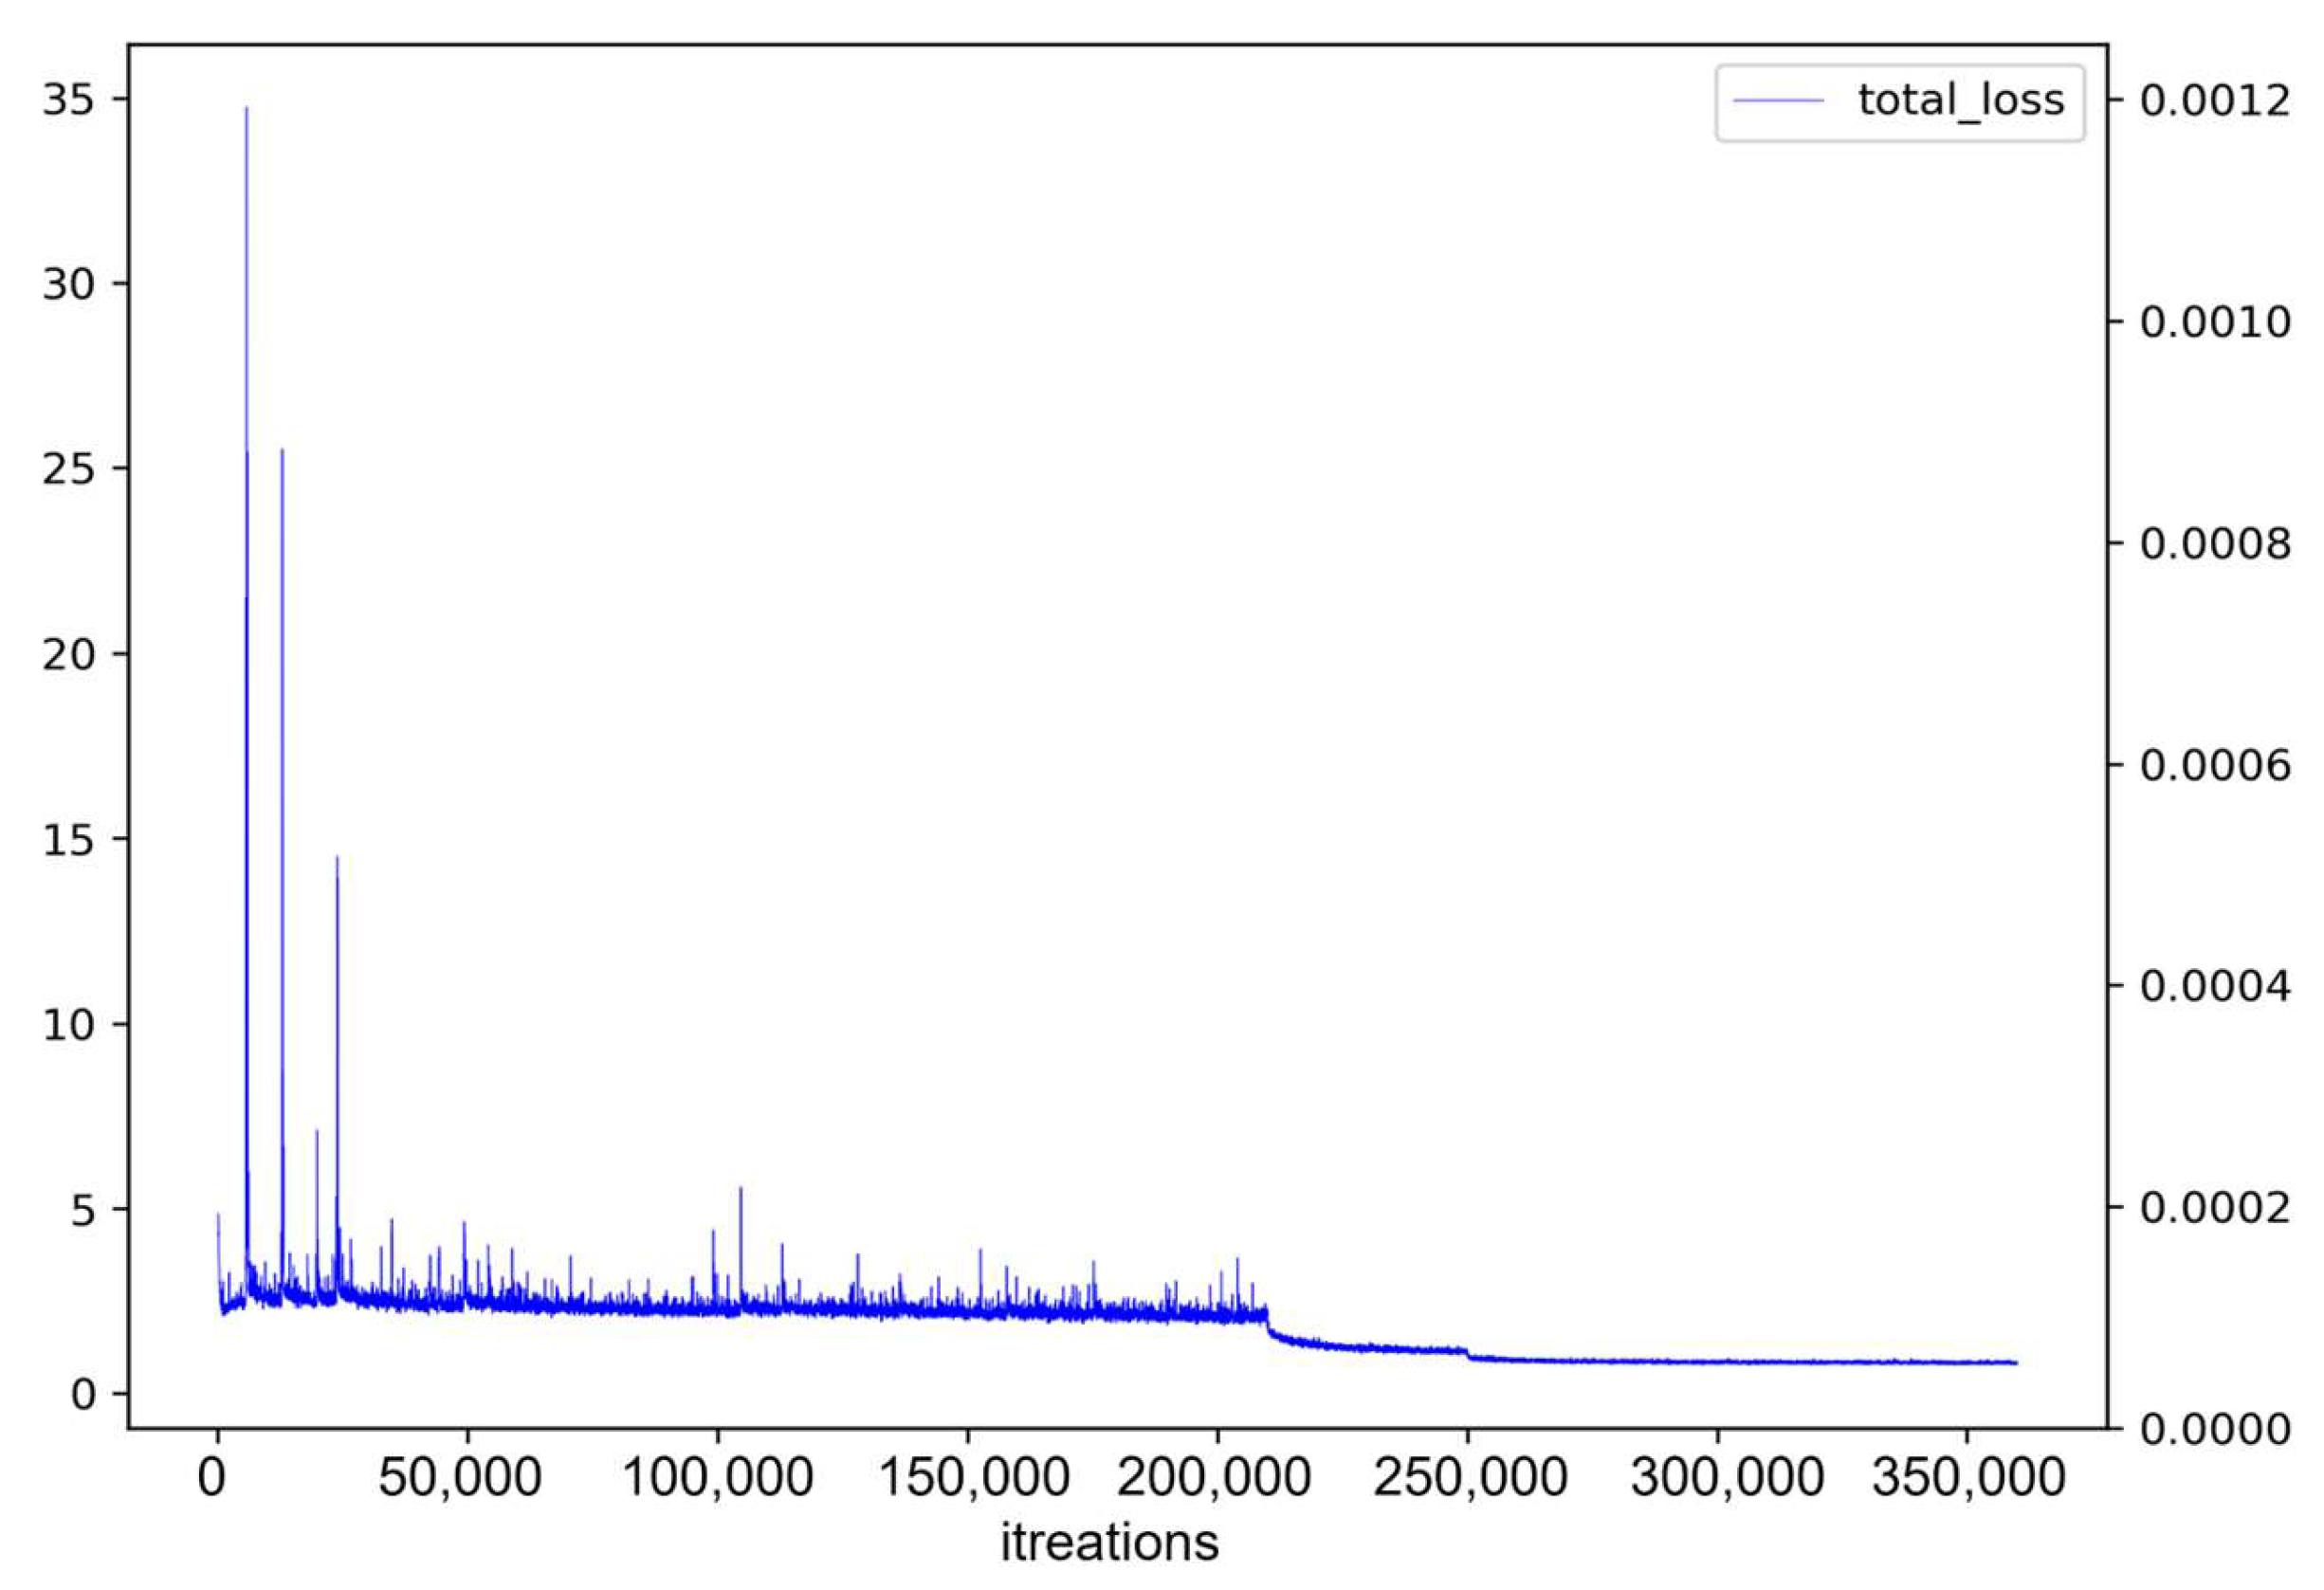
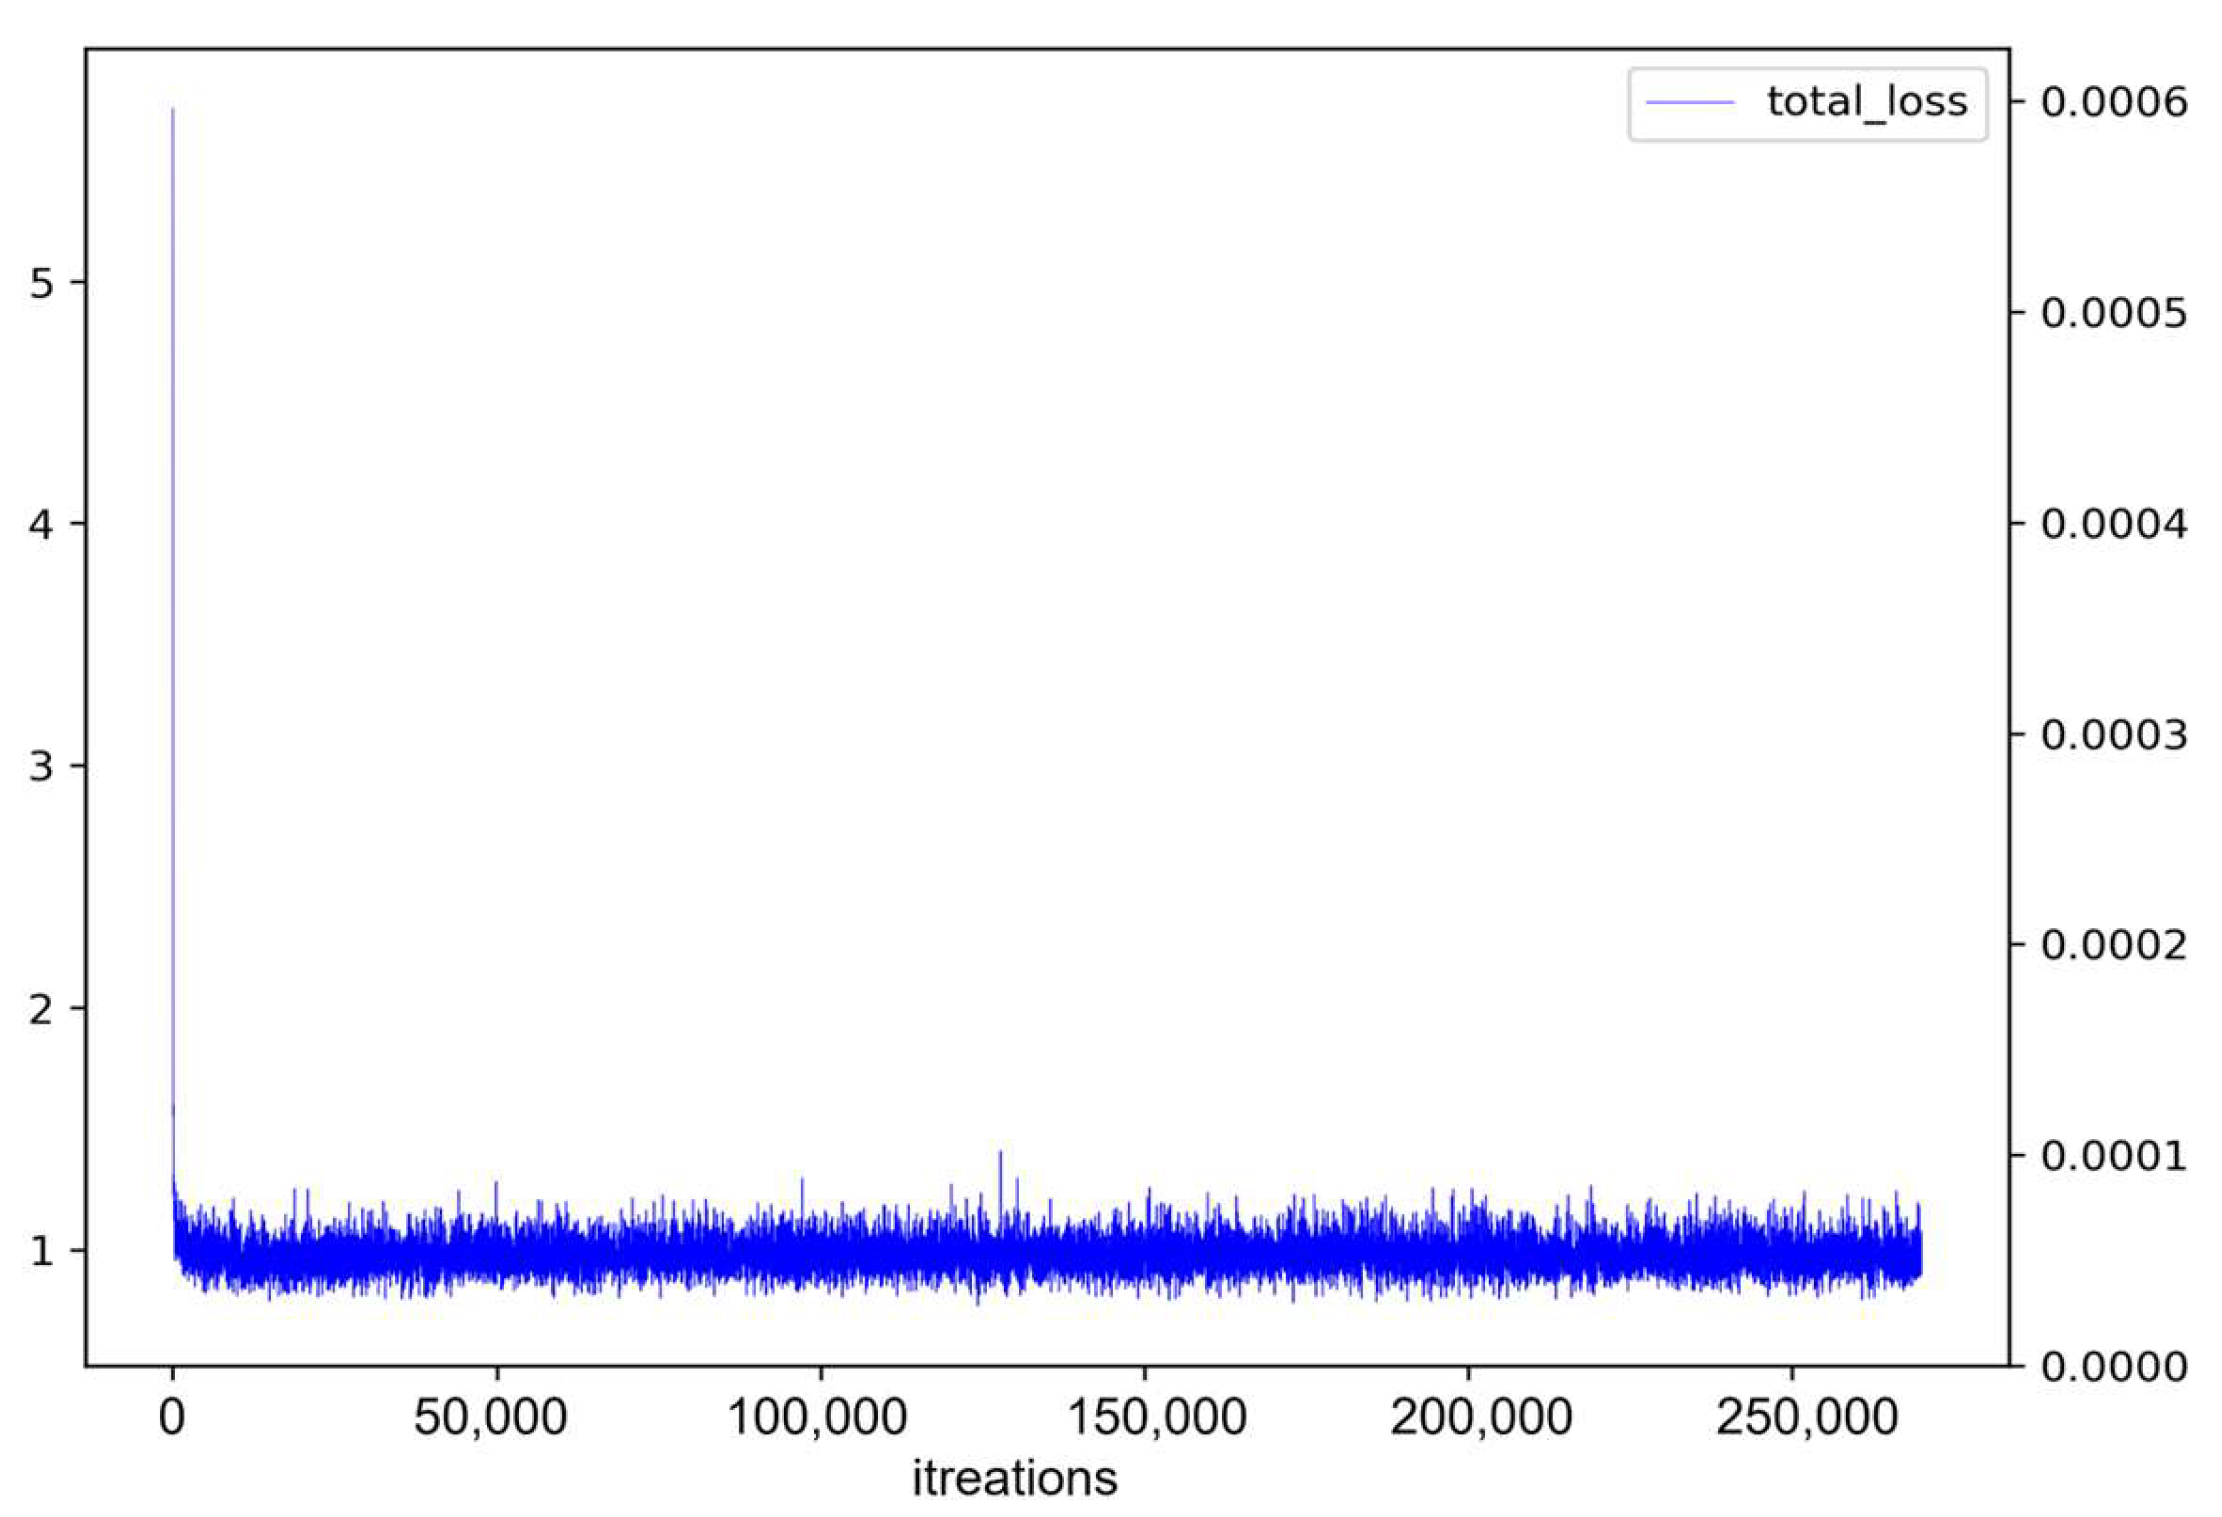
2.2. Loss Values of Deep Learning Models

Attempts to reduce the loss values of deep learning models have been conducted in various fields. First, one study has been conducted on normalization techniques, which control the complexity of the model and enhance its generalization performance [21]. Both batch normalization and layer normalization can improve the stability and learning speed of neural networks, contributing to a reduction in loss values. In addition, data augmentation—a technique that artificially transforms training data to increase diversity—is used. By applying transformations such as rotation, translation, and scaling, the training dataset is expanded to improve the model’s generalization performance. Regularization alleviates overfitting by imposing penalties on model complexity [22]. Methods such as L1 and L2 regularization and dropout are used to constrain the network’s weights or reduce overfitting by randomly deactivating some units. It is also crucial to set the initial weights to facilitate efficient learning and exploration of optimal solutions, aiding in loss value reduction. Optimizer algorithms, used when updating the model’s parameters, leverage gradient–descent methods to minimize loss values. Adam and RMSprop are widely used optimizers because of their efficiency in updating parameters. The architecture of the neural network itself also affects the reduction of loss values. Innovative designs, such as CNNs, residual connections, and attention mechanisms, have generated considerable attention. In the present study, we aim to compare the performance of three models with different neural network architectures by comparing their loss values.

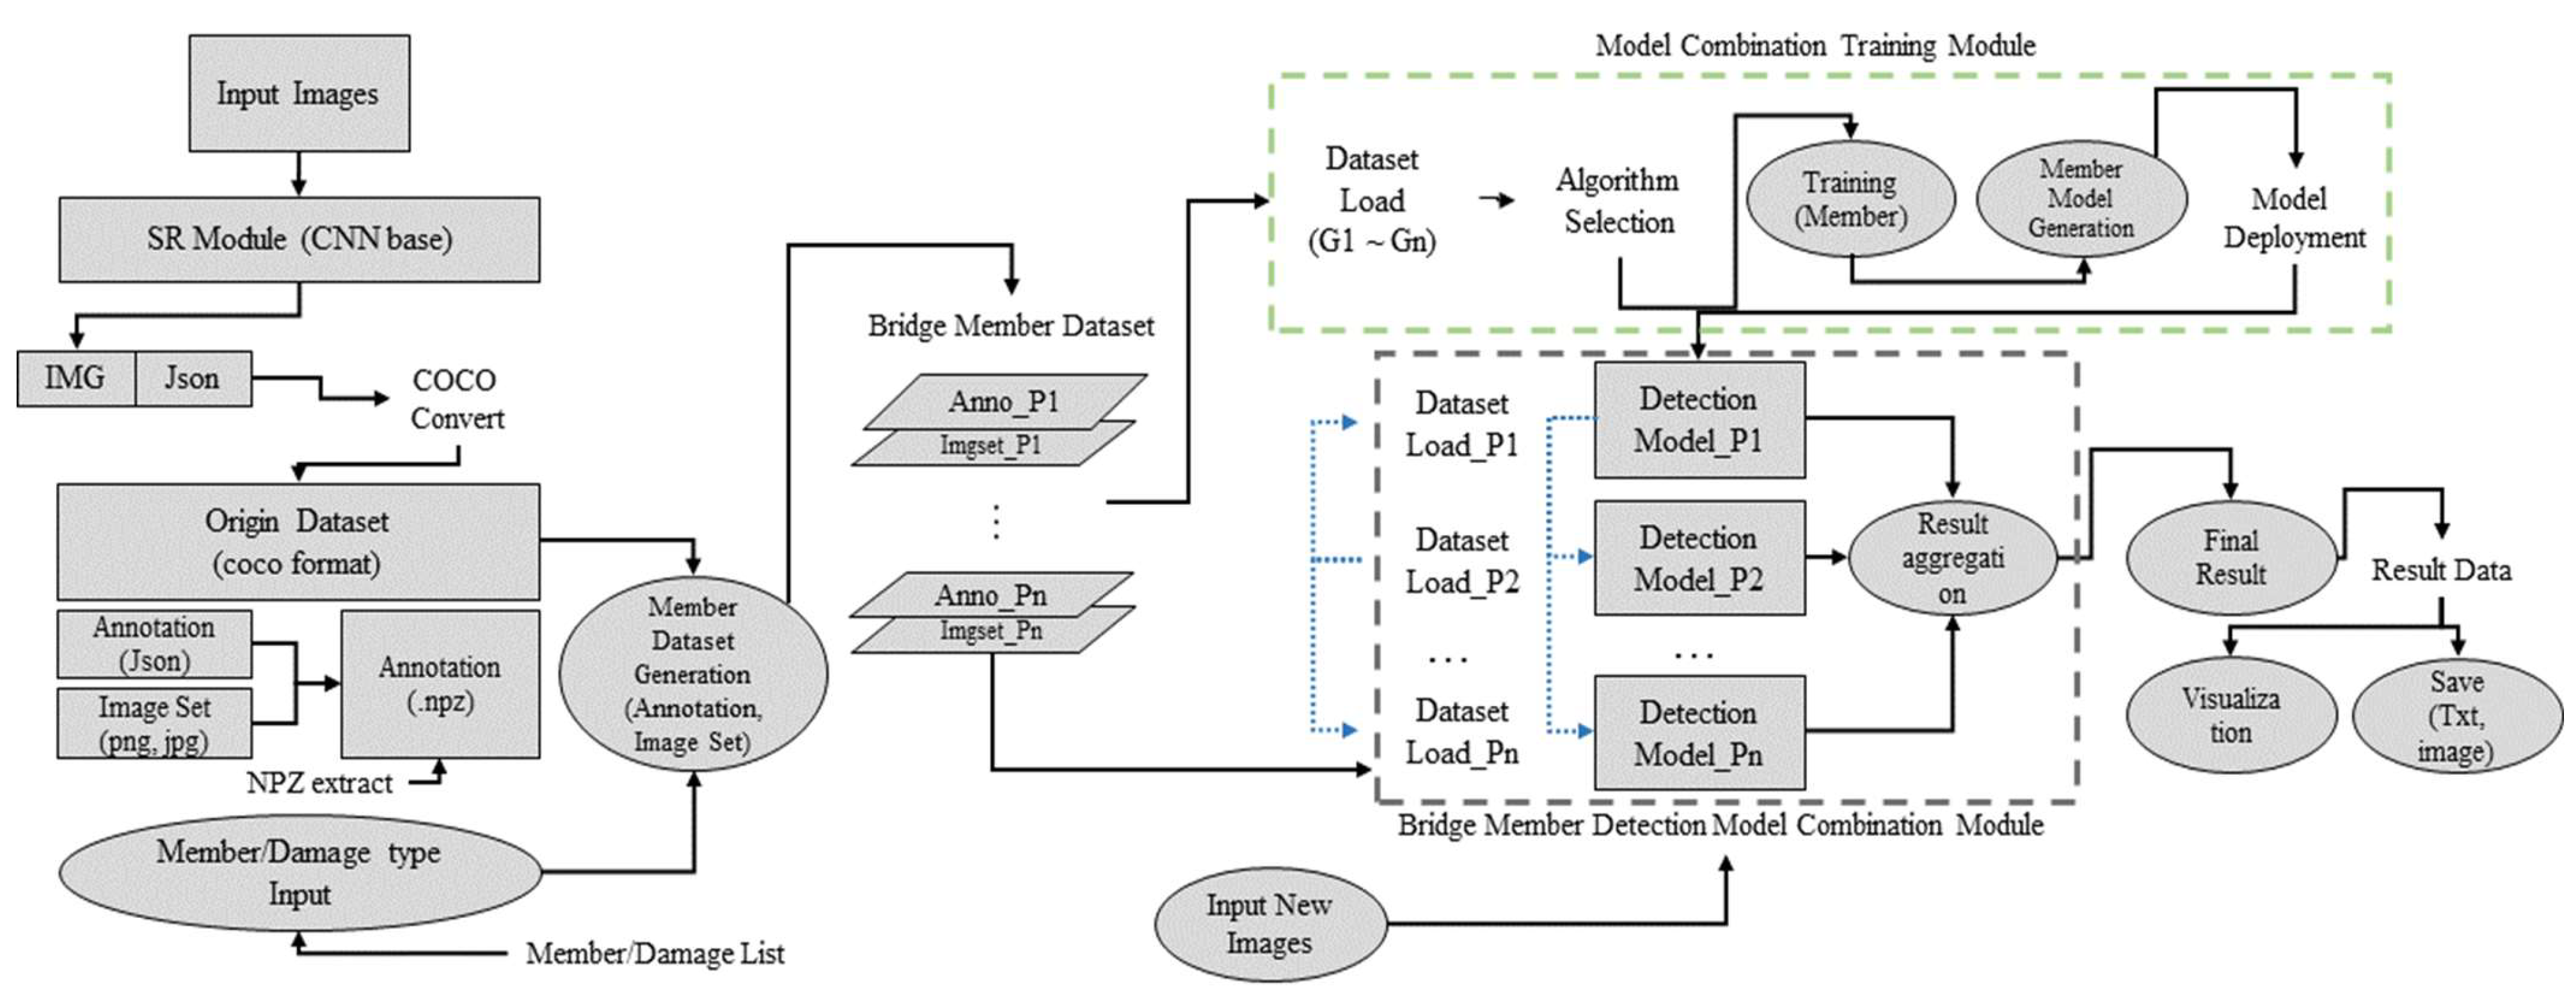
3. Proposed Framework
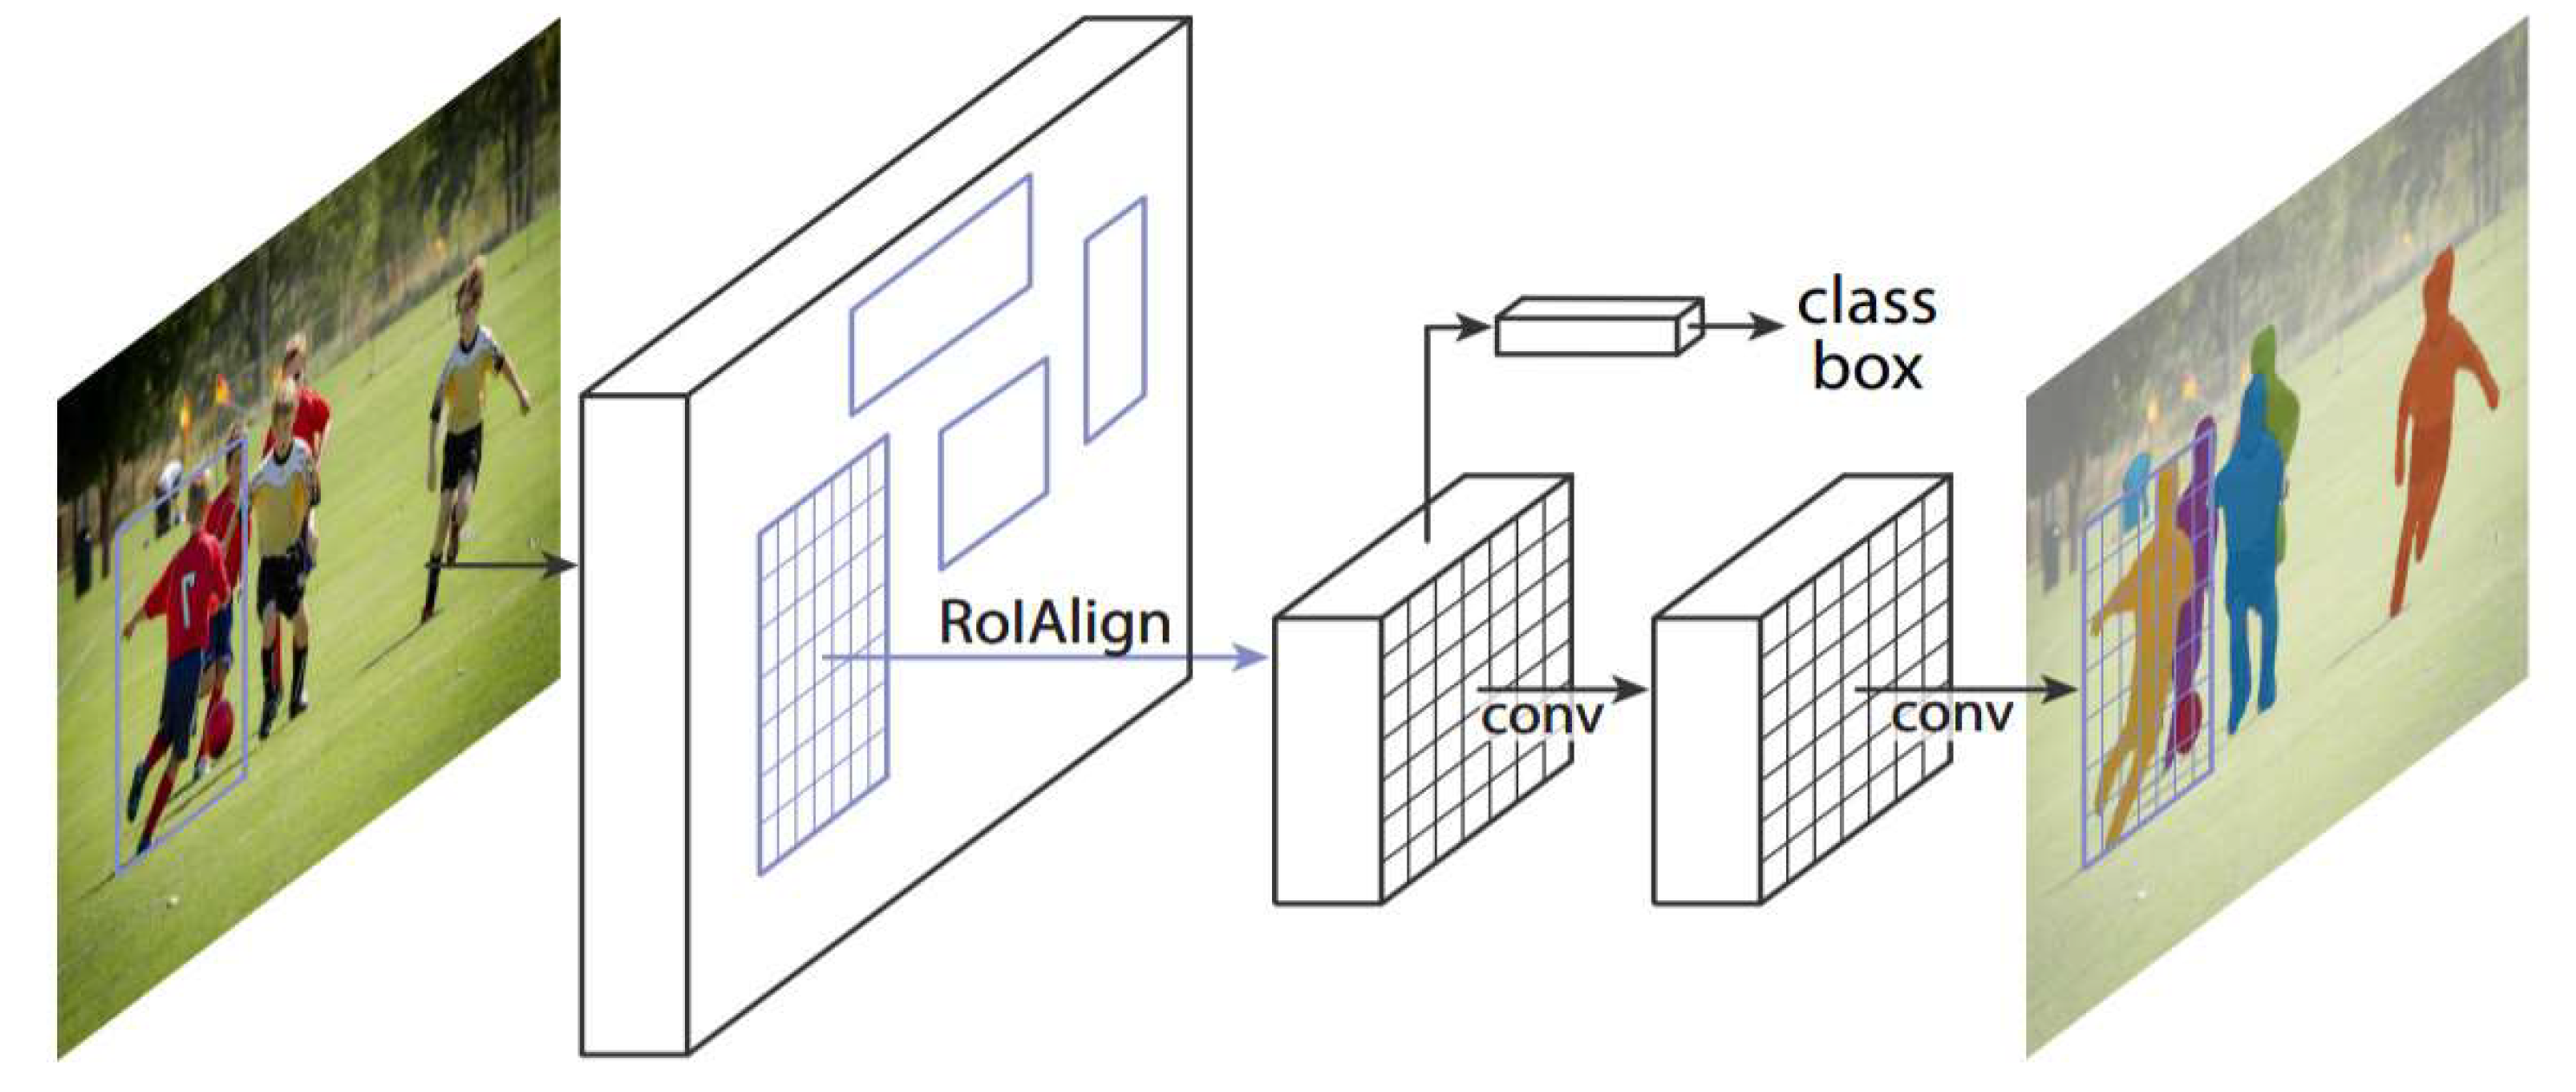
This paper proposes a deep learning framework for detecting damaged objects in bridges [12]. Initially, object-detection performance for each damage type is enhanced by using super-resolution (SR) techniques to improve and normalize resolution, thereby augmenting the dataset’s diversity and consistency. By using the SR technique, it is possible to build a better learning set because it maintains the quality of the images used for learning. Thereafter, we construct an optimized detection model tailored for each damage type using the bridge-damage-identification deep learning combination–module, which is based on separate training for each type. These models are then integrated into a single model and presented as an optimized solution for detecting damaged objects in bridges. The framework is specifically designed for six types of bridge damage: efflorescence, concrete scaling, concrete spalling, cracks, corrosion, and water leaks. The architecture of this framework is shown in Figure 1. The deep learning models used in combination are Mask R-CNN, BlendMask, and SWIN.

3.1. Mask R-CNN

Mask R-CNN, akin in architecture to Faster R-CNN, can perform object detection and semantic segmentation simultaneously. It utilizes RoIAlign for more accurate segmentation of object boundaries within the region of interest (RoI), enhancing accuracy. However, enhanced accuracy in pixel-level segmentation requires substantial GPU memory and computational capability [23]. Mask R-CNN consists of three main components:
  • Region Proposal Network (RPN): Like Faster R-CNN, Mask R-CNN begins with an RPN to suggest object regions in the image, predicting locations where objects are likely to be present.
  • RoIAlign: This accurately maps the RoI. It replaces RoIPool to improve pixel alignment accuracy, enabling accurate mask prediction during instance segmentation.
  • Mask Head: This component predicts the segmentation mask at the pixel level for the object within each RoI, along with the object’s bounding box. It consists of a CNN-based fully convolutional network that generates the mask using the feature map within the given RoI.
The architecture of Mask R-CNN is shown in Figure 2. Mask R-CNN’s capacity to detect objects and predict accurate segmentation masks for each instance makes it useful for various computer vision tasks, ranging from pedestrian detection and segmentation by autonomous vehicles to tumor analysis in medical imaging. Models pre-trained on large datasets such as Common Objects in COntext (COCO) are provided for Mask R-CNN, along with code in deep learning frameworks such as TensorFlow and PyTorch.

3.2. BlendMask

BlendMask is a model capable of performing semantic-segmentation and instance-segmentation tasks simultaneously. It features two branches: an instance-mask branch (IMB) and a semantic branch (SMB) [24]. It delivers high accuracy and speed, owing particularly to the IMB’s use of a RoI transformer and soft proposal generator to extract precise object boundaries. It achieves state-of-the-art performance on the COCO dataset, outperforming other models in terms of accuracy and speed. BlendMask’s pipeline is shown in Figure 3.
Although Mask R-CNN demonstrates high performance, its high computational demands and GPU memory requirements pose challenges for real-time tasks. YOLO offers fast processing but is inferior in segmentation accuracy to BlendMask or Mask R-CNN. BlendMask is utilized in various fields because it ensures high accuracy and speed. Compared to other instance-segmentation models, BlendMask has several advantages:
  • High Accuracy: BlendMask’s superior performance on the COCO dataset is because of its two-branch structure (IMB and SMB) and the integration of a RoI transformer and soft proposal generator, which together enhance the accuracy of segmentation boundaries.
  • High Speed: The use of a RoI transformer, instead of traditional RoI pooling, contributes to BlendMask’s fast processing capabilities. Additionally, its ability to maintain accuracy with fewer parameters enables high performance in memory-constrained environments.
  • Scale Invariance: BlendMask’s scale invariance ensures consistent performance across multiple image sizes, a feature influenced by the pre-trained models; this allows BlendMask to maintain high accuracy at various image sizes.
  • Multi-Object Segmentation: BlendMask’s capability to segment multiple objects within a single image is a huge advantage in both commercial processes and computer vision.
  • Small Training-Data Requirement: Typically, instance-segmentation models necessitate extensive labeling of training data, particularly in specific domains. BlendMask can achieve high performance with a limited dataset by using techniques that reduce the demand for a large amount of labeled data.
For these reasons, BlendMask is an outstanding instance-segmentation model.

3.3. SWIN

Swin Transformer (SWIN) is a model introduced in the paper “Swin Transformer: Hierarchical Vision Transformer using Shifted Windows”, developed by researchers at Microsoft Research Asia [25]. As shown in Figure 4, SWIN extends the existing vision transducer architecture to effectively capture the spatial structure of the image, resulting in excellent performance in tasks such as object detection and instance segmentation. The key elements of the SWIN include:
  • Window-Based Self-Attention: SWIN segments the input image into grids and performs self-attention within each, facilitating the integration of local context and global image structure.
  • Shifted Window: It employs a hierarchical strategy to enlarge each window incrementally through shifting operations, capturing a variety of resolutions and contextual information.
  • Tokenization and Patch Embedding: The model converts the image into a series of patches, which undergo tokenization and embedding processes.
  • Hierarchical Feature Fusion: SWIN utilizes a technique for merging features across different scales hierarchically, attaining various resolutions and spatial diversities.
Experimental results reveal that SWIN markedly outperforms Faster R-CNN and Mask R-CNN in instance-segmentation tasks on the COCO dataset. For example, SWIN has achieved a mean average precision (mAP) ~4% higher than the ResNet-50-based Faster R-CNN while maintaining a relatively lightweight model size. By segmenting images into grid-shaped windows, performing hierarchical self-attention, and combining features at multiple scales, SWIN delivers good performance with a streamlined architecture. SWIN and the two preceding models may be compared as follows:
  • Mask R-CNN focuses on object detection and pixel-level segmentation for accurate and reliable results.
  • BlendMask builds on Cascade Mask R-CNN, utilizing an ensemble technique to combine multi-stage network outputs and mask predictions.
  • SWIN leverages a vision transformer architecture, combining window-based self-attention with hierarchical feature mapping.
Each model has its unique concepts and architecture; selection among them should be based on specific experimental results and use requirements. In this study, these three models were applied to bridge-damage identification. To compare their performances, the same parameter values were set, and the resulting loss values were comparatively analyzed.

4. Experiment and Results

4.1. Experimental Environment

To test the performance of the detection model, experiments were conducted using a system equipped with a GPU. For fast learning speed and detection performance analysis, the CPU and GPU were selected to have the highest specifications at the time of the experiment. The programming language employed was Python. The equipment used in the experimental evaluations was as follows:
  • CPU: Intel(R) Core(TM) i7-10900k CPU 2.90 GHz
  • RAM: 96 GB
  • GPU: NVIDIA GeForce RTX3090

4.2. Hyperparameters

Table 1 shows the parameters adopted for all of the models. Fundamentally, the experiments were based on a ResNet model with a backbone depth of 50 layers.

4.3. Measurement Method

Loss values in deep learning models are primarily determined through a loss–function, an indicator that evaluates model performance by calculating the difference between the model’s predicted outputs and the actual values. Commonly used loss–functions include:
  • Mean Squared Error: Employed in regression problems, it is calculated by squaring the differences between predicted and actual values; these squares are then averaged.
  • Cross-Entropy Loss: This function is mainly used in classification problems to measure the differences between the predicted-probability distribution and the actual class labels. Binary cross-entropy is typically used for binary classification, while categorical cross-entropy is suited for multi-class scenarios.
  • Log-Likelihood Loss: Often used in generative models, this function seeks to maximize the logarithm of the likelihood of the predicted probabilities matching the actual data.
  • Custom loss–function for specific tasks: Such functions are tailored to specific problems. The composite loss–function in Mask R-CNN is an example; it is designed for concurrent object classification, bounding box regression, and mask segmentation.
To calculate the loss value, both the input data and the model’s output for that data are required. Optimization algorithms, such as gradient–descent, are used to minimize the loss value during the training process. Deep learning frameworks and libraries are equipped with a range of loss–functions and internally calculate and track loss values. In this paper, we compared the loss values generated across six types of bridge damage detection, over the course of 300,000 learning iterations.

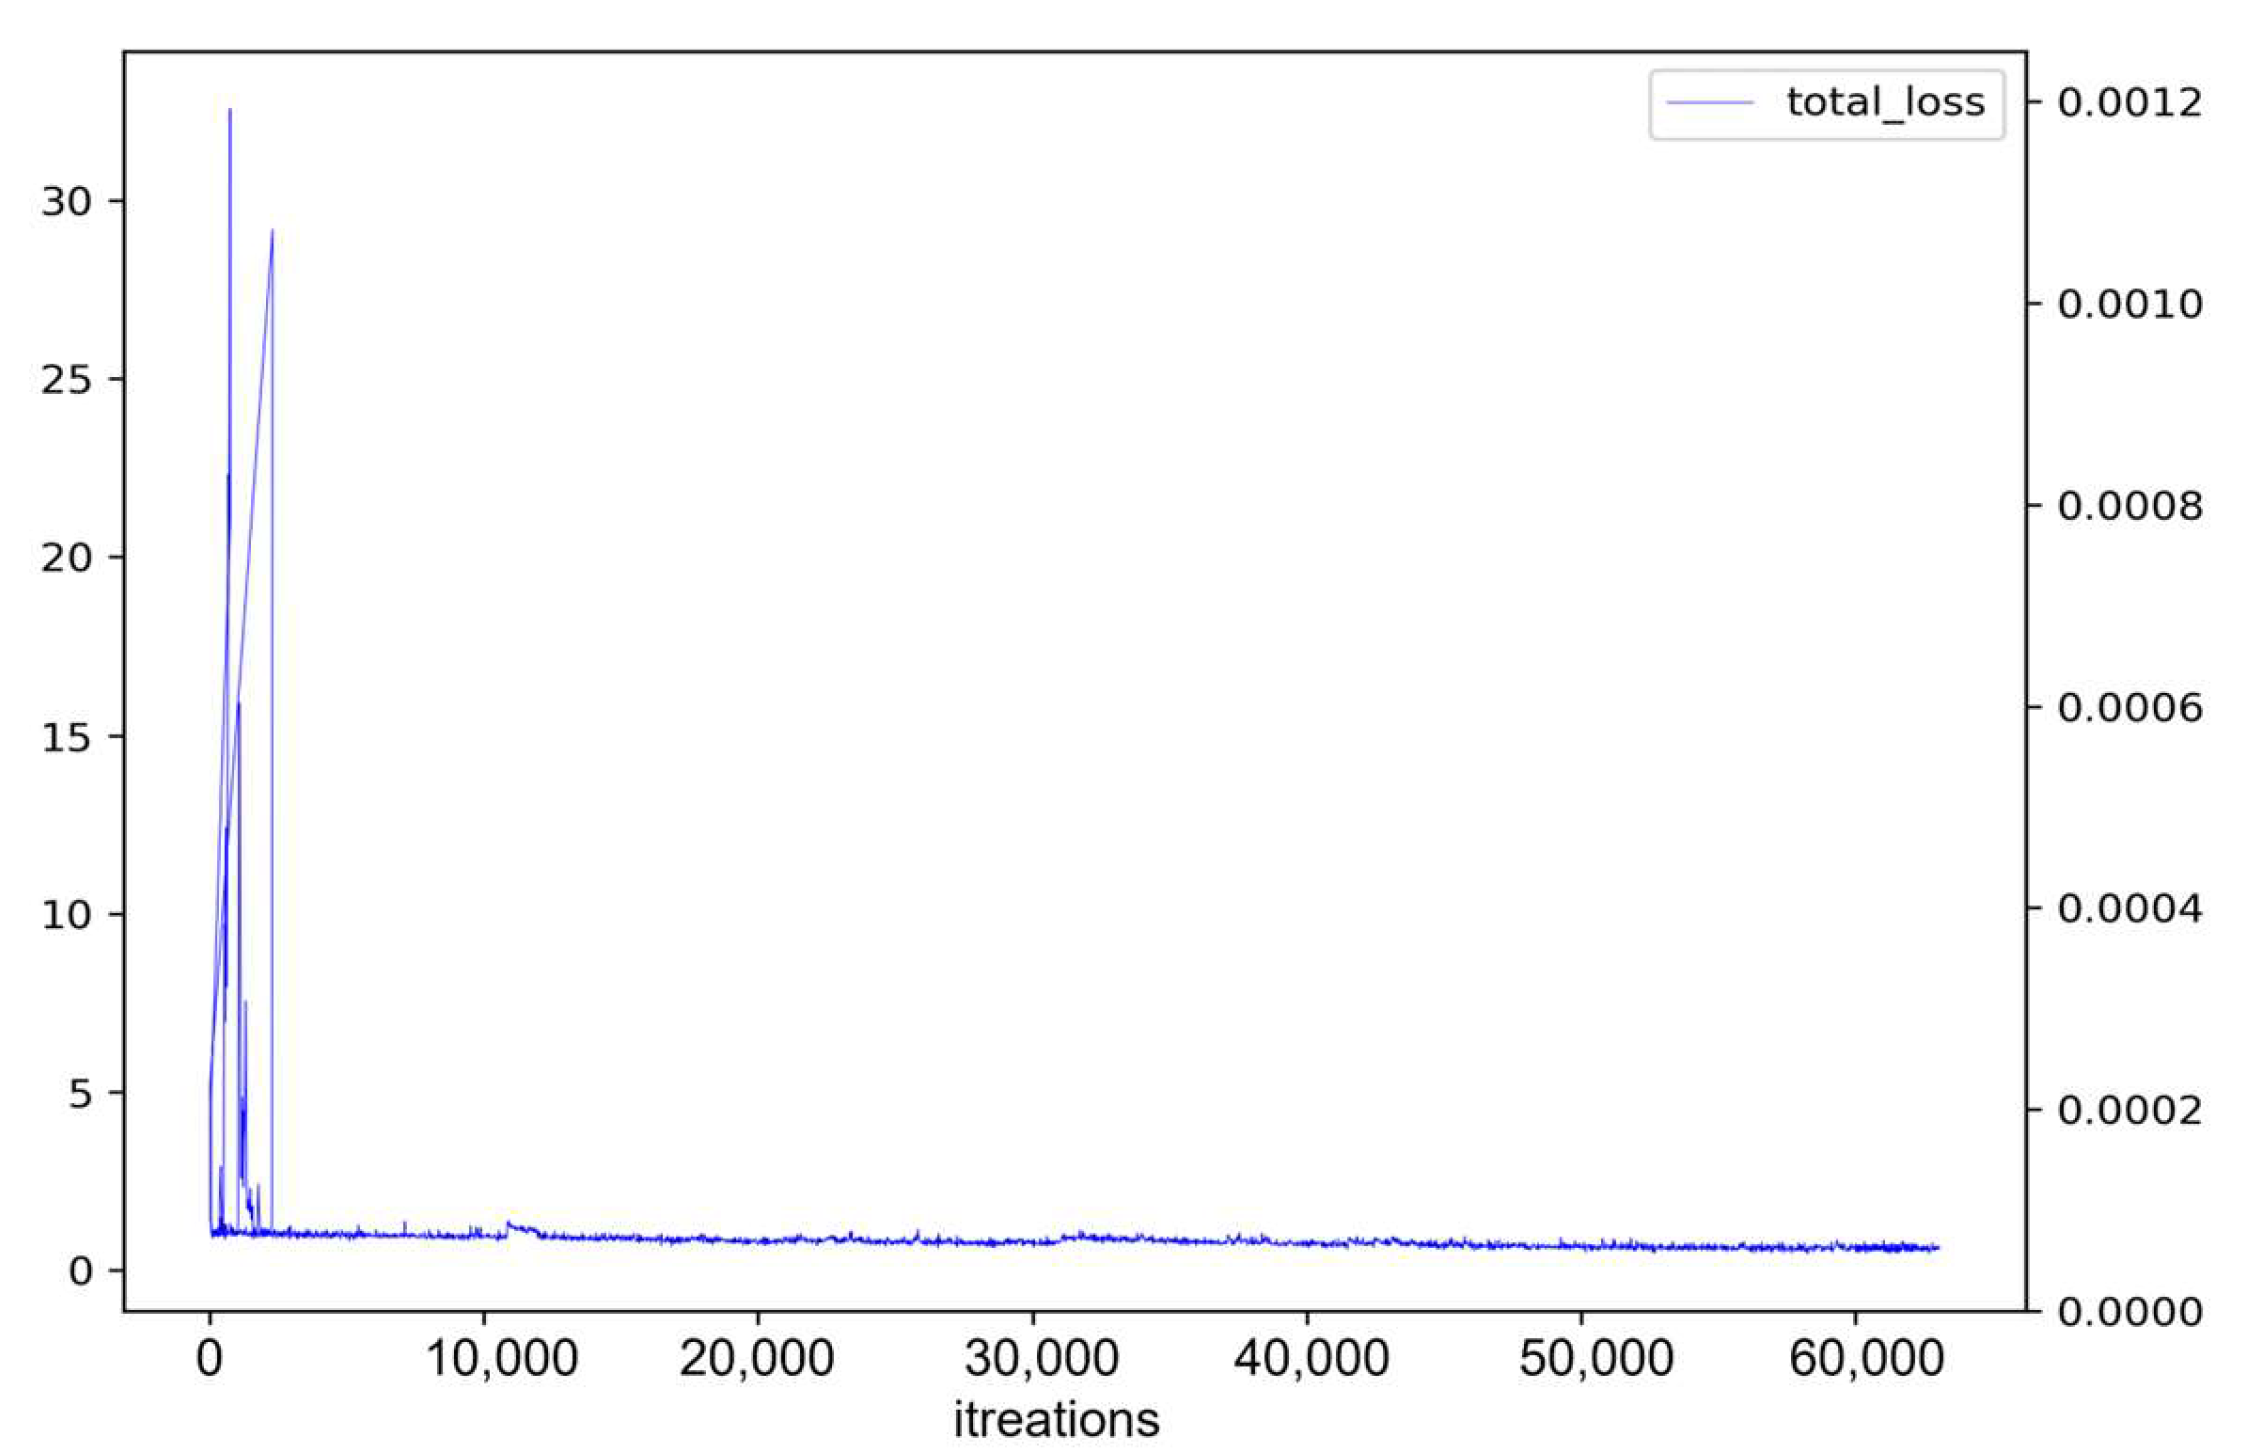
4.4. Comparison of Mask R-CNN and BlendMask

For a learning rate (LR) of 0.01, the distribution of loss values for Mask R-CNN is shown in Figure 5.
The experimental results show that the loss values are highly unstable, ranging from 0 to 0.0002. In the context of deep learning models, training processes utilize loss values as an indicator of performance, with lower values being better. High loss values could indicate inaccurate model predictions or discordance between the input data and the neural network’s architecture. Conversely, low loss values correspond to good predictive performance, indicating a model that performs with greater accuracy on given tasks.
For LR: 0.01, Figure 6 presents the loss value distribution for BlendMask.
These experimental results show that after 350,000 iterations, the loss values gradually converged to 0.0001 or lower. Moreover, these results not only exhibit more consistency but are also generally smaller than the prior findings from Mask R-CNN. The rapid change in loss value depending on the number of repetitions in the graph occurs due to the learning rate. The learning rate determines how much the model adjusts the weights at each iteration. If the learning rate is too large, the model may miss the optimal point, and if the learning rate is too small, it may take a long time to reach the optimal point. In these cases, the learning rate can be adjusted to stabilize the change in loss values.

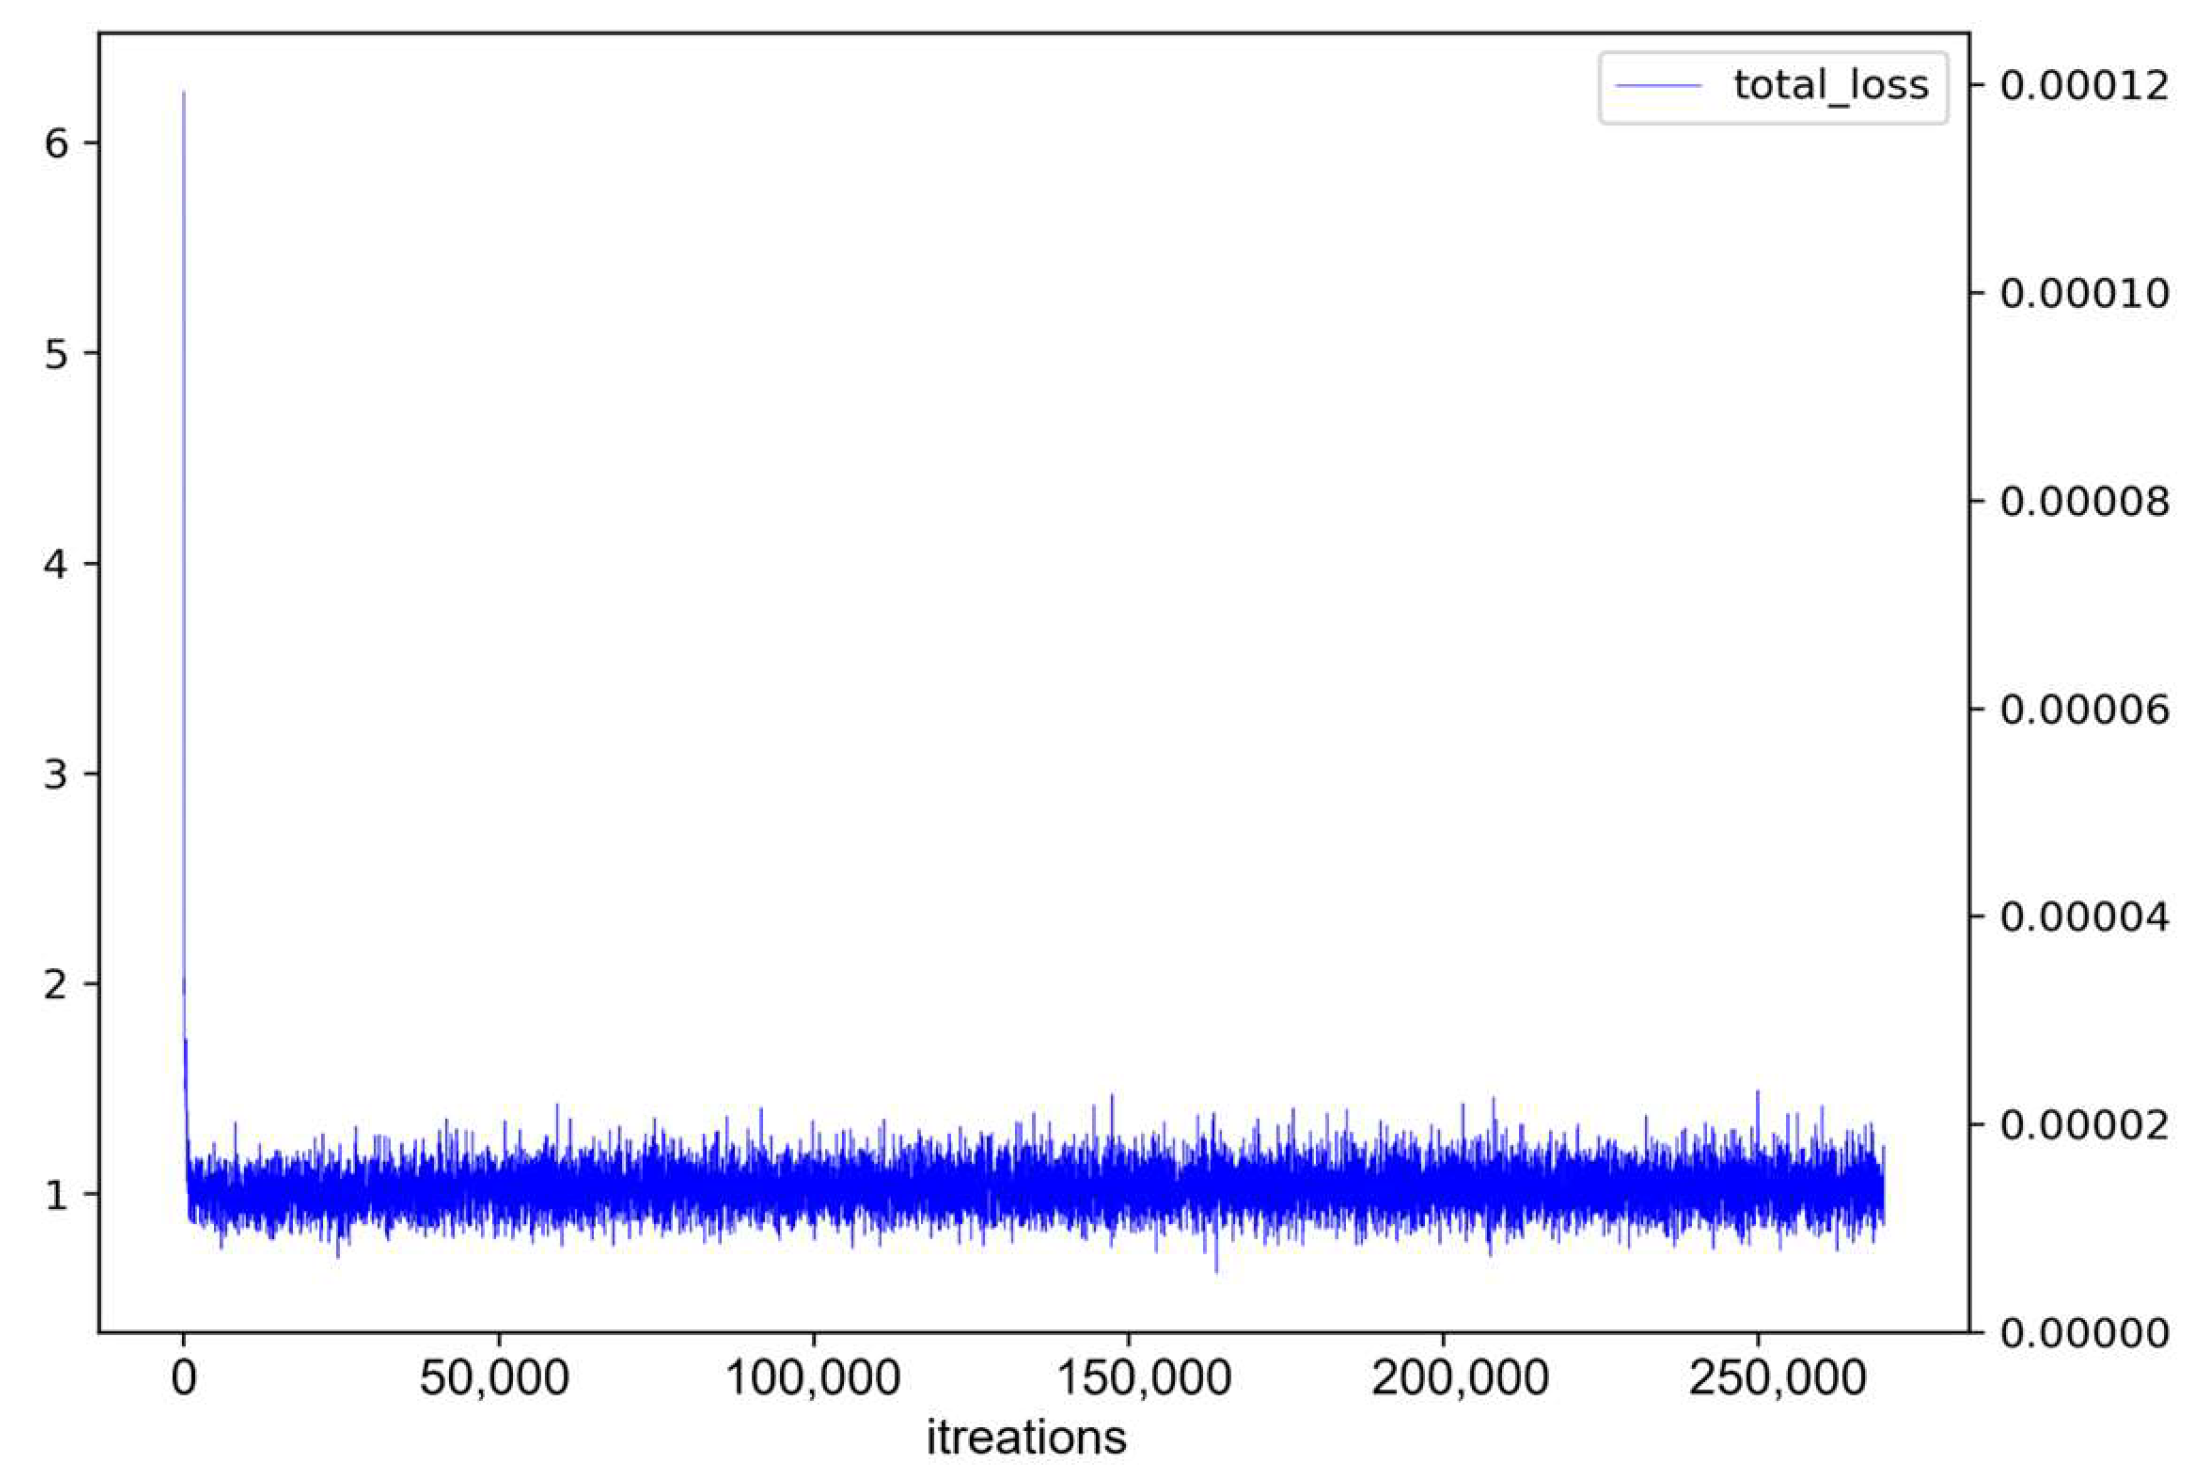
4.5. Comparison of Mask R-CNN and SWIN

For LR: 0.005, the distribution of loss values for Mask R-CNN is shown in Figure 7.
While the loss values were under 0.0001—lower than those at an LR of 0.01—they exhibited sharp fluctuations.
For LR: 0.005, the distribution of loss values for the SWIN is shown in Figure 8. They gradually converged to a point at or below 0.0001, requiring considerably fewer iterations than Mask R-CNN. This indicates that SWIN is capable of identifying objects more rapidly and with greater precision than Mask R-CNN.

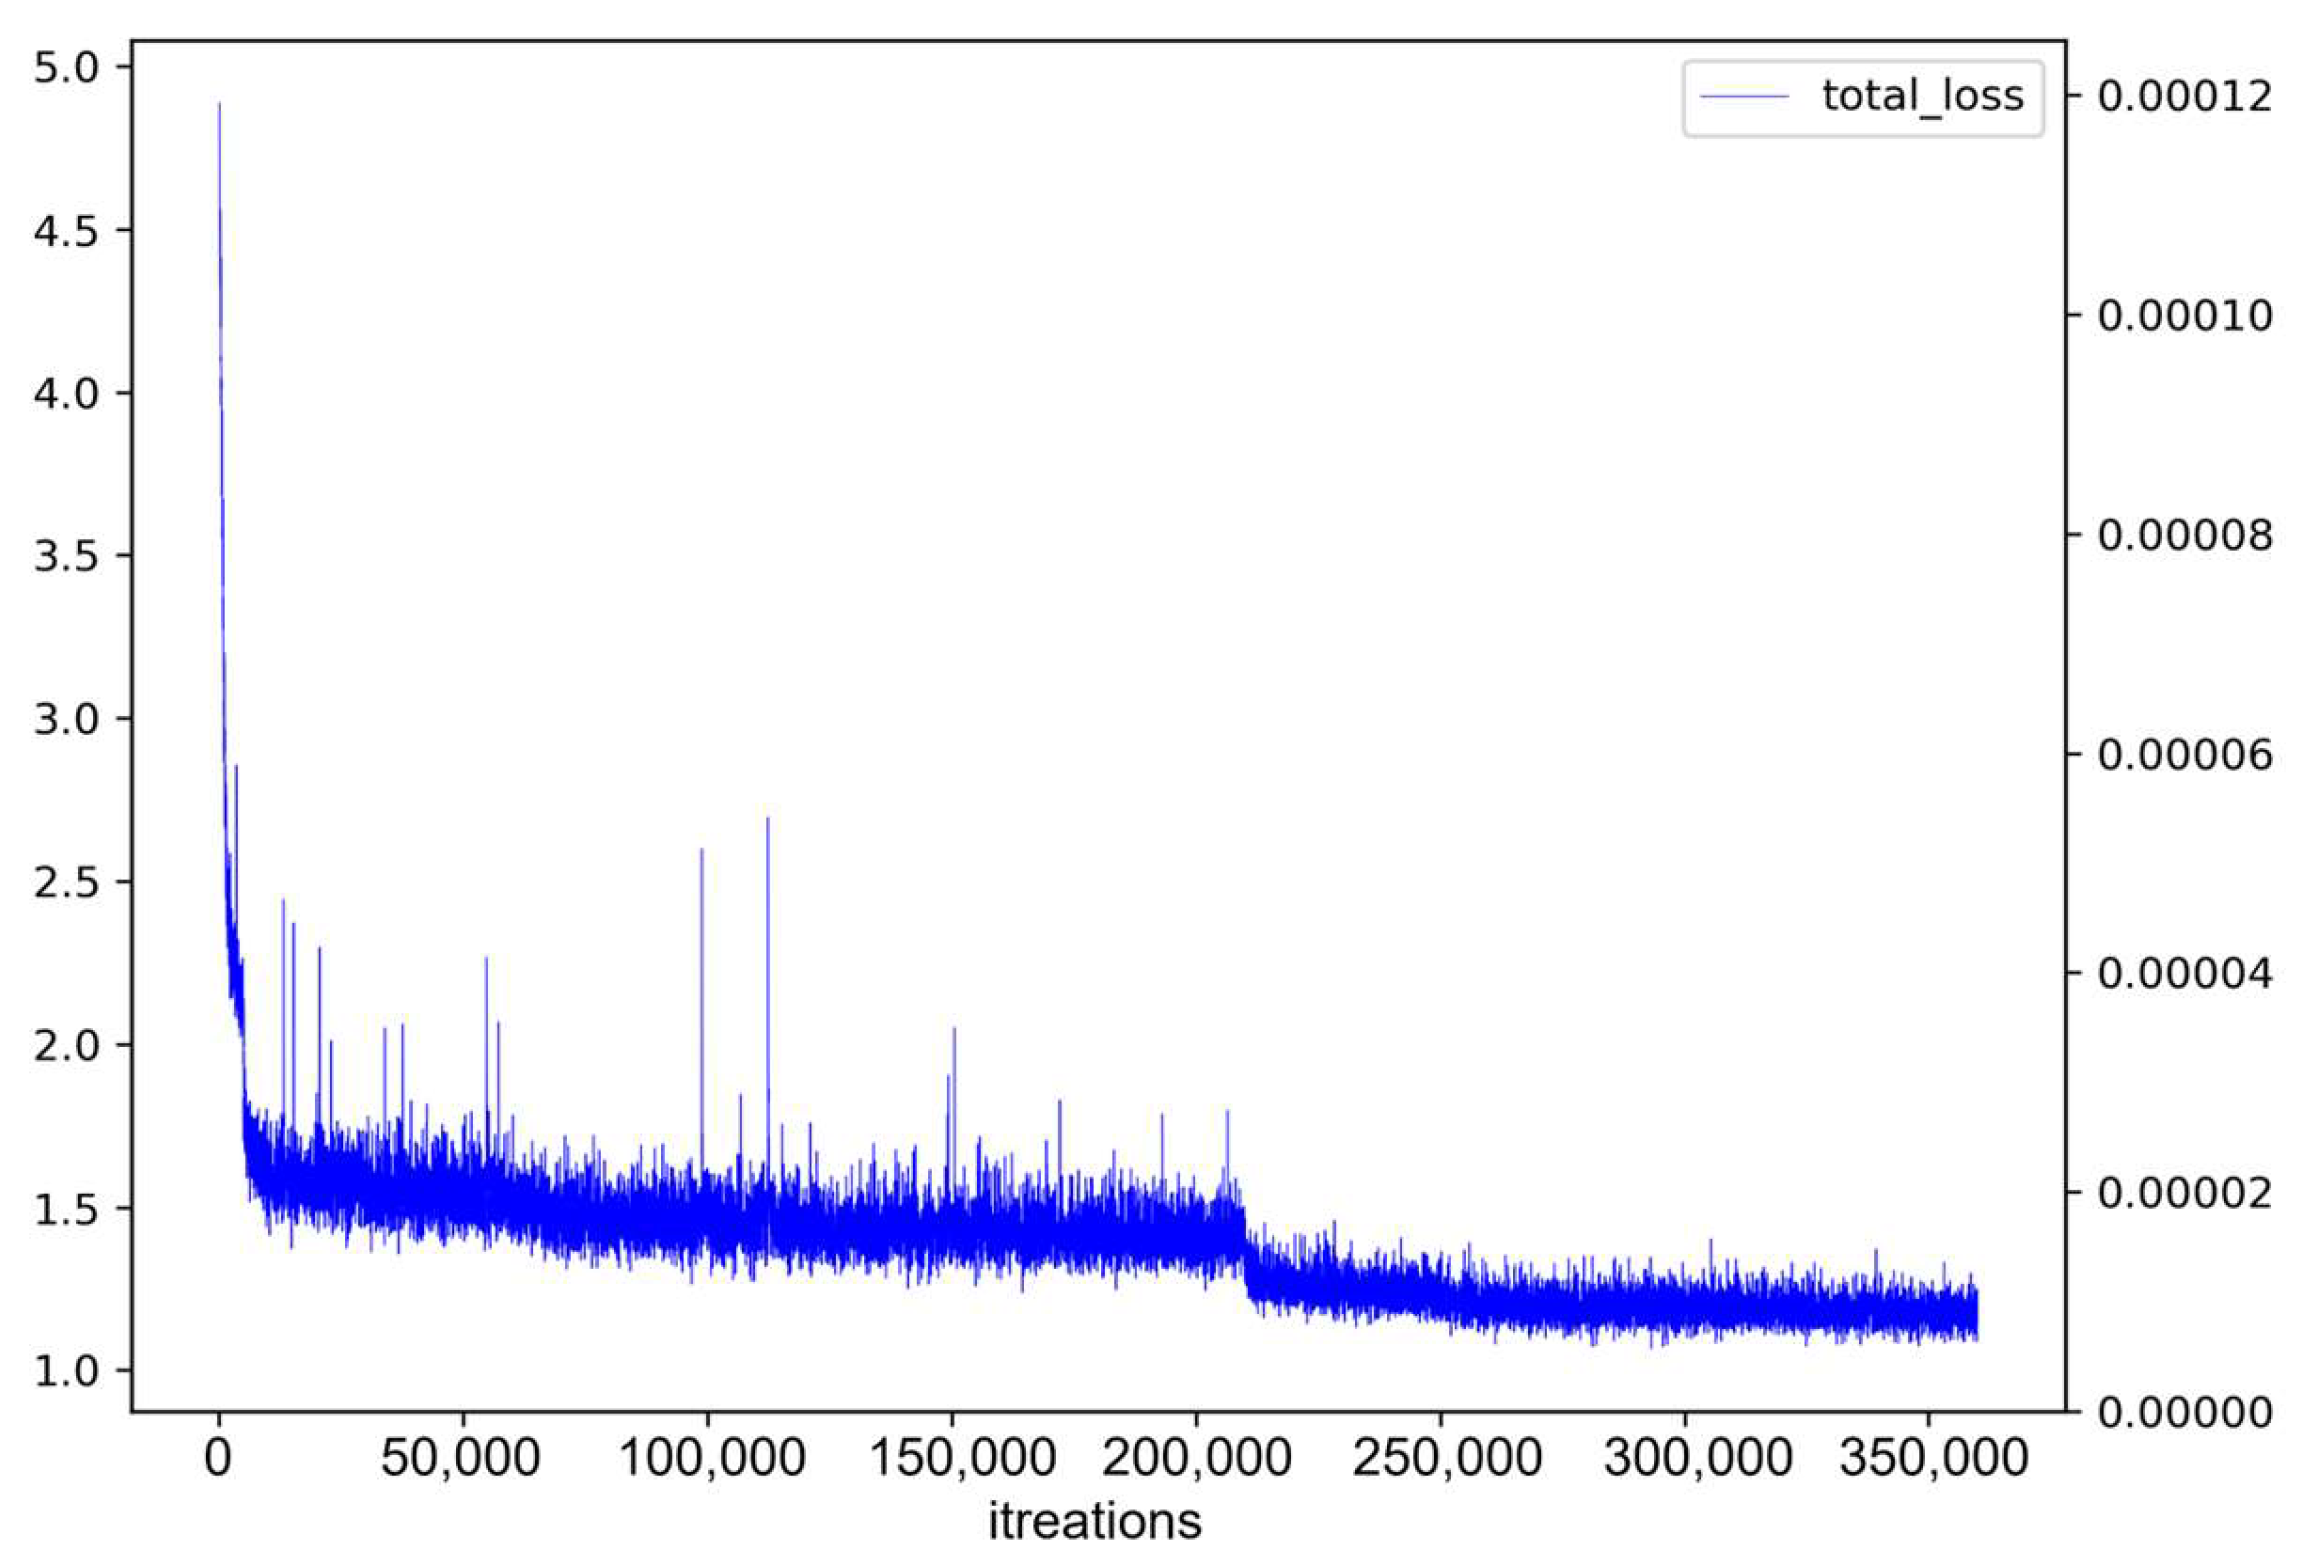
4.6. Comparison of Mask R-CNN, BlendMask, and SWIN

For LR: 0.0001, the distribution of loss values for Mask R-CNN is shown in Figure 9.
For Mask R-CNN, the results show that loss values started at 0.00002 or lower, even at early iteration stages. With additional iterations, the loss values continued with little variation, indicating only marginal improvement.
Figure 10 presents the loss value results for BlendMask. While high loss values were occasionally observed until about 200,000 iterations, generally the loss values followed a descending curve. This indicates that with continued training, loss values decrease, enhancing the model’s accuracy. However, with extremely small weight-update values, a vibration effect in model parameters was observed. This vibration phenomenon can undermine training stability and consistency, making it difficult to enhance performance.
Upon reviewing the loss value graph for the SWIN across training iterations (Figure 11), a consistently descending curve is apparent, distinguishing it from other models. The loss values for SWIN approached 0.00001 after 200,000 iterations; BlendMask attained similar values but only after exceeding 350,000 iterations. This result indicates that SWIN can produce accurate results faster. However, this observation applies when the learning rate is set to a very low level, specifically at 0.0001. In deep learning models, an excessively low LR can slow down the overall learning speed, with model-parameter updates becoming very small; this increases the likelihood of getting stuck in the local minimum, complicating convergence to the global minimum and degrading the model’s performance. Furthermore, it may lead to issues such as overfitting and parameter vibrations. Therefore, it is necessary to determine the optimal learning rate by experiment and verification within an appropriate range.

5. Conclusions

To enhance the predictive performance of a deep learning model, it is essential to reduce the loss value. Besides ensuring a highly accurate model with good generalization capabilities, achieving low loss values can also reduce the number of iterations needed, enhance stability, and prevent overfitting. In this study, we compared and analyzed the loss values of three deep learning models for identifying damage in aging bridges. The experimental results showed that BlendMask outperformed Mask R-CNN at a learning rate of 0.01. For the SWIN, learning occurred so quickly at this rate that the loss value trend was not clearly observed. At a learning rate of 0.005, the SWIN exhibited both lower loss values and a faster learning speed. When the learning rate was set to 0.0001, it was possible to compare all three models, with both BlendMask and SWIN demonstrating decent loss values; however, SWIN excelled in learning speed. Overall, the SWIN demonstrated the best performance; its performance can be maximized by adjusting the learning rate. Using these experimental results, it is possible to find out which instance-segmentation model is optimal for identifying damage to old bridges and how parameter values such as learning rate affect the use of various models. Using these results, it is possible to apply the most optimal deep learning model for each type of bridge damage.
However, in this study, it was impossible to compare loss values for various parameter values, and the amount of learning data was very small (about 4000), making a more objective comparative analysis difficult. Also, the number of images used for experiment and verification was about 200, so the results were slightly different for each experiment. Lastly, there are many more deep learning models besides the three representative ones studied here, and these should also be considered.
In future research, we plan to investigate hyperparameter tuning to reduce loss values more effectively and to conduct rigorous experiments and verification of the results. Model combination algorithms should be investigated to further improve the accuracy of the proposed automated bridge-damage-identification model. Finally, we plan to develop an optimized mobile application capable of obtaining real-time images from bridges and identifying damage, thereby advancing the automation of bridge inspection and assessment tasks.

Author Contributions

Conceptualization, S.-W.C. and B.-K.K.; Software, S.-W.C. and S.-S.H.; Validation, S.-W.C. and S.-S.H.; Resources, S.-W.C.; Data curation, S.-W.C.; Writing—original draft, S.-W.C.; Writing—review and editing, S.-W.C., S.-S.H. and B.-K.K.; Supervision, B.-K.K.; Project administration, B.-K.K.; Funding acquisition, B.-K.K. All authors have read and agreed to the published version of the manuscript.

Funding

Research for this paper was carried out under the KICT Research Program (project no. 20230073-001, Development of DNA-based smart maintenance platform and application technologies for aging bridges) funded by the Ministry of Science and ICT.

Institutional Review Board Statement

Not applicable.

Informed Consent Statement

Not applicable.

Data Availability Statement

DIV2K dataset—Super Resolution Benchmark Dataset (link: https://data.vision.ee.ethz.ch/cvl/DIV2K/, accessed on 30 October 2022).

Conflicts of Interest

The authors declare no conflict of interest.

References

  1. Mishra, M.; Lourenço, P.B.; Ramana, G.V. Structural health monitoring of civil engineering structures using the Internet of things: A review. J. Build. Eng. 2022, 48, 103954. [Google Scholar] [CrossRef]
  2. Morishige, H.; Tanaka, S. Nondestructive inspection of concrete structures using ultrasonic sensor. In Proceedings of the of the SICE 2004 Annual Conference, 4–6 August 2004; IEEE: New York, NY, USA, 2004; Volume 2, pp. 1890–1895. [Google Scholar]
  3. Tao, Y.; Shi, J.; Guo, W.; Zheng, J. Convolutional Neural Network Based Defect Recognition Model for Phased Array Ultrasonic Testing Images of Electrofusion Joints. J. Press. Vessel. Technol. 2023, 145, 024502. [Google Scholar] [CrossRef]
  4. Yang, J.; Xiang, F.; Li, R.; Zhang, L.; Yang, X.; Jiang, S.; Zhang, H.; Wang, D.; Liu, X. Intelligent bridge management via big data knowledge engineering. Autom. Constr. 2022, 135, 104118. [Google Scholar] [CrossRef]
  5. Inam, H.; Islam, N.U.; Akram, M.U.; Ullah, F. Smart and automated infrastructure management: A deep learning approach for crack detection in bridge images. Sustainability 2023, 15, 1866. [Google Scholar] [CrossRef]
  6. Lingxin, Z.; Junkai, S.; Baijie, Z. A review of the research and application of deep learning-based computer vision in structural damage detection. Earthq. Eng. Eng. Vib. 2022, 21, 1–21. [Google Scholar] [CrossRef]
  7. Su, Y.; Wang, J.; Li, D.; Wang, X.; Hu, L.; Yao, Y.; Kang, Y. End-to-end deep learning model for underground utilities localization using GPR. Autom. Constr. 2023, 149, 104776. [Google Scholar] [CrossRef]
  8. Kerle, N.; Nex, F.; Gerke, M.; Duarte, D.; Vetrivel, A. UAV-based structural damage mapping: A review. ISPRS Int. J. Geo Inf. 2019, 9, 14. [Google Scholar] [CrossRef]
  9. Hong, S.S.; Hwang, C.H.; Chung, S.W.; Kim, B.K. A deep-learning-based bridge damaged object automatic detection model using a bridge member model combination framework. Appl. Sci. 2022, 12, 12868. [Google Scholar] [CrossRef]
  10. Kim, B.; Yuvaraj, N.; Sri Preethaa, K.R.; Arun Pandian, R. Surface crack detection using deep learning with shallow CNN architecture for enhanced computation. Neural Comput. Appl. 2023, 33, 9289–9305. [Google Scholar] [CrossRef]
  11. Ali, L.; Alnajjar, F.; Jassmi, H.A.; Gocho, M.; Khan, W.; Serhani, M.A. Performance evaluation of deep CNN-based crack detection and localization techniques for concrete structures. Sensors 2021, 21, 1688. [Google Scholar] [CrossRef] [PubMed]
  12. Hong, S.S.; Hwang, C.; Chung, S.W.; Kim, B.K. A deep learning-based bridge damaged objects automatic detection model using bridge members model combination framework. JNCIST 2023, 12, 105–118. [Google Scholar] [CrossRef]
  13. Liu, K.; Han, X.; Chen, B.M. Deep learning based automatic crack detection and segmentation for unmanned aerial vehicle inspections. In Proceedings of the 2019 IEEE International Conference Robot. Biomim (ROBIO), Dali, China, 6–8 December 2019; pp. 381–387. [Google Scholar] [CrossRef]
  14. Da Silva, W.R.L.; de Lucena, D.S. Concrete cracks detection based on deep learning image classification. Proceedings 2018, 2, 489. [Google Scholar] [CrossRef]
  15. Feng, C.; Zhang, H.; Wang, S.; Li, Y.; Wang, H.; Yan, F. Structural damage detection using deep convolutional neural network and transfer learning. KSCE J. Civ. Eng. 2019, 23, 4493–4502. [Google Scholar] [CrossRef]
  16. Aslam, S.; Ayub, N.; Farooq, U.; Alvi, M.J.; Albogamy, F.R.; Rukh, G.; Haider, S.I.; Azar, A.T.; Bukhsh, R. Towards electric price and load forecasting using cnn-based ensembler in smart grid. Sustainability 2021, 13, 12653. [Google Scholar] [CrossRef]
  17. Munawar, H.S.; Hammad, A.W.A.; Waller, S.T.; Islam, M.R. Modern crack detection for bridge infrastructure maintenance using machine learning. Hum.-Cent. Intell. Syst. 2022, 2, 95–112. [Google Scholar] [CrossRef]
  18. Dung, C.V.; Anh, L.D. Autonomous concrete crack detection using deep fully convolutional neural network. Autom. Constr. 2019, 99, 52–58. [Google Scholar] [CrossRef]
  19. Avci, O.; Abdeljaber, O.; Kiranyaz, S.; Hussein, M.; Gabbouj, M.; Inman, D.J. A review of vibration-based damage detection in civil structures: From traditional methods to machine learning and deep learning applications. Mech. Syst. Signal Process. 2021, 147, 107077. [Google Scholar] [CrossRef]
  20. Ali, R.; Chuah, J.H.; Talip, M.S.A.; Mokhtar, N.; Shoaib, M.A. Structural crack detection using deep convolutional neural networks. Autom. Constr. 2022, 133, 103989. [Google Scholar] [CrossRef]
  21. Bjorck, N.; Gomes, C.P.; Selman, B.; Weinberger, K.Q. Understanding batch normalization. Adv. Neural Inf. Process. Syst. 2018, 31, 1–12. [Google Scholar]
  22. Kukačka, J.; Golkov, V.; Cremers, D. Regularization for Deep Learning: A Taxonomy. arXiv 2017, arXiv:1710.10686. Available online: https://arxiv.org/abs/1710.10686 (accessed on 19 June 2021).
  23. He, K.; Gkioxari, G.; Dollár, P.; Girshick, R. Mask r-cnn. In Proceedings of the IEEE International Conference on Computer Vision, Venice, Italy, 22–29 October 2017; pp. 2961–2969. [Google Scholar]
  24. Chen, H.; Sun, K.; Tian, Z.; Shen, C.; Huang, Y.; Yan, Y. Blendmask: Top-down meets bottom-up for instance segmentation. In Proceedings of the IEEE/CVF Conference on Computer Vision and Pattern Recognition, Seattle, WA, USA, 13–19 June 2020; pp. 8570–8578. [Google Scholar] [CrossRef]
  25. Liu, Z.; Lin, Y.; Cao, Y.; Hu, H.; Wei, Y.; Zhang, Z.; Guo, B. Swin transformer: Hierarchical vision transformer using shifted windows. In Proceedings of the IEEE/CVF International Conference on Computer Vision, Montreal, BC, Canada, 11–17 October 2021; pp. 10012–10022. [Google Scholar]
Figure 1. Object-detection framework for identifying bridge damage by integrating deep learning combination–modules [12].
Applsci 13 13204 g001
Figure 2. Mask R-CNN architecture.
Applsci 13 13204 g002
Figure 3. BlendMask pipeline.
Applsci 13 13204 g003
Figure 4. SWIN architecture.
Applsci 13 13204 g004
Figure 5. Loss values for Mask R-CNN (learning rate: 0.01).
Applsci 13 13204 g005
Figure 6. Loss values for BlendMask (learning rate: 0.01).
Applsci 13 13204 g006
Figure 7. Loss values for Mask R-CNN (learning rate: 0.005).
Applsci 13 13204 g007
Figure 8. Loss values for SWIN (learning rate: 0.005).
Applsci 13 13204 g008
Figure 9. Loss values for Mask R-CNN (learning rate: 0.0001).
Applsci 13 13204 g009
Figure 10. Loss values for BlendMask (learning rate: 0.0001).
Applsci 13 13204 g010
Figure 11. Loss values for SWIN (learning rate: 0.0001).
Applsci 13 13204 g011
Table 1. Main parameters of Mask R-CNN, BlendMask, and SWIN.
Common Parameters
MODEL:
 BACKBONE:
 NAME: “build_resnet_fpn_backbone”
 RESNETS:
 DEPTH: 50
 OUT_FEATURES: [“res2”, “res3”, “res4”, “res5”]
 FPN:
 IN_FEATURES: [“res2”, “res3”, “res4”, “res5”]
 ANCHOR_GENERATOR:
 SIZES: [[32], [64], [128], [256], [512]] # One size for each in feature map
 ASPECT_RATIOS: [[0.5, 1.0, 2.0]] # Three aspect ratios (same for all in feature maps)
 ROI_HEADS:
 NAME: “StandardROIHeads”
 IN_FEATURES: [“p2”, “p3”, “p4”, “p5”]
SOLVER:
 IMS_PER_BATCH: 2
 STEPS: (210000, 250000)
 MAX_ITER: 270000
 WEIGHT_DECAY: 0.05
 BASE_LR: 0.001
INPUT:
 MIN_SIZE_TRAIN: (640, 672, 704, 736, 768, 800)
Disclaimer/Publisher’s Note: The statements, opinions and data contained in all publications are solely those of the individual author(s) and contributor(s) and not of MDPI and/or the editor(s). MDPI and/or the editor(s) disclaim responsibility for any injury to people or property resulting from any ideas, methods, instructions or products referred to in the content.

