1. Introduction
Wind energy is gaining popularity as an environmentally friendly and sustainable substitute for the use of fossil fuels. As a result, wind farm construction has increased dramatically in recent years all over the world. Yet, maintaining these offshore or onshore wind turbines, particularly in distant places, remains a difficult undertaking. Wind turbine inspections traditionally need a professional crew to do manual inspections using rope climbing or ground equipment. Yet, rope-based inspection may be exceedingly dangerous for maintenance employees, and telephotography is sometimes unproductive, since microscopic fractures and damage are sometimes imperceptible to the human eye. Moreover, a typical examination necessitates substantial operating expenses and lengthy downtime.
UAV-based inspection offers a lot of potential for wind turbine maintenance because of its high mobility, ease of deployment, and cheap maintenance cost. The usage of these UAV-based systems ensures operator safety and requires less downtime for inspection. In particular, UAV-based solutions can reduce inspection time compared to manned inspection. Furthermore, for wind turbines located in severe environments, regular inspection may be accomplished by obtaining high-definition photos or videos via loaded camera sensors for precise fracture, impairment, and deterioration analysis. As a result, it is easy to observe that UAV-based surveys are a more powerful and economical strategy that outperforms conventional inspection techniques.
In the previous decade, quite a number of studies were conducted concentrating on UAV-based independent surveys for wind turbines at rest, and the application of deep learning techniques for damage detection [
1,
2,
3,
4]. The basic concept is to guide the UAV through the set of predetermined inspection control points provided, using detection algorithms concentrating on lines such as the Hough transform on the basis of uncomplicated blade geometry (i.e., blades are viewed as line segments). Yet, because of their flexibility, blades are frequently missed during UAV inspection process. When checking in direct proximity to the blade (e.g., 10 m), disregarding such a nonlinear component might result in losing sight of the blade (particularly around the tip) if pursuing a set inspection route. As a result, from a practical standpoint, it is critical to consider the curvature of the blade. Deep learning techniques such as a Convolutional Neural Network (CNN) and Mask R-CNN have also been utilized to improve detection performance [
5,
6].
Multiple failures in wind turbine generator blades can result in a variety of repercussions, including decreased energy output, economic losses, equipment damage, human accidents, and so on.
In this article, we present a deep learning vision-based technique for identifying specific defects on wind turbine blades. The proposed model is trained and tested exclusively for damage detection and evaluated against existing deep learning techniques for defects detection. Furthermore, ablation studies are performed to further improve the proposed technique’s back-bone classification model. To this end, we assembled a collection of photos comprising the sorts of damage investigated in this study. The images are captured from a 110-MWac South African wind farm by means of a planned UAV-based drone inspection during bi-annual maintenance inspections of the wind turbine generators.
The balance of the paper is structured in the following manner:
Section 2 explains the related study,
Section 3 discusses the UAV specification and wind farm specification,
Section 4 describes the vision-based technique employing convolutional neural networks, and
Section 5 describes and discusses experimentation and findings. Finally,
Section 6 brings the process to a close.
2. Related Work
The authors of “A New Deep Class-Imbalanced Semisupervised Model for Wind Turbine Blade Icing Detection” suggested a particular deep class-imbalanced, semisupervised prototype for estimating icing conditions on wind turbine blades. A prototype network that is able to stabilize the classes for tagged and unlabeled data is implemented to tackle the class-imbalance problem. By comparing the correlation of models for unlabeled and labeled instances in a latent feature space, the provided prototype network can classify unlabeled data as well as rebalance collected characteristics. The authors suggested enhancing the feature extractor’s feature extraction capability by including an additional channel attention module. Last but not least, we carefully evaluated the proposed model using baseline comparison, ablation study, and online detection. The findings show that the suggested model is superior and effective [
1].
The authors of “A Novel Vision-Based Approach Utilizing Deep Learning for Damage Inspection in Wind Turbine Blades” proposed a deep learning vision-based method for detecting fractures, wear, and other defects on wind turbine blades. They also display a proof-of-concept that makes use of a robotic tool to take pictures of the blades’ surfaces and automatically identify damage. To achieve this, a gallery of images showcasing the various kinds of impairments and breakages assessed in the study was assembled. A convolutional neural network was then trained on the images to detect damage. Following that, a prototype was made. In order to scan the entire surface of the wind turbine blades, a robot with a camera attached and a straightforward route-planning method were developed. A wind turbine model was created in order to examine the entire mechatronics setup [
2].
The authors of “A New Vision-Based Method Using Deep Learning for Damage Inspection in Wind Turbine Blades” proposed a distributed, collision-free command strategy for many drones which is computationally light and highly scalable. Unmanned aerial vehicles (UAVs) are guided along predetermined flight paths by the system to monitor structural assets like wind turbines, flare stacks, and tanks. Automated structural inspection employs this strategy to increase coverage by minimizing unscanned areas. To ensure total coverage of the target item, they perform coverage path planning (CPP). Contrarily, humans conduct visual inspections using the UAVs’ video streaming [
3].
On the basis of SCADA data, Wang et al. [
4] suggested a deep autoencoder-based methodology for recognizing imminent defects on wind turbine blades. Nevertheless, this strategy concentrated on the forecast of blade failures, with no mention of methods for detecting early-stage flaws and continually monitoring their progression.
A rising trend of employing UAVs to monitor wind turbine blade surface conditions has been found to increase the effectiveness of wind farm operations and maintenance, particularly in offshore wind farms [
5,
6,
7,
8,
9,
10].
For these reasons, we propose developing a deep learning-based technique that can cover the surface of wind turbine generators to forecast and detect different defects on the main components such as the hub, nacelle, blades, and wind turbine tower, making wind turbine generator maintenance more efficient than manual inspection.
3. UAV Specification and Wind Farm Specification
3.1. Wind Farm and Wind Turbine Generators Specification
This is a 110 MW-ac wind energy project based in South Africa. The wind farm comprises 37 wind turbine generators in total. All the wind turbine generators installed are of the same specification: 3-bladed with horizontal axis and 2 MW. The hub height of the WTGs is 91 m and the WTG rotor diameter is 117 m. The configuration of all the WTGs involves a connection to the main internal MV transformer via the main converter, grid, and stator contactors and circuit breaker along a common electrical network. Thus, a total of 37 converters and 37 MV transformers are installed in the wind farm facility. Finally, the voltage connection level of the wind farm is at 137 kilovolts (kV).
3.2. UAV-Based Inspection System, Testbed, and Evaluation Domain Environment
Specialized Applications for Remotely Piloted Aircraft Systems (RPAS)—the following items were used during the drone flight across the wind farm and were manufactured by SZ DJI Technology Co., Ltd. headquartered in Shenzhen, China:
DJI Matrice 200V2 RPAS Drone (Primary of RGB);
- -
Sufficient TB55 Intelligent Batteries;
- -
Additional WB37 Controller Intelligent Batteries;
- -
High-Speed SD Cards DJI;
Matrice 210V2 RPAS Drone (Secondary for Thermal);
Matrice 210V2 RPAS Drone (Secondary for LiDAR);
DJI ZenMuse L1 LiDAR sensor;
DJI ZenMuse X5S (FC6520) Imaging Sensor;
- -
F-stop: f/5.6;
- -
Exposure time: 1/320 s;
- -
ISO speed: ISO-100;
- -
Exposure Bias: +0.7 step.
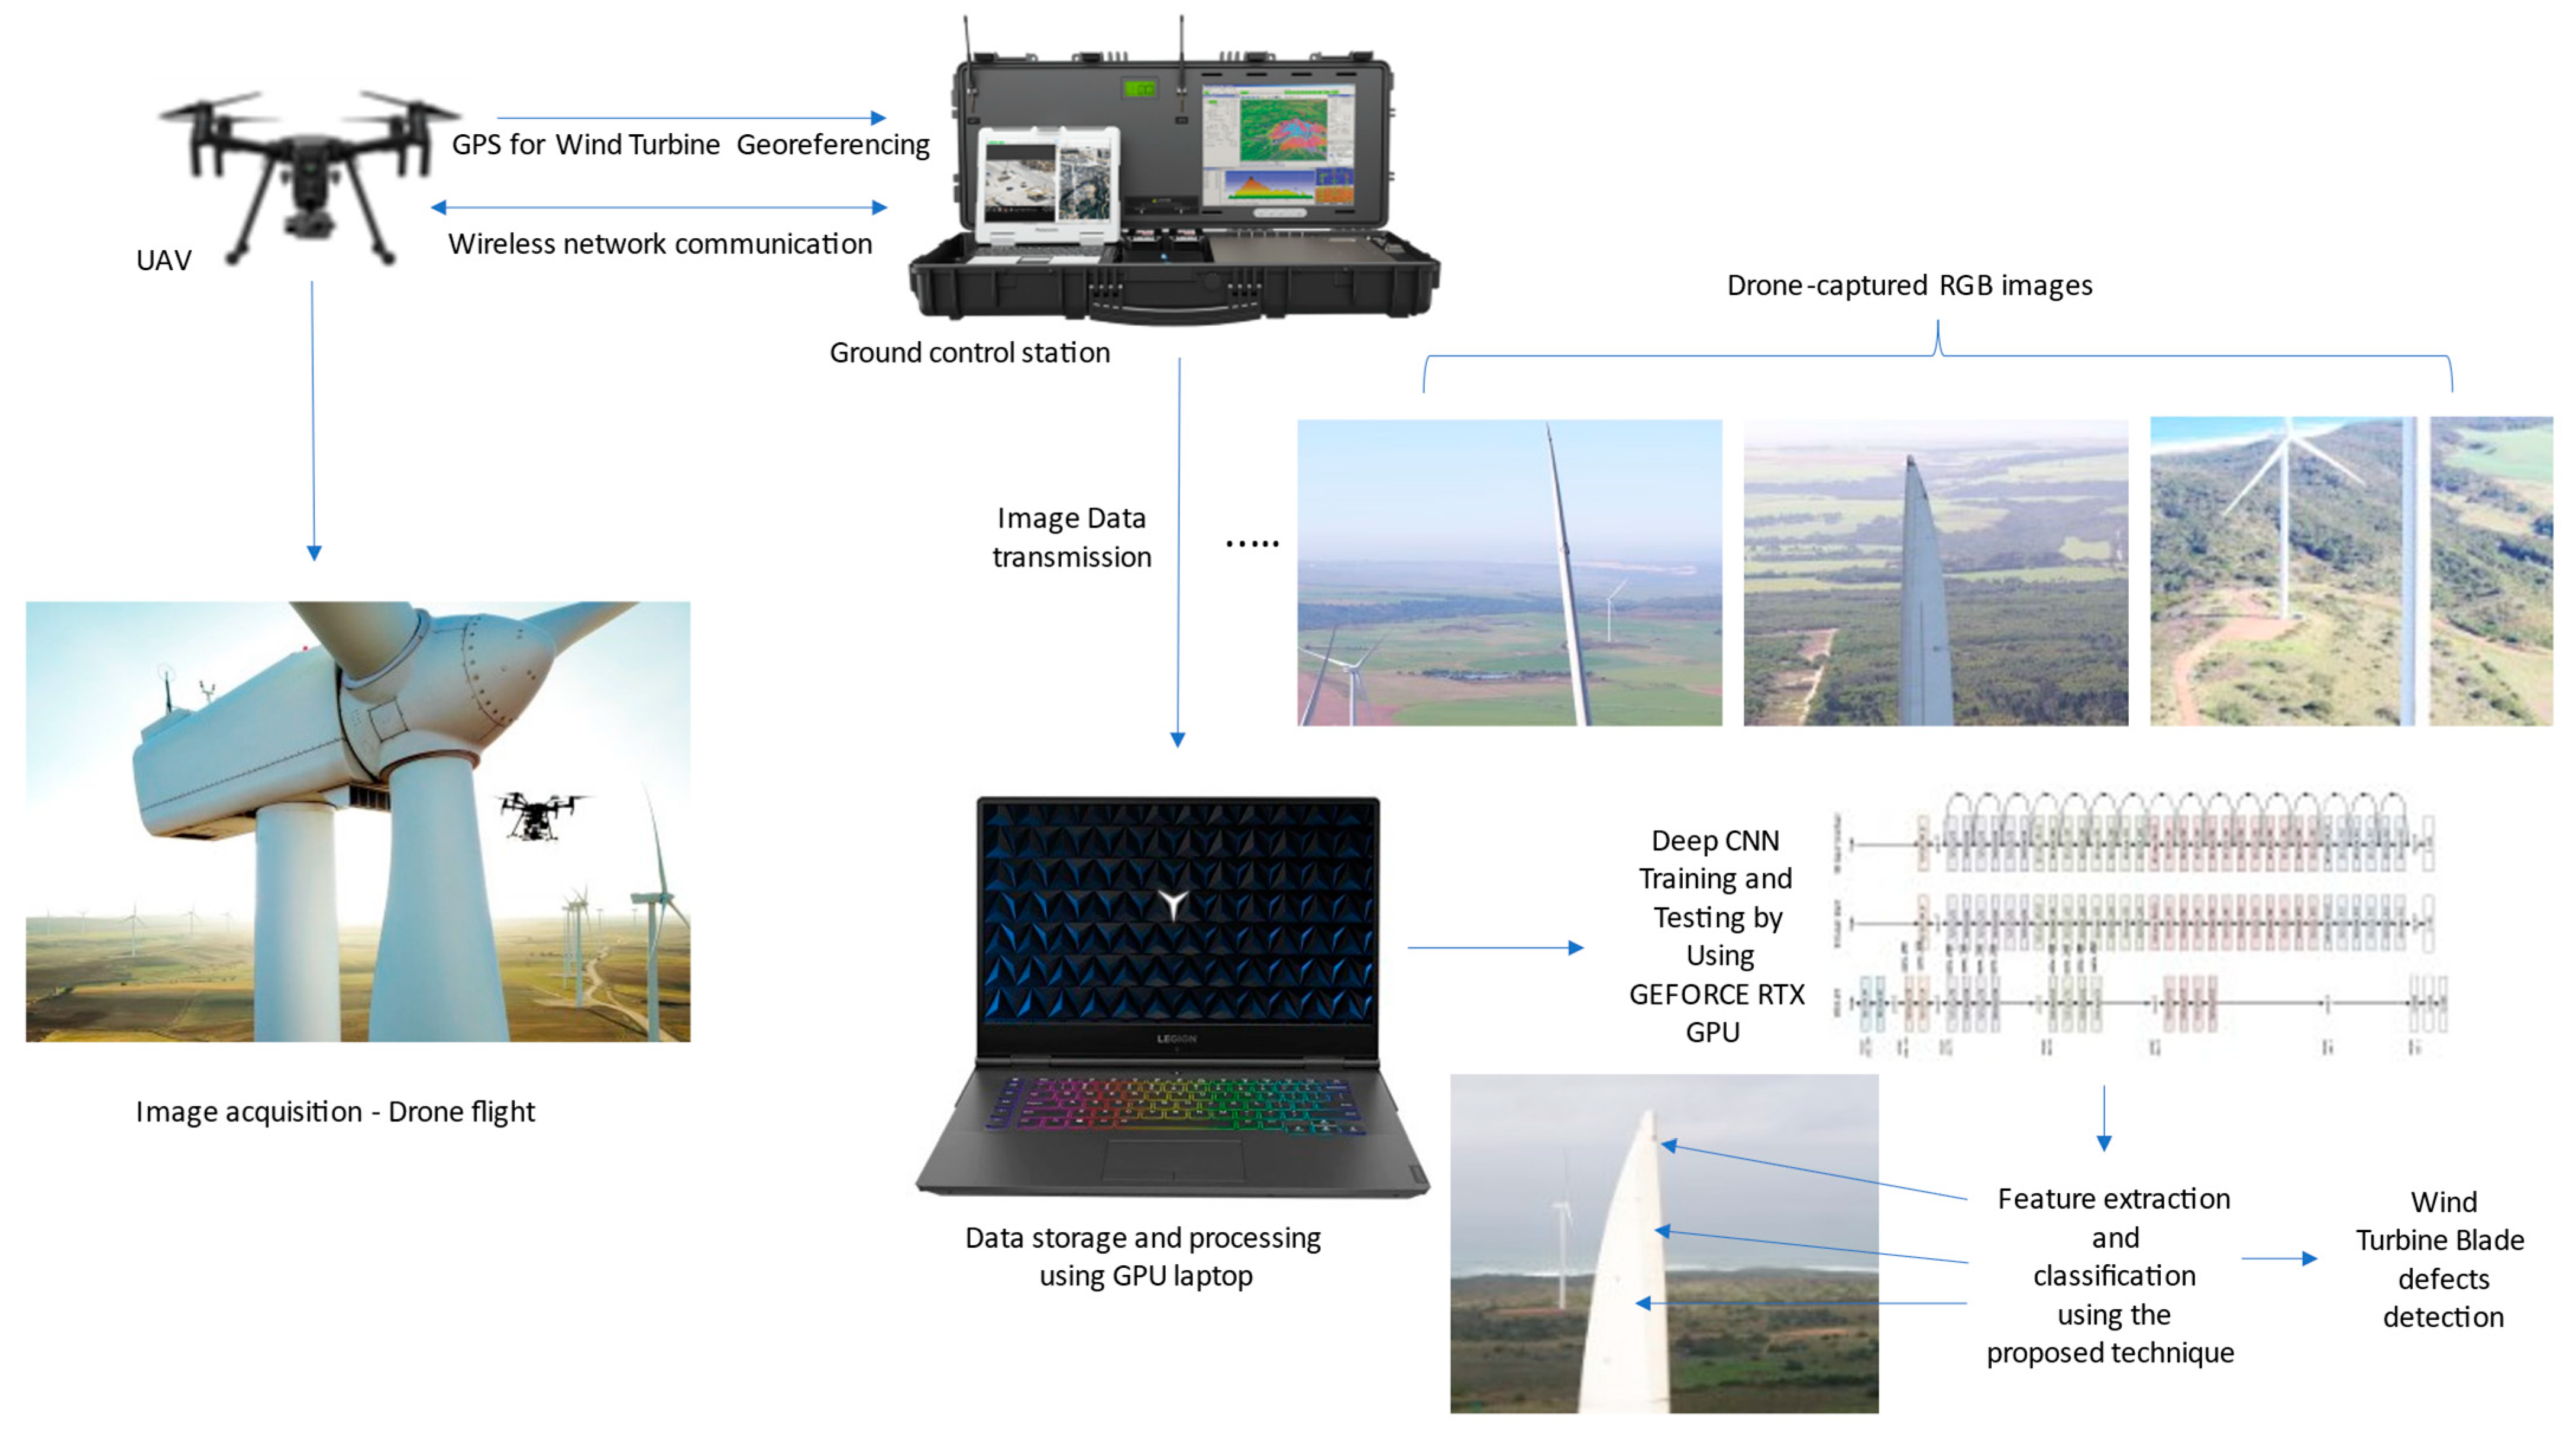
As part of the inspection system, the pilot positions the DJI Matrice 200V2/210V2 RPAS drone at the base of the turbine and sends it up to inspect the turbine autonomously. The drone takes off, and while in flight, it creates a three-dimensional model of the turbine in real-time using cameras and sensors mounted on the drone. The GPS-provided corresponding coordinates of the UAV are used to precisely geo-locate the wind turbine generator, which can be obtained from the Zenmuse L1 LiDAR sensor and the DJI ZenMuse X5S (FC6520) Imaging sensor mounted on the respective drone platforms.
The drone collects laser and RGB flight data on the turbine to aid in the creation of a more accurate model of the wind turbine. The data allows for the precise location and size of the damage to be determined.
Based on the WTG component and material identifier, the inspection results can categorize the damage. For the two-megawatt wind turbine, the process takes about 15 min. When the drone lands, the pilot picks it up, loads it into the back of the pickup truck, and drives to the next turbine to repeat the process. The pilot connects the drone and tablet to the internet at the end of the day, and all data is spontaneously transferred to the analytics stage, where the client or owner of the wind farm can access and interact with their data.
Figure 1 depicts the entire scheme developed for UAV-based inspection of a utility-scale wind farm.
The wind farm owner analyzes and processes the laser and RGB image data collected by drone inspections. To analyze and pinpoint defects on wind turbines, image analyses are performed using computer analytics and object detection technology. The computer vision platform runs a sequence of high-resolution RGB images of the Wind Turbine Generators, and it also generates a report on wind turbine blade anomaly detections using the software application platform.
Both laser and RGB images are processed in this article. The correlative image processing and analytics functions use these raw images to distinguish the features of wind turbine blade damage. Since there are limited, publicized accessible trained techniques for this type of experiment, the images are manually processed by labeling each image that contains wind turbine blade damage in order to prepare it for image training.
3.3. Typical Defects on Wind Turbine Blades
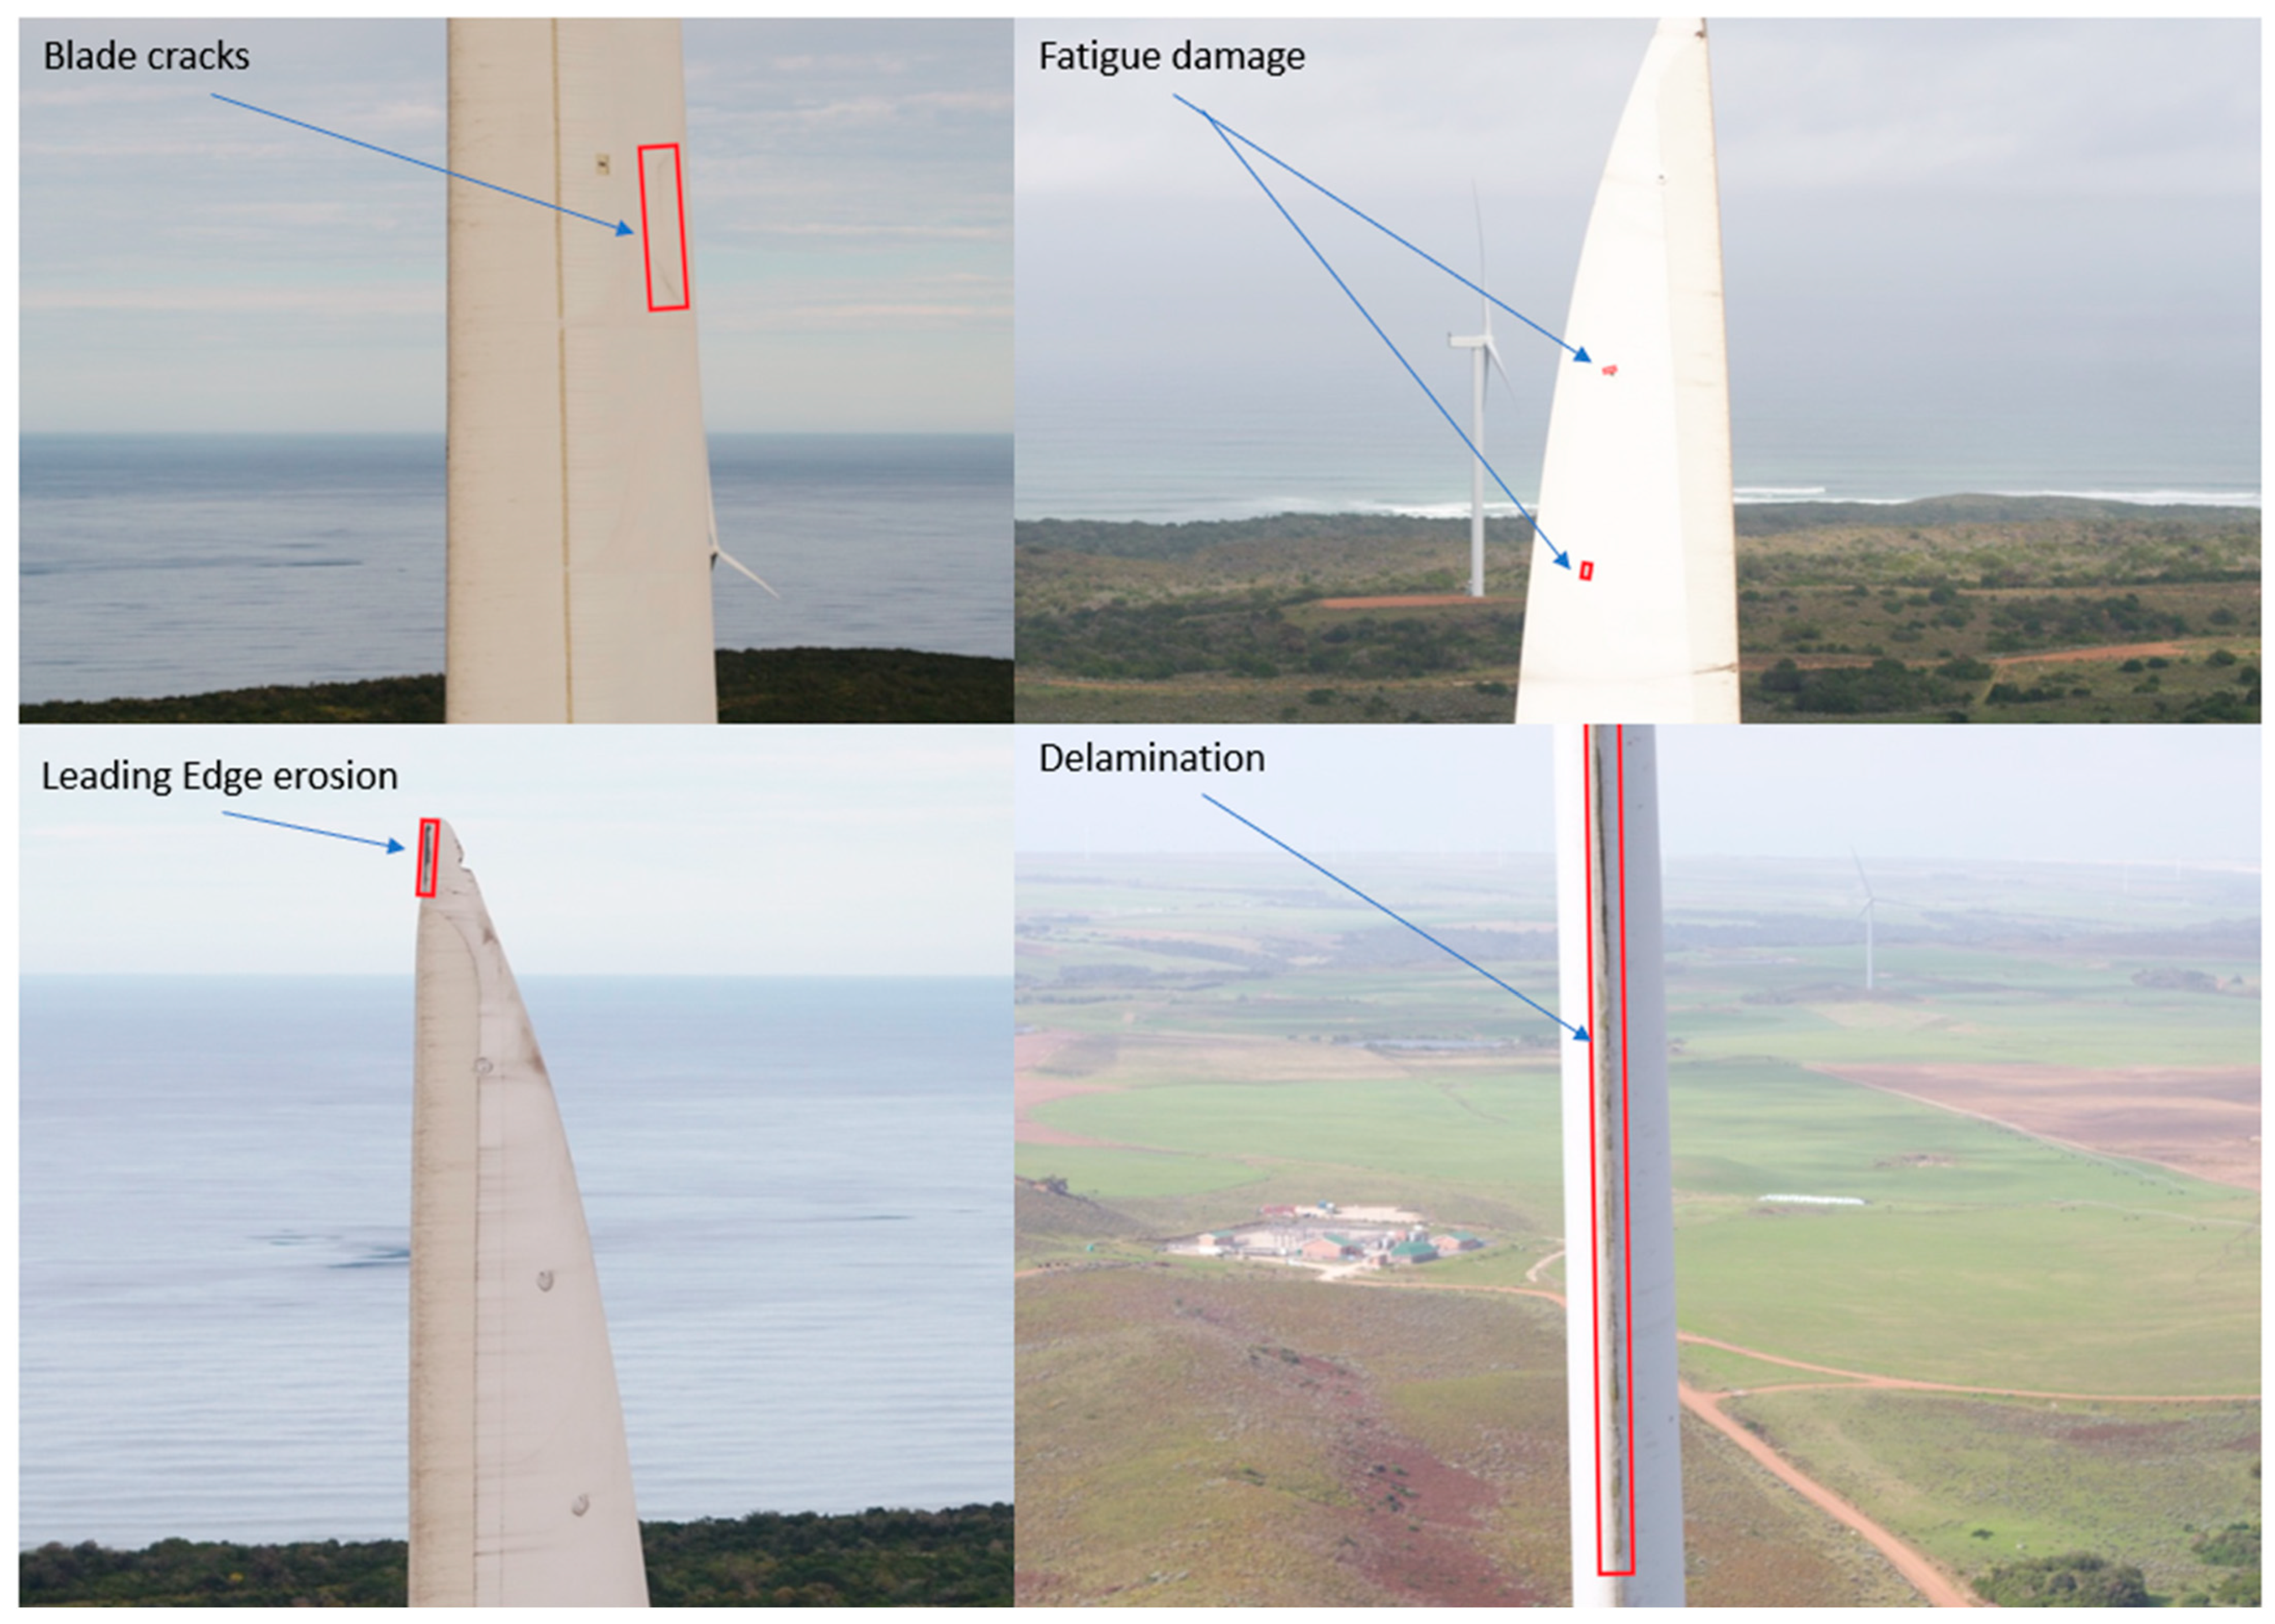
Wind farm operators can reduce the underperformance of wind energy facilities by being proactive in identifying, repairing, or replacing wind turbine blades using best practice preventative maintenance measures. Wind turbine blades of various types experience both similar and dissimilar types of defects. The commonly visible defects of wind turbine blades are investigated in this article. The part that follows discusses some of these wind turbine blade flaws in greater detail, and
Figure 2 illustrates the typical defects more clearly:
- (1)
Blade Cracks (along the suction or leading edge): Minor issues (cracks and chips), and crucial problems that can seriously harm the blade exterior, can both cause blade damage. Cracks can form as a result of a variety of factors, including high temperatures or extreme weather conditions. Nevertheless, they are typically found during routine inspections and are simple to fix. The same cannot be said for web cracks, which may not be visible at first. High blade stress causes internal cracks to form, necessitating a complex repair by highly qualified engineers.
- (2)
Delamination: Delamination can be caused by structural damage, blade stress, or a manufacturing defect. This entails splitting laminate layers and, at times, bending the blades 2 to 5 m at the tips. Blade cracks can also be caused by glue line delamination, most commonly on the trailing edge. This can have an effect on variables like blade strength and stability [
11,
12,
13].
- (3)
Leading Edge Erosion: This is perhaps the most prevalent and frequently discussed problem that has a significant impact on WTG performance and, as a result, energy output. Initially, turbines were not protected, and they began to deteriorate early in their warranty period. Leading edge protection (LEP) is now installed during the manufacturing stage, a practice which has recently changed. Before this, asset owners had to be aware of and plan for leading edge erosion prevention. In order to protect their investment, they can use blade protection tape, paint, or longer-lasting polyurethane shells [
11,
14].
- (4)
Lightning strike damage: Lightning strikes may be the most harmful blade problems. This is usually due to the remote locations and unstable environments in which WTGs operate. They are extremely vulnerable to problems caused by extreme weather conditions. The impact on the structure of the blade is noticeable, and repairs are very expensive, frequently resulting in long turbine downtime. It is critical that lightning protection systems (LPS) function properly and are inspected on a regular basis [
11,
12].
- (5)
Fatigue Damage: The word “fatigue” refers to the inability of a material to withstand cyclic applied loads that are fully tolerable when applied just once or a few times. A wind turbine is subjected to repetitive loads throughout its operational lifetime, which adds to the overall structure’s fatigue. These loads are primarily caused by wind and can be steady loads, transient loads brought on by sudden events like gusts, periodic loads brought on by wind shear, or stochastic loads brought on by turbulence. The cyclic starts and stops of the turbine, yaw error, yaw motion, resonance-induced loads from structure vibration, and gravity can all result in additional loads.
3.4. Proposed Technique for Wind Turbine Blade Defect Detection
- (1)
Proposed Model for Feature Extraction
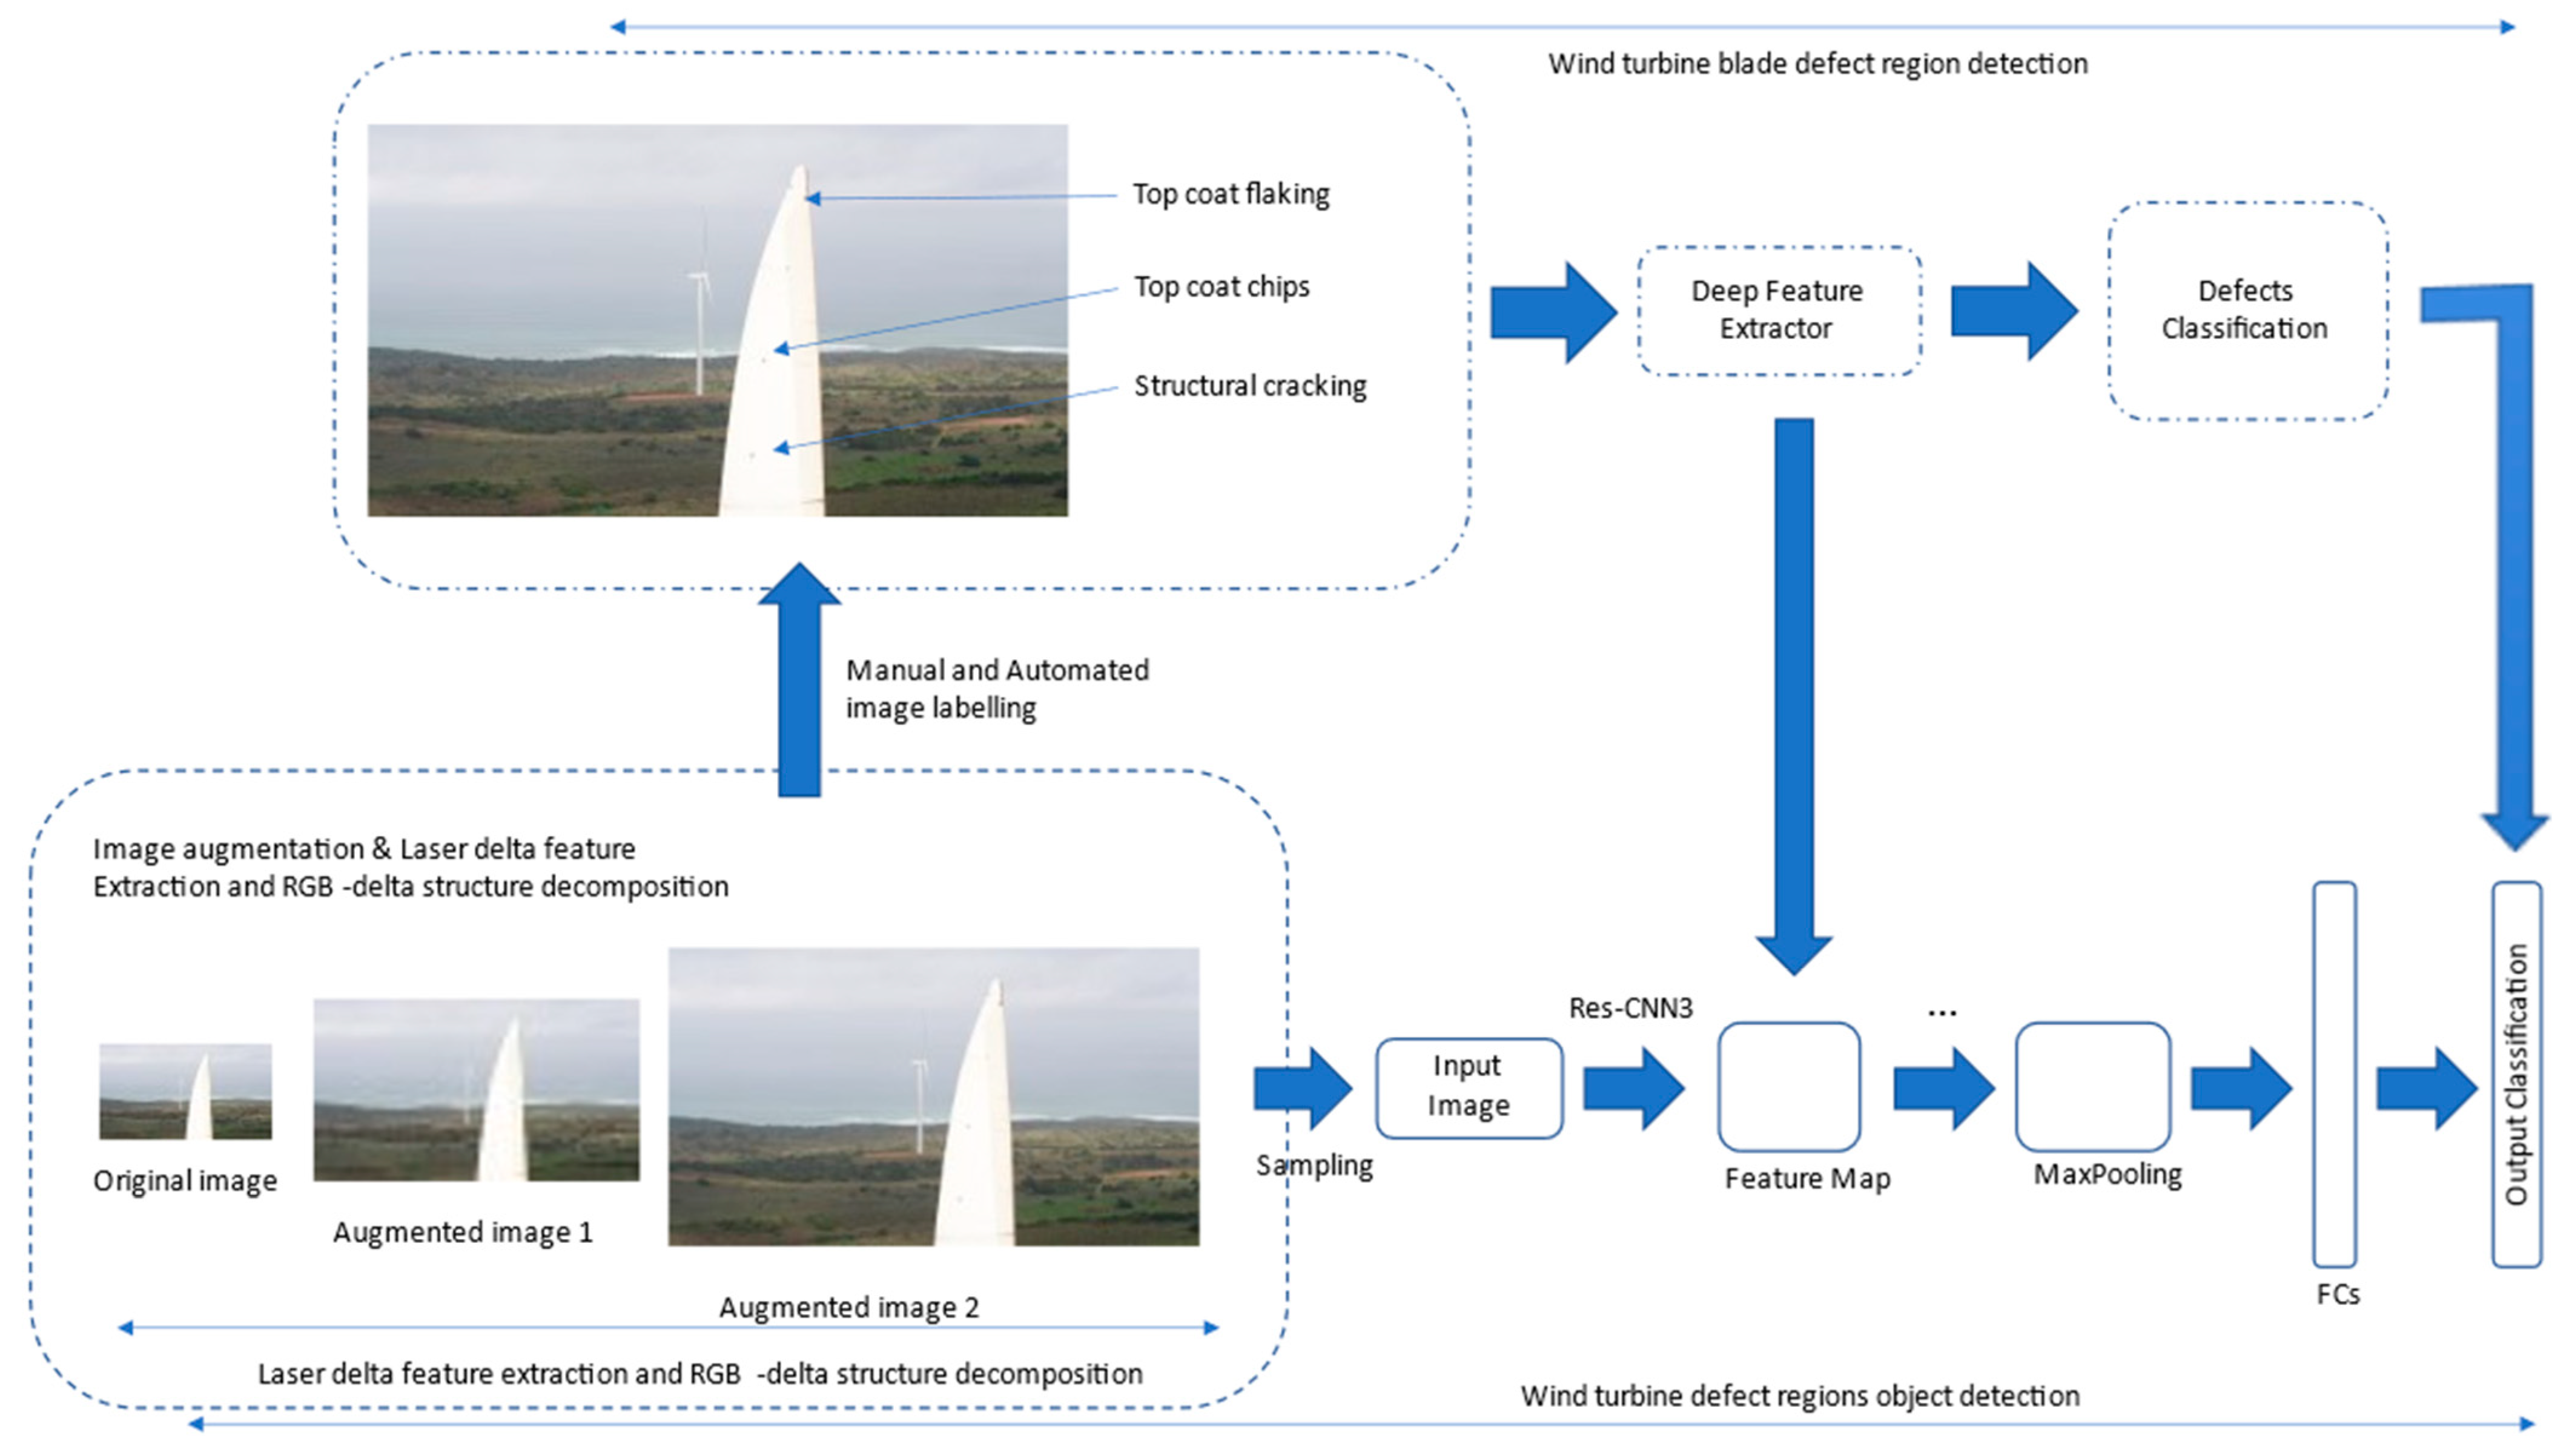
The Res-CNN3 is made up of three convolutional neural networks that are identical and concatenated, including residual blocks with skip connections. The neural network’s skip connections obtain activation from the top layer and direct it to a lower layer. As a result, it is possible to train deeper networks in a more straightforward manner [
15].
- (2)
Defect Classification Deep Neural Network
With the temporal channel complexity simplification design, we can process the wind turbine blade image through the same number of channels more than once, which increases handling efficiency for complex features and precision in identifying the RGB delta across the wind turbine blade image, while requiring the least amount of computational resources on the training and testing platforms. The applied technique is referred to as Temporal Channel Complexity Simplification (or TCCS).
- (3)
Defects Regions Detection of Wind Turbine Blades
This function of detecting defect regions in wind turbine blade images uses a bipartite approach to determine whether or not the wind turbine blade image contains RGB delta indicative of wind turbine blade defects. This commences detailed and definitive defect region object detection. Thus, wind turbine blade defects detection must come first. The wind turbine blade images’ anomaly detection process is refined thanks to the thoughtful creation and alteration of the suggested technique for defect classification and feature extraction. The first layers of the suggested feature extraction model are designed to extract the features of the image with the damaged wind turbine blade.
Because the drone flight across the individual wind turbine generators installed in the wind farm represents arrays of wind turbine blades rather than individual wind turbine blades, individual wind turbine blade objects do not typically occupy the entire image, but rather, multiple wind turbine blade objects connected across different WTGs in the wind farm do. This feature of the dataset inspired the design of the DCNN for detecting defects regions in wind turbine blades. Instead of relying on multi-scale computation due to some multi-scale features and stacking due to objects occupying the entire image, we rely on averaging and max-pooling.
Logistic regression log(∙) is used as the loss function. Thus, the following explanation can be given for the objective function:
p(∙) means the probability of the corresponding model.
- (4)
Defect region object detection of wind turbine blade
Once the wind turbine blade defects region detection has occurred, the more detailed and categorical defects region object detection follows. To accomplish this, the Selective Search (SS) algorithm [
16,
17] is used to place several RoIs in the laser image of the wind turbine blade. The laser and RGB region object, along with the laser and RGB image and the RoIs, will then be detected by the defects region object detection model. Finally, the proposed technique’s final output determines and predicts the classification and location of each RoI. In general, the scale of the complete laser and RGB image of the wind turbine blade is much larger than the scale of the defective wind turbine blade regions in the laser image. The RoIs in the input wind turbine blade laser image are predicted by the Selective Search (SS) algorithm. The defects of the wind turbine blade are located within the area of these RoIs via RGB delta. Selective Search is thus very useful for defects region object detection. Each RoI is represented by a Bounding Box based on the SS’s region proposal coordinates. The SS equation is as follows:
Figure 3 below outlines the framework of Res-CNN3 for defective wind turbine blades region object detection.
4. Proposed Experimental Approach
4.1. Dataset Details and Image Processing
The laser and RGB images of the wind turbine blades were acquired from a 110 MWp wind farm developed in Eastern Cape Province, South Africa. All the laser images were collected by the DJI Zenmuse XT2 Radiometric Imaging Sensor 19 mm 640 mounted on the DJI Matrice 200V2 RPAS drone and the DJI Matrice 210V2 RPAS drone between 11:00 AM and 5:00 PM during the fair days of October. The following minimum safe flying conditions are a prerequisite to each UAS autonomous flight, and no flights were conducted under these conditions: wind speed higher than 12 m/s; wind gust over 15 m/s; rain or electric storm present; temperatures over 50 °C or under 0 °C; inadequate light conditions (normal flying should be done between 1 h after sunrise and 1 h before sunset); there are people accessing the area to be inspected and no physical barriers are installed to assure safe conditions under the area to be inspected; there is a risk or damage in the installations or environment that has been identified and not remediated. This is important so as to meet the criteria described in IEC 61400 [
18].
Each image is 5280 × 2970 in size and includes RGB image formats and laser images. The bit depth is 24, and the resolution is 72 dpi on both the horizontal and vertical axes. There are 14,892 of these RGB images altogether. All of the images show different wind turbine generators with various wind turbine blade defects and multiple wind turbine blades or wind farm subfields as summarized in
Table 1. This can be used to diagnose and support systemic wind turbine blade defects and warranty claims for damaged blades.
4.2. Experimental Setup
Several deep learning models were trained, tested, and evaluated during the experiments for efficiency observations. Inception-v3 [
19] is a sophisticated and widely used method that outperforms the majority of inception networks. DarkNet-53 is a deep learning algorithm with high detection accuracy that is gaining prevalence in utilization for state-of-the-art object detection challenges [
20]. InI-WRN-16-8-square-3 is a wide residual network backbone application of the InI module that includes square G-filters for CNN structure abstraction [
21,
22]. The InI-PyramidNet-mix-5 CNN technique is the result of applying the InI module to the pyramidal residual network backbone [
21,
23,
24], and it includes mixed G-filters for structural modeling of CNNs. Additionally, GoogleNet [
25] and YOLO [
26] were tested and evaluated for wind turbine blade defect detection.
Individual model performance was used to train the selected deep learning models. All the models were trained and evaluated five times, and the average achievement was described and detailed to ensure that the results were accurate. Structural cracks, Fatigue damage, Leading Edge erosion, and Delamination are the most common anomaly types of wind turbine blade defects detected during experiments.
4.3. Evaluation Metrics
Precision (P) and recall (R) were the evaluation metrics chosen to assess the performance of the experimental methods, including the proposed method (R). The efficiency of the defective wind turbine blade region object detection must be carefully tested and analyzed. Average Precision (AP) is used in this article to represent the 11 interpolated points on precision and recall curves [
26]. It is also used for performance evaluation of associated tests with Intersection over Union (IoU) 50% for the proposal Bounding Box (BBox) and labeled BBox. The mean Average Precision mAP is used to reflect the average classification performance of the models for all classes. Furthermore, the average test time of each image (
) is used to assess the efficacy of defective region object detection. The following are the formulae for the evaluation metrics used in the experiments:
where
is described by the total test time (
) and iterations
.
where TP is True Positives and FP is False Positives.
where FN is False Negatives.
4.4. Parameter Setting
The proposed model’s parameters are set in a very specific order, which is determined as part of the experimental process. The momentum is used to accelerate the convergence of the designed loss function [
27]. The model requires and employs weight decay given a small assigned value to reduce training error. The proposed model’s training process ends after 700 epochs because the accuracy no longer improves. The parameter settings are summarized in
Table 2 below.
5. Results and Discussion
Here we conduct comprehensive ablation studies to uncover Res-CNN3’s potential in wind turbine blades defects detection from RGB images. These ablations are based on the residual network’s object detection performances on the entire wind farm’s wind turbine blade defects dataset. The backbones in each ablation experiment are the individual Resnet models with different numbers of parameters, and an improvement based on the TCCS approach. We ablate the backbones (i.e., ResNet-34 [
17], ResNet-101 [
17] etc.) of Res-CNN3 to observe the object detection performances in Precision, Recall, mAP50 (%) and Average test time (s). All the following ablation study experiments are conducted on the complete training dataset.
The experimental results in
Table 3 show that the Res-CNN3 wind turbine blades defect detection model has a mAP of 80.6%, a parameter size of 51.7 M, and an average test time of 0.036 s. Compared with ResNet-50 + TCCS + SS, the number of parameters is increased by 26.1 M, the average test time of each image decreases by 0.006 s, and the precision decreases by 0.7%. This evidently shows that the addition of TCCS + SS to ResNet-50 certainly improves in detection accuracy performance, but slightly degrades in detection test time, which is a unique scenario that calls for a selection of a technique based on a compromise in one aspect of the technique’s performance. Each simplification strategy tweaks the configuration of channels and the number of parameters on the basis of the original and can also ensure that the loss of accuracy is not large.
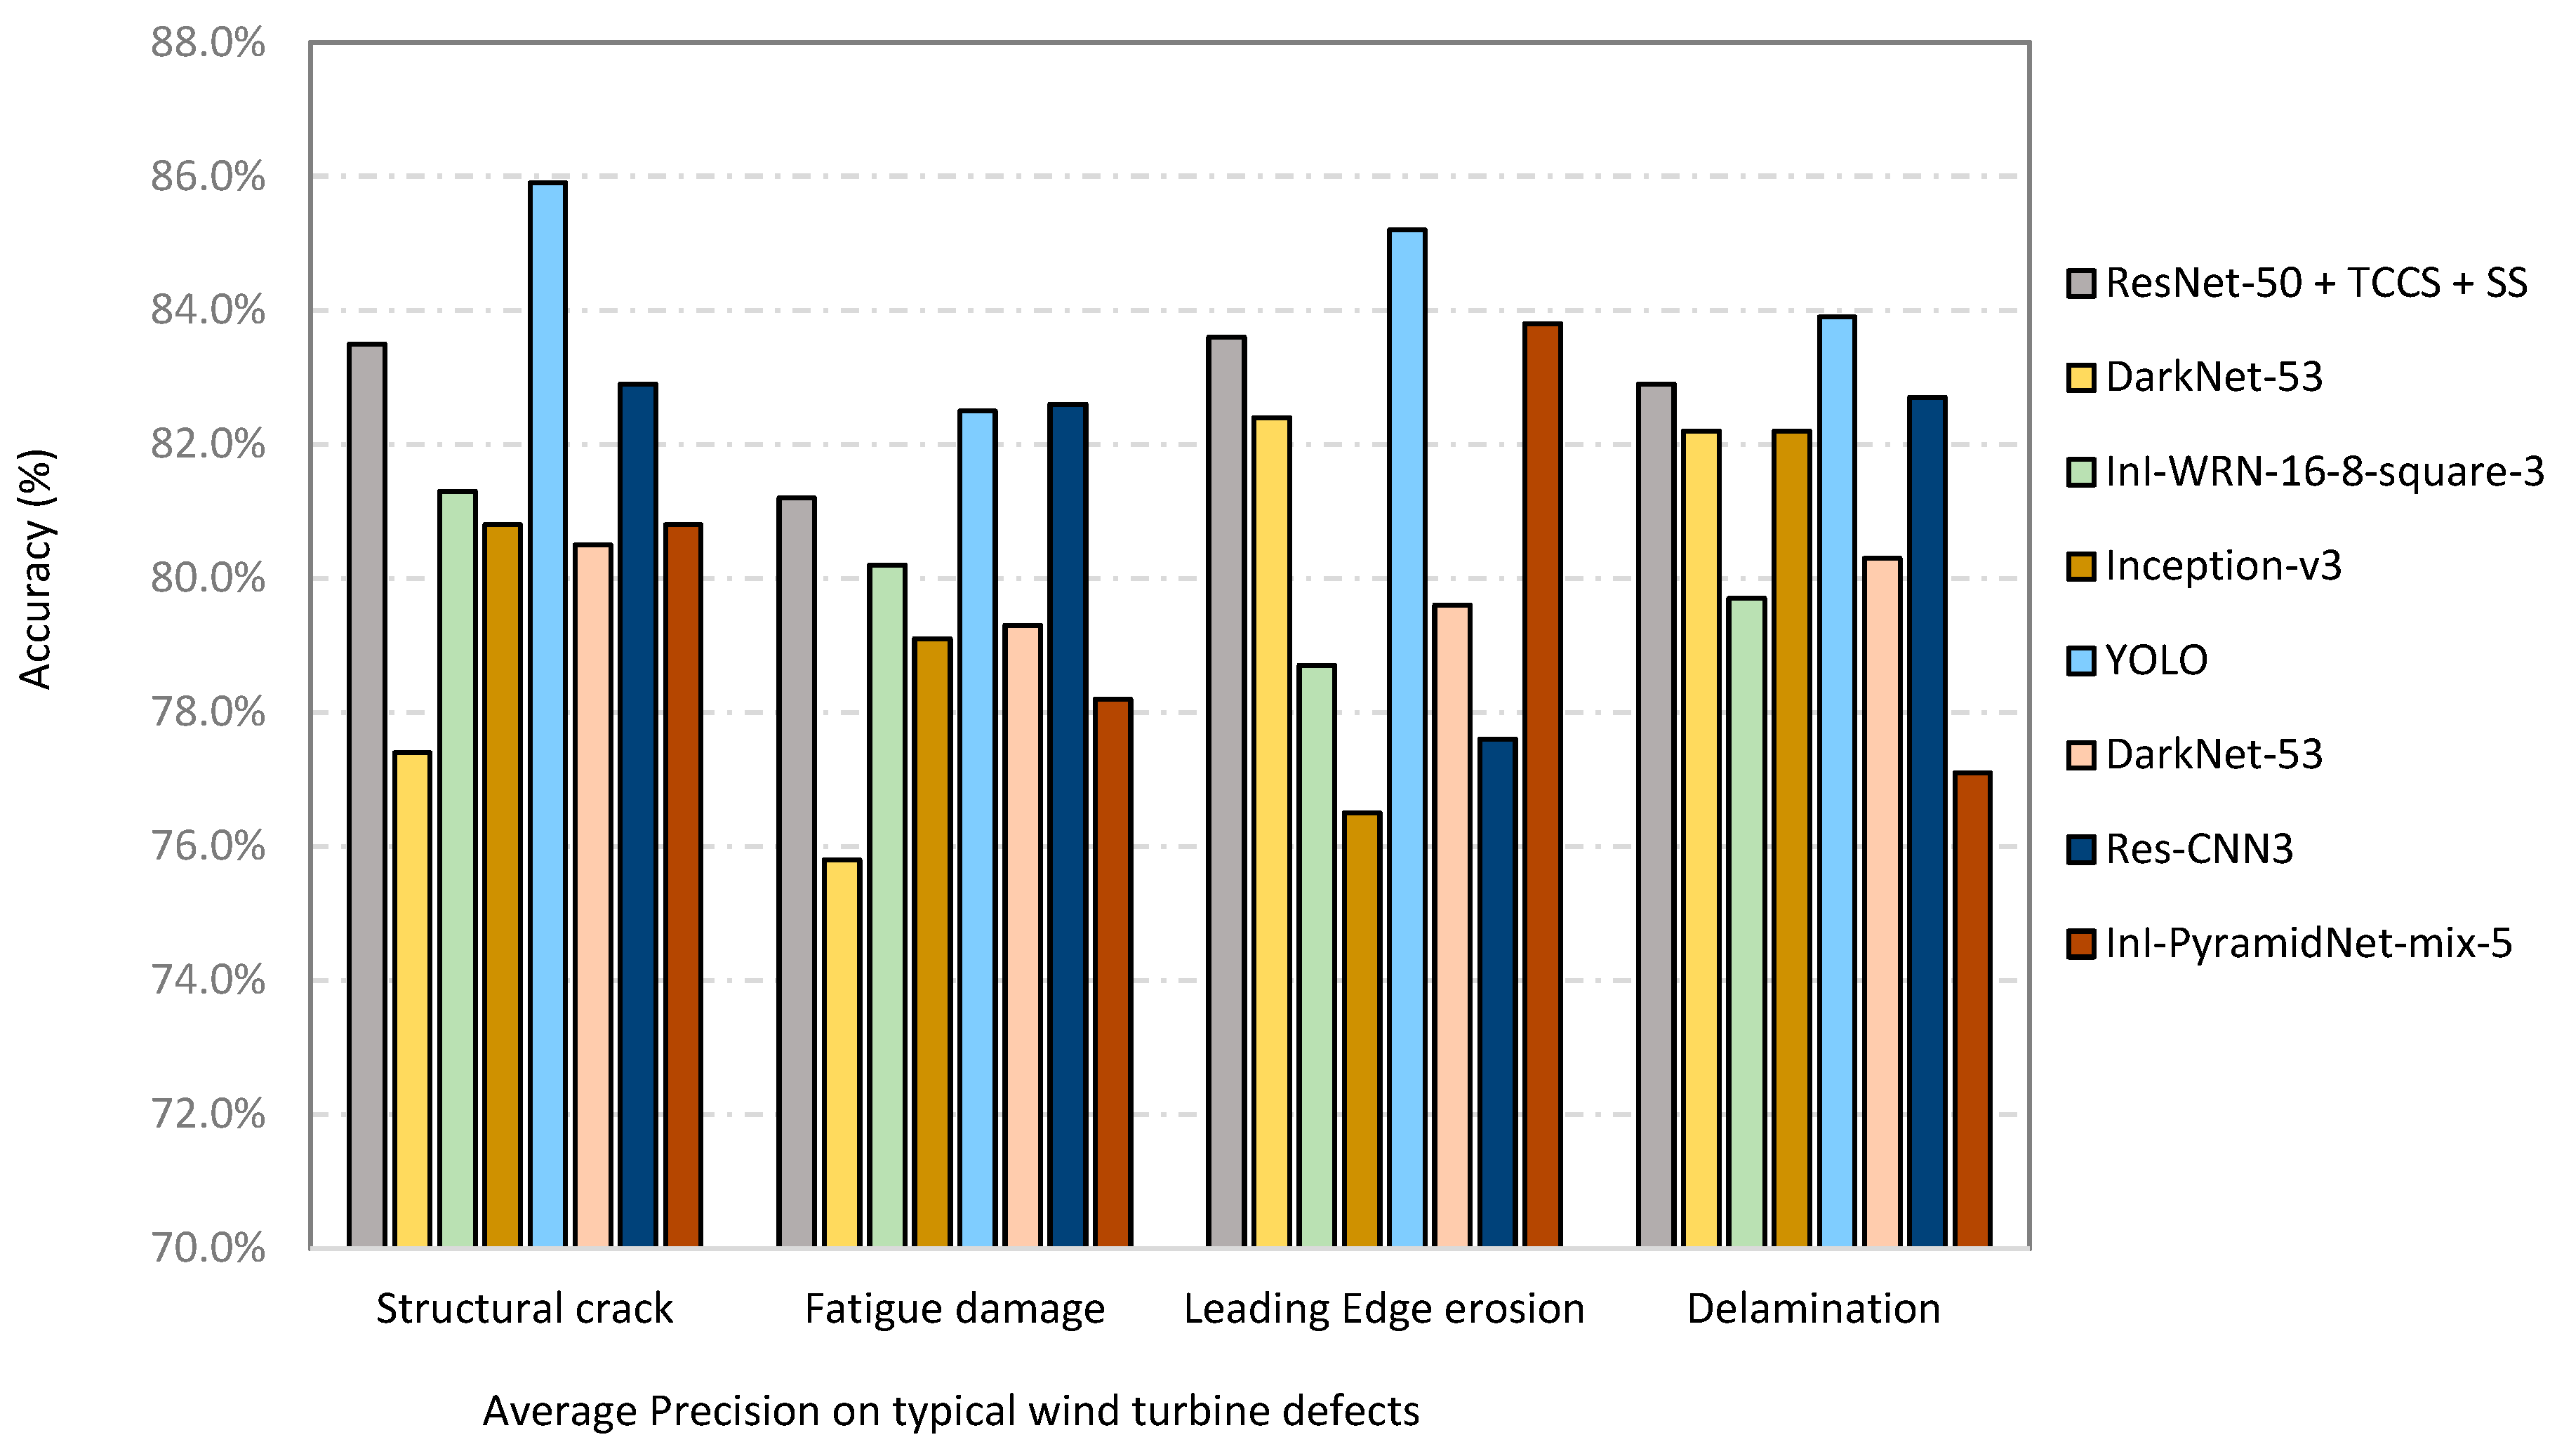
In
Figure 4 below, it appears that most of the methods, on average, perform terribly in the categories of Fatigue damage and Leading Edge erosion. This can be explained by the fact that these categories of defects involve small object detection. The topic of small object detection is usually controversial and challenging. The primary issue is that fine target defects have a limited number of pixels, making it challenging to extract useful feature information [
15,
28].
Figure 4 displays the outcomes of various algorithms on the dataset for defective wind turbine blades. The target detection algorithms all deliver satisfactory results for large target defects. The detection performance of small targets, however, still has a significant gap when compared to that of large targets. The majority of algorithms seriously miss small target defects in the second and third rows of images. It is challenging to extract the useful features of small target defects because they have few features. In terms of Structural cracks, Leading Edge erosion, and Delamination defects detection, YOLO performs remarkably well. It also achieves good detection performance for both big and small target defects.
Following YOLO, the most promising technique is the ResNet-50 + TCCS + SS, which performs exceptionally well on Structural cracks, Leading Edge erosion and Delamination defects detection in a like manner, but with a lower confidence score, compared to YOLO. Moreover, ResNet-50 + TCCS + SS outperforms Res-CNN3 in Structural cracks, Leading Edge erosion and Delamination defects detection accuracy, but not in Fatigue damage detection accuracy. However, Res-CNN3 still outperforms ResNet-50 + TCCS + SS in all the defects category detection in terms of average testing time. Overall, the observation of the performance dynamics between Res-CNNN3 and ResNet-50 + TCCS + SS, clearly demonstrates the unique value of ablation studies in object detection training, testing, and analyses [
29]. These studies certainly offer one the ability to carefully optimize and critically analyze the costs, benefits, and economics of each detection technique in order to recognize the most suitable technique based on application, implementation, and purpose.
6. Conclusions
Inspired by residual neural networks and concatenated CNNs, this study proposes a ResNet-based defect detection algorithm for wind turbine blades, together with an integration of the temporal channel complexity simplification approach. By means of multiple experiments, it is demonstrated that the YOLO model has the characteristics of high real-time performance and stable performance in the wind turbine blade defect detection pipeline. The accuracy of YOLO is higher in all categories of defect detection compared to the proposed model in this work, except for the detection of fatigue damage; however, the detection speed of Res-CNN3 is significantly higher than all other methods. Compared with other methods, YOLO improves the detection accuracy indicators Average Precision and mAP by 1.6% in the selected dataset. The good performance of the proposed model Res-CNN3 can be attributed to learning critical feature information well and at a rapid pace. The improved model of ResNet-50 + TCCS + SS is proficient in detecting low-resolution and unclear features of wind turbine blades, significantly improving the detection of small target defects; however, the precision improvement does not translate to an improvement in detection speed. Therefore, a trade-off between detection speed and accuracy has to be carefully assessed in selecting the most convenient technique. Recommendations for future research are to technically investigate how the observations in the experimental results can help in identifying the root causes of the different defects and failures in wind turbine blades. Furthermore, the authors recommend applying this strategy to the identification of corrosion and loose nuts and bolts in wind turbine towers, using detailed dimensional data of wind turbine blade and tower defects.
Author Contributions
K.M. was involved in the conceptualization, data validation, investigation, and outlining of the experimental methodology of the research work presented. A.H. made contributions in the formal analysis, writing review, and editing of the draft article. He was also heavily embedded in the supervision and project administration of the presented research work. T.S. made contributions in the conceptualization of the presented investigation. Furthermore, he contributed to the formal analysis, research supervision, writing review, and editing of the draft article. All authors have read and agreed to the published version of the manuscript.
Funding
This research was funded by the South African Space Agency (SANSA) under the “PhD Bursary program”.
Institutional Review Board Statement
Not applicable.
Informed Consent Statement
Not applicable.
Data Availability Statement
The data presented in this study are available on request from the corresponding author. The data are not publicly available due to restrictions regarding operating company privacy.
Acknowledgments
We thank the University of Johannesburg for providing the needed resources from the Institute of Intelligent Systems that supported the experimental phase of this research work. Additional thanks go to SANSA for providing the funding needed to help make this research work a success.
Conflicts of Interest
The authors declare no conflict of interest. The funders had no role in the design of the study; in the collection, analyses, or interpretation of data; in the writing of the manuscript; or in the decision to publish the results.
References
- Duncombe, J.U. Infrared navigation—Part I: An assessment of feasibility. IEEE Trans. Electron. Devices 1959, ED–11, 34–39. [Google Scholar]
- Cheng, X.; Shi, F.; Liu, X.; Zhao, M.; Chen, S. A Novel Deep Class-Imbalanced Semisupervised Model for Wind Turbine Blade Icing Detection. IEEE Trans. Neural Netw. Learn. Syst. 2022, 33, 2558–2570. [Google Scholar] [CrossRef] [PubMed]
- Moreno, S.; Peña, M.; Toledo, A.; Treviño, R.; Ponce, H. A New Vision-Based Method Using Deep Learning for Damage Inspection in Wind Turbine Blades. In Proceedings of the 2018 15th International Conference on Electrical Engineering, Computing Science and Automatic Control (CCE), Mexico City, Mexico, 5–7 September 2018; pp. 1–5. [Google Scholar] [CrossRef]
- Wang, L.; Zhang, Z.; Xu, J.; Liu, R. Wind turbine blade breakage monitoring with deep autoencoders. IEEE Trans. Smart Grid 2018, 9, 2824–2833. [Google Scholar] [CrossRef]
- Parlange, R. Vision-based autonomous navigation for wind turbine inspection using an unmanned aerial vehicle. In Proceedings of the 10th International Micro-Air Vehicles Conference, Melbourne, Australia, 22–23 November 2019. [Google Scholar]
- Gu, W.; Hu, D.; Cheng, L.; Cao, Y.; Rizzo, A.; Valavanis, K.P. Autonomous Wind Turbine Inspection using a Quadrotor. In Proceedings of the 2020 International Conference on Unmanned Aircraft Systems (ICUAS), Athens, Greece, 1–4 September 2020; pp. 709–715. [Google Scholar] [CrossRef]
- Moolan-Feroze, O.; Karachalios, K.; Nikolaidis, D.N.; Calway, A. Improving drone localisation around wind turbines using monocular model-based tracking. In Proceedings of the 2019 International Conference on Robotics and Automation (ICRA), Montreal, QC, Canada, 20–24 May 2019; pp. 7713–7719. [Google Scholar]
- Guo, H.; Cui, Q.; Wang, J.; Fang, X.; Yang, W.; Li, Z. Detecting and positioning of wind turbine blade tips for uav-based automatic inspection. In Proceedings of the IGARSS 2019–2019 IEEE International Geoscience and Remote Sensing Symposium, Yokohama, Japan, 28 July–2 August 2019; pp. 1374–1377. [Google Scholar]
- Clark, R.A.; Punzo, G.; MacLeod, C.N.; Dobie, G.; Summan, R.; Bolton, G.; Pierce, S.G.; Macdonald, M. Autonomous and scalable control for remote inspection with multiple aerial vehicles. Robot. Auton. Syst. 2017, 87, 258–268. [Google Scholar] [CrossRef]
- Inside Unmanned Systems. Cyberhawk Announces Wind Turbine Inspection Service; Inside Unmanned Systems: Red Bank, NJ, USA, 2015. [Google Scholar]
- Mishnaevsky, L., Jr. Root Causes and Mechanisms of Failure of Wind Turbine Blades: Overview. Materials 2022, 15, 2959. [Google Scholar] [CrossRef] [PubMed]
- Wang, W.; Xue, Y.; He, C.; Zhao, Y. Defect Types and Mechanism of Wind Turbine Blades. Encyclopedia. Available online: https://encyclopedia.pub/entry/27751 (accessed on 5 March 2023).
- Tracy, J.; Bosco, N.; Dauskardt, R. Encapsulant adhesion to surface metallization on photovoltaic cells. IEEE J. Photovolt. 2017, 7, 1635–1639. [Google Scholar] [CrossRef]
- Banaszek, A.; Łosiewicz, Z.; Jurczak, W. Corrosion influence on safety of hydraulic pipelines installed on decks of contemporary product and chemical tankers. Pol. Marit. Res. 2018, 25, 71–77. [Google Scholar] [CrossRef]
- Li, X.; Li, W.; Yang, Q.; Yan, W.; Zomaya, A.Y. Edge-Computing-Enabled Unmanned Module Defect Detection and Diagnosis System for Large-Scale Photovoltaic Plants. IEEE Internet Things J. 2020, 7, 9651–9663. [Google Scholar] [CrossRef]
- Uijlings, J.R.R.; van de Sande, K.E.A.; Gevers, T.; Smeulders, A.W.M. Selective search for object recognition. Int. J. Comput. Vis. 2013, 104, 154–171. [Google Scholar] [CrossRef]
- He, K.; Zhang, X.; Ren, S.; Sun, J. Deep Residual Learning for Image Recognition. In Proceedings of the 2016 IEEE Conference on Computer Vision and Pattern Recognition (CVPR), Las Vegas, NV, USA, 27–30 June 2016; pp. 770–778. [Google Scholar] [CrossRef]
- IEC 61400-1:2019; Wind Energy Generation Systems—Part 1: Design Requirement. International Electrotechnical Commission (IEC): Geneva, Switzerland, 2019.
- Szegedy, C.; Vanhoucke, V.; Ioffe, S.; Shlens, J.; Wojna, Z. Rethinking the Inception Architecture for Computer Vision. In Proceedings of the 2016 IEEE Conference on Computer Vision and Pattern Recognition (CVPR), Las Vegas, NV, USA, 27–30 June 2016; pp. 2818–2826. [Google Scholar] [CrossRef]
- Redmon, J.; Farhadi, A. YOLOv3: An incremental improvement. arXiv 2018, arXiv:1804.02767. [Google Scholar]
- Hu, Y.; Wen, G.; Luo, M.; Dai, D.; Cao, W.; Yu, Z.; Hall, W. Inner-Imaging Networks: Put Lenses Into Convolutional Structure. IEEE Trans. Cybern. 2021, 52, 8547–8560. [Google Scholar] [CrossRef] [PubMed]
- Zagoruyko, S.; Komodakis, N. Wide residual networks. In Proceedings of the BMVC, York, UK, 19–22 September 2016; pp. 87.1–87.12. [Google Scholar]
- Han, D.; Kim, J.; Kim, J. Deep pyramidal residual networks. In Proceedings of the 2017 IEEE Conference on Computer Vision and Pattern Recognition (CVPR), Honolulu, HI, USA, 21–26 July 2017; pp. 6307–6315. [Google Scholar]
- He, K.; Zhang, X.; Ren, S.; Sun, J. Spatial pyramid pooling in deep convolutional networks for visual recognition. IEEE Trans. Pattern Anal. Mach. Intell. 2015, 37, 1904–1916. [Google Scholar] [CrossRef] [PubMed]
- Szegedy, C.; Liu, W.; Jia, Y.; Sermanet, P.; Reed, S.; Anguelov, D.; Erhan, S.; Vanhoucke, V.; Rabinovich, A. Going deeper with convolutions. In Proceedings of the 2015 IEEE Conference on Computer Vision and Pattern Recognition (CVPR), Boston, MA, USA, 7–12 June 2015; pp. 1–9. [Google Scholar] [CrossRef]
- Redmon, J.; Divvala, S.; Girshick, R.; Farhadi, A. You Only Look Once: Unified, Real-Time Object Detection. In Proceedings of the 2016 IEEE Conference on Computer Vision and Pattern Recognition (CVPR), Las Vegas, NV, USA, 27–30 June 2016; pp. 779–788. [Google Scholar]
- Botev, A.; Lever, G.; Barber, D. Nesterov’s accelerated gradient and momentum as approximations to regularised update descent. In Proceedings of the 2017 International Joint Conference on Neural Networks (IJCNN), Anchorage, AK, USA, 14–19 May 2017; pp. 1899–1903. [Google Scholar]
- Xu, Q.; Lin, R.; Yue, H.; Huang, H.; Yang, Y.; Yao, Z. Research on small target detection in driving scenarios based on improved YOLO network. IEEE Access 2020, 8, 27574–27583. [Google Scholar] [CrossRef]
- Masita, K.; Hasan, A.; Shongwe, T. 75MW AC PV Module Field Anomaly Detection Using Drone-Based IR Orthogonal Images With Res-CNN3 Detector. IEEE Access 2022, 10, 83711–83722. [Google Scholar] [CrossRef]
| Disclaimer/Publisher’s Note: The statements, opinions and data contained in all publications are solely those of the individual author(s) and contributor(s) and not of MDPI and/or the editor(s). MDPI and/or the editor(s) disclaim responsibility for any injury to people or property resulting from any ideas, methods, instructions or products referred to in the content. |
© 2023 by the authors. Licensee MDPI, Basel, Switzerland. This article is an open access article distributed under the terms and conditions of the Creative Commons Attribution (CC BY) license (https://creativecommons.org/licenses/by/4.0/).


