1. Introduction
Due to its natural beauty, Candoglia marble has been used over time as an ornamental stone for the construction of various prestigious buildings since Roman times [
1]. The year 1386 is when the construction of the Milan Cathedral began, and as a building material, Candoglia marble was used (
Figure 1) [
1].
The Candoglia quarries (northwest of Italy, in the Piemonte Region) thus become part of the history of the Milan Cathedral. The first ancient work in which Candoglia marble was used probably saw the exploitation of the strip of marble located at a lower altitude, i.e., just above the Toce River. With the construction of the Milan Cathedral, however, a more massive extraction began through the opening of new fronts [
2,
3].
For approximately seven centuries, pink-gray veined white marble has represented the main material used in masonry, decoration, the cover of pillars, roofing, paving and statues. Other rock types also used are gneissic stones for pillars. Even if the total amount of marble production per year is limited and addressed to maintenance requests, the need for quality marble, intact, without cracks and without pyritic inclusions, has involved the search for such properties along the vein that crosses the Mergozzo Valley; in recent decades, the old open pit quarries at the top of the mountain have been abandoned, and the exploitation has been concentrated in the adit of the Cava Madre. Due to the relevant height of the external sidewalls in the embedding rocks and the strong demand for stability and safety in the long term, studies related to rock properties have been carried out, as well as the implementation of new support systems.
In 1680, the Cava Madre cavern was opened, and in the final period of the last century, only the Cava Madre remained active in the area of Candoglia. Over the last 20 years, the extraction of marble in this cavern has taken place only in the entrance area, where the span was first enlarged (going from a width of approximately 12 m to a width of approximately 22 m), shaping it into the right wall, and then lowered by two steps compared to the situation present at the end of the nineties of the last century; before proceeding with the shaping and widening of the right wall, three old strut beams were demolished; furthermore, before proceeding with the subsequent lowering of the foot of the cavern, three new massive horizontal concrete strut beams were created to contrast the lateral walls in the entrance area (
Figure 2). Moreover, approximately 60 tendons (length varying from 20 to 40 m, 7 strands) are distributed on both walls and each of them is capable of transmitting a force of approximately 50 tons on the walls [
4].
The extraction of marble takes place by isolating benches of relevant dimensions (5.5 m in height, variable width and depth) and extracting them from the mountain. Further cuts allow blocks to be isolated and then transported to the cutting plant located further down the valley, on the same side of the mountain. The preferred cutting technique involves the use of diamond wire.
The quarry is characterized by very large dimensions in the entrance area (width 20–22 m, depth 45 m, height 45 m) and a high state of stress induced by the geology of the zone (the Insubric Line of the Alpine range is present at a short distance). Over the years, extensive studies of the stress and strain state of the rock mass surrounding the cavern have been necessary to confirm the suitability of the planned exploitation plans. It is not possible to discover alternate sites from which to extract marble with the same characteristics and qualities.
A detailed monitoring system of the geomechanical behavior of the cavern, and in particular in the entrance area, has been developed over time. This system allows the stress and strain states in the rock surrounding the cavern and in the realized support structures to be continuously monitored. Moreover, these measurements are used for the continuous verification of the static behavior of the cavern through two-dimensional numerical modeling [
5,
6].
The Cava Madre of Candoglia is, therefore, a particular case of underground construction, where the large number of monitoring measurements available allows for the development of an accurate back-analysis on the geomechanical parameters considered most uncertain.
Some other relevant examples are available in the literature and describe advanced studies on the behavior of ornamental stone quarries with an underground development [
7,
8,
9].
In this paper, after describing the peculiar characteristics of the Cava Madre cavern and the geomechanical investigations developed on site and in the laboratory, the complex monitoring system used to control the stress and strain behavior of the rock mass and of the supporting structures is illustrated; furthermore, the numerical modeling developed to analyze the static behavior of the cavern in detail and to be able to compare the calculation results with the monitoring measurements is described. The comparison is based on the back-analysis procedure applied subsequently to be able to calibrate the fundamental geomechanics parameters of the rocks and identify the lateral thrust coefficient at rest k0. The particular back-analysis procedure developed consists of the evaluation of the error function for the different combinations of the considered uncertain parameters, finally arriving at identifying the combination with the minimum error, i.e., with the minimum distance between the results of the numerical calculation and the available monitoring measures.
2. Geology and Geomechanics Characterization of the Lithotypes
The Candoglia marble rises on the left side of the lowest portion of the Toce Valley following a level of variable thickness, deformed according to a series of folds that belong to different, mainly ductile deformation phases (
Figure 3). The outcropping portions are limited to some sectors, but overall the folding structure can be followed from the valley floor (approximately 210 m above sea level) up to approximately 1000 m above sea level [
1,
2,
3,
4].
Pure marble vein is spreading continuously on the mountainside, drawing a long and narrow band that is folded towards the northwest, thus causing a thickening of the deposit. The thickness of the layer is quite variable, ranging between approximately 10 m and 35 m. The contacts with the quartzite are definite, while in correspondence with the dolomitic marbles (on the left side of the cavern), there may be gradual transitions.
Marbles (white, pink and gray veined) have a massive or slightly foliated structure and consist mainly of coarse-grained calcite, which may be associated with smaller quantities of silicates, such as quartz, phlogopite, plagioclase and k-feldspar. Upon contact with quartzite, a higher level of silicates may occur.
Numerous pieces of data were available to develop the geomechanical classification. Some of these have been obtained more recently through extensive in situ and laboratory tests:
nine sets of specimens as an update of a previous geomechanical classification were tested in the laboratory at the end of the nineties (marble, gneiss and schist);
five rotational geognostic surveys with continuous core drilling in the entrance area of the cavern.
digital cores in boreholes (automatic visual inspection of the walls of the holes, with definition of the orientation of the natural discontinuities within the rock mass);
measurement of the stress state at some points on the cavern walls and foot, through a three-dimensional CSIRO cell inserted inside a small diameter hole (36 mm);
two geophysical acquisition campaigns at the foot of the cavern and on the left wall, using the Georadar method (Ground Penetrating Radar—GPR technique, which involves the emission of short-duration electromagnetic pulses by a Tx transmitting antenna; these pulses propagate in the rock and, when they find a variation in the electromagnetic properties, they can be reflected, refracted or diffracted; the receiving Rx antenna, which can sometimes coincide with the transmitter itself, detects the return signal, which, after digitalization, is stored as a radar trace).
Numerous geostructural surveys in the marble and other rock outcrops have made it possible to identify the main discontinuity sets that are present. A good part of the discontinuities shows tight edges, slightly wrinkled (definitely rougher in correspondence with the more schistose marbles), dry and without filling; in fact, the presence of clay or, in any case, fine sediments has rarely been detected. The most abundant fractures are not very persistent and, depending on the lithotypes, have a decimetric or metric frequency. The detected discontinuities are almost always flat and with smooth to rough surfaces (especially in the more schistose portions of the marbles and in contact with the kinzigites) [
3].
For an evaluation as accurate as possible of the geomechanical parameters of the rock masses at Cava Madre cavern, the Bieniawski geomechanical classification (RMR system) was adopted [
10]. On the basis of the developed geological studies and geomechanical investigations, a rock mass zoning was developed as follows (from left to right) (
Figure 4):
paragneiss (RMR = 48);
fractured band with very poor geomechanical characteristics, with a variable thickness of 2–4 m (RMR = 20);
marble constituting the left side of the cavern (RMR = 64);
marble constituting the right side of the cavern (RMR = 72);
gneiss (RMR = 51).
RMR is the geomechanical quality index of the Bieniawski geomechanical classification [
10].
On the basis of the information acquired for the different lithotypes and the geomechanical quality indexes (RMR), it was possible to evaluate the geomechanical parameters of strength and deformability in
Table 1 thanks to the empirical correlations available in technical and scientific literature.
The geomechanical quality can, however, only be assessed with a certain degree of reliability due to the following important uncertainties:
the intrinsic variation of geological and geomechanical conditions in the studied area;
the methods of data retrieval, which can be of an extensive but cortical type (geological-technical survey) or punctual and localized (geognostic investigations, preliminary excavations), but on a reduced scale, different from that of the analyzed problem;
the procedures for estimating the physical and mechanical parameters of the rock mass, which are conventional because they are based on subsequent experiences over time and also aimed at different purposes (classifications for excavability, for supports, etc.).
These factors mean that the geomechanical characterization, which defines the mechanical and physical characteristics of each type of rock mass that is present, can only offer an initial assessment. This assessment needs to be verified in the latter stages of the geomechanical problem’s investigation.
3. The Geomechanical Monitoring System and the Numerous Available Geotechnical Measures
For many years, the Cava Madre has been equipped with a detailed monitoring system. The variety of instruments and the complexity of the system are due to the singularity of the excavation (large dimensions), as well as the historical-architectural importance of the extracted material and the site. The instrumentation for geomechanical monitoring was installed and integrated on several occasions, both to follow the development of the excavations and to take into account the installed supports; the purpose of the monitoring measures is that of static control of the excavations and supports in relation to the work progress and of comparison with the assessments deriving from the continuous updating of the numerical modeling.
The monitoring system is aimed at geomechanical control of the behavior of the excavation contour walls in terms of displacements, of the support systems like concrete beams in terms of stresses and strains, and of the rebars and tendons in terms of reaction forces. The scope of the monitoring system is also the periodic update of the geomechanical model of the cavern zone and its correlation with the advancement of the excavation works.
To date, most of the instrumentation is managed with periodic reading through the use of data acquirers, these being electric vibrating wires or strain gauge transducers (
Figure 5). Some measurements are performed using topographical methods. Finally, weather conditions are continuously recorded, more specifically the air temperature.
The instrumentation currently in operation consists of numerous types of transducers, briefly summarized below:
topographic targets
strain gauge bases on old concrete strut-beams
strain gauge bases on metal struts located in the inner part of the cavern
jacks for measuring stresses in old concrete strut-beams
strain gauge bases in the new concrete strut-beams
pressure cells in the new concrete strut-beams
annular load cells placed below the distribution head of the stranded tensons
straight wire pendulums
To estimate the stress state in the wall of the cavern and at its foot, a lot of measurements were available (17 flat jacks were used, 11 of which were left in place to evaluate the stress variations over time). The results of the investigations highlighted a predominantly compressive state of stress everywhere in the rock mass around the cavern, despite the shape of the cavern elongating in the vertical direction and an ascertained high level of horizontal in situ stresses. Furthermore, two tests were carried out on the concrete strut beams present at the time in the entrance area, which were subsequently demolished. The stress state in the deeper zones of the rock was evaluated with borehole slotter stressmeter tests.
A tendency was found for the k0 parameter (the ratio of the in situ horizontal stress over the vertical one, i.e., the coefficient of lateral thrust at rest) to be greater than unity; it means that the horizontal lithostatic stress is greater than the vertical one.
Of particular interest are the measurements of displacement of the lateral walls and, in particular, of convergence, i.e., the distance between two topographic targets placed on opposite walls of the cave. The convergence is able to control the deformation of the cavity in relation to the progress of the excavation operations and the entry into the operation of the support works. Convergence is able to show a possible evolutionary trend of displacements once excavations are completed or suspended, and the extent of deformations connected to very specific excavation activities. The displacements are integral entities; that is, they are the manifestation of the deformations that occur in a large portion of the rock mass around the measurement point. They are, therefore, very interesting because they are not susceptible to local and specific conditions at the measurement point, but mediate the information coming from large areas around the cavity. In
Figure 6, it is possible to see the trend of convergences over time, measured with reference to different pairs of topographic targets placed on the two walls, during the execution of the excavation operations for the extraction of the marble blocks from the foot of the cavern in its entrance area. It can be seen how the convergences grow over time in relation to the excavation and marble extraction works that are being concentrated at the foot of the cave, just below the reference points for the measurements.
In this case, very useful are the measurements of the stress state through pressure cells positioned inside the three massive strut beams built at the beginning of this century in the cavern entrance area (
Figure 7). These cells allow the mechanical behavior of the strut beams to be verified, in particular the compression force induced inside them due to the tendency of the cavern to close with the evolution of mining. This measurement of the stress state is, therefore, also a further indirect measurement of the convergence of the walls in the area where these containment works are positioned. It can be seen how the measured stresses have an undulating trend over time, corresponding to the seasonal variation in the temperature of the area. This characteristic of the measurements allows us to detect the great importance of thermal deformations, verifying the trend over the years of the maximum and minimum values of the variability interval of the measured pressures.
4. The Back-Analysis Approach in Geomechanical Problems
Through appropriate back-analysis procedures, the measurement findings are processed in order to enhance and increase the reliability of the first estimate of the geomechanical parameters of the rock acquired from the geomechanical classification [
11,
12,
13].
The geomechanical classification is essentially based on empirical bases, i.e., on the experience acquired over time on different projects. This is a procedure that allows us to arrive at a (not very precise) estimate of the main geomechanical parameters, starting from a description of the rock mass. Therefore, rather than single deterministic values, it is possible to identify intervals of variability in the main geomechanical parameters.
In the context of excavation and rock engineering, back-analysis refers to a specific process that is developed with numerical analysis techniques for determining the stress-strain states of the rock mass and supporting structures [
12,
14,
15,
16,
17]. This process begins with the in situ displacement and stress measurements and allows for the initial estimates of the following parameters to be calibrated using the calculation model:
The modern back-analysis represents one of the most delicate phases of the entire project program [
17,
18,
19]. It can occur when, during the excavation of a tunnel or underground void, there is an uncertainty in the geomechanical features of the rock mass of the examined zone that could not be determined in depth by the preliminary characterization.
Back-analysis is a powerful calculation tool that allows us to precisely determine the values of the main geomechanical parameters on which a degree of uncertainty remained at the end of the preliminary characterization. It correlates calculation results with monitoring measurements: the combination of the uncertain parameters that produces the minimum distance (the minimum error) between the calculation results and the monitoring measures is the one that turns out to be the most representative of the problem being analyzed.
Selecting one of the following is necessary to carry out a back-analysis [
12]: (a) a representative calculation model that can ascertain the state of stress and strain in the rock mass, taking into account the evolutions of the excavation phases; (b) an error function; and (c) an effective algorithm that minimizes the error (the difference) between the numerical model’s calculation results and the observed in situ measurements.
As often happens, the geomechanical parameters on which there are the greatest uncertainties and which have a high influence on the evolution of the static conditions of an underground cavity are:
For these reasons, back-analysis generally focuses on the “calibration” of these two values so that they can subsequently be used for numerical analyses that simulate the current situation of the excavation or the subsequent activities envisaged by the project or the mining plan.
In the simplified case that there are only two geomechanical parameters to be “calibrated” through back-analysis (x and y, for example), the calculation procedure is simplified: it essentially aims to describe the results of the numerical analyses considering all the established combinations of the two geomechanical parameters (x
i, y
j) within the variability range considered valid for each of them. If we call f
k the k-th function that describes a certain result of the numerical calculation (for example, the displacement in a certain node of the model), depending on the uncertain parameters x and y, we can define the error function in the following way:
where
εi,j is the mean specific quadratic error function (always positive) which depends on the value of the single uncertain parameter (xi and yj), the in situ measurements being known;
is the k-th in situ measurement obtained during the underground work construction and refers to a specific result of the calculation fk(xi,yj);
(xi,yj) is the combination of two uncertain input parameters chosen inside the variability interval of each of them (xmin ≤ xi ≤ xmax), (ymin ≤ yi ≤ ymax);
m is the number of in situ measurements used to develop the back-analysis procedure.
In this specific case, the elastic modulus E of the marble (left side of the bench) and the coefficient k0 were considered uncertain. For the elastic modulus, the variability range of 30–40 GPa was adopted, while for the k0 the range of 1.0–1.5 was adopted. Each interval was divided into five subintervals in order to obtain six possible values of the two parameters (including the interval extremes): E = 30, 32, 34, 36, 38, 40 GPa; k0 = 1.0; k0 = 1.1; k0 = 1.2; k0 = 1.3; k0 = 1.4; k0 = 1.5. The total number of combinations was, therefore, 36.
The number of measurements considered reliable and, therefore, suitable for use in the back-analysis procedure was eight (m = 8): four displacement measurements and four stress measurements.
Thanks, therefore, to the comparison between the carried out measurements and the corresponding calculation results, it was possible to calculate 36 different error values (from ε1,1 to ε6,6) based on Equation (1). The minimum error (εmin = min(εi,j)) allowed for the identification of the following parameter values, calibrated thanks to the back analysis:
E = 36 GPa (marble left side); k0 = 1.4.
5. Numerical Modeling of the Vertical Section of the Cava Madre Cavern
The numerical modeling was carried out using the Flac2D code, considering the vertical marble bank affected by the exploitation together with other gneiss and mica schist banks located to its right and left. The primary goal of the numerical modeling is to confirm the stability conditions of the walls and the stress level induced in the structural elements that contrast the walls because the cavern has a tendency to grow in height and the major thrusts coming from the rock are directed horizontally [
4,
20].
Furthermore, in the future, the necessity of extracting good quality marble blocks pushes towards a further deepening of the foot of the cavern in the entrance area, where the mining activities are currently concentrated.
For this reason, the two-dimensional numerical modeling was focused on the entrance area, in a vertical section transversal to the axis of the cavern located approximately in correspondence with the new central concrete strut beam.
The numerical model developed, with the geomechanical parameters calibrated by the back-analysis procedure, turns out to be a powerful tool for predicting the development of stresses and deformations in the rock mass surrounding the cave and inside the support structures and rock reinforcement. It is able to predict the static behavior of the cave as the extraction of marble blocks from the foot of the cave progresses in the near future.
The correct simulation of the succession of excavation phases is a fundamental step to allow the model to adhere as realistically as possible to the actual evolution of excavations in the past and also for what is expected in the future. Due to a lack of comprehensive historical data, it was not possible to replicate the removal of every block from the cavern’s opening; instead, a simplified version of the cavern’s mining history up to the present was created, based on the primary excavation stages that are described here:
Phase 0—Initial lithostatic condition, with the insertion of the lithostatic stress state (vertical and horizontal in situ stress);
Phase 1—Initial cavity geometry: extraction activities up to the 1950s is simulated in a single phase;
Phase 2—Construction of the old seven concrete strut-beams;
Phase 3—Simulation of further mining activities;
Phase 4—Demolition of some old strut beams (the outermost ones) and remodeling of the right wall of the cavern with the enlargement of the cavern in the entrance zone from 12 to 22 m;
Phase 5—Insertion of the new three concrete strut beams, more massive (section of 6 m × 2.5 m) than the previous ones and located at a lower level;
Phase 6—Lowering the foot of the cavern (bench 0) and partial underlaying of the supports of the new strut-beams on the right wall (activity in progress in the entrance area).
Additional support systems, such as long rebars and cable tendons, are also taken into account in order to maintain adequate confinement against rock boundary displacement [
21,
22,
23].
The end of Phase 6 corresponds to the current condition of the cavern. The subsequent phases simulate the excavation activities and support structures of the side walls, which are hypothesized for the future in order to be able to continue the mining operations downwards through the excavation of a further bench (bench 1) at the foot of the cavern:
Phase 7—Completion of bench 0 by exhausting the marble extraction at the current level at the foot of the cavern;
Phase 8—Creation of a second row of strut beams (4 m × 4 m sections) resting at the foot of the cavern;
Phase 9—Opening of bench 1: repetition of the extraction and wall support techniques described in phases 6 and 7, in order to correctly carry out the excavations and underlaying of the supports on the right wall of the existing strut beams.
The following figure (
Figure 8) reproduces the future excavation and support phases considered in the numerical modeling of the cross section of the entrance area:
Completion of the excavation in the right area at the current level (bench 0) (
Figure 8a);
Underpinning of the support structures of the concrete strut beams on the right side of the cavern (
Figure 8b);
Removal of the central concrete partition temporarily supporting the existing strut beams (
Figure 8b);
Completion of the excavation in the left area at the current level (bench 0) (
Figure 8c);
Construction of a row of future strut-beams at a lower level (
Figure 8d);
Creation of bench 1 to deepen the foot of the cavern, following the same procedure as for the previous bench 0 (
Figure 8e–i).
The developed numerical model has very fine detail by adopting quadrilateral elements measuring 0.25 m × 0.25 m. The total number of numerical elements used in the model is approximately 1 million seven hundred thousand. The model has a total size of 325 m × 325 m. The boundary conditions were entered by applying adequate pressure on the lateral edges in order to recreate the previously defined lateral thrust coefficient (k0 = 1.4): at the base of the model, a constraint on vertical movements was imposed, while on the two lateral borders, a horizontal pressure variable with depth (triangular trend of the load diagram) and defined on the basis of the coefficient k0 (horizontal to vertical in situ stresses ratio) was applied; no constraints or even pressures were applied to the upper border of the model, as it coincides with the ground surface.
The model mesh was chosen thanks to an in-depth analysis, which made it possible to identify the size of the elements capable of achieving high calculation precision: the size of the elements was varied, starting from larger values towards smaller ones, until some representative results of the calculation (displacements and stresses at the center of the roof and at half the height of the side walls) reached a precision deemed acceptable.
The mechanical properties of the rock mass were represented in the numerical model based on the geomechanical characterization developed and considering the actual geometry of the lithotypes present, also for petrographical issues as done in similar exploitation [
23]. For the materials of the support and reinforcing elements (concrete and steel), reference was made to the material tests carried out: steel elastic modulus 210 GPa, steel tensile strength: 540 MPa, concrete elastic modulus 32 GPa and concrete compressive strength 30 MPa.
The section of the cavern that was represented in the two-dimensional numerical model is the one that emerged from the topographic surveys carried out in the entrance zone, in particular in correspondence with the central beam strut among the three created.
The solution adopted by the used calculation program (Flac 2D ver. 8.1) is of the finite difference type, capable of simulating the excavation phases in soils and rocks and evaluating the stress and strain even when the limits of the elastic behavior have been reached and a plastic behavior occurs. The potential of the calculation program consists of being able to develop analyses in the presence of structural elements introduced to simulate support and rock reinforcement interventions, in the dynamic field [
24,
25], and in the presence of groundwater.
The most interesting results to analyze in order to evaluate the static behavior of the cavern and of the surrounding rock mass are:
The results that can be obtained from the calculation are useful for verifying the behavior of the containment structures of the side walls that are already present and also the ones foreseen in the future in the entrance area. The evaluation of the internal stress induced in these structures by the foreseen mining activities is, in fact, important in order to understand the adequacy of the existing ones to withstand the effects of further excavations and to be able to correctly design the future support and containment structures of the walls.
Figure 9,
Figure 10,
Figure 11,
Figure 12,
Figure 13,
Figure 14 and
Figure 15 show the horizontal displacements, horizontal stresses, and plastic zones detected in the numerical model corresponding to Phase 6 (current situation) and Phase 9 (at the end of the activities envisaged in the exploitation plan for the future), respectively.
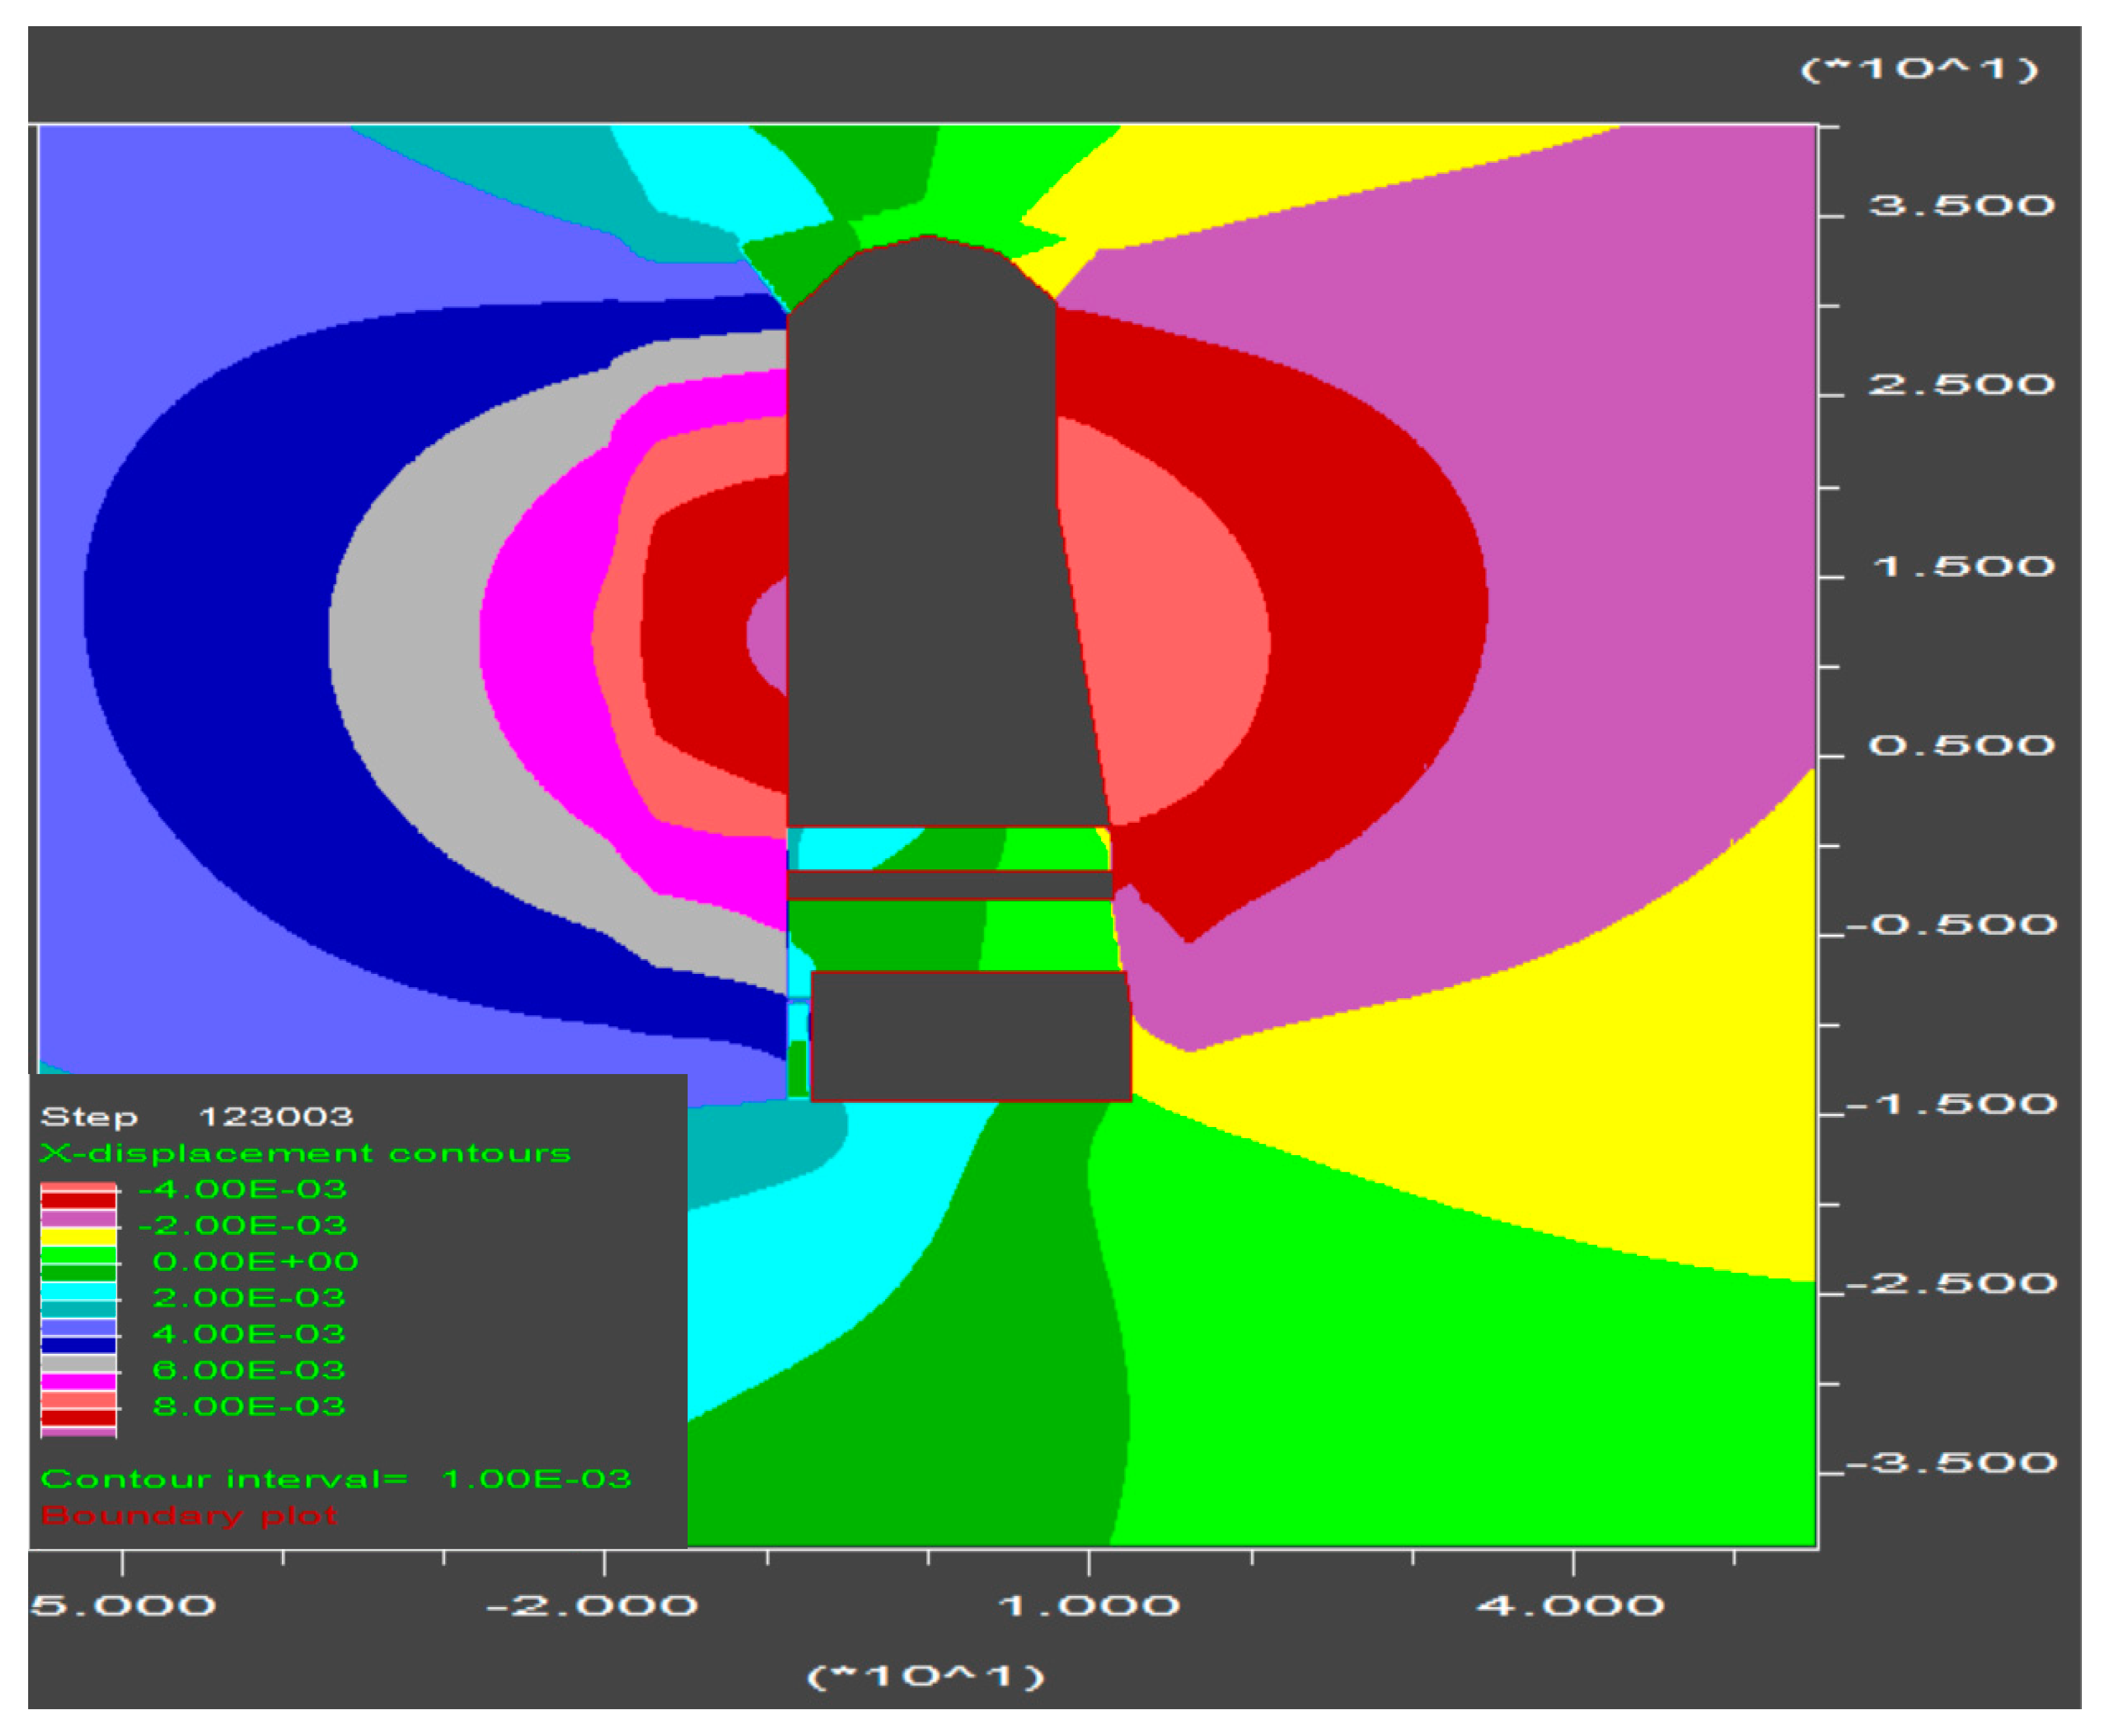
At the current stage of mining activities (
Figure 9 and
Figure 10, modeling Phase 6), the horizontal movements are contained within a few millimeters (maximum 6 mm on the left side and maximum 4 mm on the right side) (
Figure 9), thanks to the presence of the new strut beams built at the beginning of the century. The horizontal stresses indicate values lower than 4 MPa in the area above the cap and values slightly higher than 4 MPa on the foot of the cavern (
Figure 10). In the current condition, a certain destressing of the right wall of the cavern can be detected. Moreover, a regular localized concentration of stresses at the edges can be seen. The presence of limited plastic areas is noted on both the left and right walls of the cavern (
Figure 11). Most of the rock surrounding the cavern in the entrance area exhibits an elastic behavior under current conditions. From
Figure 11, it is possible to notice an intense plasticization of the band of fractured material with low mechanical characteristics on the left side of the cave (material No. 2 in
Figure 3 and
Table 1). This presence, however, does not significantly disturb the stress conditions of the rock in the area close to the left wall.
Even at the end of Phase 9 the plastic zones do not increase around the contour of the cavern. The horizontal displacements rise to a maximum of 10 mm on the left wall and 5 mm on the right wall, remaining, however, at low values (
Figure 12). The horizontal stresses reach 5 MPa both in the cap and below the foot of the cavern, but still remain contained and below the rock mass strength (
Figure 13). Even at the end of Phase 9, the plastic zones are limited to very small portions of rock on the contour of the cavern profile, where some high levels of stress are concentrated (
Figure 14). The intense plasticization of the band of intensely fractured material on the left side obviously remains.
From the analysis of the horizontal stresses in the existing concrete strut beams and in the ones planned to be realized (
Figure 15), it is possible to evaluate their static conditions. The horizontal stresses induced in the existing strut beams reach a maximum value of 7.5 MPa in their lower portion, corresponding to the connection to the left support; however, no tensile stresses were detected. In future strut beams, maximum stresses of 4 MPa are detected in their lower portion (at the connection with the left support); in this case, no tensile stresses can be found, although at the intrados of the central portion the stresses are slightly higher than 0. The results of the calculation made it possible to verify how all the built support structures (the oldest and the more recent ones) are able to withstand the stresses produced by the convergence of the lateral walls following a further lowering of 5.5 m (the height of the bench to be extracted) of the cavern foot foreseen by the planning of future mining activities.
From the developed study using numerical modeling made more effective by the back-analysis procedure illustrated in the previous paragraph, it appears that the design solution for the continuation of exploitation activities allows the extent of plasticization in the rock around the cavern to be contained and the stress state in the supports and contrast structures of the walls to be maintained at a level below their operational limit.
6. Conclusions
The Cava Madre of Candoglia (northwest of Italy) is an important large underground rock cavern, which is of great interest not only for historical reasons, but also for the type of material that is extracted inside it. The information available indicates the opening of the cavern in 1680 in order to guarantee the supply of the marble necessary for the continuous reconstruction and renovation works of the Milan Cathedral. Since then, mining activities at the Cava Madre have never stopped.
As the excavations progressed, the dimensions of the cavern became very large, especially in the entrance area, where the mining works are now concentrated. The cavern tends to lengthen in height, following the marble bench, which is arranged vertically. Furthermore, the state of stress in the rock is intense, especially in the horizontal direction, also due to the proximity of important alpine tectonic structures. For these reasons, over time, important work to support and contain the walls of the cavern has been carried out, and a relevant and diversified monitoring system has been implemented.
In order to improve the reliability of the geomechanical characterization developed according to traditional methods, a back-analysis procedure was adopted, focused on two particular geomechanical parameters: the elastic modulus E of the marble and the lateral thrust coefficient at rest k0 (horizontal to vertical in situ stresses ratio).
The adopted back-analysis approach allowed the calculation of the error function, i.e., the distance between the calculation results and the monitoring measurements, for each combination of the uncertain geomechanical parameters. Among all the error values, the minimum one was identified, and therefore the combination of the uncertain parameters was connected to it. This approach proved to be very interesting and useful for the definition of reliable geomechanical parameters; it requires a preliminary definition of the variability ranges of each uncertain parameter based on a probabilistic evaluation.
To limit the number of numerical models to be developed, however, only a small number of values can be considered in the calculation. Furthermore, the numerical model must be simplified in order to allow calculation times to be kept to acceptable values.
The back-analysis procedure made it possible to “calibrate” the uncertain parameters and therefore to have an effective and reliable numerical model available, which is also useful for evaluating the static behavior of the cavern in relation to the further mining activities foreseen in the future.
Thanks to this modeling, it was finally possible to proceed with a detailed verification of the static behavior of the cavern and of the impressive contrast and support works on the walls, and to define a reliable project for the future phases of marble mining in the area of the Cava Madre.
The development fields of the study lead to an improvement in the follow-back analysis approach, providing for various phases in which the number of considered uncertain parameters is progressively reduced.


