Article

Research on a Grading Evaluation System for Water Inflow in Three-Hole Parallel Subsea Tunnels Considering Inter-Tunnel Influence

1
Key Laboratory of Roads and Railway Engineering Safety Control of Ministry of Education, Shijiazhuang Tiedao University, Shijiazhuang 050043, China
2
Innovation Center for Wind Engineering and Wind Energy Technology of Hebei Province, Shijiazhuang 050043, China
3
Hebei Province Technical Innovation Center of Safe and Effective Mining of Metal Mines, Shijiazhuang 050043, China
4
Department of Mathematics and Physics, Shijiazhuag Tiedao University, Shijiazhuang 050043, China
*
Author to whom correspondence should be addressed.
Appl. Sci. 2023, 13(23), 12761; https://doi.org/10.3390/app132312761
Submission received: 21 October 2023 / Revised: 25 November 2023 / Accepted: 26 November 2023 / Published: 28 November 2023
(This article belongs to the Special Issue Recent Research on Tunneling and Underground Engineering)

Abstract

:
Water inflow analysis is critical for subsea tunnel construction. However, existing studies largely concentrate on the inflow issues pertaining to single-hole tunnels. To address current practical engineering problems, a three-hole parallel configuration is common for subsea tunnels, which may alter water inflow patterns due to the influence of their seepage fields. Herein, numerical simulations are conducted to investigate the water inflow characteristics of a three-hole parallel subsea tunnel. Specifically, the impact of various factors on the water inflow phenomenon, including the permeability coefficient of the surrounding rock, the depth of the seawater, the depth of the tunnel, the spacing between tunnels, and the relative size of the tunnels, are comprehensively studied. Furthermore, based on the principles of the analytic hierarchy process and fuzzy mathematics, an exhaustive assessment framework is developed to evaluate the water inflow of three-hole parallel subsea tunnels. The results indicate that there is a mutual influence between the three parallel tunnels, differing from the predicted water inflow, which is overestimated in a single-hole tunnel model. Therefore, the water inflow assessment for a three-hole parallel subsea tunnel system should account for the inter-tunnel influences. The findings of this study offer valuable insights for the design of waterproofing and drainage systems in three-hole subsea tunnels.

1. Introduction

Subsea tunnels serve as a crucial expansion of terrestrial transportation networks, playing a significant role in enhancing urban spatial organization and facilitating regional integration and development [1,2]. Because they can ensure all-weather traffic during snowy, foggy, and windy seasons [3] and have little impact on shipping, they have become an important means of crossing rivers and seas. The construction of subsea tunnels demands the careful consideration of the significant challenge posed by sudden water inflow in the unique underwater environment [4]. Accurately predicting and reasonably evaluating water inflow are crucial in guiding the waterproofing and drainage design of subsea tunnels, as well as the stability analysis of the surrounding rock formations [5,6].
Many scholars have conducted in-depth analysis on the problem of underwater tunnel water inflow, proposing research methods such as theoretical analysis, numerical simulation, model experiments, and empirical methods [7,8,9]. Qin et al. [10] applied Harr’s mirror method [11] to analyze the seepage characteristics of a single-hole tunnel with the influence of a grouting ring and validated the theoretical solution through comparison with numerical simulations and experimental techniques. Applying the principles of mass conservation and Darcy’s law, Guo et al. [12] investigated the steady-state seepage field of underwater double-hole parallel tunnels using the conformal transformation method [13,14] and the Schwartz iteration method. However, Guo et al.’s solution lacks closure and requires implementation through a computational program. Li et al. [15] conducted a study on the water inflow process in subsea tunnels using large-scale physical model experiments and numerical simulations, analyzing the water inflow mechanism as well as the variations in structural displacement and pore water pressure during the process. Their results can provide valuable references for tunnel structural design and disaster warning. Maleki [16] et al. attempted to correlate the geological and hydraulic parameters of rock mass experimentally and logically in order to estimate the amount of water flowing into tunnels. Their methodology was exemplified through an analysis of a tunnel in the Zagros region. Katibeh [17] conducted an extensive investigation involving more than ten different types of tunnels in the Iranian region, identifying and summarizing seven key factors influencing tunnel water inflow. Building upon the geomechanical rock mass rating concept, Katibeh proposed a site groundwater rating method that categorizes tunnel water inflow into seven grades based on the perceived level of danger.
Stochastic mathematical methods, such as attribute mathematical models, the analytic hierarchy process [18], and fuzzy extension theory [19], have been applied in tunnel engineering for the effective analysis and evaluation of water inflow issues. Despite the inclusion of indicator analysis, weight evaluation, and other processes in the analysis, the accuracy and reliability of the evaluation results are widely recognized [20]. Qiu et al. [21] proposed an enhanced grayscale relationship analysis method (GRA) with an optimal combination weight approach for evaluating water inflow risks in subsea tunnels with complex geological conditions. Identifying eight key factors, the method was applied to assess and grade tunnel water inflow, as exemplified in the Qingdao Jiaozhou Bay undersea tunnel project. Zarei et al. [22] identified six main factors that affect tunnel water inflow based on rock mass characteristics under different geological conditions and combined the analytic hierarchy process (AHP) and statistical methods to estimate tunnel water inflow. Compared with measured data, the rationality and operability of this method were demonstrated.
At present, subsea tunnels commonly adopt a three-hole parallel configuration to meet safety and functional requirements. However, most studies on tunnel seepage phenomena have focused on single-hole tunnel models. Consequently, this study employs numerical simulations to analyze the mutual influence between three parallel subsea tunnels and utilizes the fuzzy comprehensive evaluation method to assess the water inflow in tunnels. The fuzzy comprehensive evaluation method [23,24] transforms qualitative evaluations into semi-quantitative assessments, providing an effective solution for addressing fuzzy and intricate problems that resist straightforward quantification.

2. Verification of Calculation Models and Methods

2.1. Calculation Model

As shown in Figure 1, a certain subsea tunnel adopts a three-hole arrangement of “Main tunnel + Service tunnel”. The simplified calculation model established in this study is shown in Figure 2. The main tunnel section is a multicenter circular shape with an excavation area of approximately 162.7 m2. The service tunnel has a circular cross-section with an excavation diameter of 7.7 m.
In this study, numerical software is used to simulate the tunnel seepage field. An isotropic seepage model is employed in the numerical model, with saturation set to 1.0. The fluid is assumed to have no tensile strength, and a specific hydrostatic pressure is applied to the seabed surface based on the seawater depth. The left, right, and lower boundaries of the model are set as impermeable boundaries. Additionally, the pore water pressure at the tunnel excavation boundary is assumed to be set to 0 following tunnel excavation. Through trial calculations, the model dimensions were determined as 500 m × 200 m × 1 m, taking into account both solution accuracy and computational efficiency.

2.2. Numerical Method Validation

To validate the accuracy of the numerical calculation method, the double-hole parallel tunnel model introduced in reference [25] is employed for analyzing the seepage field after tunnel excavation. The resultant cloud map of pore water pressure distribution is illustrated in Figure 3. The water inflow for the double-hole tunnel can be computed as Q1 = Q2 = 16.52 m3/(m·d). In reference [25], Q1 = Q2 = 16.21 m3/(m·d); thus, it is evident that the two datasets exhibit fundamental consistency. In conclusion, the numerical calculation method employed in this study is well-founded.

3. Analysis of Factors Affecting Water Inflow

There are many factors that affect the water inflow of tunnels, and they are difficult to measure [26,27]. In order to facilitate the grade of water inflow, the first step is to analyze the variation law of water inflow when a single factor changes. For the parallel configuration of three holes within a subsea tunnel, we primarily analyze the influencing factors, including the permeability coefficient of the surrounding rock, seawater depth, and tunnel burial depth, as well as the spacing and relative size between the main tunnel and the service tunnel. To illustrate the reciprocal influence among the tunnels, a comparative analysis of the seepage fields between the three-hole tunnel and the single-hole tunnel was conducted. The related parameters are shown in Table 1. The parameters other than the variable remain constant during the calculation process.

3.1. Permeability Coefficient

Applying the single-factor variable method, the permeability coefficient of the surrounding rock exhibits a range of 0.01 m/d to 0.15 m/d, and the remaining influencing factors are held constant. Figure 4 illustrates the correlation between the permeability coefficient and the tunnel’s water inflow. Whether it is a single-hole tunnel or a main tunnel with three parallel holes, the water inflow exhibits a linear increase in response to the rising permeability coefficient. The water inflow in the main tunnel under the three-hole parallel working condition is comparatively lower than that in the single-hole tunnel under the same conditions. Additionally, the rate at which water inflow increases with changes in the permeability coefficient is also relatively lower in the main tunnel.

3.2. Seawater Depth

Figure 5 illustrates the variation in the water inflow curve as a function of seawater depth. There is a direct linear relationship between the depth of seawater and the corresponding increase in water inflow. Compared to single-hole tunnels, it was observed that the water inflow of a three-hole parallel main tunnel exhibited a lower absolute value and change rate.

3.3. Depth of the Tunnel

Figure 6 illustrates the correlation between the water inflow of the main tunnel and the tunnel burial depth, which is defined as the depth from the seabed to the center of the tunnel. The graph presents this relationship for various rock permeability coefficients. There is a discernible pattern in the water inflow of the main tunnel as the depth of tunnel burial increases. Initially, there is a decrease in water inflow, followed by a subsequent increase. It can be found that there is a critical burial depth hc, which minimizes the water inflow in the tunnel. Furthermore, the figure indicates that variations in the permeability coefficient of the surrounding rock have no significant impact on the critical burial depth. In other words, the critical burial depth of the tunnel appears to be independent of the permeability coefficient of the surrounding rock.

3.4. Tunnel Spacing

Figure 7 illustrates the variation curve of water inflow within the main tunnel as the distance between the main tunnel and the service tunnel is altered. The water inflow of the main tunnel exhibits a gradual increase and converges toward the water inflow of a single-hole tunnel as the distance between the main tunnel and the service tunnel expands from 3r1 to 30r1, where r1 represents the equivalent radius of the multicenter circular section of the main tunnel. It can be determined that the water inflow in the main tunnel is lower than that in the single-hole tunnel when the distance between the main tunnel and the service tunnel falls within a specific range. This trend is particularly evident when the distance between the main and service tunnels is 3r1. The water inflow in the main tunnel amounts to only 63.5% of the water inflow observed in the single-hole tunnel. This observation highlights the mutual influence present in the seepage field between the main tunnel and the service tunnel during the three-hole parallel working condition. An overestimation of the predicted water inflow in the main tunnel is caused by disregarding the influences between these tunnels.

3.5. Relative Size

By maintaining a constant area for the main tunnel while varying the cross-sectional area of the service tunnel, a relationship curve depicting the water inflow of the main tunnel in relation to S2/S1 (the ratio of the service tunnel’s area to the main tunnel’s area) is established, as illustrated in Figure 8. The water inflow of the main tunnel gradually diminishes with the increasing S2/S1 ratio. Notably, as S2/S1 increases from 0 to 1, the water inflow of the main tunnel experiences a reduction of approximately 15%. This underscores the mutual influence existing between tunnels operating under the three-hole parallel condition.

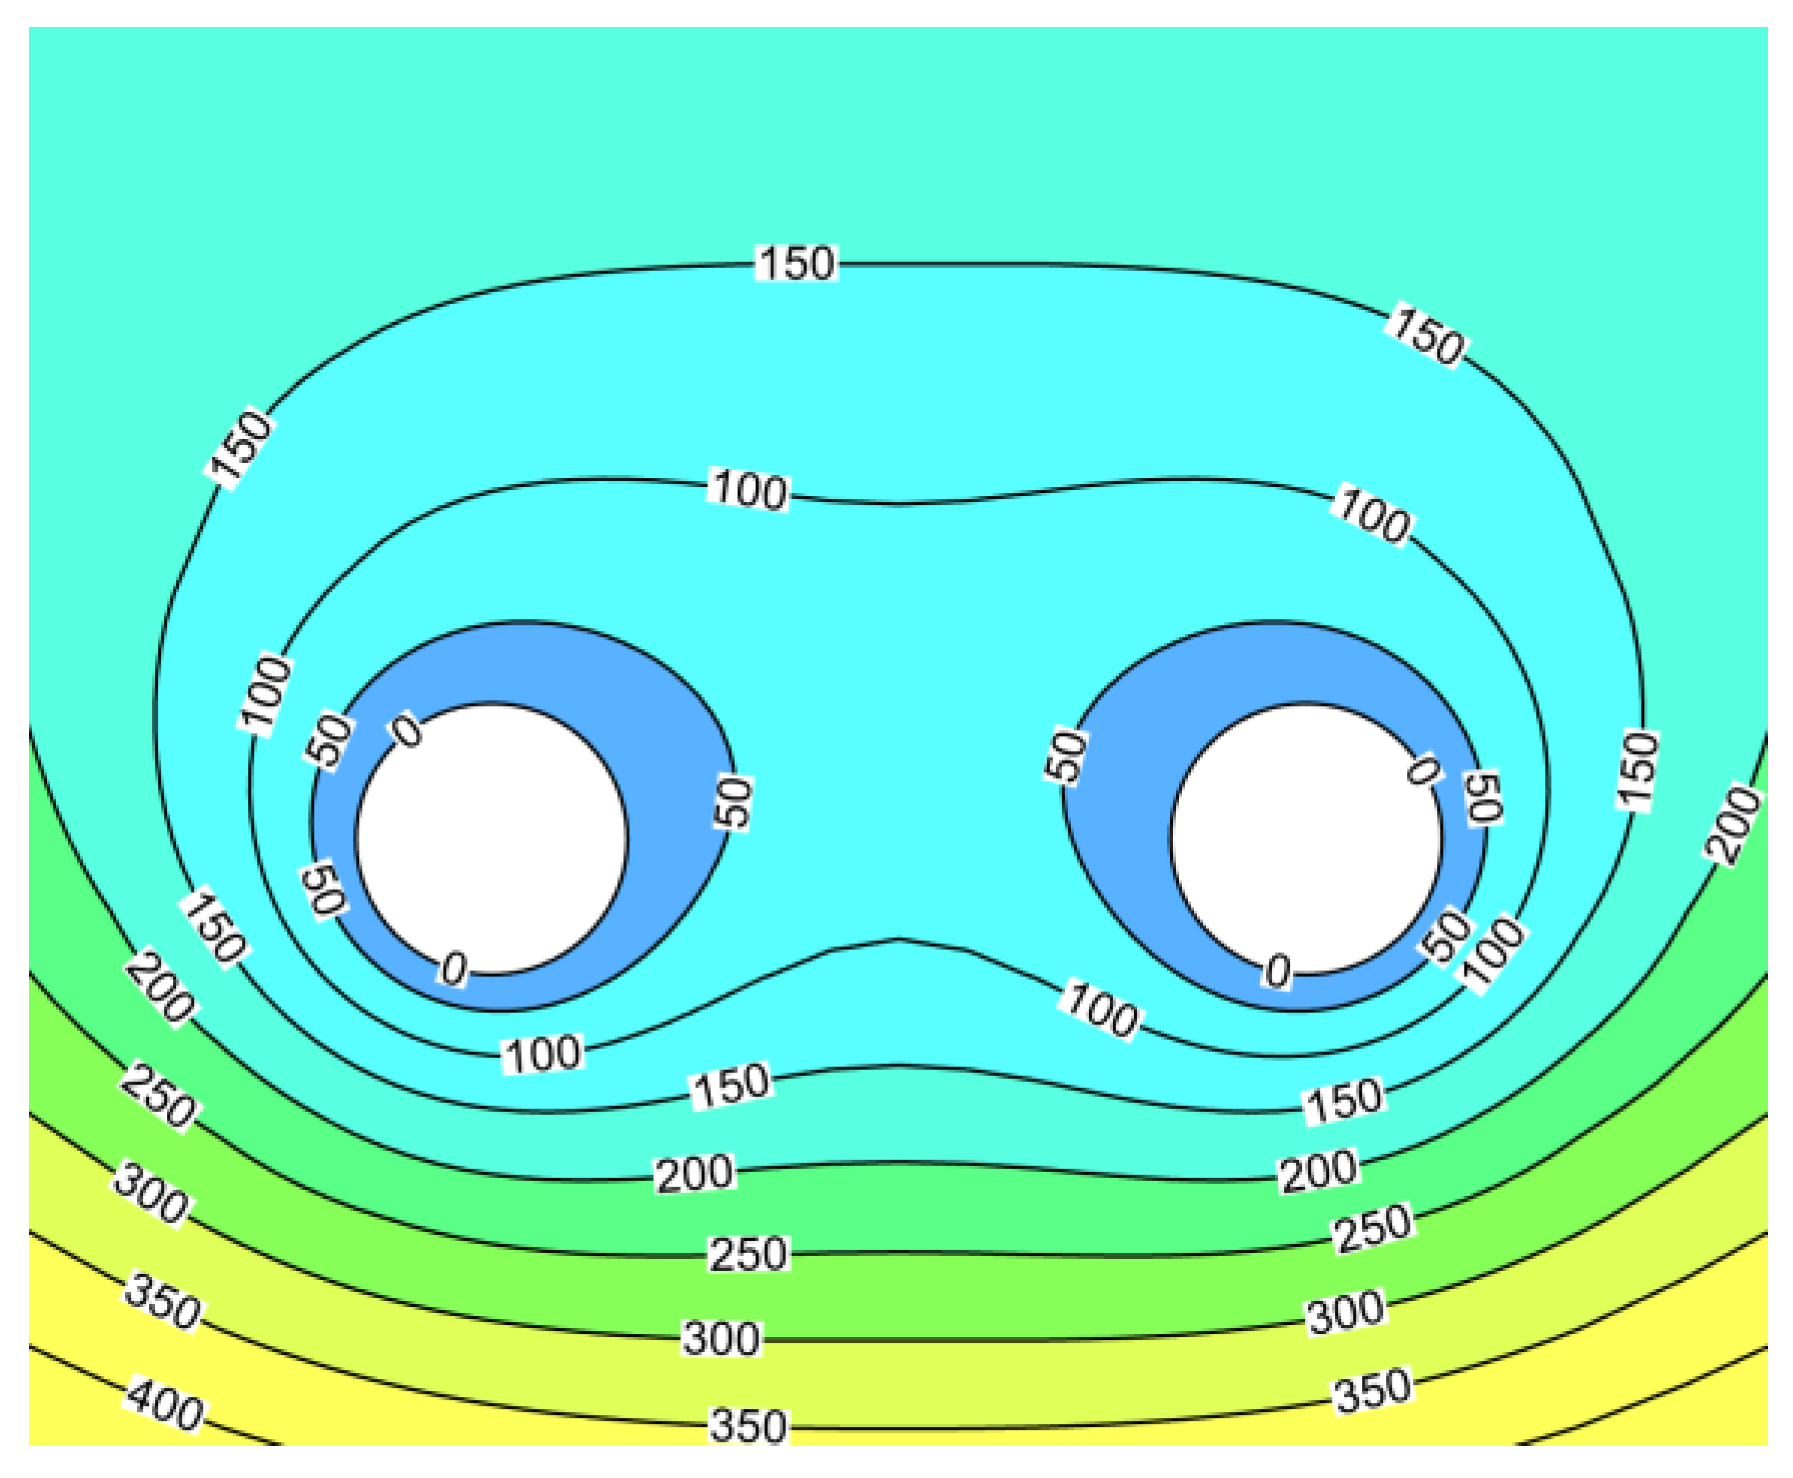
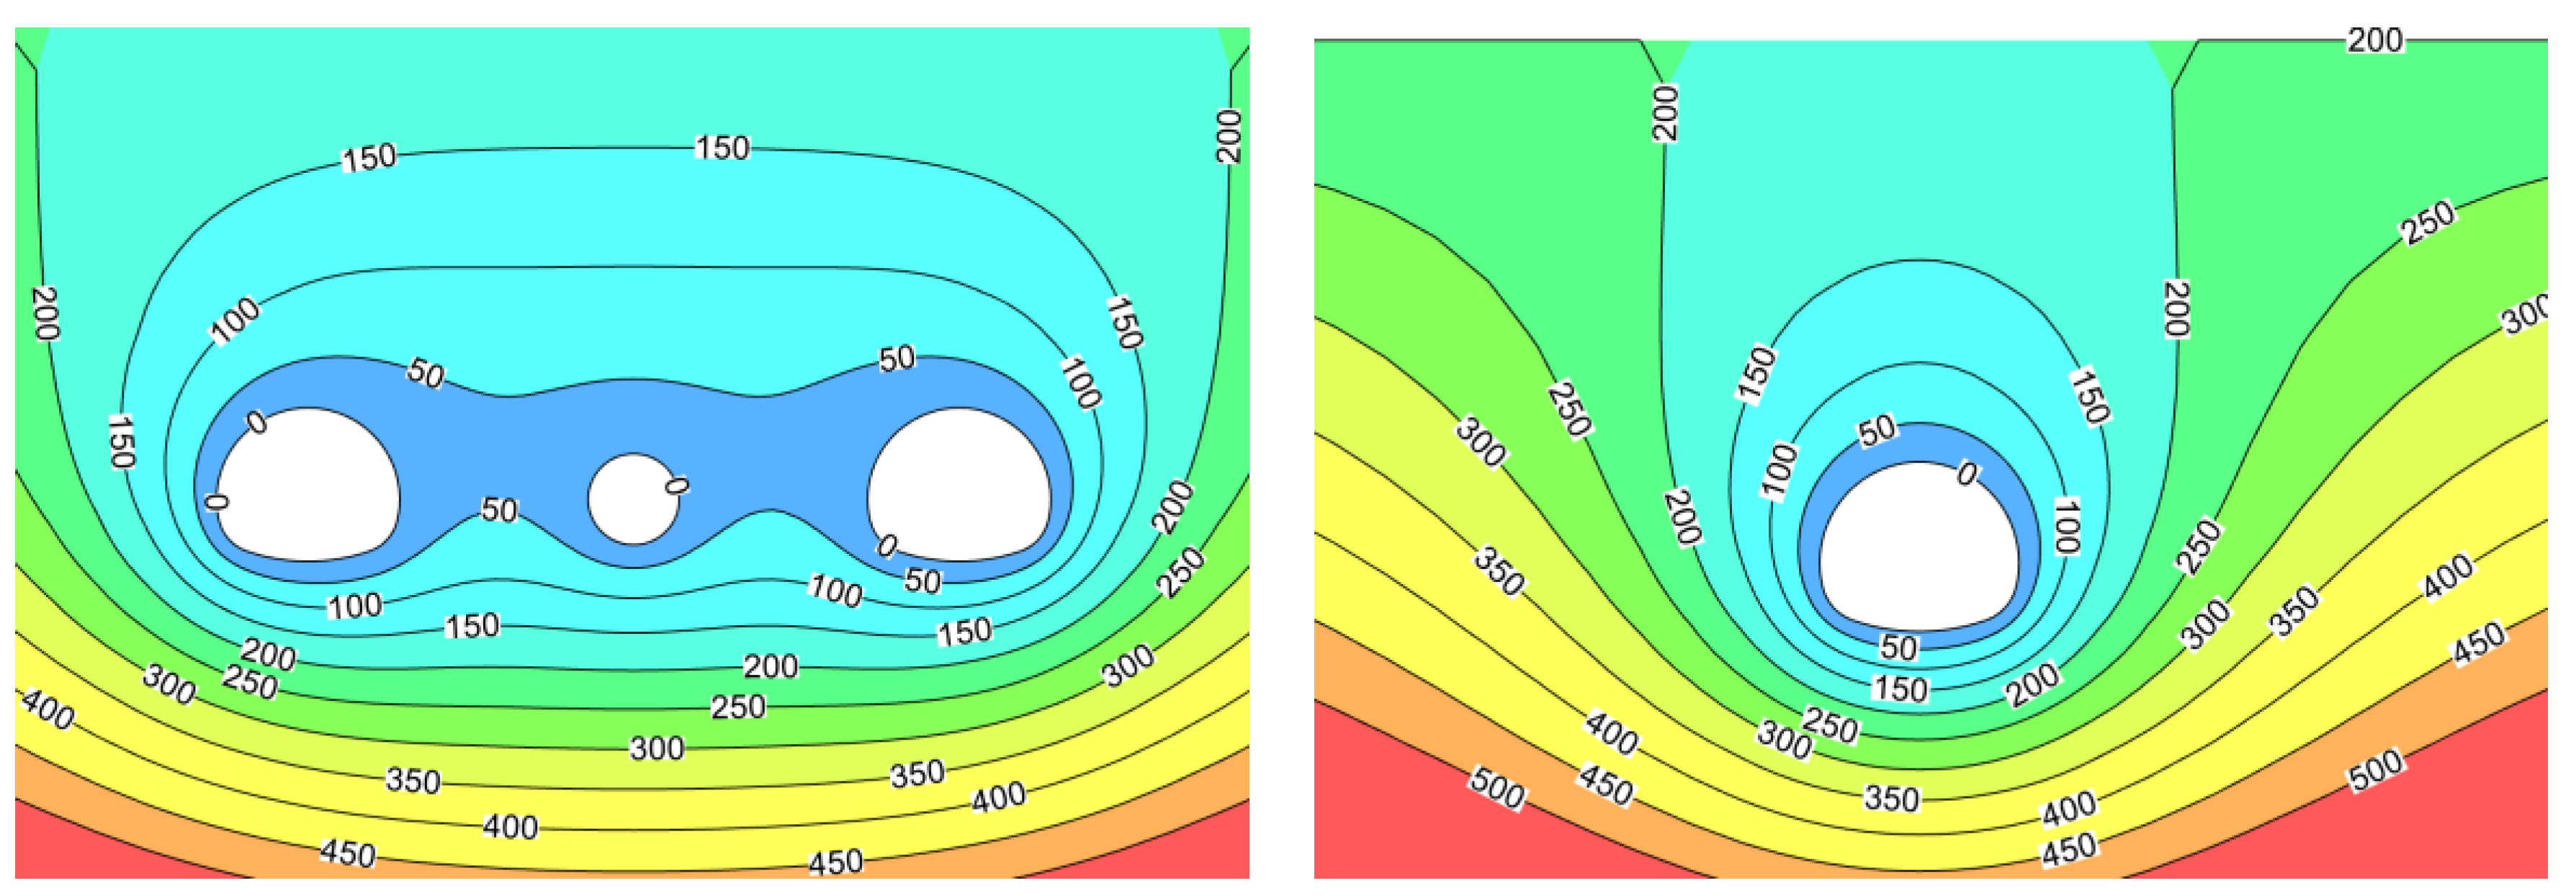
3.6. Analysis of Seepage Field

An analysis of influential factors reveals a reciprocal influence between the seepage field of the main tunnel and the service tunnel under the three-hole tunnel working condition. As a result, the water inflow into the main tunnel is reduced compared to a single-hole tunnel under identical circumstances.
To investigate the reciprocal impact of tunnels in-depth, seepage velocity vector maps (Figure 9 and Figure 10) and pore water pressure cloud maps (Figure 11) for both the main tunnel and the single-hole tunnel are drawn when the stable seepage state is completed after the tunnel excavation. The flow velocity vector field around the single-hole tunnel exhibits a symmetrical distribution, with the maximum flow velocity occurring at the left and right arch foot of the tunnel, reaching a peak value of 4.06 × 10⁻⁷ m/s. Under the parallel working condition of three holes, the pressure relief effect of the service tunnel causes a decrease in seepage velocity at the right arch foot of the main tunnel. The maximum seepage velocity is observed at the left arch foot, reaching a peak value of 3.5 × 10⁻⁷ m/s. As a result, the seepage velocity field in the main tunnel exhibits significant asymmetry.
Examining the contour of pore water pressure reveals that, under the condition of three parallel holes, mutual pressure relief between tunnels results in a decrease in pore water pressure in the surrounding rock between tunnels, leading to a sparse contour. The reduction in seepage rate and smaller water inflow of the main tunnel can be attributed to the force mechanism.

4. Fuzzy Comprehensive Evaluation System for Tunnel Water Inflow

The fuzzy comprehensive evaluation method, grounded in fuzzy mathematics, offers a systematic and clear approach to comprehensive assessment [28,29,30]. The general steps of the fuzzy comprehensive evaluation method are shown in Figure 12.

4.1. Establishment of Evaluation Set and Evaluation Factor Set

Compose a common set of factors that affect tunnel water inflow, called the factor set, represented by A, as shown in Equation (1):
A = a 1 , a 2 , , a m
where ai (i = 1, 2, 3, …, m) represents the factors that affect the water inflow of the tunnel, and these factors exhibit a certain degree of fuzziness.
At the same time, the evaluation results of tunnel water inflow will form a general set B, as shown in Equation (2):
B = b 1 , b 2 , , b n
where bj (j = 1, 2, 3, …, n) represents the evaluation results of tunnel water inflow when various factors affecting tunnel water inflow occur. According to the actual engineering situation, the evaluation set is divided into five grades: very severe, severe, relatively severe, slightly severe, and mild, represented by levels V, IV, III, II, and I, as shown in Table 2.

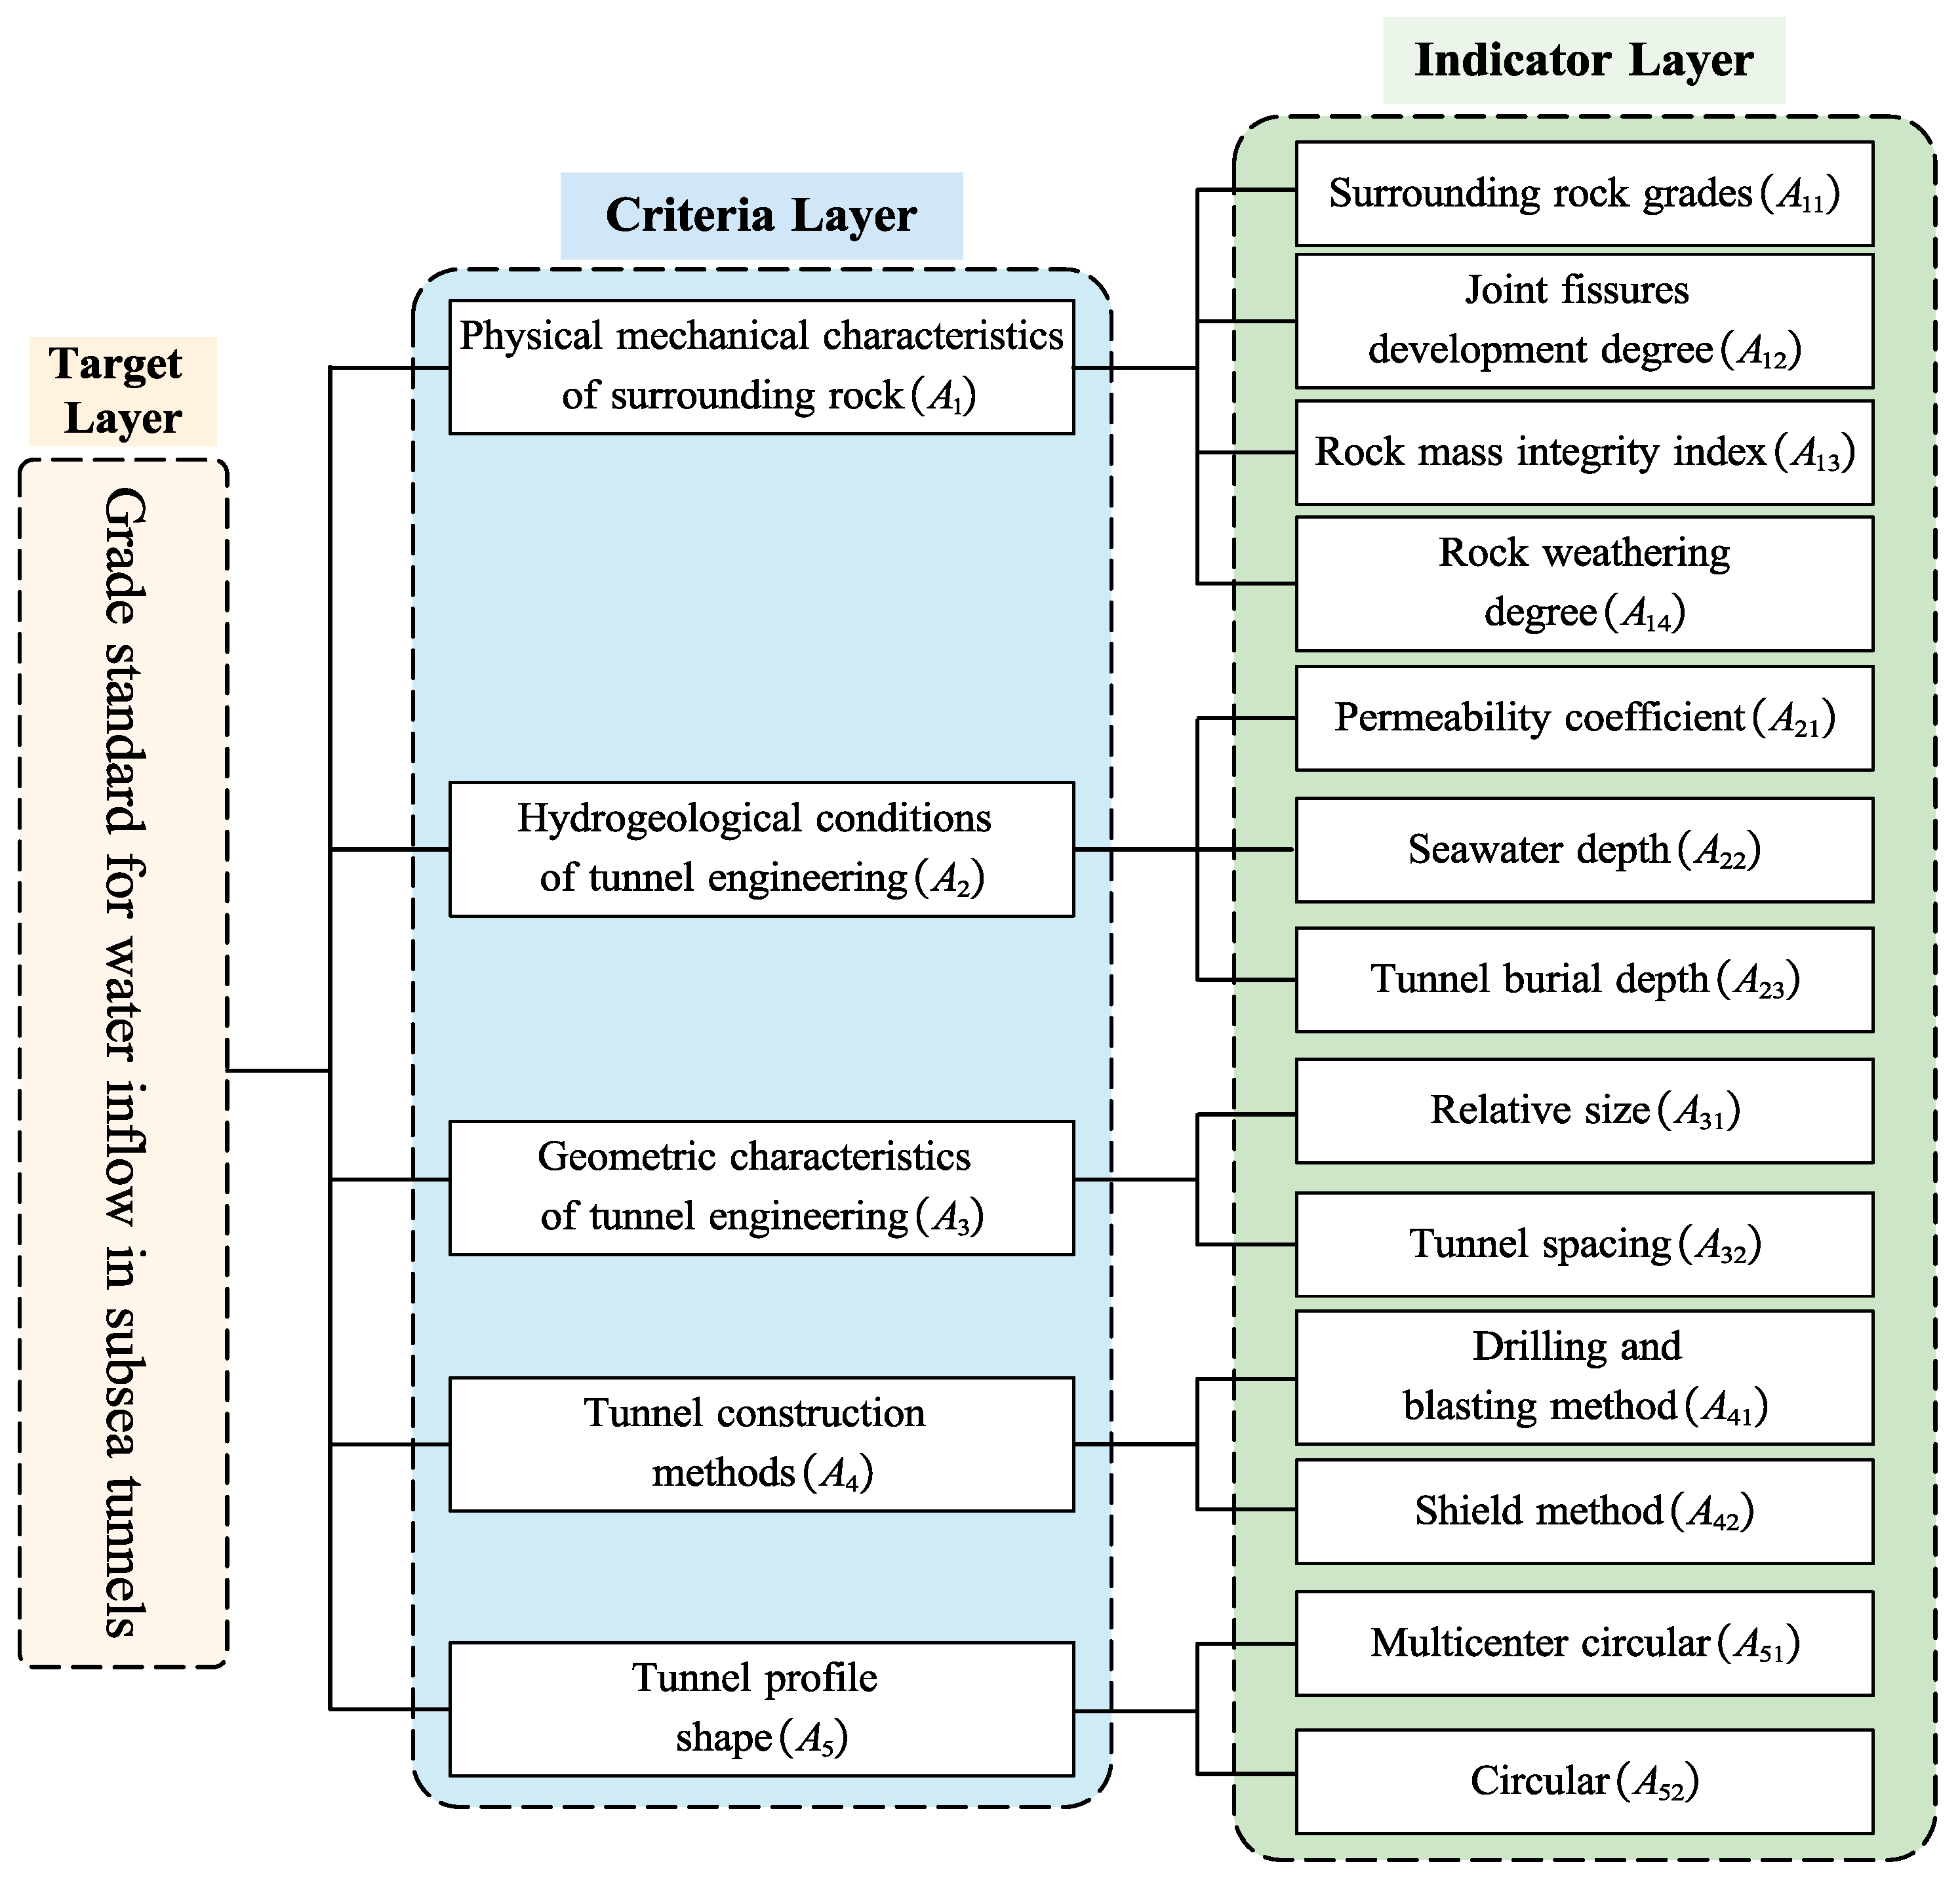
4.2. Evaluation Index System of Water Inflow

In the process of determining the indicators of influencing factors, this study comprehensively considers the impact of surveying, design, and construction on tunnel water inflow.
The influencing factors are shown in Figure 13. Five primary indicators (A1A5) were selected, covering the physical–mechanical characteristics of the surrounding rock (A1), hydrogeological conditions (A2), geometric features (A3), tunnel construction methods (A4), and tunnel profile shape (A5). For the physical–mechanical characteristics, considerations include the surrounding rock grades (A11), degree of joint fissure development (A12), rock mass integrity index (A13), and rock weathering degree (A14). The hydrogeological conditions encompass the soil permeability coefficient (A21), seawater depth (A22), and tunnel burial depth (A23). Geometric characteristics analysis involves the relative size (A31) and tunnel spacing (A32). The tunnel construction methods consider the impact of shield tunneling (A41) and the drilling and blasting method (A42). Cavity shape analysis examines differences in the multicenter circular section (A51) and circular section (A52) water inflow. The tunnel water inflow evaluation indicator system is presented in Table 3.

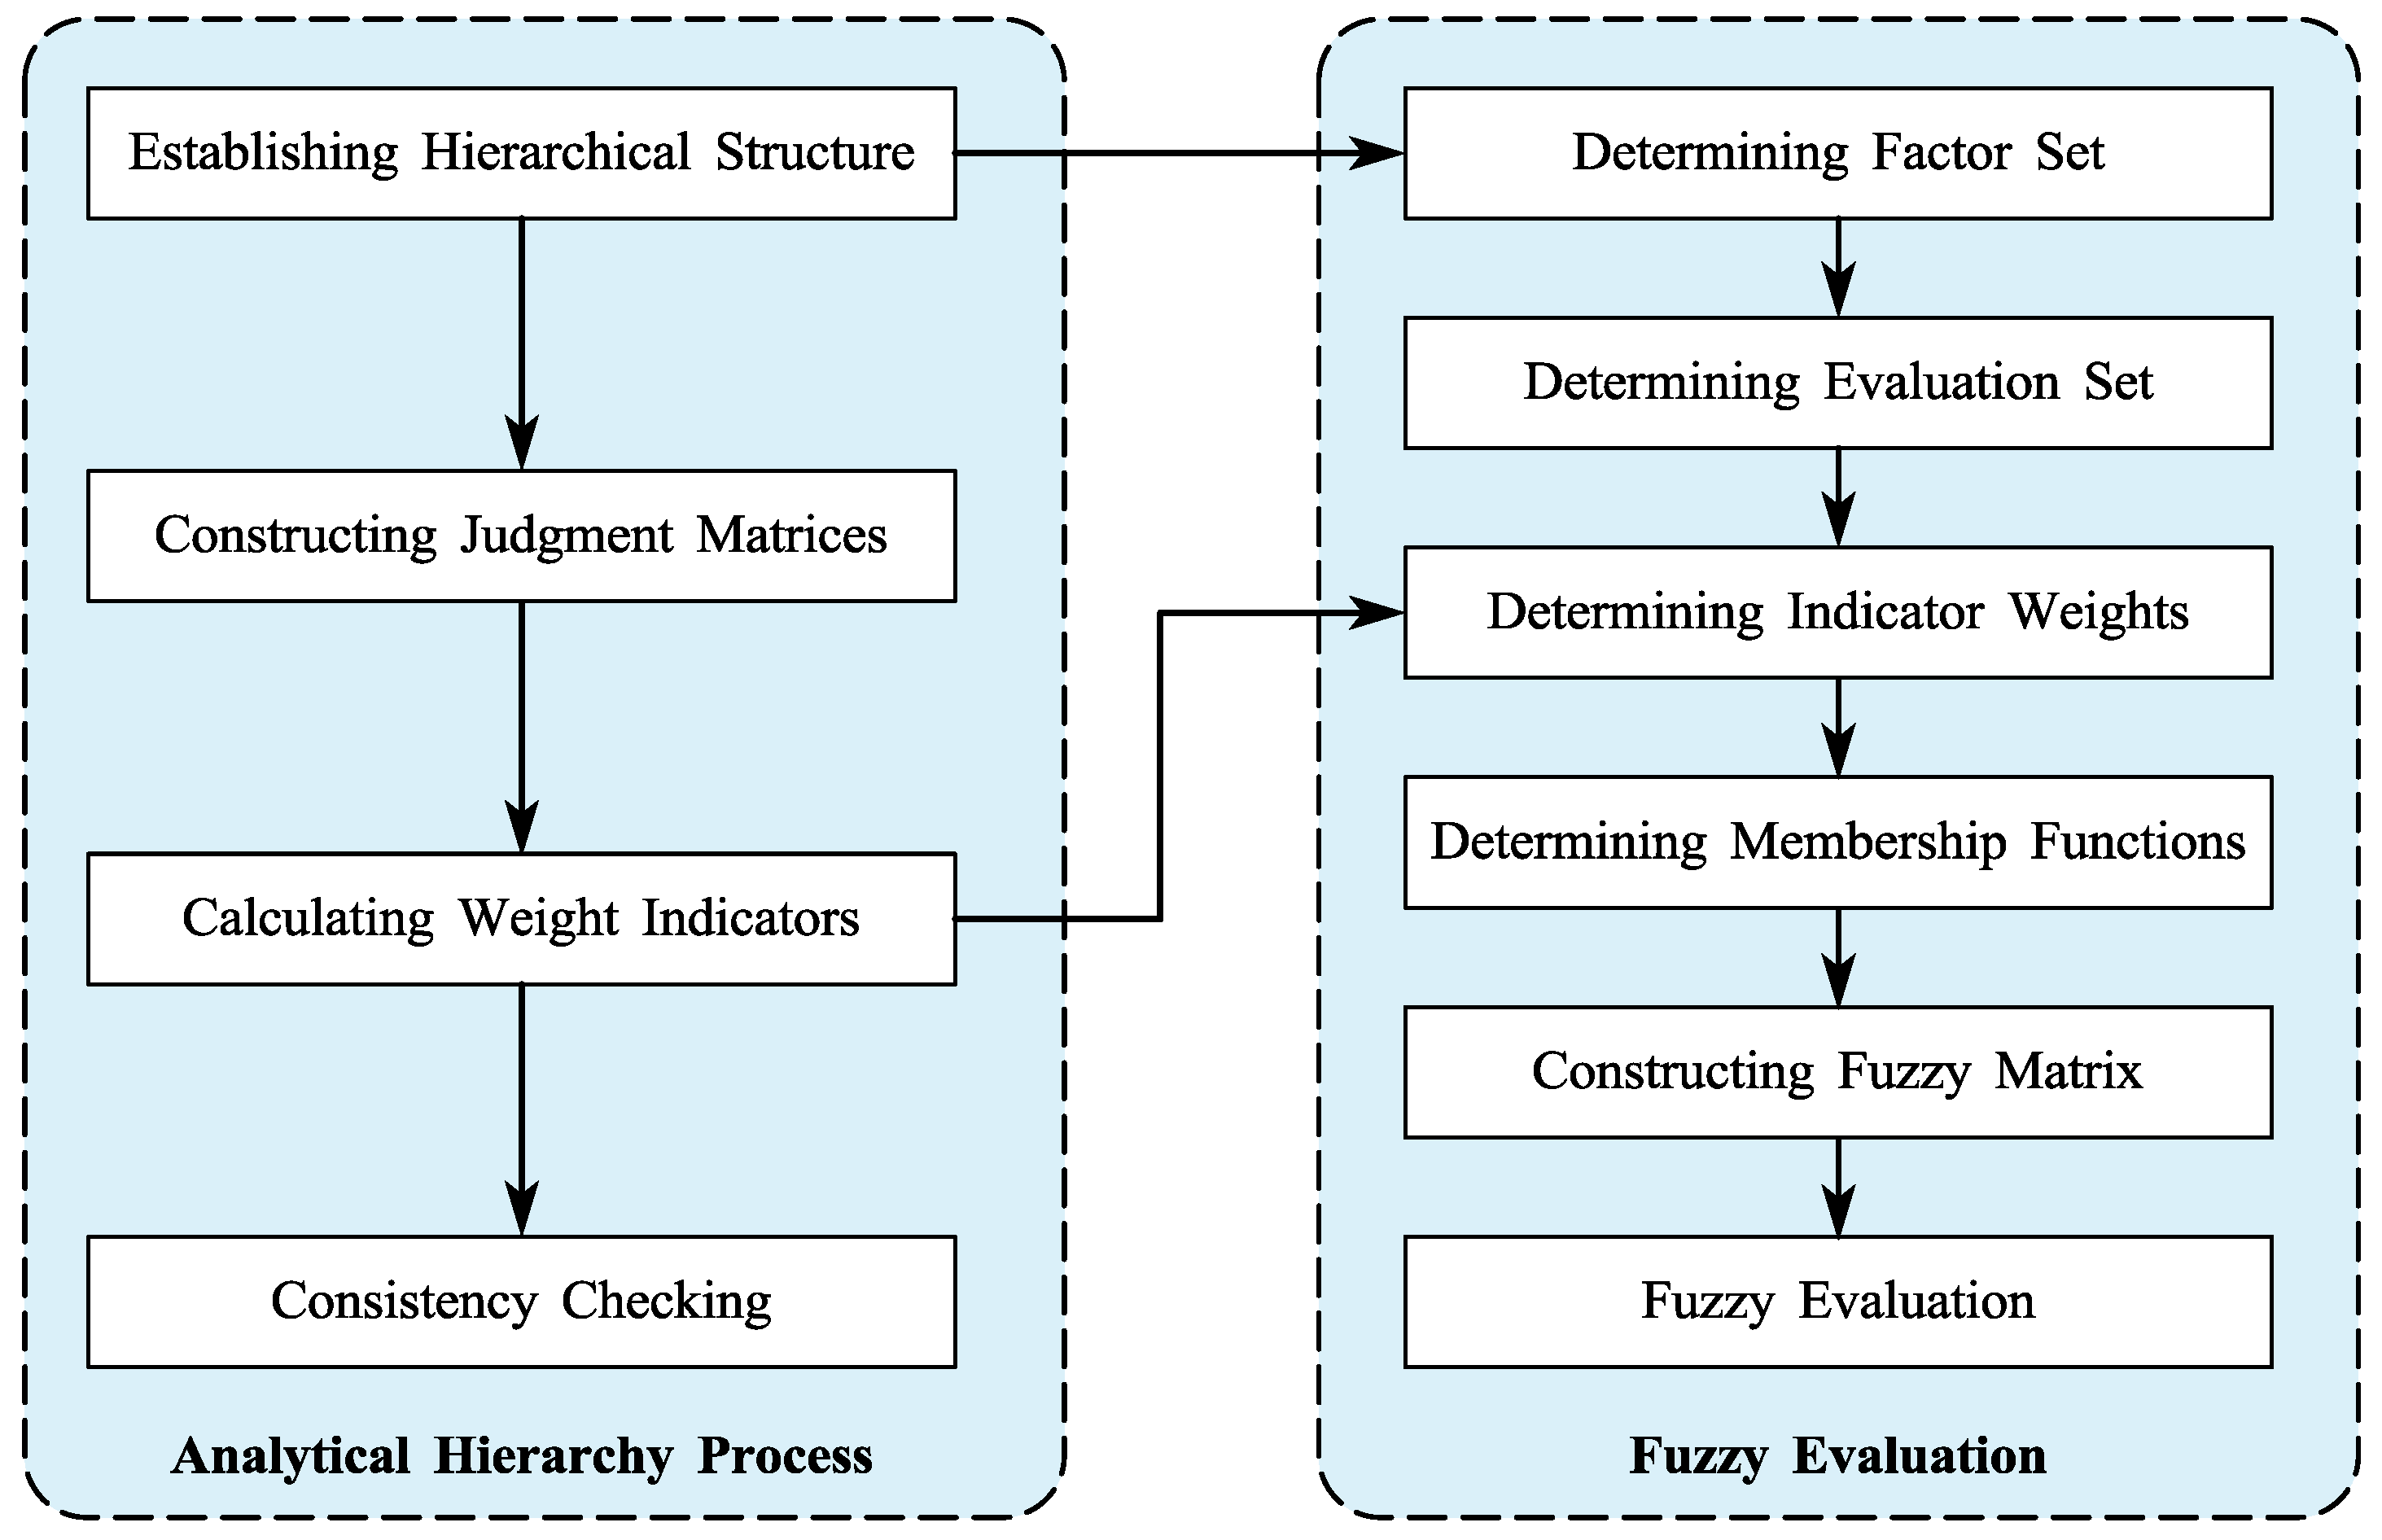
4.3. Establishment of Index Weights

The index weight quantifies the significance of factors influencing tunnel water inflow, ranging from 0 to 1. A higher value indicates a greater impact on the evaluation set. These weights adhere to the normalization principle, ensuring that their sum equals 1. In the fuzzy comprehensive evaluation method, the determination of factor weights is important. This is typically achieved through expert evaluation methods and the analytic hierarchy process.
The general steps of the analytic hierarchy process are as follows:
(a)
Establishing Hierarchical Structure: This entails defining the target problem clearly, identifying relevant influencing factors, constructing a hierarchical framework for these factors, and subsequently developing an evaluation system that encompasses the entire problem.
(b)
Using Scale Values for Relative Significance: To assess the relative significance of factors at the same level, it is advisable to utilize scale values. These values aid in constructing a correlation judgment matrix, with the scale values and their explanations shown in Table 4.
(c)
Calculating Eigenvalues and Eigenvectors: Perform calculations for the eigenvalues and eigenvectors of the matrix. After normalization, obtain the weight values corresponding to each factor.
(d)
Conducting Consistency Check: Check for consistency by calculating the consistency index (CI) using Equation (3). Determine the average random consistency index from Table 5 and calculate the consistency ratio (CR) using Equation (4). If the calculated CR < 0.1, the judgment matrix is considered consistent.
C I = λ max n n 1
where λmax is the maximum eigenvalue of the correlation judgment matrix, n is the order of the matrix, and CI is the consistency index.
C R = C I R I
where RI is the average random consistency index and CR is the consistency ratio.
In the establishment of the judgment matrix, adherence to the principles of objectivity, directionality, and measurability is maintained. A detailed analysis of the weights assigned to both the indicator and criterion layers will be presented.
(1)
Weight analysis of indicator layer
The weight judgment matrix for the physical–mechanical characteristics of the surrounding rock is shown in Table 6. Assuming that the maximum eigenvalue of this matrix is λmax and the corresponding eigenvector is η, through calculation, it can be obtained that λmax = 4.061, η = [0.393, 0.158, 0.393, 0.056]T and η is the weight. Simultaneously, the consistency ratio CR = 0.02 < 1 can be calculated from Equations (3) and (4) and passes the consistency check.
Moreover, the calculation of additional indicator layer parameters follows a similar methodology, and the results are presented in Table 7, Table 8, Table 9 and Table 10.
(2)
Weight analysis of criteria layer
Applying the same methodology as described above, the weight judgment matrix for the criteria layer can be deduced, and the detailed outcomes are presented in Table 11. The summary of weights for the final indicator layer and criteria layer is shown in Table 12.

4.4. Membership Function

In this study, the trapezoidal membership function in the univariate linear membership function is used to establish the membership degree of evaluation indicators. The general mathematical model is shown in Figure 14.

4.5. Multi-Factor Fuzzy Evaluation

By using fuzzy transformation between the single-factor evaluation matrix and the weight set, the results of the fuzzy comprehensive evaluation model can be obtained, as shown in Equation (5).
T = AR
where T is the fuzzy evaluation vector, A is the weight set vector, and R is the single-factor evaluation matrix. According to the principle of maximum membership, the position of the maximum value in the vector T is the grade of water inflow under this working condition.

5. Engineering Application of the Graded Evaluation of Water Inflow

To validate the applicability of the fuzzy comprehensive evaluation system for water inflow, a case study was conducted using a three-hole parallel subsea tunnel project as an example to assess the grading of water inflow. The basic engineering parameters are shown in Table 13. To explore the mutual influence between tunnels, the grade of water inflow is divided into two situations: (1) considering the mutual influence between tunnels, the evaluation indicators include tunnel geometric characteristics (tunnel spacing and relative size); (2) without the mutual influence between tunnels, the water inflow grade adopts a single-hole tunnel model.
(1)
Considering the mutual influence between tunnels
The weight of evaluation indicators is first calculated, and the corresponding evaluation matrix is obtained using a trapezoidal membership function. Multiplying the weight of the indicator layer by the corresponding evaluation matrix can obtain the fuzzy matrix of the indicator layer. The specific calculation results are shown in Table 14.
Based on this, the fuzzy matrix of the water inflow criteria layer of the main tunnel can be obtained in the case of three parallel holes:
R 1 = A 1 K 1 A 2 K 2 A 3 K 3 A 4 K 4 A 5 K 5 = 0 0 0.5232 0.4768 0 0.0503 0.0954 0.3287 0.5256 0 0 0.6667 0.3333 0 0 0 0.7500 0 0 0 0 0.6667 0 0 0
By substituting R1 into Equation (5), the evaluation vector T1 = (0.0143 0.1816 0.3924 0.3840 0) can be obtained. The maximum value in the T1 vector is 0.3924, which is in the fourth place. Based on the principle of maximum membership, the judgment is made, taking into account the mutual influence between tunnels. Under this working condition, the water inflow is level III.
(2)
Not considering the mutual influence between tunnels
Adopting a single-hole tunnel model, without considering the mutual influence between tunnels, the evaluation indicators remove the geometric features of tunnels (tunnel spacing and relative size) and still use the fuzzy comprehensive evaluation method to grade the water inflow of tunnels under the same conditions, obtaining the fuzzy matrix of the criteria layer:
R 2 = 0 0 0.5232 0.4768 0 0.0503 0.0954 0.3287 0.5256 0 0 0.7500 0 0 0 0 0.6667 0 0 0
Substitute R2 into Equation (5) to obtain the evaluation vector T2 = (0.0151 0.1265 0.3940 0.4268 0). Based on the principle of maximum membership, without considering the mutual influence between tunnels, the water inflow under the same conditions is level IV. Consequently, in certain engineering projects, using a single-hole tunnel seepage model without considering the mutual influences between tunnels may result in overestimating tunnel water inflow, leading to the waste of water-blocking materials.

6. Conclusions

This study focuses on a three-hole parallel subsea tunnel as its research subject. By conducting a single-factor analysis of water inflow, the study employs the analytic hierarchy process and fuzzy evaluation method to establish a comprehensive fuzzy evaluation system for water inflow. The main conclusions are as follows:
(1)
Under the condition of three parallel tunnels, the water inflow increases linearly with the rise in permeability coefficient and seawater depth. As the burial depth increases, it exhibits a trend of initially decreasing and then increasing. The water inflow rises with an increase in tunnel spacing, approaching the water inflow of a single-hole tunnel. Conversely, it decreases with an increase in the relative size between the service tunnel and the main tunnel.
(2)
Under the condition of three parallel holes, there is mutual influence of the seepage field between subsea tunnels, which leads to a decrease in pore water pressure and a decrease in seepage velocity between tunnels. Using a single-hole tunnel model can lead to a higher predicted value of tunnel water inflow.
(3)
The water inflow evaluation system, constructed based on the fuzzy comprehensive evaluation method, can quantitatively process various influencing factors and classify water inflow grades. Engineering cases have demonstrated that neglecting the mutual influence between tunnels in a single-hole tunnel model can result in an increased water inflow grade. Therefore, in the grading evaluation system for three-hole parallel subsea tunnels, the mutual influence between tunnels should be considered.

Author Contributions

Conceptualization, Z.H. and Z.Z.; methodology, Z.H. and K.Y.; software, K.Y.; validation, Z.H. and K.Y.; formal analysis, Z.H. and K.Y.; data curation, K.Y.; writing—original draft preparation, Z.H. and K.Y.; writing—review and editing, Z.H. and K.Y.; visualization, H.C.; supervision, Z.Z.; funding acquisition, Z.H. and Z.Z. All authors have read and agreed to the published version of the manuscript.

Funding

The research described in this study was financially supported by the General Program of National Natural Science Foundation of China (Grant No.: 51978424), the Innovation Research Group Project of Natural Science Foundation of Hebei Province of China (Grant No.: E2022210078), the S&T Program of Hebei Province in China (Grant No.: 22375416D), and the General Program of Natural Science Foundation of Hebei Province of China (Grant No.: E2022210040).

Institutional Review Board Statement

Not applicable.

Informed Consent Statement

Not applicable.

Data Availability Statement

The data presented in this study are available upon request from the corresponding author.

Conflicts of Interest

The authors declare no conflict of interest.

References

  1. Hawley, C.J.; Gräbe, P.J. Water leakage mapping in concrete railway tunnels using LiDAR generated point clouds. Constr. Build. Mater. 2022, 361, 129644. [Google Scholar] [CrossRef]
  2. Sun, Z.; Zhang, D.; Fang, Q. Technologies for large cross-section subsea tunnel construction using drilling and blasting method. Tunn. Undergr. Space Technol. 2023, 141, 105161. [Google Scholar] [CrossRef]
  3. Jiang, N.; Lyu, G.; Wu, T.; Zhou, C.; Li, H.; Yang, F. Vibration effect and ocean environmental impact of blasting excavation in a subsea tunnel. Tunn. Undergr. Space Technol. 2023, 131, 104855. [Google Scholar] [CrossRef]
  4. Langford, J.; Holmøy, K.H.; Hansen, T.F.; Holter, K.G.; Stein, E. Analysis of water ingress, grouting effort, and pore pressure reduction caused by hard rock tunnels in the Oslo region. Tunn. Undergr. Space Technol. 2022, 130, 104762. [Google Scholar] [CrossRef]
  5. Wang, L.; Chen, H.; Liu, Y.; Li, H.; Zhang, W. Application of copula-based Bayesian network method to water leakage risk analysis in cross river tunnel of Wuhan Rail Transit Line 3. Adv. Eng. Inform. 2023, 57, 102056. [Google Scholar] [CrossRef]
  6. Yu, J.; Li, D.; Zheng, J.; Zhang, Z.; He, Z.; Fan, Y. Analytical study on the seepage field of different drainage and pressure relief options for tunnels in high water-rich areas. Tunn. Undergr. Space Technol. 2023, 134, 105018. [Google Scholar] [CrossRef]
  7. Golian, M.; Teshnizi, E.S.; Nakhaei, M. Prediction of water inflow to mechanized tunnels during tunnel-boring-machine advance using numerical simulation. Hydrogeol. J. 2018, 26, 2827–2851. [Google Scholar] [CrossRef]
  8. Shahbazi, A.; Chesnaux, R.; Saeidi, A. A new combined analytical-numerical method for evaluating the inflow rate into a tunnel excavated in a fractured rock mass. Eng. Geol. 2021, 283, 106003. [Google Scholar] [CrossRef]
  9. Zhu, C.-W.; Wu, W.; Ying, H.-W.; Gong, X.-N.; Guo, P.-P. Drainage-induced ground response in a twin-tunnel system through analytical prediction over the seepage field. Undergr. Space 2022, 7, 408–418. [Google Scholar] [CrossRef]
  10. Qin, Z.; Wang, Y.; Song, Y.; Dong, Q. The Analysis on Seepage Field of Grouted and Shotcrete Lined Underwater Tunnel. Math. Probl. Eng. 2020, 2020, 7319054. [Google Scholar] [CrossRef]
  11. Joo, E.J.; Shin, J.H. Relationship between water pressure and inflow rate in underwater tunnels and buried pipes. Géotechnique 2014, 64, 226–231. [Google Scholar] [CrossRef]
  12. Guo, Y.F.; Wang, H.N.; Jiang, M.J. An exact analytical approach for determining the seepage field around underwater twin tunnels with linings. Transp. Geotech. 2023, 42, 101050. [Google Scholar] [CrossRef]
  13. Park, K.-H.; Owatsiriwong, A.; Lee, J.-G. Analytical solution for steady-state groundwater inflow into a drained circular tunnel in a semi-infinite aquifer: A revisit. Tunn. Undergr. Space Technol. 2008, 23, 206–209. [Google Scholar] [CrossRef]
  14. Liu, X.; Wang, D.; Zhang, Y.; Jiang, A.; Fang, Q.; Zhang, R. Analytical solutions on non-Darcy seepage of grouted and lined subsea tunnels under dynamic water levels. Ocean Eng. 2023, 267, 113276. [Google Scholar] [CrossRef]
  15. Li, S.-c.; Liu, H.-l.; Li, L.-p.; Zhang, Q.-q.; Wang, K.; Wang, K. Large scale three-dimensional seepage analysis model test and numerical simulation research on undersea tunnel. Appl. Ocean Res. 2016, 59, 510–520. [Google Scholar] [CrossRef]
  16. Rasouli Maleki, M. Groundwater Seepage Rate (GSR); a new method for prediction of groundwater inflow into jointed rock tunnels. Tunn. Undergr. Space Technol. 2018, 71, 505–517. [Google Scholar] [CrossRef]
  17. Katibeh, H.; Aalianvari, A. Development of a New Method for Tunnel Site Rating from Groundwater Hazard Point of View. J. Appl. Sci. 2009, 9, 1496–1502. [Google Scholar] [CrossRef]
  18. Ho, W.; Ma, X. The state-of-the-art integrations and applications of the analytic hierarchy process. Eur. J. Oper. Res. 2018, 267, 399–414. [Google Scholar] [CrossRef]
  19. Li, L.; Lei, T.; Li, S.; Zhang, Q.; Xu, Z.; Shi, S.; Zhou, Z. Risk assessment of water inrush in karst tunnels and software development. Arab. J. Geosci. 2014, 8, 1843–1854. [Google Scholar] [CrossRef]
  20. Mahmoodzadeh, A.; Ghafourian, H.; Hussein Mohammed, A.; Rezaei, N.; Hashim Ibrahim, H.; Rashidi, S. Predicting tunnel water inflow using a machine learning-based solution to improve tunnel construction safety. Transp. Geotech. 2023, 40, 100978. [Google Scholar] [CrossRef]
  21. Qiu, D.; Chen, Q.; Xue, Y.; Su, M.; Liu, Y.; Cui, J.; Zhou, B. A new method for risk assessment of water inrush in a subsea tunnel crossing faults. Mar. Georesources Geotechnol. 2021, 40, 679–689. [Google Scholar] [CrossRef]
  22. Zarei, H.R.; Uromeihy, A.; Sharifzadeh, M. A new tunnel inflow classification (TIC) system through sedimentary rock masses. Tunn. Undergr. Space Technol. 2013, 34, 1–12. [Google Scholar] [CrossRef]
  23. Lin, L.; Xia, Y.; Wu, D. A hybrid fuzzy multiple criteria decision-making approach for comprehensive performance evaluation of tunnel boring machine disc cutter. Comput. Ind. Eng. 2020, 149, 106793. [Google Scholar] [CrossRef]
  24. Dou, S.; Shen, Y.; Zhu, H. Fuzzy-based multi-criteria humanistic assessment system for city tunnels: From methodology to application. Tunn. Undergr. Space Technol. 2023, 134, 104993. [Google Scholar] [CrossRef]
  25. Qin, Z.; He, W.; Zhou, H. Analytical study on seepage field of subsea twin tunnels constructed by NATM. Ocean Eng. 2022, 264, 112345. [Google Scholar] [CrossRef]
  26. Mahmoodzadeh, A.; Mohammadi, M.; M Gharrib Noori, K.; Khishe, M.; Hashim Ibrahim, H.; Farid Hama Ali, H.; Nariman Abdulhamid, S. Presenting the best prediction model of water inflow into drill and blast tunnels among several machine learning techniques. Autom. Constr. 2021, 127, 103719. [Google Scholar] [CrossRef]
  27. Yau, K.; Paraskevopoulou, C.; Konstantis, S. Spatial variability of karst and effect on tunnel lining and water inflow. A probabilistic approach. Tunn. Undergr. Space Technol. 2020, 97, 103248. [Google Scholar] [CrossRef]
  28. Yazdani-Chamzini, A.; Yakhchali, S.H. Tunnel Boring Machine (TBM) selection using fuzzy multicriteria decision making methods. Tunn. Undergr. Space Technol. 2012, 30, 194–204. [Google Scholar] [CrossRef]
  29. Wei, D.; Du, C.; Lin, Y.; Chang, B.; Wang, Y. Thermal environment assessment of deep mine based on analytic hierarchy process and fuzzy comprehensive evaluation. Case Stud. Therm. Eng. 2020, 19, 100618. [Google Scholar] [CrossRef]
  30. Mohandes, S.R.; Zhang, X. Towards the development of a comprehensive hybrid fuzzy-based occupational risk assessment model for construction workers. Saf. Sci. 2019, 115, 294–309. [Google Scholar] [CrossRef]
Figure 1. Three-hole parallel subsea tunnel.
Applsci 13 12761 g001
Figure 2. Computational model for seepage field in three-hole parallel subsea tunnels.
Applsci 13 12761 g002
Figure 3. Distribution of pore water pressure during steady seepage (unit: kPa).
Applsci 13 12761 g003
Figure 4. Relationship between permeability coefficient of surrounding rock and water inflow.
Applsci 13 12761 g004
Figure 5. Relationship between seawater depth and water inflow.
Applsci 13 12761 g005
Figure 6. Relationship between the depth of the tunnel and water inflow.
Applsci 13 12761 g006
Figure 7. Relationship between tunnel spacing and water inflow.
Applsci 13 12761 g007
Figure 8. Relationship between S2/S1 and the water inflow of the main tunnel.
Applsci 13 12761 g008
Figure 9. Seepage velocity of the main tunnel in a three-hole parallel tunnel.
Applsci 13 12761 g009
Figure 10. Seepage velocity of a single-hole tunnel.
Applsci 13 12761 g010
Figure 11. Distribution of pore water pressure during steady seepage in tunnels (unit: kPa). (left) Three-hole tunnel. (right) Single-hole tunnel.
Applsci 13 12761 g011
Figure 12. Fuzzy comprehensive evaluation method.
Applsci 13 12761 g012
Figure 13. Hierarchy of influencing factors.
Applsci 13 12761 g013
Figure 14. Trapezoidal membership function.
Applsci 13 12761 g014
Table 1. Calculation parameters.
ParameterUnitValue
Main tunnel aream2162.7
Service tunnel aream238.5
Burial depth of main tunnelm32.3
Burial depth of service tunnelm36.2
Tunnel spacingm27.5
Seawater depthm20
Permeability coefficient of surrounding rockm/d0.13
Table 2. Classification of tunnel water inflow grades.
Water Inflow GradeWater Inflow EvaluationRisk Value
Mild (generally no risk of inrush)0~20
Slightly severe (possible occurrence of fissure inrush)20~40
Relatively severe (possible occurrence of localized inrush)40~60
Severe (possible occurrence of localized inrush)60~80
Very severe (possible occurrence of large-scale inrush)80~100
Table 3. Evaluation index system for tunnel water inflow.
Target LayerCriteria LayerIndicator LayerAssessment of Water Inflow
IIIIIIIVV
Grade standard for water inflow in subsea tunnelsPhysical–mechanical characteristics of surrounding rockSurrounding rock gradesⅠ, IIIIIIVVVI
Joint fissure development degreeUndevelopedModerately developedDevelopedHighly developedDisordered
Rock mass integrity index (Kv)Kv > 0.750.75 ≥ Kv > 0.550.55 ≥ Kv > 0.350.35 ≥ Kv > 0.15Kv < 0.15
Rock weathering degreeUnweatheredSlightly weatheredModerately weatheredHighly weatheredCompletely weathered
Hydrogeological conditions of tunnel engineeringPermeability coefficient (m/d)<0.010.01~0.050.05~0.10.1~0.15>0.15
Seawater depth (m)<1010~2020~3030~4040~50
Tunnel burial depth (m)20~4040~6060~8080~100 ∪ 10~20<10 ∪ >100
Geometric characteristics of tunnel engineeringRelative size>10.7~1.00.3~0.70.1~0.3<0.1
Tunnel spacing (m)<2525~5050~7575~100>100
Tunnel construction methodsDrilling and blasting methodDrilling and blasting method
Shield methodShield method
Tunnel profile shapeMulticenter circularMulticenter circular
CircularCircular
Table 4. The AHP pairwise comparison scale.
Numerical ValuesExplanation
1When comparing two factors, factor i is as equally important as factor j
3When comparing two factors, factor i is slightly more important than factor j
5When comparing two factors, factor i is more important than factor j
7When comparing two factors, factor i is significantly more important than factor j
9When comparing two factors, factor i is absolutely more important than factor j
2, 4, 6, 8The comparison results of the importance between factors i and j fall within the ranges of
1–3, 3–5, 5–7, and 7–9
ReciprocalThe comparison results of the importance between factors j and i are reciprocals of the comparison results between factors i and j
Table 5. Average random consistency indicators.
n12345678910
RI000.520.891.121.261.361.411.461.49
Table 6. Weight judgment matrix for the physical–mechanical characteristics of the surrounding rock.
Physical–Mechanical Characteristics of Surrounding Rock A1A11A12A13A14WeightCR
Surrounding rock grades (A11)13160.3930.03
Joint fissure development degree (A12)1/311/340.158
Rock mass integrity index (A13)13160.393
Rock weathering degree (A14)1/61/41/610.056
Table 7. Weight judgment matrix for tunnel engineering hydrogeological conditions.
Hydrogeological Conditions of Tunnel Engineering A2A21A22A23WeightCR
Permeability coefficient (A21)1450.6740.08
Seawater depth (A22)1/4130.226
Tunnel burial depth (A23)1/51/310.100
Table 8. Weight judgment matrix for tunnel geometric characteristics.
Geometric Characteristics of Tunnel Engineering A3A31A32WeightCR
Relative size (A31)11/20.3330
Tunnel spacing (A32)210.667
Table 9. Weight judgment matrix for tunnel engineering construction methods.
Tunnel Construction Methods A4A41A42WeightCR
Drilling and blasting method (A41)130.7500
Shield method (A42)1/310.250
Table 10. Weight judgment matrix for tunnel profile shape.
Tunnel Profile Shape A5A51A52WeightCR
Multicenter circular (A51)120.6670
Circular (A52)1/210.333
Table 11. Criterion layer weight analysis.
Grade of Water Inflow in Subsea TunnelsA1A2A3A4A5WeightCR
Physical–mechanical characteristics of surrounding rock (A1)135680.4930.07
Hydrogeological conditions of tunnel engineering (A2)1/314570.283
Geometric characteristics of tunnel engineering (A3)1/51/41350.124
Tunnel construction methods (A4)1/61/51/3130.066
Tunnel profile shape (A5)1/81/71/51/310.034
Table 12. Criteria layer and indicator layer weight sets.
Criteria LayerWeightCriteria Layer Weight SetIndicator LayerWeightIndicator Layer Weight Set
Physical–mechanical characteristics of surrounding rock0.493 A = 0.493 0.283 0.124 0.066 0.034 Surrounding rock grades0.393 A 1 = 0.393 , 0.158 , 0.393 , 0.056 T
Joint fissure development degree0.158
Rock mass integrity index0.393
Rock weathering degree0.056
Hydrogeological conditions of tunnel engineering0.283Permeability coefficient0.674 A 2 = 0.674 , 0.226 , 0.100 T
Seawater depth0.226
Tunnel burial depth0.100
Geometric characteristics of tunnel engineering0.124Relative size0.333 A 3 = 0.333 , 0.667 T
Tunnel spacing0.667
Tunnel construction methods0.066Drilling and blasting method0.750 A 4 = 0.750 , 0.250 T
Shield method0.250
Tunnel profile shape0.034Multicenter circular0.667 A 5 = 0.667 , 0.333 T
Circular0.333
Table 13. Engineering parameters.
ParameterValueParameterValue
Surrounding rock gradesIV-levelPermeability coefficient (m/d)0.093 (m/d)
Joint fissure development degreeDevelopedSeawater depth (m)19 m
Rock mass integrity index (Kv)0.41Tunnel burial depth (m)35 m
Rock weathering degreeModerately weatheredRelative size0.50
Tunnel construction methodsDrilling and blasting methodTunnel profile shapeMulticenter circular
Table 14. Calculation results of the fuzzy matrix of the i indicator layer.
ParametersGradesEvaluation Matrix
IIIIIIIVV
Surrounding rock grades000.30.70 K 1 = 0 0 0.3 0.7 0 0 0 1 0 0 0 0 0.6 0.4 0 0 0 0.2 0.8 0
Joint fissure development degree00100
Rock mass integrity index000.60.40
Weathering degree of rock mass000.20.80
Permeability coefficient000.220.780 K 2 = 0 0 0.22 0.78 0 0 0.2 0.8 0 0 0.5 0.5 0 0 0
Seawater depth00.20.800
Buried depth of tunnel0.50.5000
Relative size00100 K 3 = 0 0 1 0 0 0 1 0 0 0
Tunnel spacing01000
Drilling and blasting method01000 K 4 = 0 1 0 0 0 0 0 0 0 0
Shield method00000
Multicenter circular01000 K 5 = 0 1 0 0 0 0 0 0 0 0
Circular00000
Disclaimer/Publisher’s Note: The statements, opinions and data contained in all publications are solely those of the individual author(s) and contributor(s) and not of MDPI and/or the editor(s). MDPI and/or the editor(s) disclaim responsibility for any injury to people or property resulting from any ideas, methods, instructions or products referred to in the content.

