1. Introduction
The interactivity between real and virtual objects geometrically and temporally aligned in the real environment defines augmented reality (AR) [
1]. The technological advances observed over the last decade have stimulated the implementation of several AR applications in industry [
2,
3,
4,
5,
6,
7,
8]. The rigor of the precision and accuracy requirements for placing virtual elements in real environments combined with the progress achieved by devices in terms of these competencies has driven the development of AR solutions.
Localization and tracking approaches in AR systems can be based on sensors, visual elements, or both [
9]. Regardless of the approach used, factors such as the occlusion of markers, moving objects, noise, electromagnetism, and low light are often observed in industrial environments. They hinder or limit the ability to accurately determine the location and orientation of a device, adding tracking failures to an AR system [
10]. Given these challenges, the ability to align virtual and real components with precision and accuracy can determine the feasibility of AR systems in industrial environments [
9]. The common challenges inherent to this process include the reliability and scalability in the tracking of device movement [
5,
10], calibration [
2], and the precise contextualization of overlapping information in the real environment [
10].
Some studies [
11] use the recognition of fiducial markers as a strategy in augmented reality applications. However, execution environments are usually restricted to small spaces such as tables or workbenches. Therefore, they disregard or minimize the effects of factors that can negatively affect the experience of AR applications in an industrial environment. Although other studies [
12] consider these aspects and cite the relevance of keeping the positioning of holograms precise and accurate as a precondition for standardized scientific experiments, they almost always present qualitative and subjective analyses of the precision and accuracy of the experiments.
The literature describes the basic architectural components of AR systems: cameras, tracking systems, and user interfaces [
5]. Although there are several ways to integrate these elements, studies highlight the relevance of head-mounted displays (HMDs) because they allow operators to move around and access information hands-free [
5,
13].
Of the devices currently available in the market, the Microsoft HoloLens mixed reality device stands out in terms of performance, presenting itself as a complete and self-contained AR tool [
14], i.e., an HMD with all the AR architectural elements embedded in a single device. These studies reveal the importance of representing holograms in AR applications with accuracy and precision, list the characteristics of industrial environments that hinder success, and, finally, reveal the demand for scientific productions that measure these parameters objectively. Thus, they contribute to the motivation of this study. Although it is possible to find a few studies, such as [
15,
16], capable of proposing quantitative methods to measure the accuracy and precision of their AR solutions, the coverage area of the applications is limited to small distances (a few meters) and has low sampling.
Considering the lack of studies related to the calibration of AR systems, specifically examining the challenges facing HoloLens observed in industrial environments in terms of applying AR solutions efficiently, the following question arises: how to develop a calibration method that helps AR systems to maintain the accuracy and precision of their solutions in industrial areas? To answer to that question, the objective of this study is to propose two models of 3D coordinate calibration for AR applications in an industrial indoor environment and compare these solutions’ performances based on their accuracy and precision in displaying virtual objects in these scenarios.
This study is divided into four sections including this introduction.
Section 2 describes the methods and experiments carried out to evaluate the precision and accuracy of the implemented models,
Section 3 presents the proposed calibration model and the outcomes, and
Section 4 presents the final considerations and suggestions for future research.
2. Materials and Methods
We adopted the design science research (DSR) paradigm. In addition to a knowledge contribution, DSR contributes to the real-world application environment from which the research problem or opportunity is drawn [
17].
Our method parallels that described by Gregor and Hevner [
17], which includes six steps: (1) identify the problem, (2) define solution objectives, (3) design and development, (4) demonstration, (5) evaluation, and (6) communication.
In steps 1 and 2, we carried out a systematic literature review to understand the problem and define the solution objectives.
In step 3, we designed and developed the calibration models proposed. We employed the Unity3D ecosystem, which is a popular tool for crafting 2D and 3D simulations, offering support for over 20 different execution platforms, including HoloLens. Its primary function is to provide a basic framework for associating visual elements (such as buttons, text, images, and 3D objects) with their respective behaviors, defined using application programming interfaces (APIs) and software development kits (SDKs).
We also used the Mixed Reality Toolkit (MRTK), which is an SDK developed by Microsoft to assist in the creation of virtual and augmented reality applications, equipped with its own set of components and resources for integration within Unity3D. Several key functionalities of the MRTK played a significant role in the development of the test application in this study, including interfaces for the input and output of data with the potential for interaction with real-world surfaces, real-time access to the spatial mapping results provided by the HoloLens, and management of anchors implemented through the WorldAnchorManager class. The MRTK software architecture is extensible, allowing developers to customize component behaviors through the utilization of its interfaces. In this research, this capability was leveraged to programmatically assign anchor behavior to specific instances of virtual objects within the environment.
Another SDK used in the development of the test application is Vuforia [
18], designed to recognize specific features in flat images or 3D objects for runtime tracking. This feature enables developers to position and orient virtual objects concerning real-world objects when they are viewed through the device’s camera and recognized by Vuforia’s computer vision algorithms. Consequently, it becomes possible to establish a correspondence between the observer’s perspective regarding the recognized real object and the virtual object projected onto it, creating the illusion that the virtual object is an integral part of the real-world scene. Vuforia provides APIs in various programming languages and includes support for .NET through an extension for Unity3D. .NET is a Microsoft initiative for unifying executable libraries across language-independent environments. This approach allows developers to write code that is not specific to a particular device and instead create solutions for the .NET platform. As a result, Vuforia can execute its functionalities on HoloLens just as it would on other devices. In this study, Vuforia was employed for the recognition of fiducial markers within the test application, facilitating the creation of virtual object instances on these markers.
The data collected during the test was stored in comma separated value (CSV) format, a simple and widely recognized data format in the field of computing, compatible with numerous software applications. The R language was used to generate graphical visualizations of the collected data. R is a language dedicated to data analysis, manipulation, and visualization, originally developed by Ross Ihaka and Robert Gentleman in the Department of Statistics at the University of Auckland, New Zealand, and is currently maintained by volunteers under the General Public License (GPL). The choice of data format and language for analysis was based on the researcher’s familiarity and did not impact the study’s outcomes.
Then, in step 4, we demonstrated a proof-of-concept of our proposed calibration models. To meet the challenges inherent to industrial environments, the scenario defined for this stage was a logistics warehouse. This warehouse is approximately 10,000 m3, contains a large variety of equipment and components, and has characteristics such as dynamism in the composition of its internal layout and variability in lighting, noise, and obstacles.
The International Organization for Standardization (ISO) defines, in ISO 5725-1:2023, accuracy as the closeness of agreement between a test result and the actual value and precision as the closeness of agreement between independent test results obtained under stipulated conditions [
19].
In step 5, we evaluated our proposed calibration models in terms of validity criteria, since DSR includes gathering evidence that the artifact is useful, meaning that the artifact works and does what it is intended to do [
17]. To measure these indicators, two experiments were carried out. The first experiment was to verify and compare, in an industrial environment, the precision of the proposed two-step calibration model with a simple calibration model. The second experiment was to check if, in fact, the proposed model achieved the objective of locating and assisting in the identification of components within an industrial environment.
To evaluate the precision (i.e., the dispersion of the samples) and accuracy (i.e., the exactness) of the simple and two-step calibrations in an industrial scenario, the prototype was programmed to perform each calibration separately so that, after the calibration step, it would be able to measure the virtual coordinates relative to the calibration system origin of markers placed in different locations within the scenario.
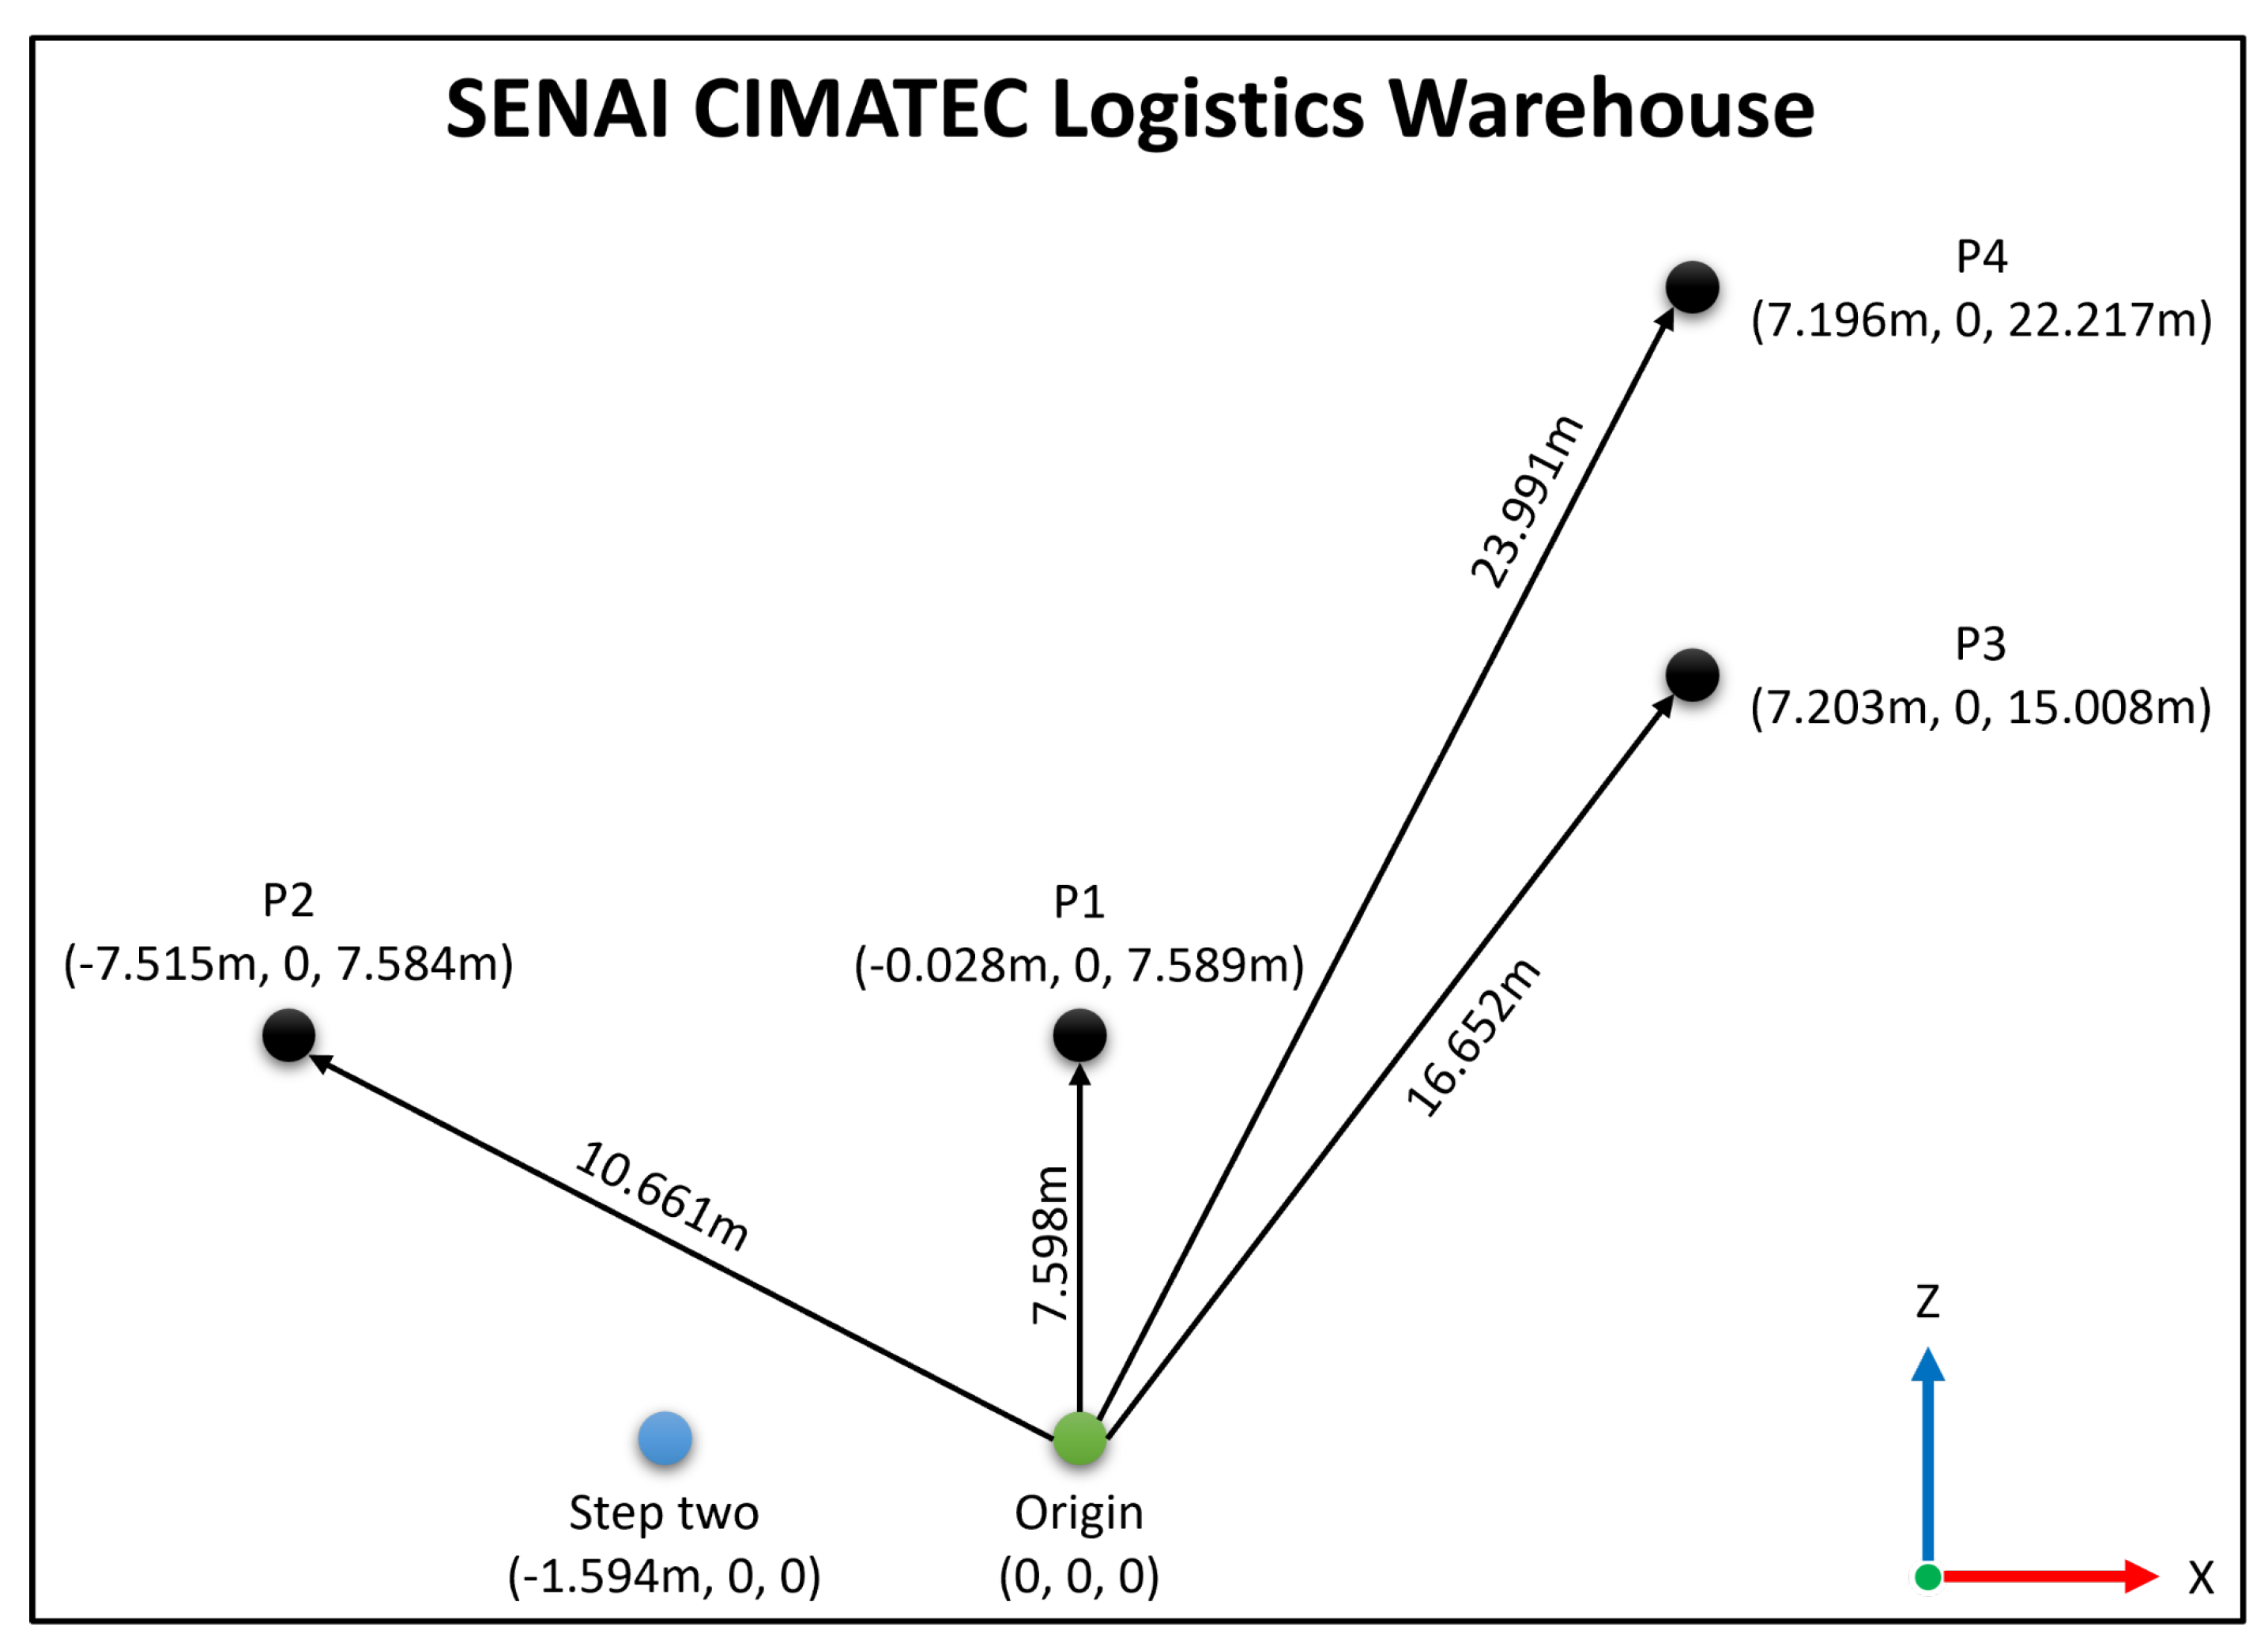
To configure the experimental environment, five points were first selected inside the warehouse. The criteria for choosing these points were as follows:
Locations that remained the same throughout the experiment. Changes in these locations would require measurements to be re-performed;
Locations where it was possible to measure with a laser tape measure from the point chosen as the origin to obtain a rigorous measurement (gold standard);
Locations at different distances from the point chosen as the origin;
Locations where all markers could be placed at the same height, facilitating data analysis;
Locations where the markers could be viewed from the front, with at least one meter of distance, so that the marker could be viewed by the HoloLens camera.
Once the points were selected, one of them was defined as the origin, a fiducial marker was placed at this point, and the exact center of this marker was used as a reference for the position of origin of both the virtual and the real coordinate systems. In addition to these markers, an additional marker was added at the same height (y-coordinate) in the direction of the negative x-axis and 1.594 m away from the marker of origin. In general, the second fiducial marker should be aligned with the first. This last marker is used for two-step calibration. Lastly, with the laser tape measure, the x and z coordinates of the other markers were measured from the origin.
Figure 1 shows the arrangement of the points within the scenario, as well as the measured coordinates of each point and the distance vector from the origin for each of the points.
Finally, step 6 of the design science research approach entails communicating our findings in this work.
3. Results
In the sections that follow, we describe our experiment’s outcomes.
3.1. Localization and Space Recognition Mechanisms of HoloLens
The HoloLens (1st gen) is an AR device released by Microsoft Corporation in 2016 that has several sensors, lenses, and holographic projectors, as
Figure 2 illustrates. This set enables HoloLens to recognize the environment and measure its localization. The system uses depth and environment-understanding cameras to three-dimensionally reconstruct the real environment. Infrared laser projectors, which make up the HoloLens, restrict the use of the device to environments free of sources emitting this light frequency.
The process for representing real-world surfaces in the HoloLens is described by a triangular mesh connected to a system of spatial coordinates fixed in the mapped environment.
Figure 3 exemplifies the reconstruction as information is captured by the device sensors. The result of this process, continuously updated by the system, causes environmental changes to be reflected in the virtual context, keeping it adapted.
HoloLens allows associating virtual objects (anchors) with the mesh and reconstructing the real environment to which it is exposed. The function of an anchor is the maintenance of location and orientation metadata relative to the real space. The documentation provided by Microsoft recommends the use of anchors in environments larger than five meters to achieve greater stability in the display of the holograms [
14].
3.2. Proposed Calibration Models
HoloLens uses its own method for creating a system of coordinates, mapping, and understanding the environment. When opening an application in HoloLens, it uses its position, i.e., its top, side, and front reference, to create its coordinate system. Thus, if the same application is opened with the device pointing to another direction, for example, the coordinate system will be different. Therefore, when it is necessary for holograms to appear in the same location as the physical environment, a fiducial marker (
Figure 4) is used as a calibration point to always generate the same coordinate system.
When the HoloLens moves through the scenario from a point A to any point B, it uses algorithms for mapping and understanding the world to virtually determine its position in the virtually reconstructed real setting. These algorithms will be called device self-localization. They are proprietary and cannot be modified.
For use of the glasses in spaces larger than five meters, the documentation provided by the HoloLens manufacturer recommends the use of spatial anchors to stabilize the holograms. That is, when instantiating a hologram in space without using a spatial anchor, it is unstable and, consequently, inaccurate. A spatial anchor is a virtual representation of a set of characteristics extracted from the real world over which the system will maintain control over time, and its objective is to provide a more precise position for the hologram [
14]. However, to ensure adequate precision, another important manufacturer recommendation is to always position a hologram less than three meters from a spatial anchor.
The use of anchors improves accuracy but does not guarantee high accuracy. There are other variables that influence the results of hologram precision and stability in an industrial scenario. One of these is calibration. As previously mentioned, the calibration strategy proposed in this study is the use of fiducial markers. The quality of the recognition of the markers proportions and orientation is indispensable to ensure the correct alignment between the virtual three-dimensional coordinates with their corresponding real three-dimensional coordinates. However, as accurate as computer vision systems may be, distortions in the dimensions and characteristics used to determine the distance and perspective of the marker add erroneous information in the translation and rotation of points in the virtual environment relative to their equivalent location in the real environment. As a consequence, there is incorrect alignment between the holograms of the virtual environment and their corresponding points in the real environment.
With the objective of mitigating the discrepancy associated with the recognition of the fiducial marker in AR systems developed for HoloLens, in this study a calibration model was developed to address the distortions caused by incorrect recognition of the marker. This model was called two-step calibration and is detailed in the next section.
3.2.1. Simple Calibration
Among the possible ways to translate and rotate the points for the alignment of the virtual coordinates with the real coordinates, a typical method uses calibration, herein called simple calibration. In this calibration, the Vuforia framework is used for marker recognition [
19].
Vuforia is used in this context to recognize the fiducial marker through computer vision and then instantiate a hologram that respects the orientation and proportions of this marker. From there, the position and orientation of this hologram are treated as the origin of the virtual coordinate system. Next, previously knowing the coordinates of any fixed point within the physical scenario which will be the origin of the real coordinate system, as well as the orientation and the distance in meters between these two origins, it is possible to determine the orientation and position of the axes of both coordinate systems and thus calibrate the system.
3.2.2. Two-Step Calibration
The identification of the direction of the marker axes through Vuforia has an angular nature. That is, the larger this angle, the greater the divergence between the idealized virtual plane and the virtual plane created by the system. Despite the good quality of computer vision algorithms for marker recognition, distortions are still present, and small divergences in the identification of these angles can generate large inconsistencies as the user wearing the device moves away from the origin. To mitigate this axis angulation problem, we proposed a two-step calibration system. This calibration system consists of adding a second marker with a fixed and known distance and orientation relative to the first marker. This second marker aims to determine angles forming the axes more precisely. In other words, unlike simple calibration, which uses Vuforia to recognize the first marker, instantiate a hologram based on the orientation and proportions of the marker, and use the position and direction of this hologram to create the axes, two-step calibration uses the first marker to determine the position of the hologram and the second marker to rotate the hologram. Only after recognizing the second marker will the axes be generated based on the hologram. It is important that the two markers are facing each other at approximately 1.5 m.
3.3. The Experiments
After setting up the environment, the experiment was started. For each type of calibration, five sample collections of spatial coordinates were performed at each point. Each collection consisted of running the application developed for the experiment, performing the calibration procedure, moving toward the point in question, collecting 500 samples of spatial coordinates from the marker, and closing the application. To ensure equality of conditions in the behavior of the application, each time that collection was started at one of the points, the HoloLens mapping information was deleted.
The experiment generated 2500 samples for each point, resulting in 10,000 samples for each type of calibration. To evaluate the accuracy (the mean distance between the virtually measured position and the real measured position) and the precision (the dispersion of the samples) of the simple and two-step calibrations, the following values were measured:
- (1)
Euclidean distance between the virtual coordinates and the real coordinates;
- (2)
Magnitude of the error in the evaluation of distances, which in this study is defined as the difference between the absolute value of the measured vector (the actual distance from the origin to the chosen point) and the distance from the origin to the chosen point returned by the HoloLens.
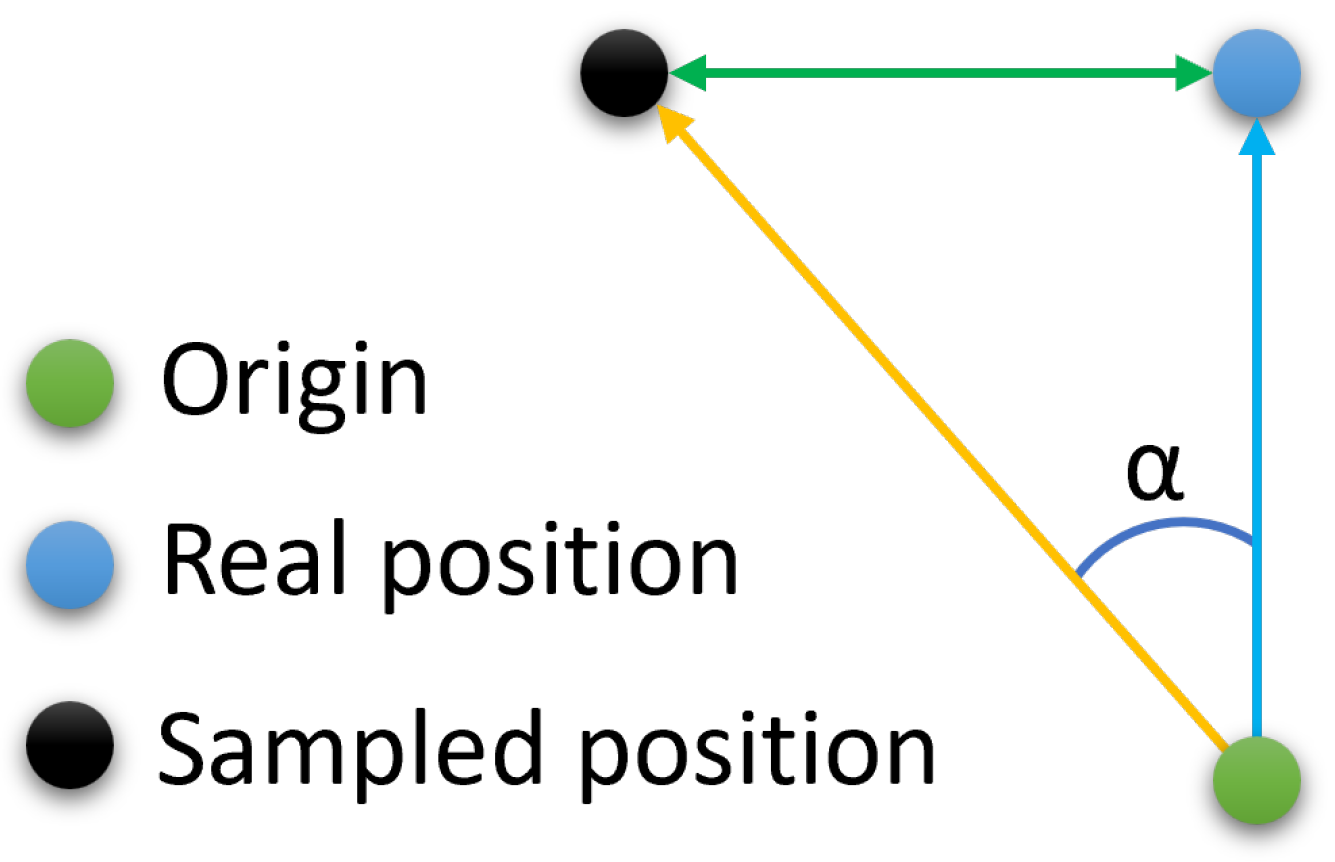
To visualize the angular dispersion of the error, we also mapped the value of the angle formed at the origin between the corresponding vector to the coordinates provided by the HoloLens and the real coordinates of the points (
Figure 5). This angle, of course, is determined by the Euclidean distance obtained in (1) and by the absolute values of the real distances and those provided by the HoloLens.
For the Euclidean distance of the samples relative to the real point, magnitude is the difference between the absolute value of the measured vector (the actual distance from the origin to the chosen point) and the distance returned by the HoloLens. Angular distance is the angle formed at the origin between the corresponding vector of the coordinates provided by the HoloLens and the real coordinates of the points.
Figure 6 depicts the graph containing the dispersion and the median of the Euclidean distances between the virtual coordinates and the real coordinates obtained from the samples. The graph shows that the two-step calibration was always more precise than the simple calibration at all points. Thus, we conclude that the two-step calibration contributes significantly not only to reducing the Euclidean distance between the virtual and the real coordinates but also to reducing the dispersion of the results.
Figure 7 shows the dispersion of the difference between the magnitude of the samples and the measured magnitude. Note that at some moments, the two-step calibration had a lower magnitude and/or dispersion; in others, the simple calibration was less dispersed and more precise. This seems to indicate that the error associated with the magnitude is not influenced by the calibration method.
Figure 8 shows how much the two-step calibration contributes positively to reducing the size and dispersion of the angles obtained in the samples.
3.4. Discussion
The absence of indicators for accuracy and precision in related research is evidence of the lack of technical work, highlighted by Bottani and Vignali [
2]. Thus, this study contributes to the expansion of technical productions on the adoption of HoloLens in industrial environments, establishing numerical criteria for evaluation and comparison with future solutions. However, it is possible to establish a dialogue between the calibration method proposed in this study and its correlates through the exposure of possible applications and contributions between research fields.
Bachras, Raptis, and Avouris [
20] carried out an empirical study that points to the use of anchors as an instrument to guarantee accuracy and precision in augmented reality applications using HoloLens. Access to the polygon mesh produced by HoloLens during spatial recognition is a necessary condition to generate the executables of these authors’ applications. From this mesh, the authors position the virtual objects and assign anchor behavior to them. The use of the two-step calibration method proposed in this study is potentially useful for developing a dynamic system for inserting anchors during run time (i.e., as the polygon mesh is produced by the HoloLens). Given that the application developed by them is a navigation system for some streets in the city of Patras (Greece), the use of two-step calibration would enable the development of generic solutions that can be adapted to various contexts (not just for a specific and previously known environment). Our hypothesis is that applying two-step calibration in the Bachras, Raptis, and Avouris experiment would produce a relatively small average error in the position of the holograms compared to the dimensions of the proposed environment. However, more studies are needed to test this hypothesis.
The assessment of accuracy and precision in the representation of movable virtual objects is an opportunity to extend this research, which is currently limited to measuring these indicators for static virtual objects. The studies by Cýrus et al. [
21] indicate that the recognition of fiducial markers is a more suitable alternative for representing mobile virtual objects; however, the analysis of the characteristics that favor the recognition of markers is associated with the field of computer vision and is outside this study scope.
4. Conclusions
Single markers suffer from numerical instability, particularly when they are small within the camera image. To address this, our study introduces a two-step calibration model that leverages multiple markers for accurate localization in a larger indoor environment. We put our model to the test using the MS Hololens AR device, which traditionally relies on SLAM for tracking. Notably, our experiments were conducted in an industrial setting to investigate how markers impact the accuracy of 3D point measurements. We meticulously measured four distinct points in both the physical and augmented reality realms. Our findings reveal that employing two markers significantly reduces angular discrepancies between points in the real and augmented environments. This is made possible by our novel model that deploys two fiducial markers aligned along the x-axis in a virtual space, effectively doubling the measurement data for precise alignment. Moreover, our results underscore that registration accuracy improves as the number of calibration points increases. Thus, our study establishes quantitative forms and parameters to compare the calibration models of AR solutions.
The discussion of the results obtained stimulates the production of studies and quantitative analyses of AR solutions. This study establishes numerical criteria for evaluating the proposed models, enabling direct comparison of results with future experiments and with different devices.
Future generations of HoloLens or other similar AR devices will likely include sensor improvements. However, the calibration and positioning method proposed in this study is based on general concepts and assumptions about AR. Although the experiments were performed on a first-generation HoloLens, the perspective is that future generations of AR devices will also be able to benefit from the results of the two-step calibration process proposed in this study.
One factor that directly influences precision is the angular distance. Here, the two-step calibration proposed in this study has a significant influence. The tests allow us to conclude that the two-step calibration increases the precision compared to the simple calibration, and it also is more suitable for use in industrial scenarios where the localization of objects with high precision is required.
Some hypotheses of contributions of the calibration model proposed in other research [
20] help to exemplify the possibilities of practical applications of the two-step calibration model. These hypotheses open new lines of investigation and, consequently, new opportunities for studies.
Some factors may negatively influence HoloLens behavior in specific circumstances, such as the inadequate functioning of the HoloLens in sunlight. These are device limitations reported by Microsoft itself in the equipment documentation. Therefore, this study avoided carrying out the experiment in circumstances that would obviously be frustrated due to the limitations of the equipment (not the proposed calibration model).
Although the research carried out is inspired by the demands of the industrial sector, the calibration method proposed in this study is not limited to this context alone. AR systems with critical precision and accuracy in displaying holograms can benefit from the results achieved in this study.
The two-step calibration model proposed in this study fulfills the general objective of this research and answers the guiding question. Its application in HoloLens presented precision and accuracy values in displaying holograms that were significantly relevant in comparison to the volume of the environment used in the experiment. The two-step calibration model proved to be effective for HoloLens applications in industrial and similar contexts.


 ,
, 


