1. Introduction
According to a report released by the International Agency for Research on Cancer in 2020, gastric cancer records indicated 1,089,103 new cases and 769,000 deaths worldwide [
1]. Among them, East Asia, including Korea, exhibited a higher incidence rate of 32.5 per 100,000 individuals, which is higher by 15.1 than the value of 17.4 in Eastern Europe, the second highest region.
Figure 1 depicts the incidence of gastric cancer among distinct geographical regions, expressed as a percentage per 100,000 individuals, as reported by the International Agency for Research. In addition, the severity of gastric cancer can be confirmed in terms of both incidence and survival. According to the National Cancer Registration Program Annual Report released by the Ministry of Health and Welfare in South Korea in 2021, for stage 1 patients with localized lesions, the 5 y survival rate was relatively high (97%). However, the 5 y survival rate of stage 2–3 patients was only 62.1%. The proportion of patients with late-stage gastric cancer and distant metastases was 6.4%, indicating a rapidly decreasing trend [
2].
To improve the early detection rate of gastric cancer, the National Health Insurance Corporation of Korea has implemented a regular gastric endoscopy program every two years for Koreans aged 40 years or older. Therefore, the number of gastroscopies performed in Korea steadily increased from 4,729,407 in 2013 to 7,093,024 in 2019 [
3]. The detection and classification of gastric cancer during the gastric endoscopy stage can facilitate the early conduction of additional tests, such as blood tests, radiography, and PET-CT scans. However, with an increase in the number of people undergoing gastroscopy, the workload of specialists also increases, which may result in delays in the examination and biopsy periods.
Numerous strategies and techniques have been investigated to improve the efficacy of medical procedures [
4,
5,
6]. In particular, Computer-Aided Diagnosis (CADx), a system designed to support physicians in the diagnostic process across diverse clinical settings, has been a subject of extensive research [
7,
8,
9]. It can improve the speed and accuracy of diagnoses by providing a consistent second opinion to doctors. Previous studies have demonstrated the practicality of deep learning, and further research is currently being conducted to optimize its performance and efficacy. Li et al. [
10] and Li et al. [
11] classified gastric cancers using the characteristics learned from gastric endoscopy histopathology slice images. They employed deep learning techniques to develop a model to distinguish between gastric cancer and noncancerous tissues. The results confirmed that CADx could accurately classify gastric cancer, achieving an accuracy of over 96% for slice-based classification. Thus, CADx can potentially improve the accuracy of diagnosis and early detection of gastric cancer, which is crucial for early treatment and improved patient outcomes. In addition to detection using gastric biopsy, detection that identifies the location of lesions using gastric endoscopic imaging has also been studied. Hirasawa et al. [
12] conducted a study to detect gastric cancer lesions using gastroscopic imaging. They used data collected from two hospitals in Japan (Cancer Institute Hospital Ariake and Tokatsu-Tsujinaka Hospital) between April 2004 and December 2016, and 13,584 images of 2639 gastric cancer lesions were used as the training dataset. They employed a convolutional neural network (CNN) called the single-shot multibox detector (SSD) as the detection model. The developed CADx exhibited a sensitivity of 92.2% and could detect 70 of 71 lesions with a diameter of 6 mm or greater, as well as all invasive cancers. Yoon et al. [
13] studied early gastric cancer (EGC) and invasion depth classifications. They collected data from 800 patients diagnosed with EGC at Gangnam Severance Hospital, Yonsei University College of Medicine in Seoul, South Korea, between January 2012 and March 2018. In total, 11,539 images (896 T1a-EGC, 809 T1b-EGC, and 9834 non-EGC images) were used in this study. Using VGG-16, they achieved detection accuracies of 0.981 for EGC and 0.851 for tumor depth classification. Hu et al. [
14] identified EGC using narrow-band magnification images. They collected 1777 magnifying endoscopy with narrow-band imaging (ME-NBI) images from three hospitals in China (Endoscopic Center of Zhongshan Hospital, Affiliated Dongnan Hospital of Xiamen University, and Central Hospital of Wuhan) and used the VGG-19 architecture to identify EGC. The accuracies achieved in this study were 0.808 and 0.813, respectively, similar to those of senior endoscopists. Horiuchi et al. [
15] conducted a study using 1492 cancer ME-NBI images and 1078 normal ME-NBI images collected between April 2005 and February 2016. They achieved an accuracy of 0.8684 and compared the results with those determined by 11 doctors for verification. They reported that the CADx system exhibited higher accuracy and sensitivity than those of the experts. However, in contrast to general endoscopes, ME-NBI has an optical system and an imaging system to increase resolution and sharpness, which slows the shooting speed and increases the inspection cost. Consequently, instead of ME-NBI, studies have been conducted using white light endoscopy to segment and classify benign gastric ulcer (BGU), EGC, and advanced gastric cancer (AGC) lesions and to classify T1a and T1b by the depth of invasion through normal gastric endoscopy images. Nam et al. [
16] conducted a study classifying gastric mucosal lesions, including BGU, EGC, and AGC, using normal endoscopic images. This study included 1366 patients from two hospitals in Korea (Seoul National University Hospital and Samsung Medical Center). They utilized a CNN model for gastric lesion classification and achieved internal and external verification accuracies of 0.923 and 0.813, respectively. Furthermore, they achieved an internal verification accuracy of 0.77 and an external verification accuracy of 0.72 with the depth of invasion classification performance for T1a and T1b.
A common characteristic of previous studies is that the medical images contain personal patient information, which requires a long time for data collection, resulting in the construction of a small dataset. However, a small dataset size increases the risk of problems such as overfitting or underfitting in the model training owing to the possible requirement of more than one learning process. Data augmentation can ensure diversity in a dataset and facilitate the development of models with improved performance by learning the characteristics of various lesions. Consequently, this could enhance the accuracy and reliability of medical image analysis, ultimately leading to better patient conditions. A study was conducted to classify gastric cancers using data augmentation. Cho et al. [
17] studied patients with gastric tumors detected at Chuncheon Sacred Heart Hospital in Gangwon Province, South Korea, between 2010 and 2017. Eventually, 2899 images from 846 patients were included in this study. Among them, images of submucosa-invaded lesions accounted for 34.5% (n = 999), and those of mucosa-confined lesions accounted for 65.5% (n = 1900). The mucosa-confined lesions were rotated by 90° to double their size and overcome data imbalance. The entire image dataset was then augmented four times by flipping it vertically and horizontally. Dense-Net-16 and Inception-ResNet-v2 were used for the training. Overall accuracies of 0.774 and 0.841 were achieved for internal validation, and accuracies of 0.661 and 0.714 were achieved when only classifying the invasion depth of EGC. Further, an external test dataset was constructed by collecting the images of consecutive patients who underwent gastric endoscopy between 2019 and 2020. Overall accuracies of 0.741 and 0.773 were achieved for external validation, and accuracies of 0.650 and 0.672 were achieved when only the invasion depth of the EGC was classified.
Most previous studies only applied simple image augmentation techniques, such as flip and rotation, without the use of additional methods for image augmentation. It is challenging to enhance the diversity of data features by applying simple augmentation techniques only. Therefore, this study used AutoAugment, a technique that adds geometric and color changes to the collected dataset, and introduced the Cut-and-Paste technique, which uses the sliding window algorithm to improve the performance of CADx for gastroscopy classification.
2. Materials and Methods
2.1. Dataset
Early gastric cancer is typically classified as T-stage 1, indicating that the tumor has invaded the mucosal or submucosal layers of the gastric wall. T-stage 4 gastric cancer indicates that the tumor has penetrated the serous layer and invaded significant organs, such as the spleen, transverse colon, liver, diaphragm, pancreas, abdominal wall, adrenal gland, kidney, small intestine, and retroperitoneum. The accurate staging of gastric cancer is crucial for determining the appropriate treatment plan for each patient. This study aimed to improve the performance of the gastric endoscopy diagnostic system through augmentation techniques, and two datasets were utilized to validate the performance of the proposed augmentation method.
The T-stage 1 and T-stage 4 data used in this study were obtained from the AI Hub [
18], which provides gastric cancer diagnosis medical images using the tumor–node–metastasis (TNM) staging classification, presented in its 8th edition, of the American Joint Committee on Cancer (AJCC) as a standard for gastric cancer staging [
19]. The data were extracted and purified from The Catholic University of Korea, Seoul St. Mary’s Hospital electronic medical record (EMR) and picture archiving communication system (PACS), and patient consent and approval were obtained from the Institutional Review Board (IRB). The dataset was verified through three procedures: data collection officers, commentators, and researchers in charge of the participating institutions.
Consequently, an average of 14.5 images were collected per patient for both the T-stage 1 and T-stage 4 datasets. Images obtained from the same patient inherently exhibit similarity. Consequently, we adopted a strategy of partitioning patients into training, validation, and test cohorts to mitigate the risk of assessing the model’s performance using substantially similar images. The patient distribution was executed through a random process, which was implemented to bolster the model’s overall reliability. In addition, because the number of patients in T-stage 1 and T-stage 4 differed significantly, images of learning patients in T-stage 1 were randomly extracted to match those in T-stage 4. The distribution of the original dataset is presented in
Table 1.
Normal and early gastric cancer gastroscopy data were collected by the Department of Gastroenterology at the National Gyeongsang University Hospital in the Republic of Korea. All data were validated by internal medicine specialists and histological examinations were performed to improve the data quality. All data were collected after obtaining patient consent and approval from the IRB. On average, 6.25 images were collected per patient from this dataset. In addition, the patient composition was randomly distributed without duplication in the training, validation, and test datasets.
Table 2 presents the distribution of the original dataset.
2.2. Effective Augmentation to Gastric Dataset
High-quality data are essential for accurate feature learning in deep learning models, and the data must satisfy both sufficient quantity and diversity requirements. Such data can improve the convergence speed of the weights and prevent overfitting of the model, thereby improving its performance. However, as observed in previous studies, there are limitations to medical data that satisfy the above conditions because of the time and cost required for the IRB approval process. Therefore, two data augmentation methods were used in this study to overcome these limitations.
2.2.1. AutoAugment
To secure a sufficient dataset for training, we employed data augmentation policies (AutoAugment) to increase the amount of data. AutoAugment is a data augmentation policy developed by Google [
20] and comprises 25 subpolicies. Each subpolicy is composed of 2 of 16 image processing methods, such as flip and rotation, along with the probability and intensity of the application of each method. Therefore, the original dataset was expanded 25 times using this augmentation method.
AutoAugment provided optimal augmentation policies for three datasets: Cifar10, ImageNet, and SVHN. Cifar10 is a dataset comprising 32 × 32 images in 10 classes [
21]. ImageNet is a dataset with over 1.4 million images and 1000 classes [
22]. Finally, SVHN is a dataset of digit images collected from Google Street View and comprises approximately 100,000 images [
23]. This study was conducted based on ImageNet, which contains the largest amount of data and classes.
2.2.2. Cut and Paste Using Window Sliding Algorithm
To accurately identify the lesion, a gastroenterology specialist manually confirmed its location and size and labeled the area. The extracted bounding box contained information regarding the size and position of the lesion. The X- and Y-coordinates of the bounding box were calculated to extract only the lesion. To perform augmentation with limited data, a method for pasting the created lesion image into a normal gastric image was used. Variances in the RGB channels of the cut lesion images were calculated to select the appropriate location for pasting. The sliding window algorithm moved normal images along the X- and Y-directions at equal intervals. While moving the virtual window at equal intervals, the lesion image was pasted onto the corresponding region by finding the point where the difference between the image variance of the corresponding region and that of the lesion image was minimized. The following equation was used to calculate the variance of lesion images:
The formula for calculating
, the average of the cut lesions images’ RGB channels, is as follows. The size of the lesion image is
, and
are the pixel coordinates.
The formula for calculating the variance of a cut image is as follows.
The sliding window algorithm calculates the variance while sequentially moving along the
area by dividing a normal gastric image of size
into
equal lengths horizontally and vertically.
The formula for calculating the variance of each region is as follows.
It sequentially moves the position to determine the
positions, where the difference between the variances of the area located at
and the lesion image is the smallest.
This method was augmented by pasting the lesion image at the
position.
Figure 2 shows an example of a cut-and-pasted image obtained using the sliding window algorithm.
2.3. EfficientNetV2
This study used a deep learning network with a CNN architecture to learn and diagnose the characteristics of lesions in gastric endoscopic images. With the development of neural architecture search (NAS) through artificial intelligence, networks with high performance and few parameters have been proposed [
24]. EfficientNet utilizes a method to optimize three network components, depth, channel width, and input image resolution, to improve the model performance [
25]. Moreover, through the application of compound scaling to each component based on a designed base model, EfficientNet facilitates the uniform creation of models of varying sizes.
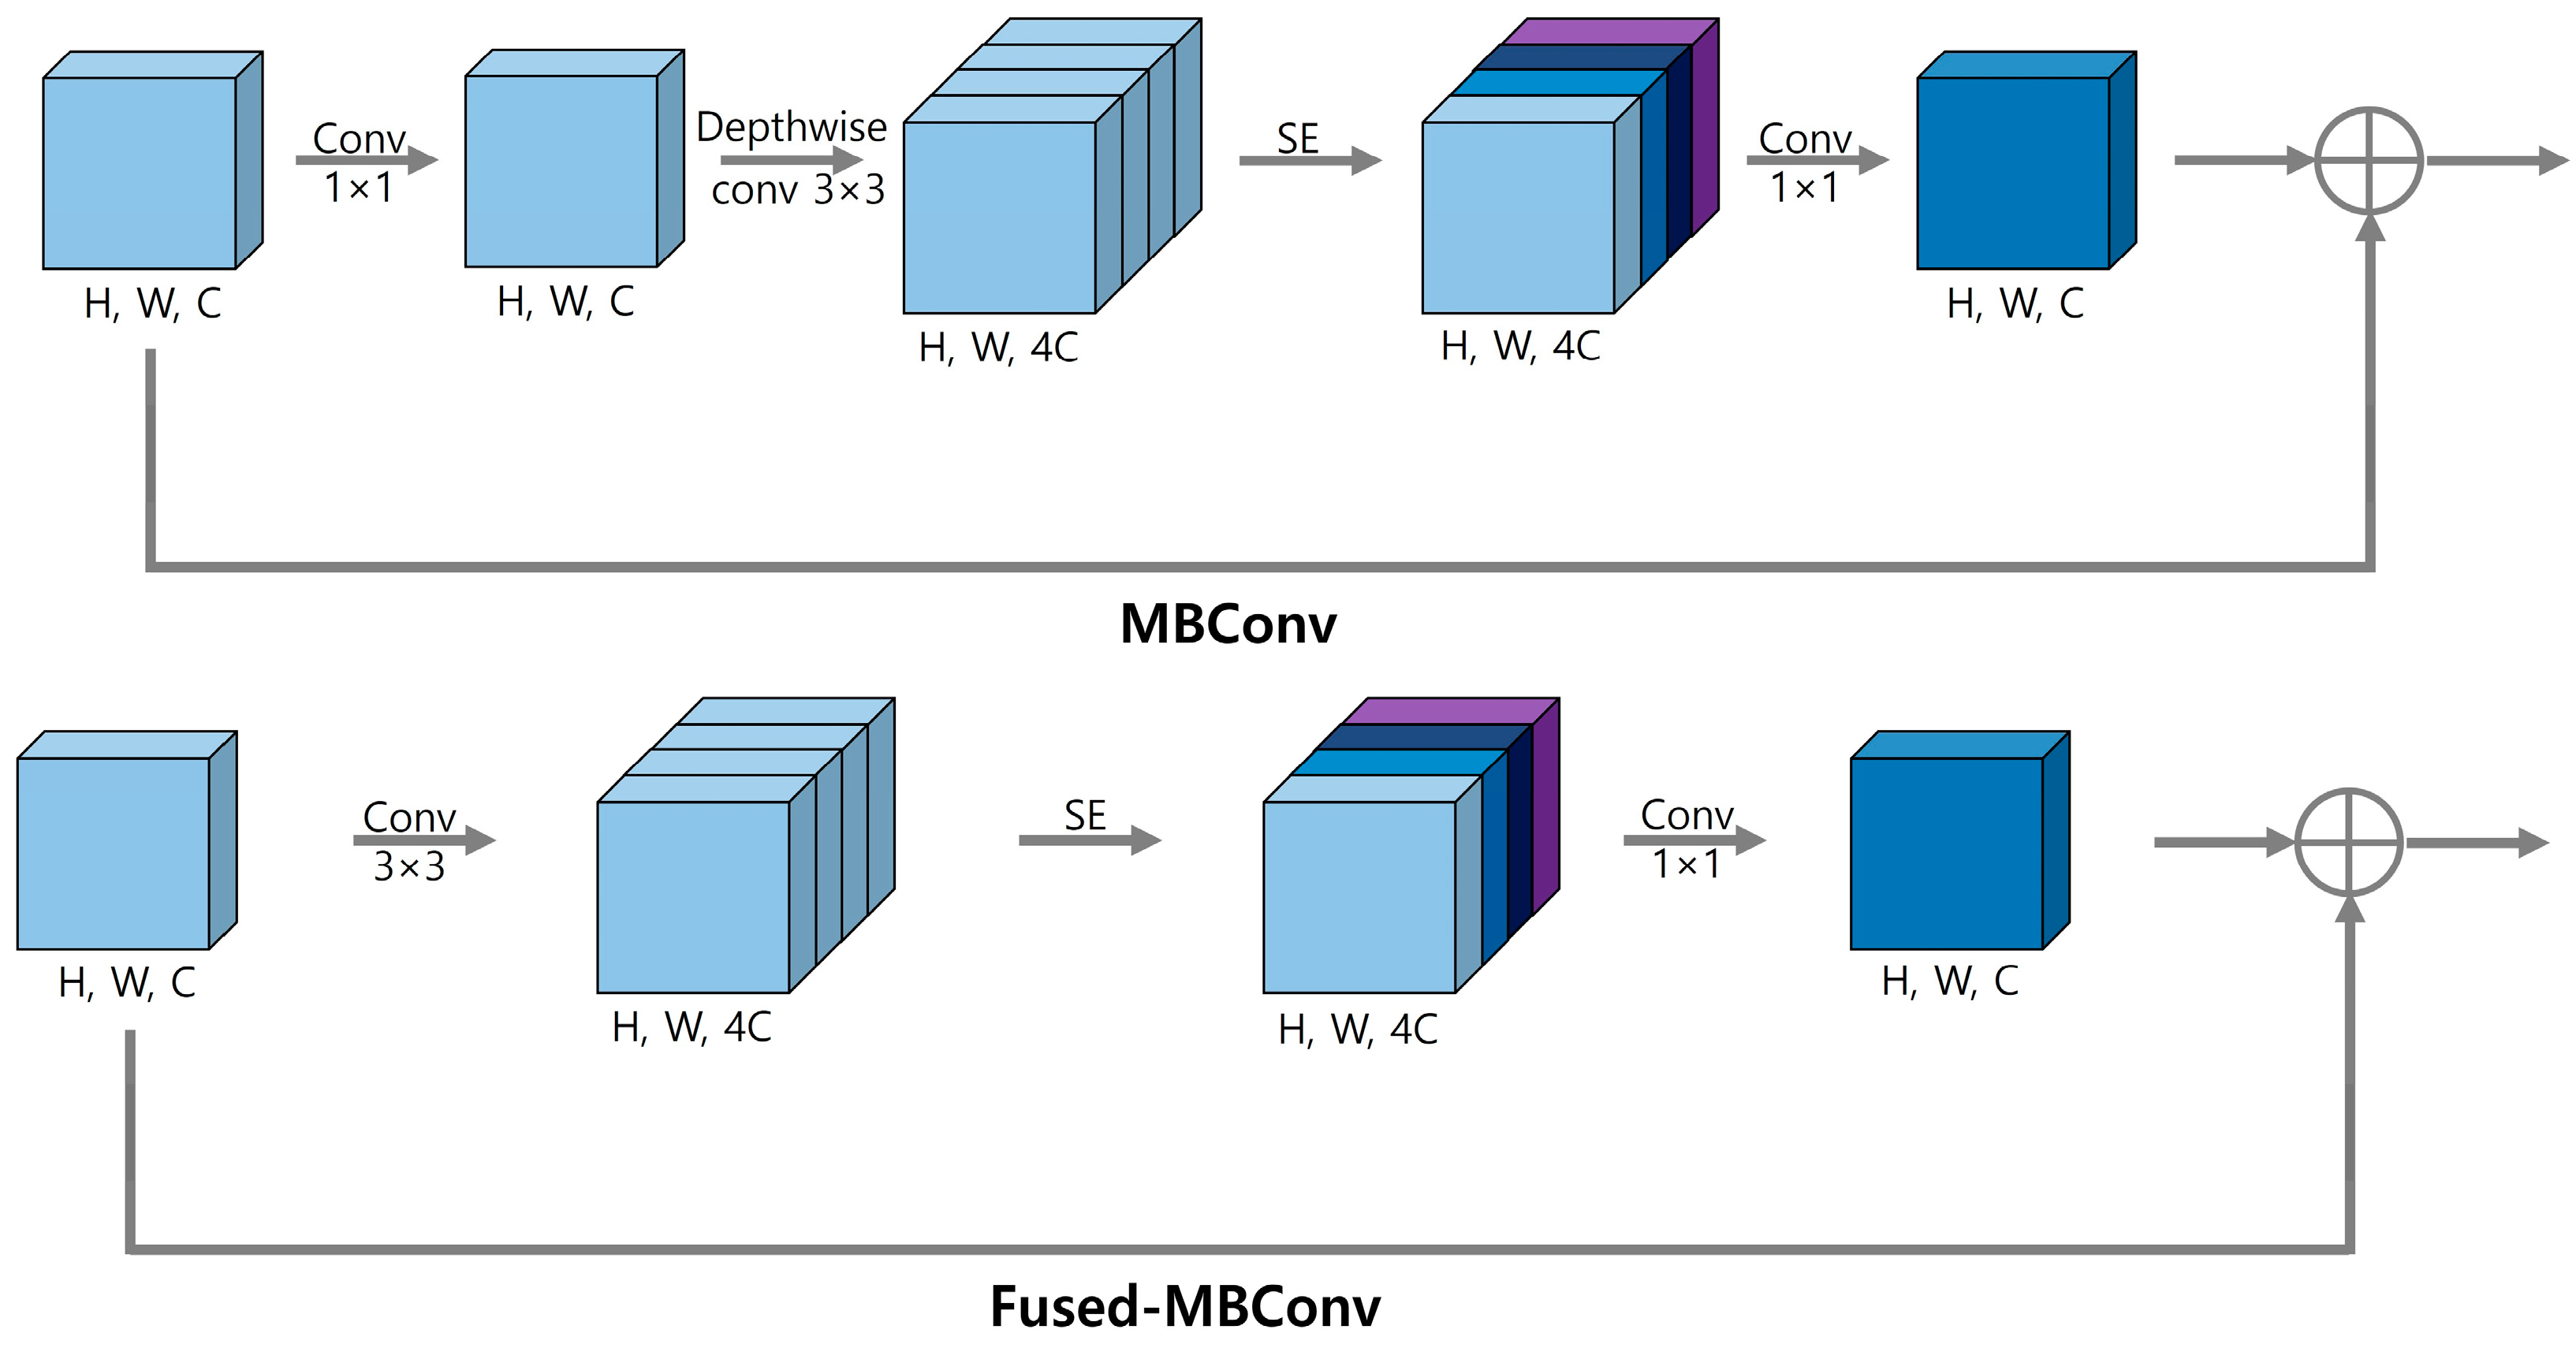
EfficientNetV1 uses a depth-wise 3 × 3 convolution from MobileNet’s MBConvolution in the initial stage [
26]. However, this type of convolution causes overhead problems, because it is inefficient for modern accelerators that perform batch operations. To address this issue, EfficientNetV2 uses Fused-MBConv to convert, depth-wise, 3 × 3 convolution and 1 × 1 convolution operations into a regular 3 × 3 convolution to increase the efficiency training speed [
27]. In addition, it facilitates effective image learning by utilizing the squeeze-and-excitation (SE) block proposed by SENet to weigh the importance of channels in feature maps during training [
28].
Figure 3 shows the architectures of MBconv and Fused-MBConv.
In EfficientNetV2, the maximum resolution of the compound scaling is limited to 480 × 480 for training efficiency, and the number of layers is gradually increased in the later stages. This resulted in the proposal of three models, namely Small, Medium, and Large. The EfficientNetV2-L model trained using the ImageNet21k dataset, which comprises approximately 10 million images and over 22,000 categories, was used in this study.
2.4. Test-Time Augmentation
Test-time augmentation (TTA) is a technique used in machine learning to improve the performance and generalization of a trained model during the inference phase [
29]. This method involves the application of various data transformations to the input data and obtaining predictions from the model for each transformed image. The final prediction is determined by aggregating the predictions from the augmented data and computing their averages. Through this process, the TTA utilizes various aspects of the image for prediction, thereby enabling more robust and accurate classification. In addition, TTA can be a useful technique for improving the performance of models during inference, particularly when the test dataset is limited, resulting in low feature distribution and diversity. In this study, the test dataset was increased by 8 times by combining horizontal flip, vertical flip, and rotation (0°, 90°, 180°, and 270°).
Figure 4 shows an example of the TTA algorithm.
3. Results
This study aimed to improve the accuracy of gastroscopic classification using a gastric endoscopic image augmentation policy. This effect was confirmed using two datasets. The collected T-stage 1 and T-stage 4 data were used as training (1024 images), validation (385 images), and test (404 images) data. Further, the collected EGC and normal data were used as training (360 images), validation (120 images), and test (120 images) data. AutoAugment generated 25 times more training data images. The lesions were pasted onto normal images using a sliding window algorithm for the Cut-and-Paste technique. The detailed composition of the dataset is presented in
Table 3. T-stage 1 and T-stage 4 datasets were defined as Dataset A, and the EGC and normal datasets were defined as Dataset B.
The EfficientNetV2-L model was used to evaluate classification network performance. The performance evaluation indices of the trained model were as follows: (1) precision, which is the proportion of predictions that are actually true; (2) sensitivity, which represents the proportion of predictions that are true among those that are actually true; (3) the False Positive Rate (FPR) represents the proportion of true negatives that were inaccurately classified as positives; (4) the F1-score represents the harmonic average of precision and sensitivity; and (5) accuracy, which is the percentage of all predictions that were correctly predicted. The performance of the model for each dataset is summarized in
Table 4.
Early diagnosis of gastric cancer is essential for improving treatment outcomes and prognosis. For this reason, sensitivity, representing the classification accuracy of gastric cancer images, is a crucial evaluation metric in this study. The results showed that the classification sensitivity using Dataset A improved by 6.5%, from 0.7655 to 0.8312, and that using Dataset B improved by 9.1%, from 0.7500 to 0.8417. The accuracy also exhibited a similar improvement to the sensitivity. The classification accuracy using Dataset A improved by 6.6%, from 0.7649 to 0.8317, and that using Dataset B improved by 9.1%, from 0.7500 to 0.8417.
To address the issue of the limited test dataset in Dataset B, TTA was applied. Consequently, the obtained outcomes were evaluated using a broader data range, which can be considered as an evaluation of enhanced generalization.
Table 5 presents the results obtained by applying the TTA algorithm to Dataset B.
The application of the TTA algorithm to Dataset B resulted in an increase in sensitivity compared to when TTA was not applied. Specifically, the sensitivity increased by 2.2% for the original model, 8.3% for the model with only AutoAugment, and 5.8% for the model with Cut-and-Paste augmentation.
5. Conclusions
This study proposed a Cut-and-Paste augmentation technique that can improve gastroscopy classification performance in CADx systems. Data augmentation contributes to performance improvement by enabling deep learning models to learn various characteristics and patterns. Representative augmentation techniques in the field of deep learning include approaches that make geometric changes to images, such as AutoAugment, which was applied in this study. However, when data are augmented, there are factors that may damage the characteristics of the lesion depending on the intensity of the augmentation. From this perspective, the proposed augmentation technique is characterized by the possibility of a large amount of augmentation without damage to the perceptibility of the characteristics of the original lesion. In addition, the effectiveness of these matters was proven by applying the technology to two datasets and improving performance. Furthermore, the problem of a limited test dataset was addressed by applying the TTA algorithm. This allowed the model to obtain more robust results by considering various visual changes and variations.
However, the current lesion images were manually marked and cut into rectangular shapes by a specialist. Rectangular images are likely to include lesions and normal mucosa. In addition, the location and size of the lesion must be known before applying the Cut-and-Paste technique. These issues can be addressed by utilizing Grad-CAM, which visualizes the regions of interest during the decision-making of the deep learning model. Thus, the time and cost required for labeling can be reduced. In future work, we aim to develop a CADx system that can classify all stages from 1 to 4 based on T staging.


