Article

Evaluation of the Dynamic Stability of Underground Structures Assuming a Hydrogen Gas Explosion Disaster in a Shallow Underground Hydrogen Storage Facility

1
Department of Civil Engineering, Kumoh National Institute of Technology, Gumi 39177, Republic of Korea
2
Hydrogen-Infrastructure Research Cluster, Korea Institute of Civil Engineering and Building Technology, Goyang 10223, Republic of Korea
3
Deep Subsurface Storage & Disposal Research Center, Geology & Space Division, Korea Institute of Geoscience and Mineral Resources, Daejeon 34132, Republic of Korea
*
Author to whom correspondence should be addressed.
Appl. Sci. 2023, 13(22), 12317; https://doi.org/10.3390/app132212317
Submission received: 17 October 2023 / Revised: 9 November 2023 / Accepted: 10 November 2023 / Published: 14 November 2023

Abstract

:
Amid the ongoing global warming crisis, there has been growing interest in hydrogen energy as an environmentally friendly energy source to achieve carbon neutrality. A stable and large-scale hydrogen storage infrastructure is essential to satisfy the increasing demand for hydrogen energy. Particularly for hydrogen refueling stations located in urban areas, technological solutions are required to ensure the stability of adjacent civil structures in the event of hydrogen storage tank explosions. In this study, a numerical analysis using equivalent trinitrotoluene (TNT) and Concrete Damage Plasticity (CDP) models was employed to analyze the dynamic behavior of the ground in response to hydrogen gas explosions in shallow underground hydrogen storage facilities and to assess the stability of nearby structures against explosion effects. According to the simulation results, it was possible to ensure the structural stability of nearby buildings and tunnel structures by maintaining a minimum separation distance. In the case of nearby building structures, a distance of at least 6 to 7 m is needed to be maintained from the underground hydrogen storage facility to prevent explosion damage from a hydrogen gas explosion. For nearby tunnel structures, a distance of at least 10 m is required to ensure structural stability.

1. Introduction

Recently, as countries worldwide are striving to address the challenges of climate change and global warming by promoting carbon neutrality, leading environmentally friendly nations such as Europe, Japan, and Australia have implemented and announced various policies to activate the hydrogen economy and transition their existing energy infrastructure into eco-friendly energy systems [1,2]. For example, in 2019, the European Union (EU) announced a plan to expand the supply of hydrogen and fuel cells by 2050 as part of its ‘Hydrogen Roadmap’, and Australia revitalized the hydrogen economy by establishing a green hydrogen production and supply infrastructure [3]. In Korea, there has been a concerted effort to transition towards a hydrogen economy since the publication of the ‘Hydrogen Economy Activation Roadmap’ in 2019. The expansion of hydrogen production and supply inevitably requires large-scale and reliable hydrogen storage technologies. Storing large quantities of hydrogen above the ground raises concerns about various safety hazards and explosion risks, as well as challenges in selecting suitable sites for large-scale storage. Therefore, there is growing interest in underground hydrogen storage methods [4].
Underground hydrogen storage is considered to be the most stable and economical method [5]. The Hydrogen Technology Collaboration Programme (TCP), a subsidiary program of the International Energy Agency (IEA), emphasizes the essential role of underground storage facility technologies after 2030 when a significant increase in global hydrogen supply is expected [6]. The adoption of underground hydrogen storage technology is even more essential in countries such as Korea, which has a limited land area and high population density.
There are several methods of underground hydrogen storage, including salt caverns, aquifers, depleted oil fields, and rock caverns. Salt cavern storage involves the creation of cavities by dissolving underground salt layers, a method that has been successfully employed in Germany and the United States. It is preferred because of its relatively low construction cost and low risk of hydrogen leakage and contamination [7]. Depleted oil-field storage is a method for storing hydrogen in geological structures that are left vacant after gas and oil extraction. The aquifer storage method stores water using boreholes in an area where a relatively low-permeability cover rock is developed in the upper part of the aquifer and has an economic advantage, as it does not require artificial joint excavation. Rock cavern storage involves artificially excavating cavities in hard rocks and lining them with insulation materials and concrete to ensure stable energy storage.
Worldwide, projects and preliminary research related to hydrogen underground storage have primarily focused on the salt cavern storage method [8,9,10,11,12]. The United States operates three underground salt cavern hydrogen energy storage facilities in Texas, and Utah aims to construct the world’s largest salt cavern hydrogen storage facility capable of storing 1000 MWh of hydrogen energy by 2030. Some European countries with rich salt layers, such as Germany and Poland, have evaluated their geological conditions and hydrogen storage potential [13,14,15]. France conducted geochemical modeling studies to understand the impact of subsurface microorganisms on hydrogen loss [16]. In addition, studies have been conducted to evaluate the hydrodynamic behavior of the bedrock constituting a geological structure due to the injection of hydrogen [17,18,19].
However, it is noteworthy that hydrogen storage facilities utilizing salt caverns are operational in very few countries, and many nations lack the geological conditions necessary for constructing salt caverns (Figure 1). Therefore, there is a need in Korea for a unique underground hydrogen storage system that utilizes concrete protective structures at shallow depths, aligning with the country’s geological environment (Figure 2). Some fundamental research in this regard is ongoing, such as the work by Papan et al. [20], who conducted a numerical and experimental case study to investigate the dynamic characteristics of the geological environment above a constructed highway tunnel, considering vibration levels during blasting construction work. Additionally, they conducted an additional experimental study using a small-scale model to provide a brief overview of the dispersive attenuation of explosions [21].
Nevertheless, there remains a need for research on safety standards and ground vibration stability assessments concerning gas explosions in shallow underground hydrogen storage facilities. Numerical simulation approaches for assessing the ground vibration stability of nearby building structures against hydrogen gas explosions in underground storage facilities can play a crucial role in determining the locations of underground hydrogen storage facilities in urban areas with high hydrogen fuel demand. Therefore, this study conducted a numerical analysis using equivalent TNT models and Concrete Damage Plasticity (CDP) models to analyze the dynamic behavior changes in the ground and the damage to nearby tunnel lining structures caused by hydrogen gas explosions. Furthermore, this study suggests the minimum allowable safety distances from the storage facility for various gas explosion accident scenarios and under different design conditions.

2. Numerical Simulation

Three-dimensional numerical simulations are required to realistically simulate and predict the damage to surrounding structures in various hydrogen explosion scenarios. In this study, we utilized the nonlinear finite element analysis program Abaqus to evaluate a gas explosion inside a hydrogen tank storage facility, the response behavior of the surrounding ground, and the damage impact on nearby structures. A geometric model was created using the Abaqus/CAE module and explosion simulations were performed using the Abaqus/Explicit Solver.

2.1. Governing Equations

When numerically approaching phenomena that cause large deformations, such as explosions, it is important to address contact and element distortion problems. These element distortions can lead to analysis errors, and one effective way to solve this problem is to use the Coupled Eulerian Lagrangian (CEL) modeling technique. The CEL modeling technique was first proposed by Noh [24], who demonstrated that issues related to element distortion and the flow of Lagrangian materials can be alleviated when describing the motion of microvolume elements over time by combining the advantages of Lagrangian and Eulerian techniques [25]. In the calculation of the CEL modeling method, the Euler and Lagrange meshes can be set simultaneously, depending on the specific problem, and a penalty function combination is applied at the interface. The governing equations consist of the continuity, momentum, and energy conservation equations [26,27]:
D ρ D t + ρ v = ρ t + v ρ + ρ v = 0
ρ D v D t = σ + ρ b
ρ D E D t = σ ε ˙ + ρ Q ˙
where /Dt and ∂ρ/∂t are the material and spatial time derivatives of ρ, respectively, ρ is the density of air (kg/m3), is a vector differential operator, v is the airflow vector, σ is the Cauchy stress tensor (Pa), b is the unit resultant force tensor, E is energy (J), ε ˙ is train rate, and Q ˙ is heat conductivity (W/(m·K)).

2.2. Material Model

2.2.1. Equivalent TNT Model, Jones–Wilkins–Lee Equation of State Model

In the simulation of hydrogen gas explosions, prior research has been conducted to indirectly predict the explosion pressure using the equivalent trinitrotoluene (TNT) model. The following empirical equation was employed in these studies [28,29,30]:
M T N T = E Q T N T = η M f Q H 2 Q T N T
where MTNT is the equivalent mass of TNT (kg), Mf is the mass of stored hydrogen (kg), E is the explosion energy (kJ), QTNT is the calorific value of TNT (4.6 MJ/kg), and QH2 is the calorific value of hydrogen (119.93 MJ/kg). η refers to the explosion yield contributing to the explosion in the gas cloud, and Lopes and Melo [31] estimated the explosion yield (yield of the vapor cloud explosions) at 0.04 when predicting the explosion pressure of hydrogen using the equivalent TNT model through indoor experiments.
The magnitude of the explosion pressure (p) for the equivalent TNT explosive can be calculated using the Jones–Wilkins–Lee equation of state (JWL-EOS) model [25]:
p = A 1 ω R 1 ρ ¯ e R 1 ρ ¯ + B 1 ω R 2 ρ ¯ e R 2 ρ ¯ + ω ρ e int
where A (Pa), B (Pa), R1, R2, and ω are constants related to the equivalent TNT materials. ρ ¯ is the ratio of the explosive density in the solid state and the current density, e int is the specific internal energy at atmospheric pressure (J/kg), and ρ is the current density (kg/m3) [32]. In Equation (5), the first two terms represent the magnitude of the high pressure generated during the explosion, and the last term represents the magnitude of the low pressure associated with the high volume loss owing to the explosion. The material properties of the TNT explosive charges are listed in Table 1.
The numerical analysis models using equivalent TNT and JWL-EOS material models were validated through a comparison with hydrogen explosion test data obtained by Nozu et al. [33]. The experiments were conducted in an open space in a sealed vinyl tent, as shown in Figure 3. Hydrogen gas was injected into the tent to achieve 30% hydrogen and 70% air. The setup was designed to initiate a hydrogen explosion through ignition sources, such as electric sparks or explosive devices (small quantities of C4 or TNT). A reinforced concrete wall structure with a height, width, and thickness of 2 m, 10 m, and 0.15 m, respectively, was placed at a straight line distance of 4 m from the explosion source. Data on the explosion pressure and displacement characteristics acting on the concrete structure were measured using attached sensors. To validate the reliability of the modeling techniques, the study developed a 3D numerical analysis model capable of directly simulating the experiments conducted by Nozu et al. [33]. Figure 4 illustrates the propagation process of explosion pressure resulting from a hydrogen gas explosion in a 3D numerical analysis simulation. The measurement data for the pressure and horizontal displacement at specific locations (P2, P4, and D2) on the nearby reinforced concrete wall after the explosion were compared with the simulation results, as shown in Figure 5. The predicted pressure and horizontal displacement data obtained through the numerical simulation exhibited overall similarity to the measurements obtained from the experiments. This confirms that the equivalent TNT model based on the JWL-EOS (Jones–Wilkins–Lee equation of state) can reasonably simulate the actual phenomenon of a hydrogen gas explosion.

2.2.2. Mohr–Coulomb (M–C) Model

In this study, a three-dimensional analysis model was developed, assuming a specific scenario in which an existing urban gas station will be converted into a hydrogen refueling station. Figure 6 schematically illustrates the geographical information and the borehole layout used in the model. In the figure, ‘NT-21’ indicates the locations where borehole investigations were conducted. The composition of the stratum reflects the actual drilling results of the site and was found to have stratigraphy in the order of silty sand, gravel, silty sand, soft rock, hard rock, and soft rock layers at a depth of approximately 28 m from the ground surface. Based on the results of this drilling investigation, a three-dimensional simulation model was constructed, as shown in Figure 7. The gradient of the stratum surface within the site was assumed to be a uniform horizontal plane.
The ground property information is listed in Table 2. The mechanical properties of each geological material were determined using results from indoor tests such as soil property tests and triaxial compression tests. Furthermore, dynamic properties were estimated based on the compressional wave velocity and shear wave velocity obtained from seismic exploration for each depth. The equation for calculating dynamic properties is as follows:
E d = 2 × ρ V s 2 × ( 1 + υ d )
υ d = 1 2 × ( v p v s ) 2 2 ( v p v s ) 2 1
where Ed represents the dynamic elastic modulus (MPa) and νd represents the dynamic Poisson’s ratio (−). Vp and vs. are the compressional wave velocity (m/s) and shear wave velocity (m/s), respectively.

2.2.3. Concrete Damage Plasticity Model

The protective structure of the hydrogen storage facility and tunnel lining was composed of concrete and steel reinforcements embedded within the concrete. The elastoplastic behavior of the material was evaluated using the Abaqus Concrete Damage Plasticity (CDP) model [34]. The CDP model is defined for the stress–strain relationship as follows:
σ c = ( 1 d c ) D 0 e l : ( ε ε c p l )
σ t = ( 1 d t ) D 0 e l : ( ε ε t p l )
where tension and compression are denoted by subscripts t and c, respectively, and where σt represents the tensile stress vector and σc represents the compressive stress vector. Plastic strain for tension and compression is expressed as ε t p l and ε c p l , respectively, and d t and d c are variables representing damage in tension and compression as a function of plastic strain, respectively. The damage variable is zero when there is no damage. D 0 e l refers to the initial elastic modulus before the material is damaged. Table 3 and Table 4 show the input parameters related to the CDP model, and this study used the stress–strain relationship and damage–strain behavior for the compression of the M30-grade concrete material. The data were obtained from Ref. [35].

2.2.4. Steel Reinforcement in Tunnel Lining

The Johnson–Cook material model was used to implement the nonlinear elastoplastic behavior characteristics of the IS-456 steel rebar material used as reinforcement for a hydrogen storage protection concrete structure [36]. The arrangement, number, specifications, and material properties of the steel rebars used in this simulation are presented in Figure 8, and the stress–strain relationship of the steel reinforcement of IS-456 was obtained from Ref. [25].

2.2.5. Air

In this study, the CEL method, which combines the advantages of Eulerian and Lagrangian modeling, was used to address element distortions and flow problems in Lagrangian materials. The equation of state model for an ideal gas was used to simulate the atmosphere around the explosive, and the density of air applied under atmospheric pressure and room temperature conditions was 1.25 kg/m3, the gas constant was 287 J/kg/K, and the specific heat was 1004 J/kg/K. The element used for the explosion simulation was a three-dimensional 8-node reduced integral (EC3D8R) element based on the Eulerian Continuum.

2.3. Boundary Conditions and Mesh

To evaluate the vibration stability of nearby structures in the event of a hydrogen gas explosion in a shallow storage tank (Figure 9), the bottom boundary of the analysis domain was fixed (Ux = Uy = Uz = URx = URy = URz = 0). Additionally, fixed boundaries were applied in the x-direction at the front face of the domain, and roller conditions were applied in the y- and z-directions (Ux = URy = URz = 0). On the right side of the domain, fixed boundaries were applied in the z-direction, whereas roller conditions were applied in the x- and y-directions (Uz = URx = URy = 0). The left side of the domain has fixed boundaries in the z-direction, and the rear face has fixed boundaries in the x-direction. Three-dimensional 8-node reduced integration elements (C3D8R) were used for the protective concrete structure and the ground, whereas the reinforcing steel bars in the protective concrete structure were discretized using B31 elements. The explosive charge and surrounding atmosphere were represented by grids of the EC3D8R element type, which are Eulerian-continuum-based reduced-integral elements with eight nodes. In this study, a mesh-independent test was conducted to determine the optimal element size to ensure consistency of the simulation results. Multiple analyses were performed for various grid sizes, and the optimal grid size that yielded the convergent analysis results was determined. Consequently, it was confirmed that the grid size near the explosion point should be at least 5 cm to obtain stable analytical results.

3. Vibration Stability Evaluation Due to Hydrogen Gas Explosion

Figure 10 shows the simulation results obtained under the scenario of an explosion occurring inside a hydrogen storage facility with a hydrogen concentration of 40%. The results were used to evaluate the magnitude of the vibration velocity over time at observation points A, B, and C located on the ground surface. It is evident that the maximum amplitude of the vibration was significantly higher closer to the explosion point, whereas the amplitude of the vibration decreased as one moved away from the explosion source. Figure 11 shows the field output results of the ground vibration velocity for the same analysis across the entire domain. Immediately after the explosion, the blast stress wave rapidly propagated to the surrounding ground. From a structural perspective, the blast stress was more concentrated in the upper ground of the storage facility, close to the free surface (i.e., the minimum resistance line).
Based on these simulation results and the domestic allowable limit of vibration for building structures (Table 5), the vibration stability of aboveground building structures due to gas explosions occurring in underground hydrogen storage was evaluated. Figure 12 illustrates the surface vibration velocity (V) as a function of horizontal distance (L) for various hydrogen concentration explosion scenarios, represented by a power-law-based nonlinear regression analysis. The dashed lines in the graph represent domestically legislated vibration tolerance thresholds. In the range of horizontal distances from 3 to 60 m, the maximum surface vibration velocity due to hydrogen gas explosions was evaluated to be approximately 13 cm/s. With a 10% increase in hydrogen gas concentration, the surface vibration velocity of the surrounding ground increased by approximately 30%. Additionally, the ground vibration velocity showed a sharp decreasing trend until it reached the horizontal separation distance range of approximately 6–7 m and showed a relatively gentle linear decreasing trend at separation distances of 7 m or more (an inflection point in the slope exists). Although there are some differences in the explosion power depending on the hydrogen gas concentration, the zone with a separation distance within 7 m can be estimated as the fracture zone, where the plastic fracture is concentrated and stress (or fracture energy) is released. At a separation distance of more than 7 m, only simple elastic wave transmission occurred as an elastoplastic region accompanied by a few crack zones.
Figure 13 shows the minimum required horizontal separation distance of building structures obtained by applying domestic blast vibration tolerance standards to the simulation results derived in this study. For masonry buildings and wooden structures, the minimum allowable separation distance tends to increase depending on hydrogen concentration. However, for large RC buildings and steel structure buildings, a relatively short minimum allowable separation distance was calculated, regardless of the concentration of hydrogen leaked into the storage. It was predicted that there would be no significant impact on the vibration stability of these large building structures if the separation distance was secured to 6–7 m or more.

4. Damage Stability Assessment of Nearby Underground Tunnel Structures Due to Hydrogen Gas Explosion

4.1. Influence of Separation Distance of Nearby Tunnel Structures on Damage

In this study, to assess the damage to nearby underground structures caused by hydrogen gas explosions, we conducted analyses by adding a tunnel structure to the existing analysis domain and introduced parameters denoted as H (tunnel depth) and L (separation distance from the hydrogen storage facility). The scenario of a hydrogen gas explosion in a hydrogen storage facility, which acts as an explosion source, assumes conditions of large-scale deformation of the entire area of the protective structure owing to a large-scale explosion, which corresponds to the case in which a hydrogen charging station with a capacity of 200 kg/day causes a complete explosion. Figure 14 shows a conceptual diagram of the simulation model for evaluating the damage stability of nearby underground tunnel structures due to hydrogen gas explosions. Table 6 lists the main variable conditions for each analysis case.
Figure 15 shows the simulation results depicting the damage behavior of the tunnel lining according to the change in the horizontal separation distance under the same tunnel depth of 8 m (H = 8 m). In all the analysis results, the damage zone owing to tensile deformation tended to be more widely distributed than that caused by compressive deformation, and the degree of damage decreased as the separation distance increased. In particular, the distribution of damage in Cases 2 and 3, with separation distances of 8 and 10 m, respectively, significantly decreased compared with Case 1, where the minimum separation distance was set at 5 m. This trend was consistent with the minimum separation distance discussed in Section 3. In terms of the damage distribution characteristics, although there was a difference depending on the separation distance, damage patterns showing linearity along the axial direction of the tunnel were consistently observed. When these linear damage patterns are compared with the stratum where the tunnel structure is located (see Table 2), it can be seen that damage tends to be concentrated at the boundaries between strata (A, B, C in Figure 16), and this is caused by differences in dynamic characteristics (i.e., characteristic impedance) of the materials (rock, soil, etc.) that make up the stratum. Under the current analysis conditions, the dynamic properties of the materials that make up the strata are different, which can be considered to cause flexural fracture owing to the deviation at each boundary, as it causes stress deviation according to the material response characteristics.

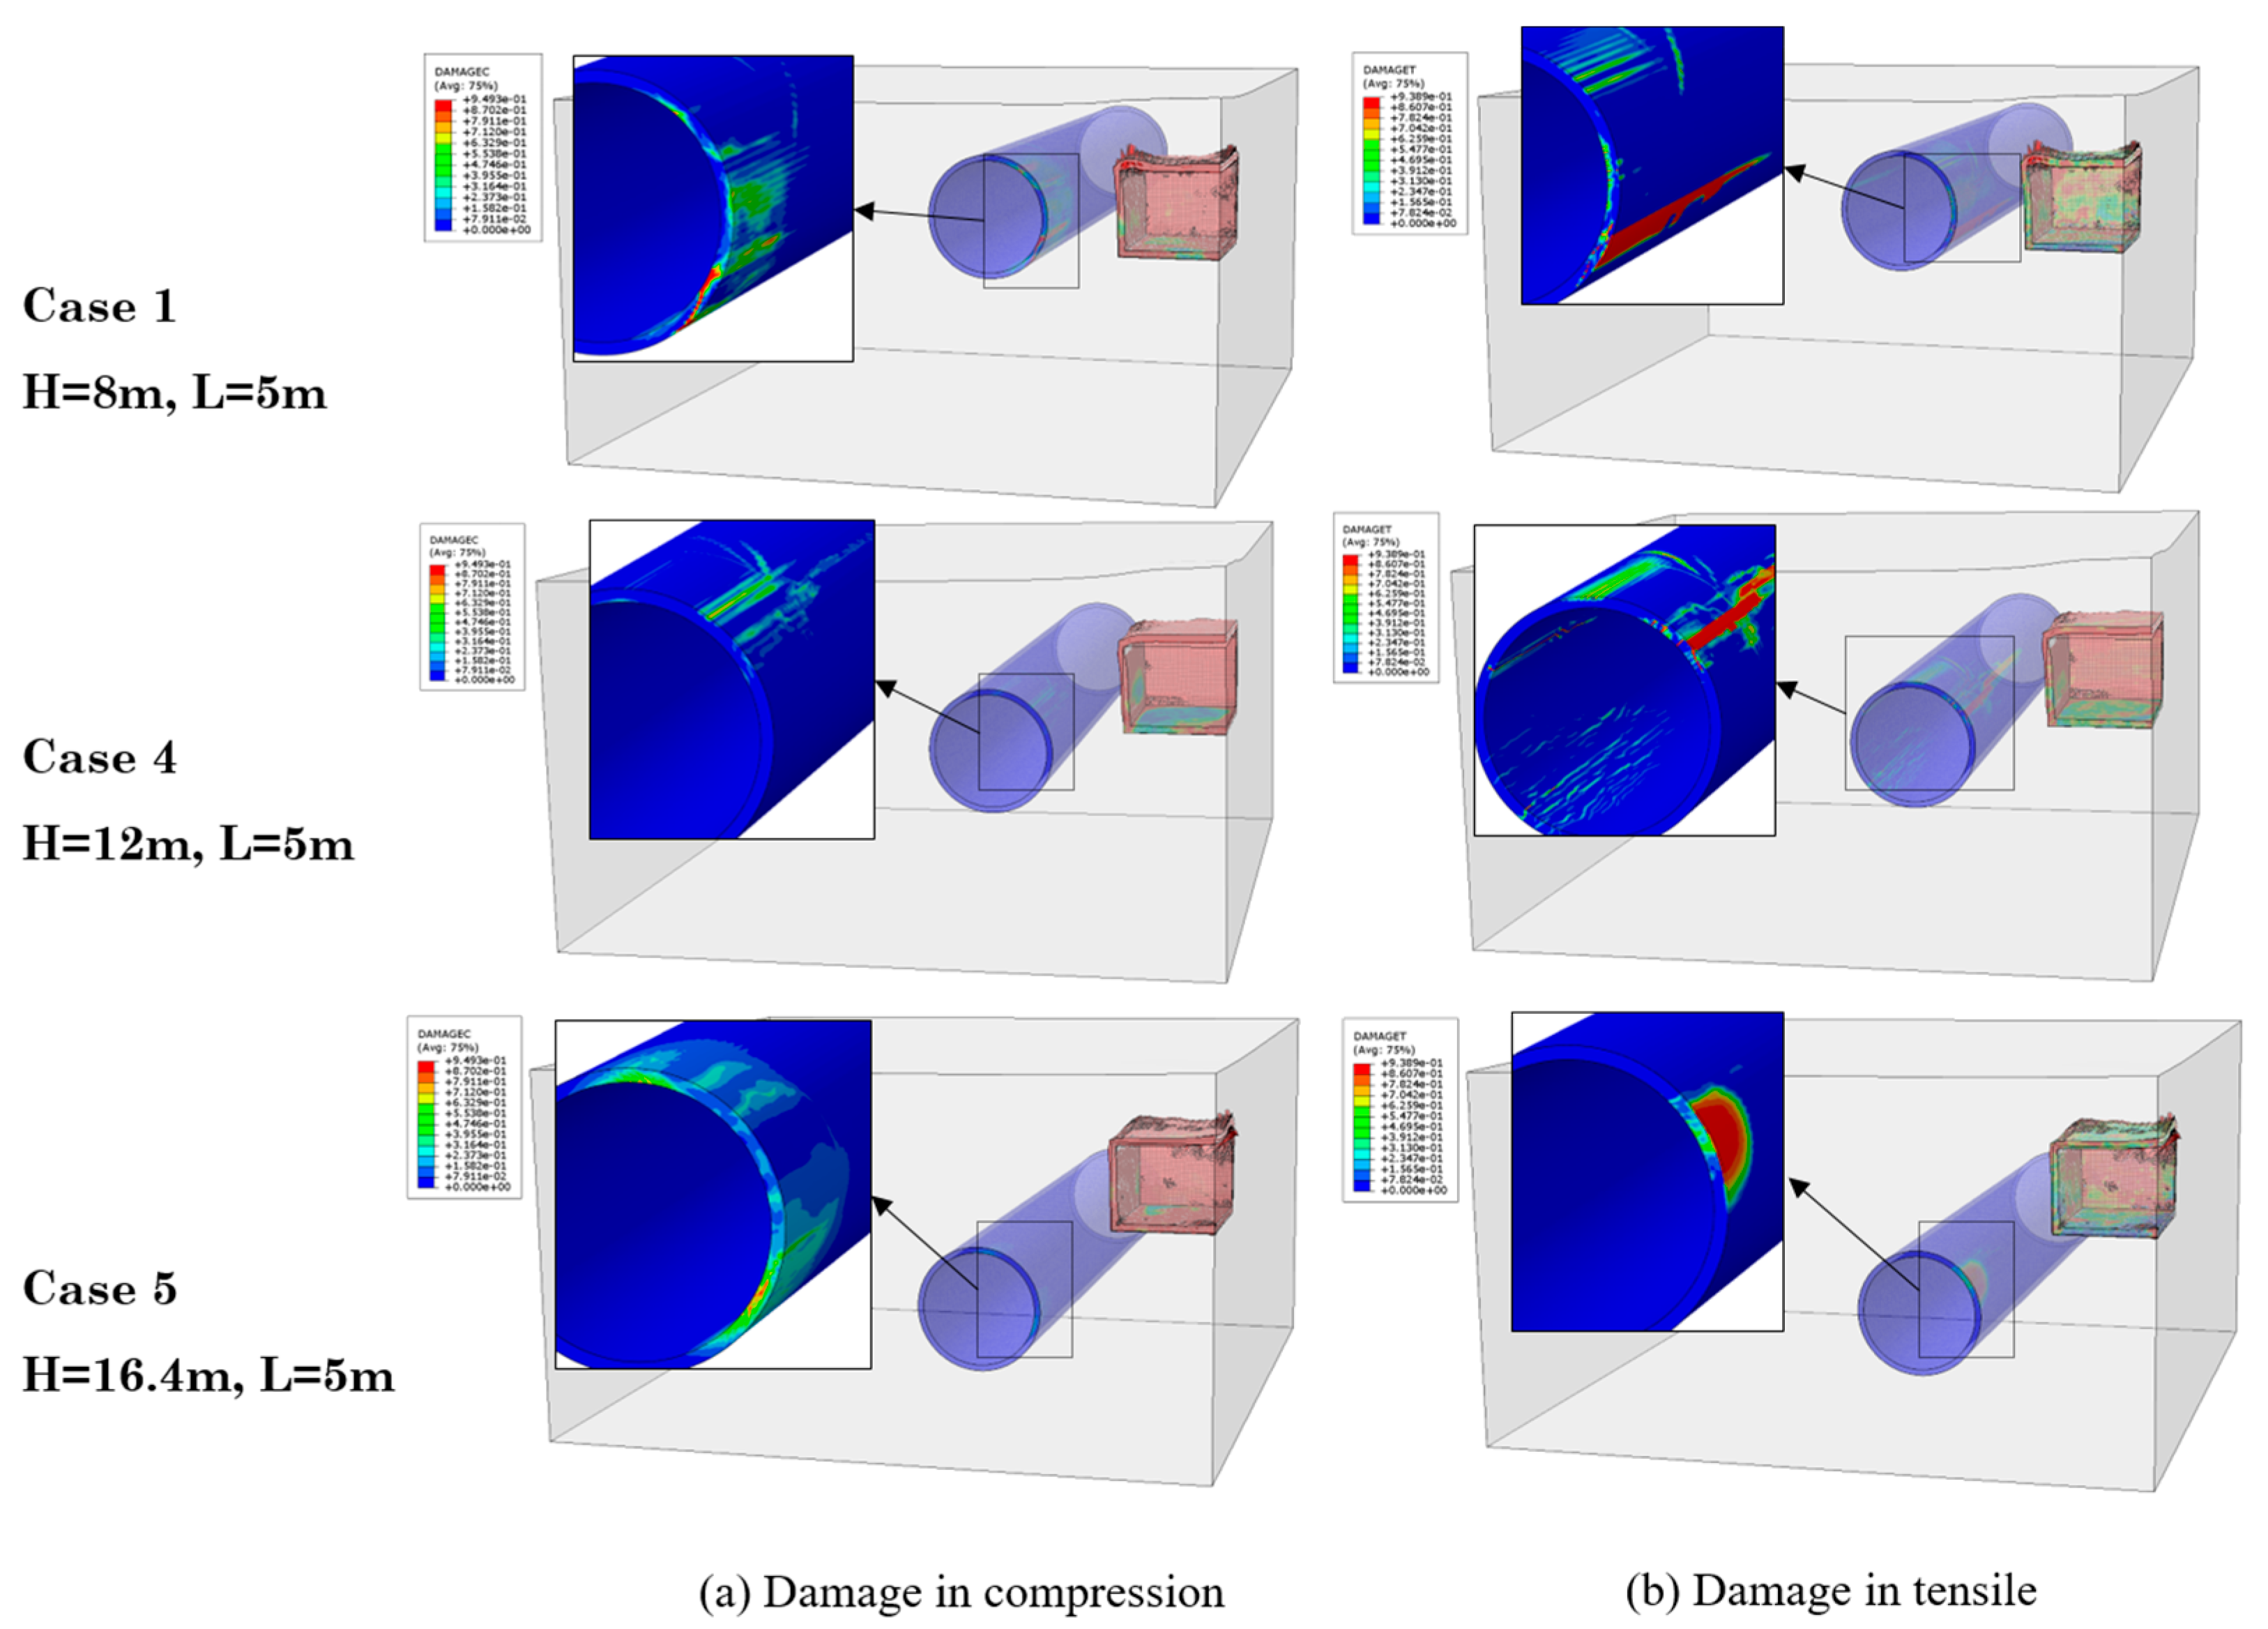
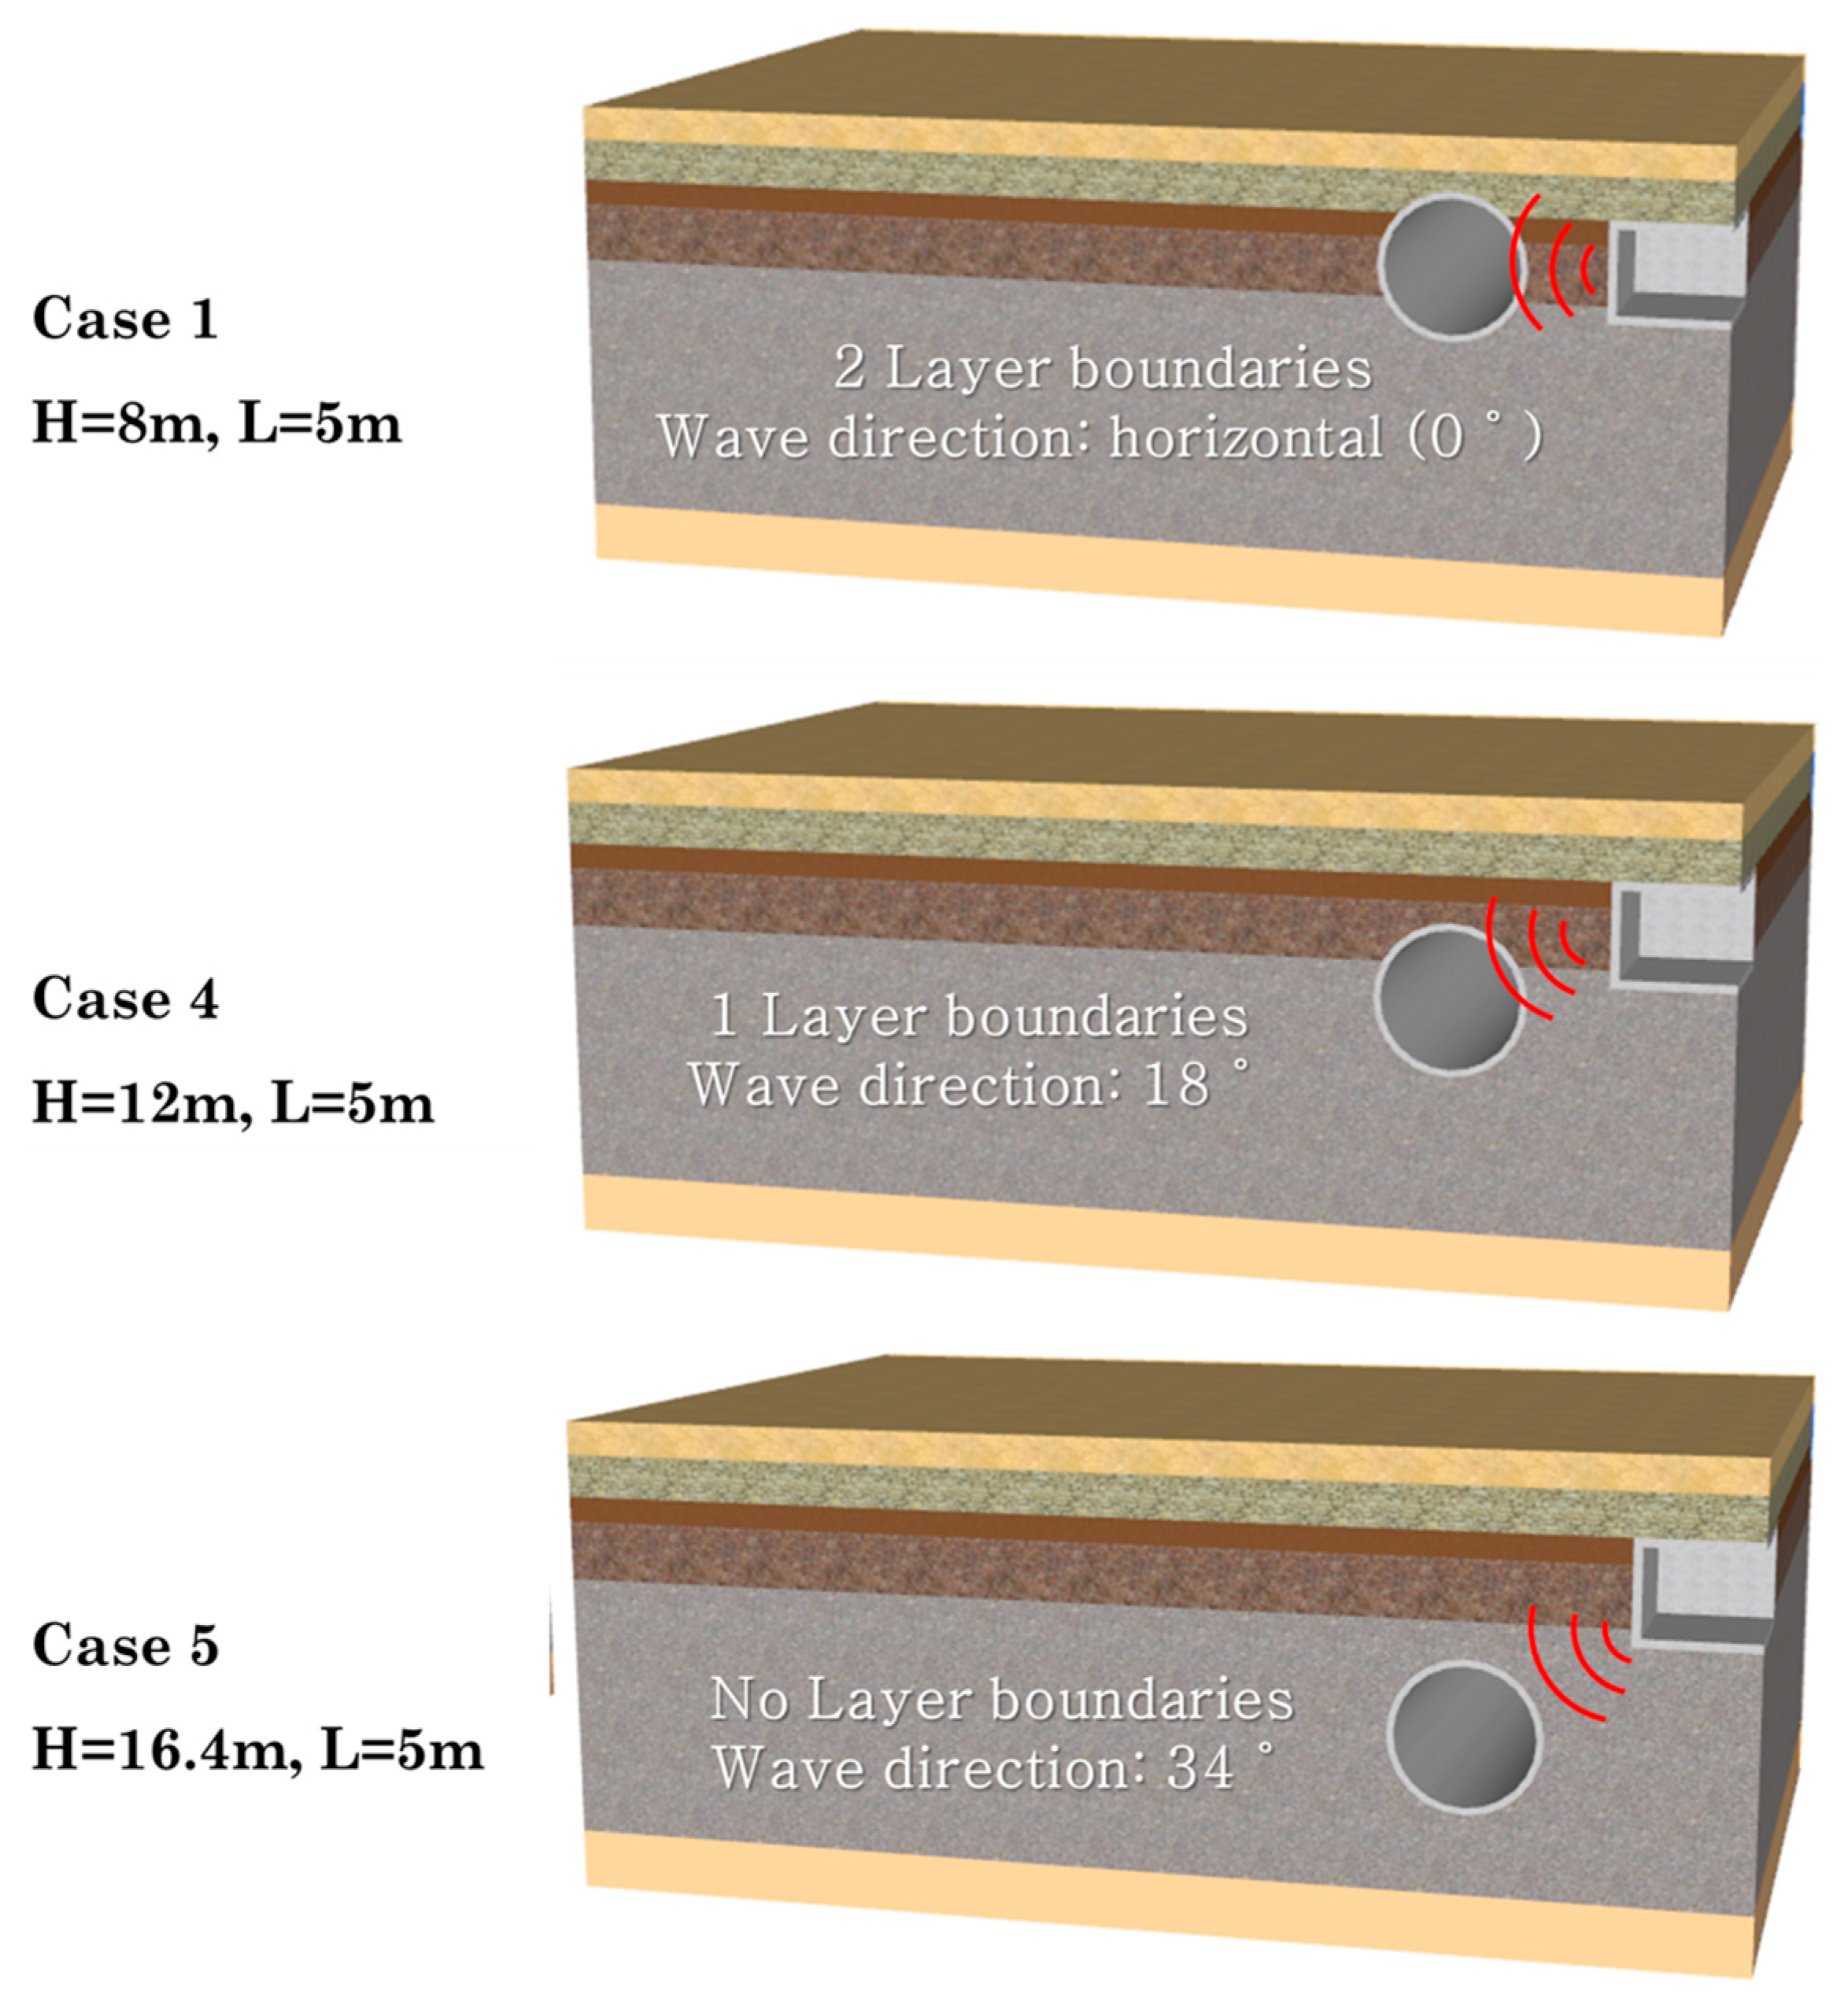
4.2. Influence of Tunnel Depth on Damage

Figure 17 shows the results of the damage analysis performed under three different tunnel depths (H = 8, 12, and 16.4 m) at the same horizontal separation distance (L) of 5 m. In terms of the minimum separation distance between the explosion source and the underground tunnel structure, Case 1 had the closest separation distance (5 m), followed by Cases 4, 5, 2, and 3 (see Table 6). The damage patterns in Cases 1 and 4 were noteworthy. In terms of the minimum separation distance, Case 1 is slightly closer to the explosion source with a difference of 1 m, but the two analysis results show totally different damage patterns, and it appears to be more dominant in the distribution pattern of the damage owing to the tensile deformation for Case 4. As mentioned above, this can be attributed to the close relationship between the damage distribution and dynamic characteristics of the stratum in the area where the underground tunnel structure is located. Figure 18 shows the geological boundary and explosion wave directions based on the tunnel location in the stratum model. The shape and distribution of the tensile damage zone in Case 4 clearly corresponded to the stratum boundary, and symmetric damage patterns for the propagation direction of the explosion stress waves propagating from the explosion source were also observed.
Case 5 in Figure 17 shows the damage behavior when an underground tunnel structure exists in a single medium. Here, the shortest separation distance between the explosion source and tunnel structure is 6.5 m, which assumes an explosion near the field. It can be confirmed that the overall compression damage occurred in the direction in which the explosion stress wave propagated. A spherical tensile damage zone was observed at the point where the wavefront of the explosion stress wave and the underground tunnel structure met a tangent line, which is believed to be due to the spalling phenomenon covered in the general blasting theory.
When evaluating the overall analysis results from a conservative standpoint, it was concluded that the safety of the tunnel structure can be ensured when a minimum separation distance of at least 10 m is maintained, assuming an underground hydrogen storage explosion scenario with specifications such as the analysis conditions. In addition, it was confirmed that when an underground structure is situated in multilayered ground, the structural and dynamic characteristics of the ground layers are very important factors in assessing the stability of the adjacent structure against a hydrogen gas explosion.
The results of this analysis suggest that not only simple separation distances but also the dynamic properties of the ground materials comprising geological structures are crucial factors that should be fully considered when designing disaster responses for underground hydrogen storage. Therefore, by incorporating accurate ground properties into the simulation model through in situ ground investigation and dynamic property characterization, a more reliable and safer design of the storage facility can be achieved, minimizing damage in the event of a hydrogen gas explosion.
Since this study, a specific scenario-based analysis and evaluation were conducted focusing on the target structure, without considering the application of additional techniques for ground vibration mitigation. Consequently, further exploration is needed, including an analysis of more general cases and a review of additional techniques for ground vibration reduction. For instance, research by Herbut et al. [38] has studied the impact of the structural form of trenches within the ground on vibration attenuation, proposing optimal sensor placements for field verification [39]. Furthermore, research by Li et al. [40] utilized a dynamic indoor experimental apparatus to investigate the attenuation of dynamic energy propagation based on the discontinuity shapes within the bedrock. Thus, further verification of the analytical results through laboratory-scale experiments or small-scale field tests seems necessary, and the integration of various techniques for ground vibration mitigation appears essential.

5. Conclusions

In this study, numerical analysis was conducted to assess the impact of hydrogen explosion vibrations on the ground subsurface and nearby underground structures, assuming a disaster scenario involving a hydrogen gas explosion at a low-depth underground hydrogen storage facility. To simulate the dynamic behavior against a hydrogen gas explosion, Dassault Systems’ ABAQUS 2023 software was employed, and the JWL-EOS model based on the equivalent TNT was applied. The model examined the impact of ground surface vibrations on buildings and the damage behavior of nearby underground structures in the event of a hydrogen gas explosion at a hydrogen storage facility. The main conclusions drawn from this study are as follows:
  • To examine the impact of ground vibrations on the surrounding building, ground vibration levels were assessed at various separation distances (the distance between the measurement point and the explosion source) with hydrogen concentrations of 20%, 30%, and 40%. A distinct difference was observed in the tendency of the ground surface vibration to decrease as the separation distance increased based on a separation distance of 7 m. Within a separation distance of 7 m, a sharp decline in the vibration velocity was evident, whereas beyond this range, a relatively gradual decrease in the trend was observed.
  • The surface vibration velocity measured at the range of 3–60 m from the explosion source was approximately 13 cm/s (13 Kine), although there was a deviation depending on the hydrogen gas concentration. However, above a separation distance of approximately 35 m, the surface vibration velocity converged to approximately 1 cm/s. After evaluating the impact of vibrations on ground structures by substituting the predicted vibration velocity values from a simulation model into the blast vibration tolerance standards legislated in Korea, it was determined that safety against ground vibrations can be ensured at a separation distance of approximately 6–7 m or more when targeting large reinforced concrete structures.
  • In the numerical analysis evaluating the impact of a hydrogen gas explosion on nearby underground tunnel structures, safety against explosions could be assured when the minimum separation distance was 10 m or more regardless of the direction (horizontal or vertical). From a conservative perspective, maintaining a minimum separation distance of 10 m or more from the hydrogen storage facility is believed to definitively ensure the damage stability of nearby tunnel structures against a hydrogen gas explosion.
  • The dynamic damage effects on the underground structures were predicted to exhibit substantial variations depending on the dynamic properties of the stratum. The mutual interaction between the stratigraphic surface of the ground layer and the boundary surface of the structure can vary considerably depending on the location of the underground structure. When a stratigraphic surface with significant differences in dynamic characteristics aligns with the boundary of the structure, more damage may occur owing to the bending failure behavior caused by stress deviation. Furthermore, the impact of a hydrogen gas explosion on nearby underground tunnel structures may depend on various factors, including the hydrogen storage infrastructure (storage scale, structural characteristics, and damping structure), as well as the characteristics of the underground tunnel structure. There are still numerous details that require discussion and validation, and these issues will be addressed in our forthcoming research.

Author Contributions

Conceptualization, Y.K. and G.-H.G.; methodology, H.-J.C.; software (ABAQUS 2023), V.-H.C. and G.-H.G.; validation, S.-W.O.; writing, original draft preparation, G.-H.G. and V.-H.C.; writing, review, and editing, S.-W.O. and M.-J.K.; visualization, V.-H.C., H.-J.C. and S.-W.O.; supervision, G.-H.G. and Y.K.; and funding acquisition, Y.K. All authors have read and agreed to the published version of the manuscript.

Funding

This work was supported by the KICT Research Program (20230104-001, Development of technology to secure safety and acceptability for infrastructure in hydrogen city) funded by the Ministry of Science and ICT, and by the National Research Foundation of Korea (NRF) grant funded by the Korea government (MSIT) (No. 2022R1C1C1006507).

Institutional Review Board Statement

Not applicable.

Informed Consent Statement

Not applicable.

Data Availability Statement

The data presented in this study are available on request from the corresponding author. The data are not publicly available due to privacy.

Conflicts of Interest

The authors declare no conflict of interest.

References

  1. Fuel Cells and Hydrogen Joint Undertaking, Hydrogen Roadmap Europe. 2019. Available online: https://op.europa.eu/en/publication-detail/-/publication/0817d60d-332f-11e9-8d04-01aa75ed71a1/language-en (accessed on 15 July 2023).
  2. CRIRO. National Hydrogen Roadmap: Pathways to an Economically Sustainable Hydrogen Industry in Australia. 2018. Available online: https://www.csiro.au/-/media/Do-Business/Files/Futures/18-00314_EN_NationalHydrogenRoadmap_WEB_180823.pdf (accessed on 10 June 2023).
  3. COAG Energy Counsil. Austalia’s National Hydrogen Strategy. 2019. Available online: https://www.dcceew.gov.au/sites/default/files/documents/australias-national-hydrogen-strategy.pdf (accessed on 5 June 2023).
  4. Go, G.H.; Jeon, J.S.; Kim, Y.S.; Kim, H.W.; Choi, H.J. Prediction of Hydrodynamic Behavior of Unsaturated Ground Due to Hydrogen Gas Leakage in a Low-depth Underground Hydrogen Storage Facility. J. Kor. Geotech. Soc. 2022, 38, 107–118. [Google Scholar]
  5. Taylor, J.B.; Alderson, J.E.A.; Kalyanam, K.M.; Lyle, A.B.; Phillips, L.A. Technical and Economic Assessment of Methods for the Storage of Large Quantities of Hydrogen. Int. J. Hydrog. Energy 1986, 11, 5–22. [Google Scholar] [CrossRef]
  6. Van Gessel, S. Underground Hydrogen Storage Application of UNFC—Injection Projects, Enabling Sustainability Principles in Resource Management; UNECE: Geneva, Switzerland, 2021. [Google Scholar]
  7. Andersson, J.; Grönkvist, S. Large-scale storage of hydrogen. Int. J. Hydrog. Energy 2019, 44, 11901–11919. [Google Scholar] [CrossRef]
  8. Ozarslan, A. Large-scale Hydrogen Energy Storage in Salt Caverns. Int. J. Hydrog. Energy 2012, 37, 14265–14277. [Google Scholar] [CrossRef]
  9. Bai, M.; Song, K.; Sun, Y.; He, M.; Ki, Y.; Sun, J. An Overview of Hydrogen Underground Storage Technology and Prospects in China. J. Petrol. Sci. Eng. 2014, 124, 132–136. [Google Scholar] [CrossRef]
  10. Simón, J.; Férriz, A.M.; Correas, L.C. HyUnder-Hydrogen Underground Storage at Large Scale: Case Study Spain. Energy Proc. 2015, 73, 136–144. [Google Scholar] [CrossRef]
  11. Heinemann, N.; Booth, M.G.; Haszeldine, R.S.; Wilkinson, M.; Scafidi, J.; Edlmann, K. Hydrogen Storage in Porous Geological Formations-onshore Play Opportunities in the Midland Valley (Scotland, UK). Int. J. Hydrog. Energy 2018, 43, 20861–20874. [Google Scholar] [CrossRef]
  12. Heinemann, N.; Alcalde, J.; Miocic, J.M.; Hangx, S.J.; Kallmeyer, J.; Ostertag-Henning, C.; Hassanpouryouzband, A.; Thaysen, E.M.; Strobel, G.J.; Schmidt-Hattenberger, C.; et al. Enabling Large-scale Hydrogen Storage in Porous Media-the Scientific Challenges. Energy Environ. Sci. 2021, 14, 853–864. [Google Scholar] [CrossRef]
  13. Michalski, J.; Bünger, U.; Crotogino, F.; Donadei, S.; Schneider, G.S.; Pregger, T.; Cao, K.K.; Heide, D. Hydrogen Generation by Electrolysis and Storage in Salt Caverns: Potentials, Economics and Systems Aspects with Regard to the German Energy Transition. Int. J. Hydrog. Energy 2017, 42, 13427–13443. [Google Scholar] [CrossRef]
  14. Tarkowski, R.; Czapowski, G. Salt Domes in Poland-Potential Sites for Hydrogen Storage in Caverns. Int. J. Hydrog. Energy 2018, 43, 21414–21427. [Google Scholar] [CrossRef]
  15. Lankof, L.; Tarkowski, R. Assessment of the Potential for Underground Hydrogen Storage in Bedded Salt Formation. Int. J. Hydrog. Energy 2020, 45, 19479–19492. [Google Scholar] [CrossRef]
  16. Ebigbo, A.; Golfier, F.; Quintard, M. A Coupled, Pore-scale Model for Methanogenic Microbial Activity in Underground Hydrogen Storage. Adv. Water Resour. 2013, 61, 74–85. [Google Scholar] [CrossRef]
  17. Hagemann, B.; Rasoulzadeh, M.; Panfilov, M.; Ganzer, L.; Reitenbach, V. Mathematical Modeling of Unstable Transport in Underground Hydrogen Storage. Environ. Earth Sci. 2015, 73, 6891–6898. [Google Scholar] [CrossRef]
  18. Sáinz-García, A.; Abarca, E.; Rubí, V.; Grandia, F. Assessment of Feasible Strategies for Seasonal Underground Hydrogen Storage in a Saline Aquifer. Int. J. Hydrog. Energy 2017, 42, 16657–16666. [Google Scholar] [CrossRef]
  19. Shi, Z.; Jessen, K.; Tsotsis, T.T. Impacts of the Subsurface Storage of Natural Gas and Hydrogen Mixtures. Int. J. Hydrog. Energy 2020, 45, 8757–8773. [Google Scholar] [CrossRef]
  20. Papan, D.; Valaskova, V.; Drusa, M. Numerical and Experimental Case Study of Blasting Works Effect. IOP Conf. Series Earth Environ. Sci. 2016, 44, 052052. [Google Scholar] [CrossRef]
  21. Papan, D.; Brozova, E.; Papanova, Z. Experimental Simulation of Deformation Effect Propagation Due to Explosion on the Surface of a Small-Scale Model. Buildings 2023, 13, 1566. [Google Scholar] [CrossRef]
  22. Liu, X.; Shi, X.; Li, Y.; Li, P.; Zhao, K.; Ma, H.; Yang, C. Maximum gas production rate for salt cavern gas storages. Energy 2021, 234, 121211. [Google Scholar] [CrossRef]
  23. Goryl, L. Triennium work reports june 2018: Report of study group 2.1 UGS database. In Proceedings of the 27th World Gas Conference, Washington, DC, USA, 25–29 June 2018. [Google Scholar]
  24. Noh, W.F. CEL: A Time-Dependent, Two-Space-Dimensional, Coupled Eulerian-Lagrange Code; No. UCRL-7463; Lawrence Radiation Laboratory, University of California: Livermore, CA, USA, 1963. [Google Scholar]
  25. Zaid, M.; Sadique, M.R.; Alam, M.M. Blast resistant analysis of rock tunnel using abaqus: Effect of weathering. Geotech. Geol. Eng. 2022, 40, 809–832. [Google Scholar] [CrossRef]
  26. Benson, D.J.; Okazawa, S. Contact in a multi-material Eulerian finite element formulation. Comput. Methods Appl. Mech. Eng. 2004, 193, 4277–4298. [Google Scholar] [CrossRef]
  27. Liu, Z.; Ma, Z.; Liu, K.; Zhao, S.; Wang, Y. Coupled CEL-FDEM modeling of rock failure induced by high-pressure water jet. Eng. Fract. Mech. 2023, 277, 108958. [Google Scholar] [CrossRef]
  28. Molkov, V.; Dery, W. Blast wave from a high- pressure gas tank rupture in a fire: Stand-alone and under- vehicle hydrogen tanks. Int. J. Hydrog. Energy 2015, 40, 12581–12603. [Google Scholar] [CrossRef]
  29. Lee, H.-H.; Kim, H.-G.; Yoo, J.-O.; Lee, H.-Y.; Kwon, O.-S. A basic study for explosion pressure prediction of hydrogen fuel vehicle hydrogen tanks in underground parking lot. J. Kor. Tunnell. Underground Space Assoc. 2021, 23, 605–612. (In Korean) [Google Scholar]
  30. Ryu, J.-O.; Ahn, S.-H.; Lee, H.Y. A basic study on explosion pressure of hydrogen tank for hydrogen fueled vehicles in road tunnels. J. Kor. Tunnell. Underground Space Assoc. 2021, 23, 517–534. (In Korean) [Google Scholar]
  31. Lopes, K.B.; Melo, P.F. Analysis of the effects of explosion of a hydrogen cylinder on the transfer of radioactive liquid wastes at nuclear power stations. In Proceedings of the International Nuclear Atlantic Conference (INAC), Belo Horizonte, MG, Brazil, 24–28 October 2011; pp. 1–15. [Google Scholar]
  32. Larcher, M.; Casadei, F. Explosions in complex geometries—A comparison of several approaches. Int. J. Prot. Struct. 2010, 1, 169–195. [Google Scholar] [CrossRef]
  33. Nozu, T.; Tanaka, R.; Ogawa, T.; Hibi, K.; Sakai, Y. Numerical simulation of hydrogen explosion tests with a barrier wall for blast mitigation. In Proceedings of the International Conference on Hydrogen Safety, Pisa, Italy, 8–10 September 2005. [Google Scholar]
  34. Hibbitt, D.; Karlsson, B.; Sorensen, P. ABAQUS User-Manual Release 6.14; Dassault Systèmes Simulia Corp.: Providence, RI, USA, 2014. [Google Scholar]
  35. Hafezolghorani, M.; Hejazi, F.; Vaghei, R.; Jaafar, M.S.B.; Karimzade, K. Simplified damage plasticity model for concrete. Struct. Engine. Int. 2017, 27, 68–78. [Google Scholar] [CrossRef]
  36. Jonhson, G.R.; Cook, W.H. A constitutive model and data for metal subjected to large strains, high strain rates and high temperature. In Proceedings of the Seventh International Symposium on Ballistic, Hague, The Netherlands, 19–21 April 1983; pp. 19–21. [Google Scholar]
  37. MOLIT. Tunnel Standard Construction Specification. 2015. Available online: https://openjicareport.jica.go.jp/pdf/12303566.pdf (accessed on 8 August 2023).
  38. Herbut, A. Vibration mitigation efficiency of an inclined curved open trench. PLoS ONE 2020, 15, e0229010. [Google Scholar] [CrossRef]
  39. Herbut, A.; Rybak, J.; Brząkała, W. On a Sensor Placement Methodology for Monitoring the Vibrations of Horizontally Excited Ground. Sensors 2020, 20, 1938. [Google Scholar] [CrossRef]
  40. Li, J.C.; Rong, L.F.; Li, H.B.; Hong, S.N. An SHPB Test Study on Stress Wave Energy Attenuation in Jointed Rock Masses. Rock Mech Rock Eng. 2019, 52, 403–420. [Google Scholar] [CrossRef]
Figure 1. The main distribution pattern of global underground salt cavern gas storage (image from Ref. [22], data from Ref. [23]).
Applsci 13 12317 g001
Figure 2. Conceptual design of underground hydrogen storage facility in Korea.
Applsci 13 12317 g002
Figure 3. Hydrogen explosion experiment and the schematic of locations of pressure transducers and displacement sensors [33].
Applsci 13 12317 g003
Figure 4. The 3D numerical model simulated by ABAQUS using the TNT equivalent method (CEL modeling method).
Applsci 13 12317 g004
Figure 5. Validation results of the simulation model using the TNT equivalent method (Experimental data were obtained from Nozu et al. [33]).
Applsci 13 12317 g005
Figure 6. Location of the gas station and the drill log for the borehole.
Applsci 13 12317 g006
Figure 7. The 3D numerical model simulated by ABAQUS (a quarter of the field).
Applsci 13 12317 g007
Figure 8. Underground hydrogen infrastructure. Thickness: 500 mm; material: concrete (M30) and steel bar (IS-456).
Applsci 13 12317 g008
Figure 9. Boundary conditions of the numerical simulation model (a quarter of the field).
Applsci 13 12317 g009
Figure 10. Predicted vibration results at the ground surface at different distances from the hydrogen storage infrastructure.
Applsci 13 12317 g010
Figure 11. Field output graph of vibration due to hydrogen explosion over time.
Applsci 13 12317 g011
Figure 12. Vibration value at ground surface to underground hydrogen infrastructure.
Applsci 13 12317 g012
Figure 13. Minimum required distance to hydrogen infrastructure.
Applsci 13 12317 g013
Figure 14. Simulation with reinforcement tunnel lining. Material: concrete (M30) and steel bar (IS-456).
Applsci 13 12317 g014
Figure 15. Damage assessment results of a concrete tunnel lining subjected to explosions with different separation distances.
Applsci 13 12317 g015
Figure 16. Geological boundaries on the underground tunnel near the explosion source.
Applsci 13 12317 g016
Figure 17. Damage assessment results of a concrete tunnel lining subjected to explosions with different tunnel depths.
Applsci 13 12317 g017
Figure 18. Geological boundary and explosion wave direction according to tunnel location.
Applsci 13 12317 g018
Table 1. Input properties of TNT explosive for the JWL-EOS model [32].
Mass
Density
(kg/m3)
Detonation Wave Speed
(m/s)
A (GPa)B (GPa)ΩR1R2Detonation
Energy Density (kJ/kg)
16306930373.83.7470.354.150.93689
Table 2. Material properties used in the numerical simulation model.
Geological StratumDepth
(m)
Unit Weight
(kN/m3)
Cohesion
(kPa)
Internal
Friction
Angle
(o)
Dynamic
Elastic
Modulus
(MPa)
Dynamic
Poisson’s
Ratio
(−)
Silty sand2.018.55272050.395
Gravel sand2.5183282750.417
Silty sand1.51924307880.407
Soft rock3.5234003446000.357
Hard rock15.52625004212,9180.242
Soft rock3.1223503146000.357
Table 3. Input properties of M30 grade concrete [35].
Mass
Density
Young’s ModulusPoisson’s RatioDilation AngleEccentricityfb0/fc0kViscosity
Parameter
2500 kg/m326.6 GPa0.23100.11.160.670
Table 4. Tensile behavior of M30 grade concrete [35].
Tensile behaviorStress (MPa)Strain
2.000.000000000
0.020.000943396
Tensile damageDamageStrain
0.000.000000000
0.990.000943396
Table 5. Allowable limit of vibration suggested by tunnel standard construction specifications [37].
Type of StructureCultural AssetMasonry Wall (Brick, Stone, etc.) and Wooden CeilingStructure with Underground Foundations and Concrete SlabsSmall and Medium Building with Reinforced Concrete Frames and SlabsLarge Building with Reinforced Concrete/Steel Frames and Slabs
Allowable vibration values at building foundation (cm/s)0.2–0.31.02.03.05.0
Table 6. Geometric conditions for numerical simulation cases.
ClassificationSeparation Distance,
(m)
Depth,
(m)
Minimum Distance
(m)
Central
Interval (m)
Angle in the Direction of the Explosion Source (°)
Case 158512.50
Case 288812.50
Case 31081018.50
Case 451261318
Case 5516.46.51534
Disclaimer/Publisher’s Note: The statements, opinions and data contained in all publications are solely those of the individual author(s) and contributor(s) and not of MDPI and/or the editor(s). MDPI and/or the editor(s) disclaim responsibility for any injury to people or property resulting from any ideas, methods, instructions or products referred to in the content.

