Article

Investigation of Wind Power Potential in Mthatha, Eastern Cape Province, South Africa

Physics Department, University of Fort Hare, 1 King Williams Town Road, Private Bag X1314, Alice 5700, South Africa
*
Author to whom correspondence should be addressed.
Appl. Sci. 2023, 13(22), 12237; https://doi.org/10.3390/app132212237
Submission received: 14 October 2023 / Revised: 3 November 2023 / Accepted: 7 November 2023 / Published: 11 November 2023
(This article belongs to the Topic Solar and Wind Power and Energy Forecasting)

Abstract

:
South Africa is currently grappling with a national energy crisis and the high infrastructure costs associated with expanding the national grid to remote areas. Simultaneously, the government has made substantial efforts to harness renewable energy technologies, particularly wind energy. The average wind speed in a specific region significantly influences the energy yield from wind turbines. The vast open inland terrains, mountainous regions, and coastal areas in the Northern Cape, Eastern Cape, and Western Cape provinces of South Africa possess the most substantial wind potential. It is imperative to initiate wind energy projects in these provinces to cater to a significant portion of the local electricity demand, especially in remote areas disconnected from the national grid. Wind energy generation is inherently stochastic, subject to variations in both time and space. Consequently, it is essential to gain a comprehensive understanding of the local wind patterns to assess the feasibility of utilizing wind resources. In the Eastern Cape Province, the Mthatha area still lags in household electrification, presenting an opportunity to electrify some households using wind energy. This study aimed to evaluate the wind resource potential for Mthatha area, utilizing data spanning from 2018 to 2023, provided by the South African Weather Services. Two distribution models, the two-parameter Weibull and three-parameter Weibull, were employed to characterize the provided wind data. To determine the parameters associated with each distribution model, two estimation methods, the Maximum Likelihood Method (MLM) and the Method of Moments (MOM), were utilized. The performance of these distribution models was assessed using the Root Mean Square Error (RMSE) statistical indicator. The results showed that Mthatha area predominantly experiences low wind speeds, with an annual average wind speed of 3.30 m/s and an overall wind power density of approximately 48.48 W/m2. The prevailing winds predominantly originate from the south and east–southeast directions. Consequently, Mthatha is recommended for stand-alone applications, with the added suggestion of augmented wind turbines for the area.

1. Introduction

The increase in energy demand due to growing population, a decrease in finite fossil fuels, and an increase in energy-linked climate change has led to an increased need to turn to renewable energy resources, such as solar, biomass, and wind, for electricity generation [1]. Wind, as one of the fastest growing renewable energy technologies, witnessed the most significant year-on-year increase of 53% in 2020 [2]. Wind is inherently intermittent and random in nature, varying across different time scales, including diurnal patterns, with its magnitude influenced by spatial location and site-specific characteristics [3]. Establishing a successful wind turbine that offers affordable energy to end-users while ensuring a competitive return on investment for the investor requires an in-depth understanding of the local wind regime [4]. It is important to understand wind resources as they play a pivotal role in turbine site selection and facilitate long-term planning. Understanding the wind speed distribution for a specific site serves as the foundation for estimating the operational parameters of a wind turbine, including the capacity factor and energy output [5]. Therefore, the first step when planning to use wind resources for electrifying a particular area is to conduct a wind resource assessment to understand the fluctuating nature of the wind resources [6].
The Eastern Cape Province in South Africa has the lowest household access to electricity, with 82.64% in 2018 [7]. Expanding the national grid can be challenging in certain areas of the province because of the remoteness of the areas and the lack of supportive infrastructure. This presents a significant challenge to the government’s commitment to providing basic services to all, as outlined in the Reconstruction and Development Programme (RDP) implemented since 1994 [7]. Wind energy can substantially contribute to electrifying remote rural areas in a province, such as Mthatha. To use wind resources for electrifying the Mthatha area, it is important to understand the wind regime for the area so that the project developers can make an informed decision in terms of turbine selection and project planning and implementation [8].
Simple measurement of wind speed at a specific site like Mthatha is insufficient for understanding the wind regime for predicting the site’s energy potential due to the random nature of wind speed. The fluctuating nature of wind needs an appropriate way for its description, which is provided by probability distributions that are used for modelling the wind speed [9]. This provides insight into the likelihood of specific wind speeds occurring at the site and identifies the most frequent wind speed, which is essential for determining the required wind power output. Different methods, such as the Johnson, logistics, lognormal, normal, Rayleigh, Weibull Rayleigh, and Weibull probability distribution functions (PDFs), have been proposed and used [4,10]. In most of the literature, the two-parameter Weibull PDF (2WPDF) is preferred due to its flexibility, simplicity, and adaptability to a wide range of data [10,11]. However, it proves less effective in regions with a high likelihood of minimal wind. In such scenarios, the three-parameter Weibull PDF (3WPDF) outperforms the 2WPDF [12].
The effectiveness of the WPDF in fitting the data depends on the method used for estimating its scale ( c ) and shape ( k ) parameters [11]. Various methods, including the Maximum Likelihood Method (MLM), Empirical Method of Lysen (EML), Method of Moments (MOM), Modified MLM (MMLM), Least Squares Method (LSM), WAsP method, Openwind Method (OWM), Empirical Method of Justus (EMJ), and Standard Deviation Method (SDM), have been employed for estimating both the scale and shape parameters [6,10,11,13,14,15,16]. MMLM and Openwind methods have been found to outweigh the other methods [11,13]. The MLM, on the other hand, is typically employed when dealing with data featuring wide variations and frequent low wind speeds [14].
Various performance indicators, including Kolmogorov–Smirnov, the coefficient of determination (R2), Mean Absolute Bias Error (MABE), Root Mean Square Error (RMSE), Relative Root Mean Square (RRMS), Correlation Coefficient (R), Mean Absolute Percentage Error (MAPE), and the Index of Agreement (IOA), are employed to evaluate the efficiency of both scale and shape parameter estimation methods. The selection of the appropriate performance indicator enhances our understanding of the wind regime at a given location.
The significance of wind resource assessment is exemplified by the extensive research conducted both locally and globally. For instance, [11] conducted a wind resource assessment for Upper Blinkwater, a small village in the Eastern Cape Province of South Africa. The researchers found that the average wind speeds at heights of 11, 20, and 30 m above ground level (AGL) are 4.36, 4.61, and 4.78 m/s, respectively, with corresponding wind power densities of 144.99, 171.52, and 192.19 W/m2. Predominant winds in the area are from the north–west direction. These results indicated that Upper Blinkwater was well-suited for standalone applications utilizing small-scale wind turbines. Ref. [17] conducted wind potential assessment at six sites in the Eastern Cape Province and recommended small wind turbine installations in Fort Beaufort, Graaff-Reinet, Bisho, and Grahamstown, while Port Elizabeth was recommended for a large-scale wind turbine installation. However, in another study, Port Elizabeth experienced a mean wind speed exceeding 5 m/s, and thus, small-scale electricity generation projects were recommended [18].
The WPDF is the most used model to predict the wind resource potential. The Weibull parameters used for the prediction of the wind resource potential are estimated using various established methods and compared rather than using just one method [13]. Thus, this study used the MLM and MOM methods to predict the 2WPDF and 3WPDF parameters for the Mthatha area to establish the wind resource potential to determine the feasibility of utilising wind power for off-grid household electrification.
The article is arranged into the following major sections: Section 2.1 briefly describes the location, size, and conditions of the Mthatha area. Section 2.2 describes the source of data, the size, and the characteristics of the dataset. 
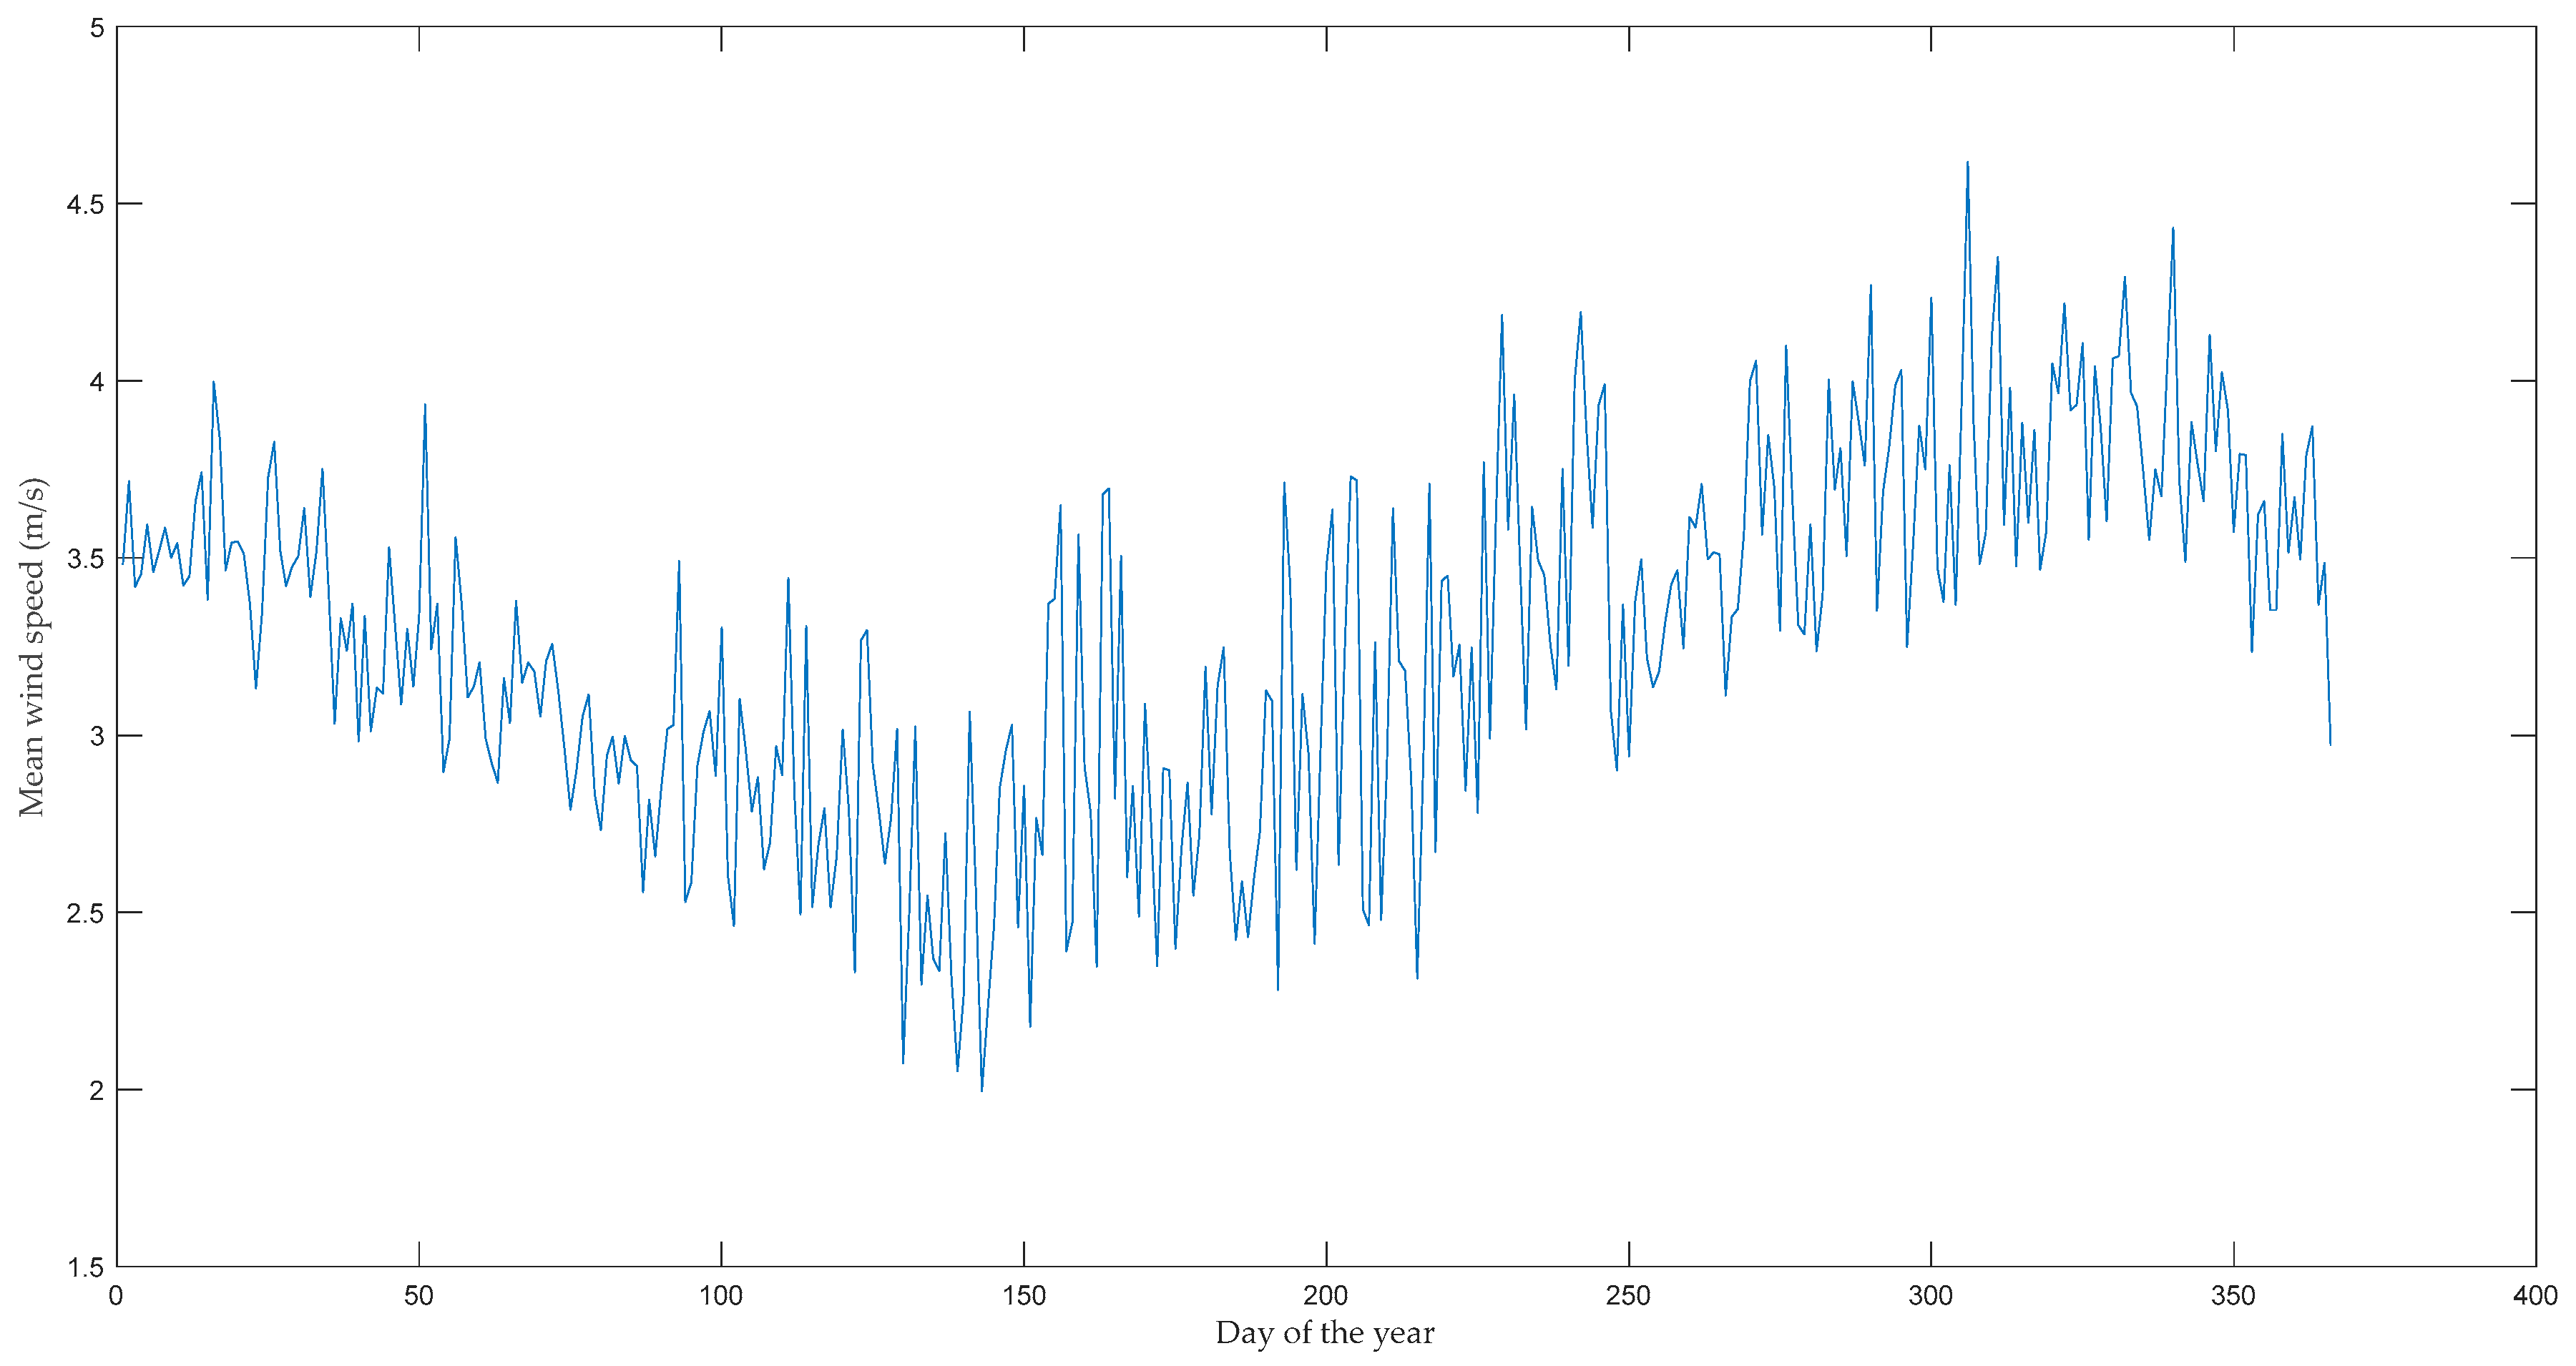
Section 2.3 provides the wind speed descriptive statistics. Section 2.4 summarises the modelled PDFs, methods for predicting the 2WPDF and 3WPDF parameters, and estimation methods for performance indicators. 
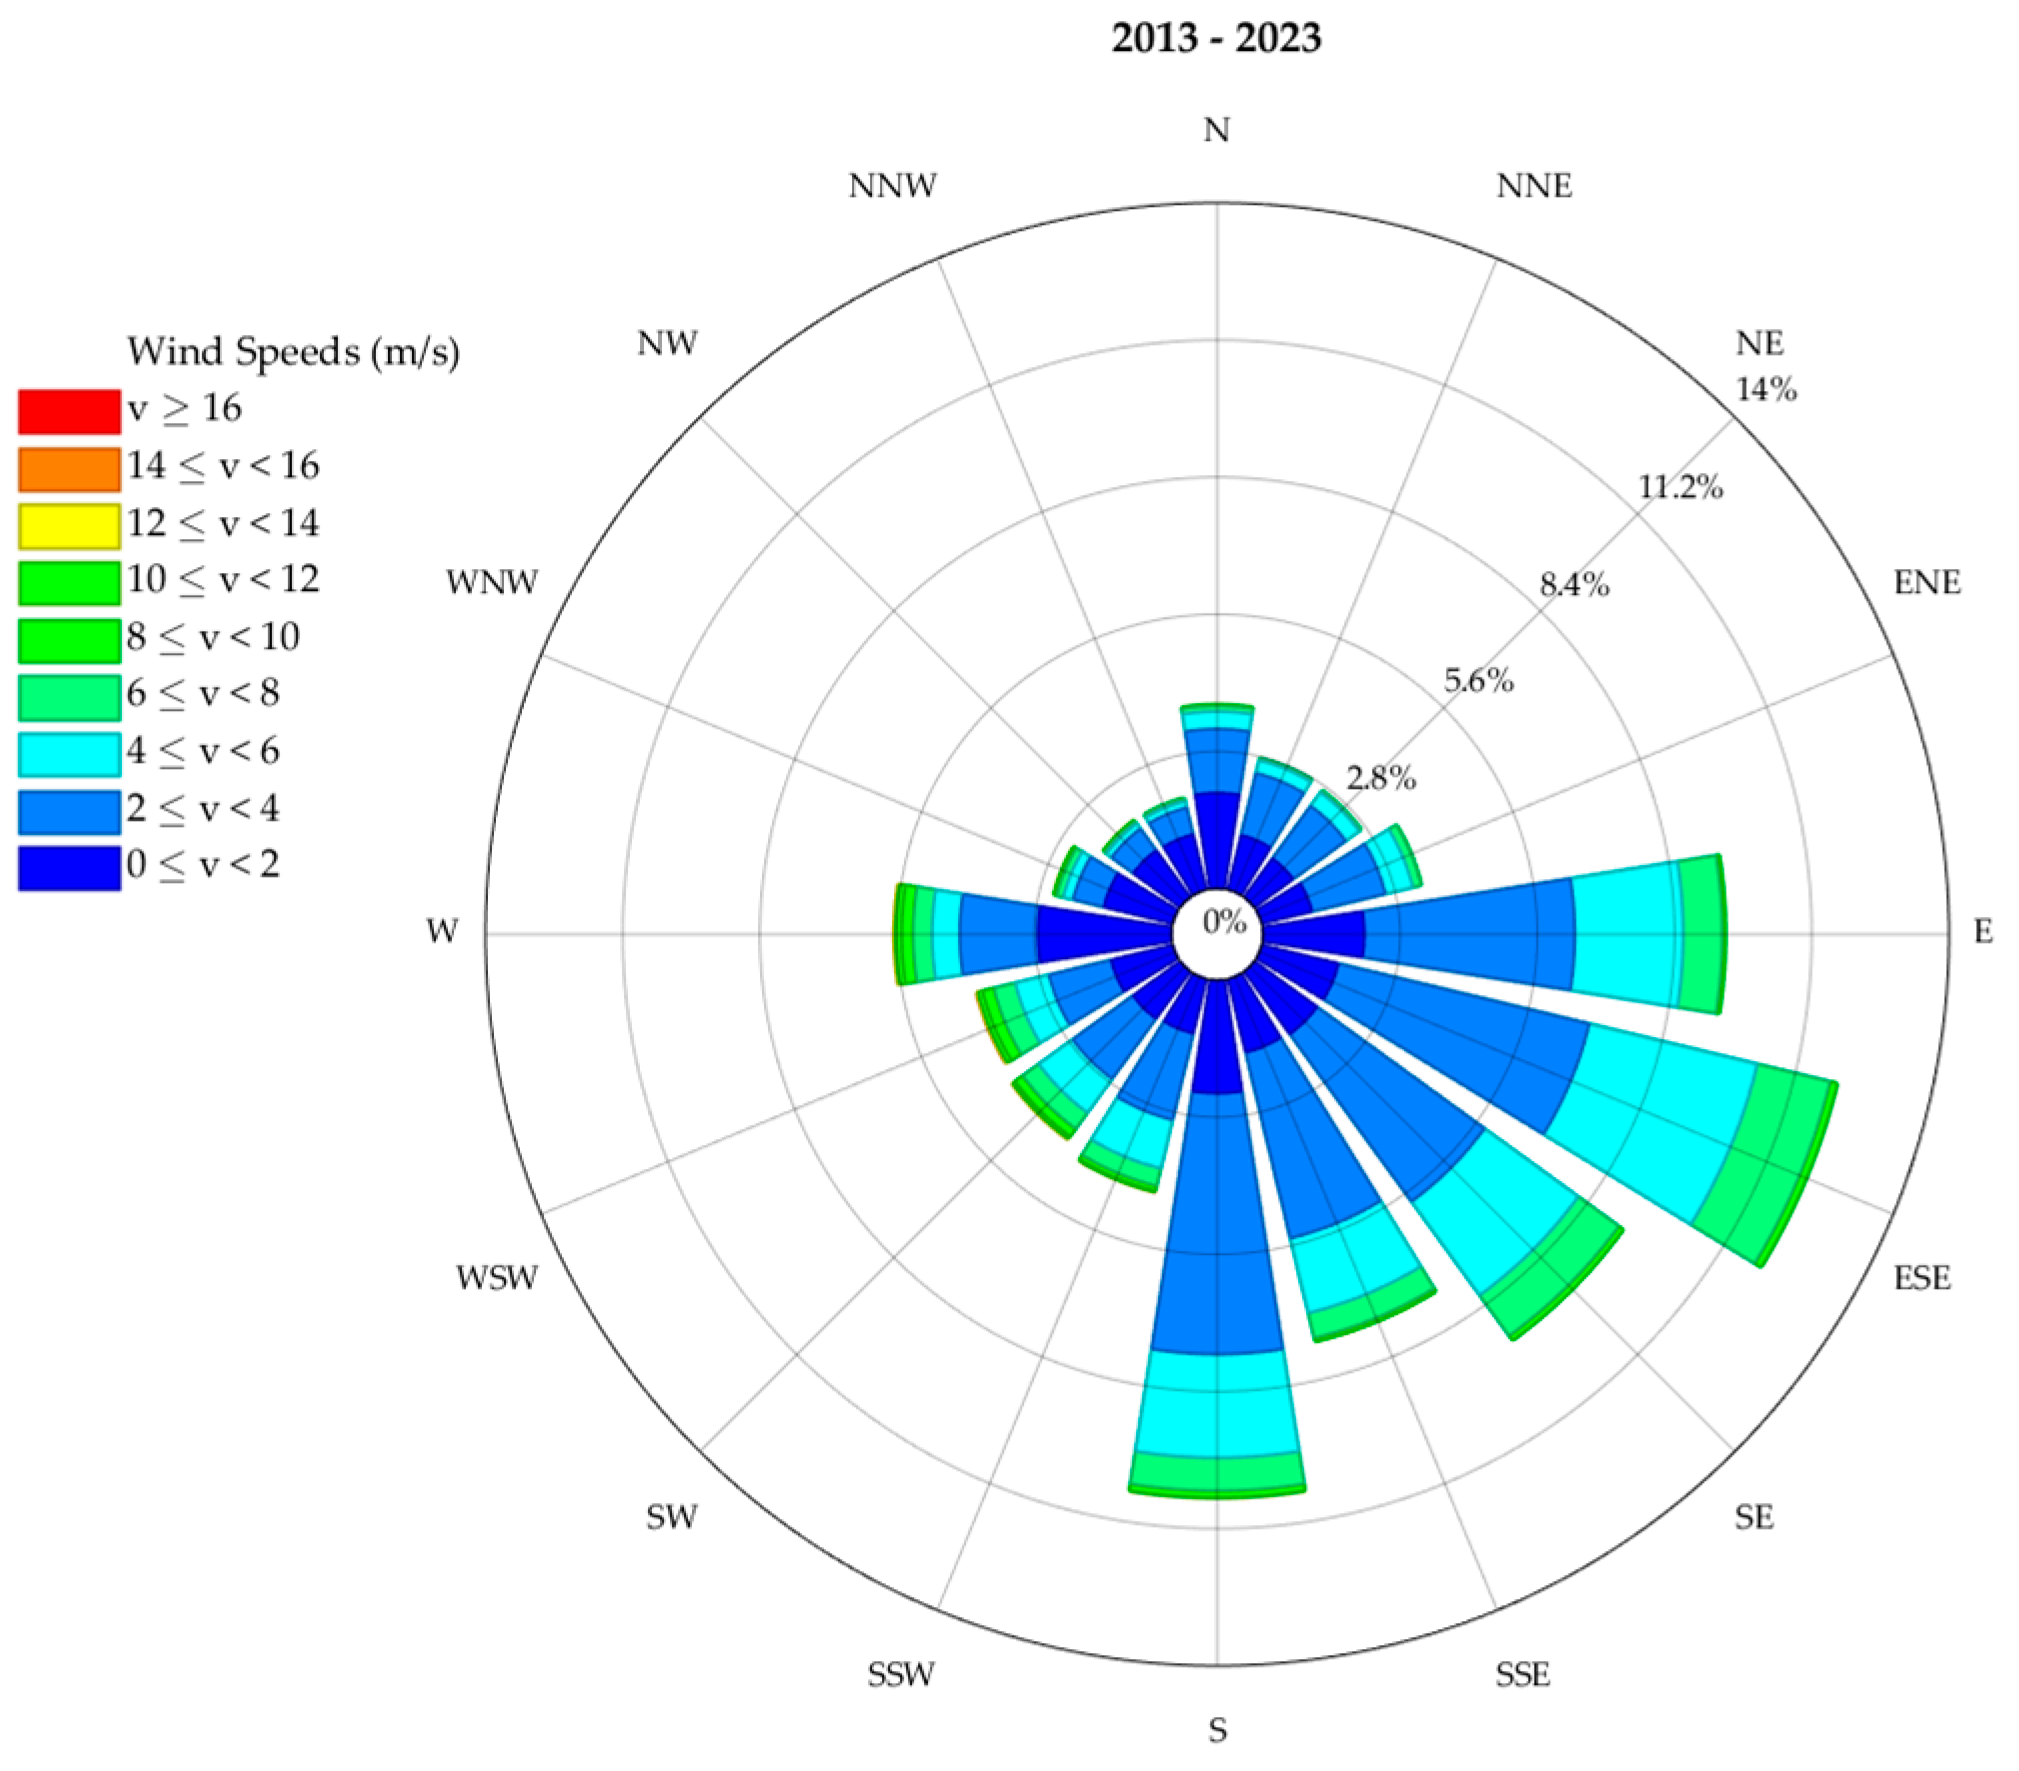
Section 3 describes and explains the results in terms of the descriptive statistics of the wind speed, the Weibull PDF, and the wind direction. Section 4 summarises the research findings and provides some recommendations on the use of wind energy in the Mthatha area.

2. Materials and Methods

2.1. Study Area Description

Mthatha, shown in Figure 1, with an area of 54.97 km2 with 538.30 households/km2, is the main city of the King Sabata Dalindyebo Local Municipality in the Eastern Cape Province of South Africa [19]. It is among the most disadvantaged areas in South Africa, experiencing continuous load shedding for over a decade [20].

2.2. Meteorological Data

For reliable wind resource estimates, long-term observations spanning over 3 decades are considered necessary. In the absence of such long-term data, shorter periods of approximately 10 years can be used to produce acceptable estimates [8]. For this study, hourly mean wind speed and direction data from January 2013 to 23 August 2023, measured at 10 m AGL, were provided by the South African Weather Services (SAWS). The data were recorded at Umthatha Wo Meteorological Station (at Lat: −31.5490, Lon: 28.6730) and an elevation of 745 m above sea level. The dataset of 93,288 entries contained 7307 h with no records, replaced by not a number (NAN) and removed before the analysis, which corresponded to 7.83% missing data. Using the hypothesis that the removal of data causes downward biases of annual energy production (AEP), the AEP downward bias was estimated to be approximately 3.35%, a value that remains within the range of data validity [21].

2.3. The Wind Speed Analysis

Wind Speed Statistics

The data were analysed for the whole period, monthly and yearly. Average wind speed ( v ¯ ) was determined from (1), and its standard deviation ( σ ) was calculated using (2). Here, v i is the wind speed measurement at hourly time step i , and N is the total number of hours with non-zero wind speed per period.
v ¯ = N 1 i = 1 N v i
σ = 1 / N 1 i = 1 N v i v ¯ 2
The most probable wind speed ( v m p ), which is the peak of a specific PDF, is the most frequent wind speed given by (3) for the WPDF [22].
v m p = c 1 1 / k 1 / k
where k is a dimensionless Weibull shape parameter depicting the dissymmetry, and c is the scale parameter with dimensions of wind speed.

2.4. Weibull Probability Density Function

The PDF ( f v ) provides an indication of the likelihood of finding wind of velocity ( v ) at a given site. The wind has a 2WPDF, and ( f v k , c ) is given by (4) [23] for k > 0 and c > 0 .
f v k , c = k / c v / c k 1 e x p v / c k
The frequency distribution becomes narrow with high values of k indicating low wind speed variation [24]. For k = 2 , (4) becomes the Rayleigh PDF [11]. The value of c is directly proportional to average wind. The associated cumulative (C) PDF ( F v ) provides the possibility of detecting a wind speed less or equal to v . For 2WPDF, ( F v k , c ) is given by (5).
F v k , c = 1 e x p v / c k
The F v for the 3WPDF, ( f v k , c , m ), is given by (6) [9]. The parameters k and c have the same meaning with 2WPDF, and m 0 is the location parameter, which defines the starting point of the WPDF curve. This provides the 3WPDF a superior estimation accuracy when compared with the 2WPDF. For c < 1 , the probability density of the WPDF approaches infinity as v approaches m .
f v k , c , m = k / c k v m k 1 e x p v m / c k
The corresponding F v k , c , m is calculated using (7).
F v k , c , m = 1 e x p v m / c k

2.4.1. Approximating the Weibull Parameters

Different methods are used to estimate WPDF parameters. The MLM is the most commonly used method due to its strong consistency and efficiency. However, some researchers argue that the Method of Moments (MOM) is an equally competent competitor to MLM, particularly in terms of asymptotic properties. For those reasons, both MLM and MOM equations listed in Table 1 have been utilised for estimating the Weibull parameters.

2.4.2. Performance Indicators

To assess efficiency (goodness-of-fit) of the MOM and MLM in estimating the Weibull parameters, different statistical indicators may be used. The aim of this assessment is to show the effectiveness of each WPDF model in fitting the measured wind data. In this study, the popularly used RMSE given in (8) was used [11].
R M S E = N 1 i = 1 N W P d W P D F . i W P d m d , i 0.5
where W P d m d , i is the wind power density calculated from the measured data, while W P d W P D F . i represents the wind power density predicted from the Weibull distribution.

2.5. Wind Energy Estimation

Wind power density ( W P d v ), which depends on the wind speed frequency distribution and the air density ( ρ ), was used as the performance indicator of wind resource potential and is calculated using (9) [1].
W P d v = 0.5 ρ v 3
The mean measured wind power density ( W P d m , m d v ) was calculated using (10).
W P d m . m d v = N 1 i = 1 N 0.5 ρ v i 3
W P d v is also calculated using WPDF parameters to provide Weibull wind power density ( W P d W P D F v ), and for the 2WPDF, (11) is used.
W P d 2 W P D F v = 0.5 ρ c 3 Γ 1 + 3 k 1
For the 3WPDF, (12) is used [25].
W P d 3 W P D F = 0.5 ρ k 1 e x p v m c 1 k k v 3 + 3 c m 2 Γ k 1 , v m c 1 k + 6 c 2 m Γ 2 k 1 , v m c 1 k + 3 c 2 Γ 3 k 1 , v m c 1 k

3. Results and Discussion

3.1. Statistical Analysis of the Wind Speed

Table 2 lists the wind monthly statistics for Mthatha in terms of the average wind speed ( v ¯ ); standard deviation ( σ ); coefficient of variance (CoV); minimum (min), median (med), and maximum (max) wind speeds; range; and kurtosis (kurt) and skewness (skw) of the measured wind speed for Mthatha. The area is dominated by low wind speed. The monthly v ¯ shown in Figure 2 varied from 2.6180 m/s in May to 3.8905 m/s in November. The σ varied between 1.4381 m/s in March and 2.1947 m/s in August. The CoV is an important indicator of the variation in wind at a particular site. According to [9] the wind speed at a site is highly variable if the CoV is between 40% and 70%. Mthatha winds are highly variable for all months, except for June, when the winds are extremely variable with a CoV of 71.4614%. The kurt is classified into three categories: normal kurtosis ( k u t = 3 ) for standard normal distribution, high kurtosis ( k u r t > 3 ), and low kurtosis ( k u r t < 3 ) [27]. For Mthatha, kurt ranges from 0.9017 (low kurtosis) in February to 10.6159 in April, with the rest of the months lying in the high kurtosis category. The wind speeds distribution has visible tails compared to a normally distributed wind speed. This implies that there are more extreme wind speeds, providing the distribution a “pointier” appearance. The positive skw shown by all the months means that the majority of the values of measured wind speed are greater than the average wind speed, therefore depicting a better wind performance at Mthatha [11].
The seasonal wind analysis, provided in Table 3, shows that the v ¯ varied from 2.8478 m/s in Autum to 3.6791 m/s in spring. The σ ranged from 1.5251 m/s in Autumn to 2.1210 m/s in Winter. The CoV was between 49.5716 in Summer and 67.3772 in Winter and showed that all the seasons have a highly variable wind speed. All the kurt values are above three, and thus, the wind speed distributions are in the high kurtosis region.
The daily v ¯ for the entire period under observation, provided in Figure 3, shows that the maximum daily average wind speed of 4.6184 m/s occurred on the 1st of November. This is also the month with the maximum monthly average wind speed. The wind speed statistics for the entire period, provided in Table 4, indicates that the v ¯ of 3.3009 m/s was observed in Mthatha with a CoV of 56.7342% and a skw of 1.2870, implying that the wind speed is highly variable and right skewed. The observed kurt of 4.9809 implies that wind speed distribution is of high kurtosis. The European Wind Energy Association (EWEA) classifies areas for the installation of large wind turbines according to the wind speed, such as fairly good (6.5 m/s), good (7.5 m/s), and very good (8.5 m/s) [17]. Thus, Mthatha area with the v ¯ of 3.3009 m/s is not suitable for the installation of large wind turbines. Similar results were found in other areas in the provinces of Upper Blinkwater ( v ¯ between 4.36 and 4.78 m/s at 11, 20, and 30 m AGL), Bisho, Fort Beaufort, Graaff-Reinet, Grahamstown, Port Elizabeth, and Queenstown (3.1–5.6 m/s at 10 m AGL) where the use of small-scale standalone wind projects was recommended [11,17]. This study also recommends small-scale standalone wind applications for the Mthatha area. Internationally, Puná Island’s v ¯ of 4.8 m/s was found to be marginally good for a wind turbine installation. Wind turbines with large rotor diameters of greater or equal to 100 m were recommended for electricity production.
Figure 4 shows the daily cycle of wind speed averaged over a single day. The average hourly wind speed curve forms a bell shape. The wind speeds are low during the night, with v ¯ ranging from 2.8148 m/s at 22:00 hours to 2.4434 m/s around 07:00 h. During the day, the wind speed increases sharply to attain mean wind speed values of greater than 3.500 m/s between 13:00 and 19:00 h. From the figure, it is deduced that the Mthatha area is windy from mid-morning to early evening.

3.2. Weibull Probability Density Function

The 2WPDF and the 3WPDF were used to fit the Mthatha SAWS wind speed data. The MOM estimated parameters kMOM2 and cMOM2 and kMOM3, cMOM3, and mMOM3 for the 2WPDF and the 3WPDF, respectively, and are listed in Table 5 for the entire period under observation and are categorised as per its seasons. Also listed are corresponding MLM estimated parameters kMLM2 and cMLM2 and kMLM3, cMLM3, and mMLM3 for the 2WPDF and the 3WPDF, respectively. The measured ( W P d m , m d ) and estimated wind power densities W P d 2 W P D F M O M , W P d 3 W P D F M O M , W P d 2 W P D F M L M , and W P d 3 W P D F M L M are provided for the MOM and MLM estimation methods. In both the estimation methods, the 3WPDF achieves superior results than the 2WPDF. The 3WPDF’s wind power density estimated using the MLM method is higher than the observed value. This could be due to an error in the parameter estimation. Further studies are recommended to investigate this anomaly. The W P d m , m d ranged from 0.0297 kW/m2 in Autumn to 0.0608 kW/m2 in Spring. This corresponds to the wind resource temporal distribution, which shows the lowest and the highest mean wind speeds during these seasons. The United States classifies wind resources as fair ( W P d < 0.1 kW/m2), moderate ( 0.1 W P d < 0.3 kW/m2), good ( 0.3 W P d < 0.7 kW/m2), and excellent ( W P d > 0.7 kW/m2) [28]. Also, the Battelle-Pacific Northwest Laboratory (Battelle-PNL) classifies areas according to their power density at 10 m above the ground, with class 1 ( W P d 0.1 kW/m2) being the lowest and class 7 ( W P d 1 kW/m2) being the highest [29]. The Mthatha area, with a W P d o f < 0.1 kW/m2 in all seasons, has a fairly good wind resource and is recommended for small-scale wind turbines in standalone applications. From the conducted wind resource assessments in the Eastern Cape Province, small wind turbines were rec-ommended for measured wind speeds of up to 30 m AGL [11,17,18,30]. More wind energy can be harnessed using wind turbines with large rotor diameters or by increasing the hub height.
The performance of the parameter estimation methodology was compared in terms of how well the 2WPDF and 3WPDF distributions matched the SAWS measured wind speed data using RMSE. The RMSE for the distributions is provided in Table 5. For the whole period and its seasons, all distributions have an RMSE close to 0, which shows that they are good. The MOM 3WPDF methods provided the best estimates in all cases. This agrees with the PDF fits shown in Figure 5 and Figure 6 for the whole period and its seasons, respectively.
From the cumulative probability density plots, for the whole observation period, 57. 5707% of the period had a wind speed of more than 3 m/s in Mthatha. In most cases, micro and small wind turbines have a cut-in wind speed of 3 m/s [2]. This implies that, for 57. 5707% of the observed time, some wind energy was produced in the Mthatha area.

3.3. Wind Direction for the Mthatha Area

The wind directions were analysed for the whole period and its seasons. The variation in the annual wind direction for the period from January 2013 to August 2023 is shown in Figure 7. The most prevailing direction is east–southeast (ESE) with a frequency of 12.0877%. For 36.5201% of the time, the wind speed was between 2 and 4 ms−1 in varying directions, while for 13.3845% of the time, null wind speed was observed. Only 0.0035% of the period had a wind speed of above 16 m/s, with 0.0011% in the south–southwest (SSW) direction and 0.0023% in the westerly (W) direction. The wind direction statistics are shown in Table 6 in terms of the period, most prevailing wind direction (MPWD), MPWD total frequency ( M P W D t f ), most frequent wind speed range (MFWSR), MFWSR frequency ( M F W S R f ) null wind frequency (NWF), lowest speed range (LSR), LSR frequency ( L S R f ), highest speed range (HSR), and HSR frequency ( H S R f ).
Seasonal wind directions are shown in Figure 8. Summer and spring have winds blowing from ESE, while Winter and Autumn have southerly and westerly winds, respec-tively. The frequency of the most prevailing wind direction ranges from 8.6034% in Winter to 15.5468% in Spring, and in all cases, the most prevailing wind speeds are less than 4 m/s.

4. Conclusions

South Africa’s Eastern Cape Province has the lowest household access to electricity, with 82.64% in 2018, and has experienced a prolonged load shedding for more than a decade. Grid extension in some remote areas of the province is hampered by the remoteness of certain areas and the lack of supportive infrastructure. Thus, there is a need to promote renewable energy technologies like wind to facilitate standalone and mini grid systems to alleviate load shedding and provide electricity to remote areas. This study investigated the wind potential for Mthatha, which is an important step in determining the country’s wind energy potential. The 2WPDF and 3WPDF were used for modelling the wind speed for the period from January 2013 to August 2023. The MLM and MOM were applied to obtain the Weibull parameters, and their performance for fitting the data was compared using the RMSE. It was established that the Mthatha area is dominated with low wind speeds, with an annual wind speed average of 3.3009 m/s. The probability of receiving wind speeds of above 3 m/s was found to be 57. 5707%. The area is not suitable for most wind turbines that are available on the wind energy market, which are designed for wind speeds of greater than 5 m/s [31,32]. It is recommended that wind speed augmentation mechanisms be employed in the area, if wind turbines are to be used for providing energy.

Author Contributions

Conceptualization, methodology, formal analysis, and writing—original draft preparation, C.S.; writing—review and editing, methodology, and formal analysis, N.S.; writing—review, editing, methodology, formal analysis, supervision, and funding acquisition, P.M. and G.M. All authors have read and agreed to the published version of the manuscript.

Funding

This research received no external funding. It received internal funding from Govan Mbeki Research and Development Centre (GMRDC).

Informed Consent Statement

Not applicable.

Data Availability Statement

Restrictions apply to the availability of these data. Data was obtained from the South African Weather Services (SAWS) and are available from the authors with the per-mission of SAWS.

Acknowledgments

The authors express their gratitude to SAWS for providing data for this re-search at no cost.

Conflicts of Interest

The authors declare no conflict of interest.

Abbreviations

PDFsProbability distribution functions2WPDFTwo-parameter Weibull PDF
3WPDFThree-parameter Weibull PDFAEPAnnual energy production
AGL Above ground levelCoV Coefficient of variance
EMJEmpirical Method of JustusEMLEmpirical Method of Lysen
IOA Index of Agreement kurtKurtosis
LSMLeast Squares Method MABEMean Absolute Bias Error
MAPE Mean Absolute Percentage ErrorMLMMaximum Likelihood Method
MMLMModified MLMMOM Method of Moments
NAN Not a number OWMOpenwind Method
PL Power Law RMSERoot Mean Square Error
RRMSRelative Root Mean Square SAWSSouth African Weather Services
SDMStandard Deviation Method skwSkewness
W P d m d , i Wind power density calculated from the measured data (W/m2)
W P d m , m d v Mean measured wind power density (W/m2)
W P d W P D F v Wind power density predicted from the WPDF (W/m2)

Nomenclature

c Weibull scale parameters (m/s) i Hourly time step
v ¯ Average wind speed (m/s) σ Standard deviation
v i Wind speed measurement (m/s) R2Coefficient of determination
k Dimensionless Weibull shape parameter RCorrelation Coefficient
v m p Most probable wind speed (m/s) F v Cumulative PDF
f v Likelihood of finding wind of velocity ( v ) m Location parameter
N Total number hours with non-zero wind speed per period

References

  1. Hopuare, M.; Manni, T.; Laurent, V.; Maamaatuaiahutapu, K. Investigating Wind Energy Potential in Tahiti, French Polynesia. Energies 2022, 15, 2090. [Google Scholar] [CrossRef]
  2. Pandeya, B.; Prajapati, B.; Khanal, A.; Regmi, B.; Shakya, S.R. Estimation of Wind Energy Potential and Comparison of Six Weibull Parameters Estimation Methods for Two Potential Locations in Nepal. Int. J. Energy Environ. Eng. 2022, 13, 955–966. [Google Scholar] [CrossRef]
  3. Pimenta, F.M.; Saavedra, O.R.; Oliveira, D.Q.; Assireu, A.T.; Torres Júnior, A.R.; de Freitas, R.M.; Neto, F.L.A.; Lopes, D.C.P.; Oliveira, C.B.M.; de Lima, S.L.; et al. Characterization of Wind Resources of the East Coast of Maranhão, Brazil. Energies 2023, 16, 5555. [Google Scholar] [CrossRef]
  4. Sedzro, K.S.A.; Salami, A.A.; Agbessi, P.A.; Kodjo, M.K. Comparative Study of Wind Energy Potential Estimation Methods for Wind Sites in Togo and Benin (West Sub-Saharan Africa). Energies 2022, 15, 8654. [Google Scholar] [CrossRef]
  5. Watson, S. Quantifying the Variability of Wind Energy. Wiley Interdiscip. Rev. Energy Environ. 2014, 3, 330–342. [Google Scholar] [CrossRef]
  6. Merizalde, Y.; Hernández-Callejo, L.; Bernal, J.G.; Martínez, E.T.; Duque-Perez, O.; Sánchez, F.; Estpopiñán, A.L. Wind Resource Assessment on Puná Island. Appl. Sci. 2019, 9, 2923. [Google Scholar] [CrossRef]
  7. Integrated National Electrification Programme. Available online: https://www.energy.gov.za/files/inep/inep_overview.html (accessed on 10 September 2023).
  8. Manwell, J.F.; McGowan, J.G.; Rogers, A.L. Wind Energy Explained: Theory, Design and Application, 2nd ed.; John Wiley & Sons Ltd.: West Sussex, UK, 2010; pp. 23–91. [Google Scholar]
  9. Pobočíková, I.; Michalková, M.; Sedliačková, Z.; Jurášová, D. Modelling the Wind Speed Using Exponentiated Weibull Distribution: Case Study of Poprad-Tatry, Slovakia. Appl. Sci. 2023, 13, 4031. [Google Scholar] [CrossRef]
  10. Al-Quraan, A.; Al-Mhairat, B.; Malkawi, A.M.A.; Radaideh, A.; Al-Masri, H.M.K. Optimal Prediction of Wind Energy Resources Based on WOA—A Case Study in Jordan. Sustainability 2023, 15, 3927. [Google Scholar] [CrossRef]
  11. Shambira, N.; Makaka, G.; Mukumba, P.; Lesala, M.; Roro, K.; Julies, J.; Tazvinga, H. Wind Resource Assessment in the Upper Blinkwater Area in the Province of Eastern Cape, South Africa. Int. J. Eng. Res. Technol. (IJERT) 2020, 9, 387–402. [Google Scholar]
  12. Wais, P. Two and Three-Parameter Weibull Distribution in Available Wind Power Analysis. Renew. Energy 2017, 103, 15–29. [Google Scholar] [CrossRef]
  13. Yaniktepe, B.; Kara, O.; Aladag, I.; Ozturk, C. Comparison of Eight Methods of Weibull Distribution for Determining the Best-Fit Distribution Parameters with Wind Data Measured from the Met-Mast. Environ. Sci. Pollut. Res. 2023, 30, 9576–9590. [Google Scholar] [CrossRef] [PubMed]
  14. Bingöl, F. Comparison of Weibull Estimation Methods for Diverse Winds. Adv. Meteorol. 2020, 2020, 3638423. [Google Scholar] [CrossRef]
  15. Solyali, D.; Altunç, M.; Tolun, S.; Aslan, Z. Wind Resource Assessment of Northern Cyprus. Renew. Sustain. Energy Rev. 2016, 55, 180–187. [Google Scholar] [CrossRef]
  16. Khahro, S.F.; Soomro, A.M.; Tabbassum, K.; Dong, L.; Liao, X. Assessment of Wind Power Potential at Hawksbay, Karachi Sindh, Pakistan. TELKOMNIKA Indones. J. Electr. Eng. 2013, 11, 3479–3490. [Google Scholar] [CrossRef]
  17. Shonhiwa, C.; Makaka, G.; Munjeri, K. Estimation of Wind Power Potential of Six Sites in Eastern Cape Province of South Africa. Phys. Sci. Int. J. 2015, 6, 209–218. [Google Scholar] [CrossRef]
  18. Tshimbiluni, H.C.; Tabakov, P.Y. Wind Energy Potential for Small-Scale WEC Systems in Port Elizabeth. In IOP Conference Series: Earth and Environmental Science; IOP Publishing: Bristol, UK, 2019. [Google Scholar]
  19. Mthatha. Available online: https://census2011.adrianfrith.com/place/294040 (accessed on 10 September 2023).
  20. Mthatha in Dire Straits. Available online: https://mg.co.za/article/2006-10-25-mthatha-in-dire-straits/ (accessed on 10 September 2023).
  21. Coville, A.; Siddiqui, A.; Vogstad, K.O. The Effect of Missing Data on Wind Resource Estimation. Energy 2011, 36, 4505–4517. [Google Scholar] [CrossRef]
  22. Jamil, M.; Parsa, S.; Majidi, M. Wind Power Statistics and an Evaluation of Wind Energy Density. Renew. Energy 1995, 6, 623–628. [Google Scholar] [CrossRef]
  23. Chang, T.P. Estimation of Wind Energy Potential Using Different Probability Density Functions. Appl. Energy 2011, 88, 1848–1856. [Google Scholar] [CrossRef]
  24. Oyedepo, S.O.; Adaramola, M.S.; Paul, S.S. Analysis of Wind Speed Data and Wind Energy Potential in Three Selected Locations in South-East Nigeria. Int. J. Energy Environ. Eng. 2012, 3, 7. [Google Scholar] [CrossRef]
  25. Wang, W.; Chen, K.; Bai, Y.; Chen, Y.; Wang, J. New Estimation Method of Wind Power Density with Three-Parameter Weibull Distribution: A Case on Central Inner Mongolia Suburbs. Wind Energy 2022, 25, 368–386. [Google Scholar] [CrossRef]
  26. Miller, J. CUPID: A MATLAB Toolbox for Computations with Univariate Probability Distributions. 2022. Available online: https://github.com/milleratotago/Cupid. (accessed on 1 September 2023).
  27. Kallner, A. Formulas. In Laboratory Statistics, 2nd ed.; Kallner, A., Ed.; Elsevier: Amsterdam, The Netherlands, 2018; pp. 1–140. [Google Scholar]
  28. Dabar, O.A.; Awaleh, M.O.; Waberi, M.M.; Adan, A.B.I. Wind Resource Assessment and Techno-Economic Analysis of Wind Energy and Green Hydrogen Production in the Republic of Djibouti. Energy Rep. 2022, 8, 8996–9016. [Google Scholar] [CrossRef]
  29. Ilinca, A.; McCarthy, E.; Chaumel, J.L.; Rétiveau, J.L. Wind Potential Assessment of Quebec Province. Renew. Energy 2003, 28, 1881–1897. [Google Scholar] [CrossRef]
  30. Manyeredzi, T.; Makaka, G. An Assessment of the Wind Power Generation Potential of Built Environment Wind Turbine (BEWT) Systems in Fort Beaufort, South Africa. Sustainability 2018, 10, 1346. [Google Scholar] [CrossRef]
  31. Shonhiwa, C.; Makaka, G. Concentrator Augmented Wind Turbines: A Review. Renew. Sustain. Energy Rev. 2016, 59, 1415–1418. [Google Scholar] [CrossRef]
  32. Taghinezhad, J.; Masdari, M.; Alimardani, R.; Mosazadeh, H. Ducted Wind Turbines A Review. Int. J. Future Revolut. Comput. Sci. Commun. Eng. 2019, 5, 19–25. [Google Scholar]
Figure 1. Mthatha area.
Applsci 13 12237 g001
Figure 2. Monthly average speed variation for Mthatha at 10 m AGL.
Applsci 13 12237 g002
Figure 3. Average daily wind speed for the entire period at 10 m AGL.
Applsci 13 12237 g003
Figure 4. Diurnal wind speed variation for Mthatha at 10 m AGL.
Applsci 13 12237 g004
Figure 5. WPDFs superimposed on to the measured data histogram for the period of 2013–2023.
Applsci 13 12237 g005
Figure 6. WPDFs superimposed on to the measured data histogram for the four seasons of the year.
Applsci 13 12237 g006
Figure 7. Yearly wind directions for the Mthatha area for 2013–2023.
Applsci 13 12237 g007
Figure 8. Seasonal wind directions for the Mthatha area for 2013–2023.
Applsci 13 12237 g008
Table 1. Methods for estimating Weibull parameters.
ParameterMLMMOM
k 2 W P D F 1 / i = 1 N v i k l n v i / i = 1 N v i k i = 1 N l n v i / N [4,16] 0.9874 / σ / v ¯ 1.0983 [2]
c 2 W P D F N 1 i = 1 N v i k k 1 [4,16] v ¯ / Γ 1 + k 1 [2]
k 3 W P D F
c 3 W P D F
m 3 W P D F
N k / c + k / c k + 1 i = 1 N v i m k = 0
N / k + i = 1 N l n v i m / c k l n v i m / c = 0
[25] m y d i s t . E s t M o m O b s M o m , P a r m C o d e s [26]
Table 2. The monthly statistical wind data for Mthatha at 10 m AGL.
Month v ¯ σ CoVminMedMaxRangekurtskw
January3.54151.734548.97670.20003.200011.900011.70003.20030.8211
February3.28061.631349.72420.10002.900011.200011.10000.90173.3300
March2.98131.438148.23570.80002.600010.50009.70003.50420.9787
April2.88491.602255.53850.30002.500016.900016.600010.61591.9939
May2.61801.532858.55000.30002.100011.600011.30006.77591.7463
June2.91282.081571.46140.10002.100014.100014.00006.71101.8630
July3.09462.044266.05560.10002.400013.700013.60006.86571.7737
August3.38882.194764.76410.50002.700013.900013.40005.12791.4804
September3.46711.952156.30230.70003.000014.500013.80005.04221.2771
October3.68831.923652.15340.20003.300013.000012.80003.20500.8439
November3.89051.968150.58650.80003.500017.200016.40003.55910.8489
December3.70441.823349.22120.60003.300011.700011.10003.13650.7777
Table 3. The seasonal wind characteristics at 10 m AGL.
Season v ¯ σ CoVMinMedMaxRangekurtskw
Summer3.50711.738549.57160.10003.100011.900011.80003.25220.8432
Autumn2.84781.525153.55200.30002.400016.900016.60007.04651.5439
Winter3.14802.121067.37720.10002.400014.1000 14.00006.03521.6736
Spring3.67911.954453.12100.20003.20017.200017.00003.86230.9798
Table 4. The wind speed statistics for the period from January 2013 to August 2023 at 10 m AGL.
v ¯ σ CoVMinMedMaxRangekurtskw
3.30091.872756.73420.10002.800017.200017.70004.98091.2870
Table 5. Estimated Weibull parameters and wind power density for the whole period and its seasons at 10 m AGL.
Parameter2013–2023SummerAutumnWinterSpring
kMOM21.83782.13151.95811.52161.9756
cMOM2 (m/s)3.71533.96003.21203.49304.1504
kMOM31.33801.72431.18831.12641.5829
cMOM3 (m/s)2.70063.26291.91432.49003.3698
mMOM30.82040.59851.04250.76350.6548
kMLM21.89772.00242.00241.63672.0160
cMLM2 (m/s)3.74393.23143.23143.55224.17368
kMLM31.84131.80561.80561.58651.9032
cMLM3 (m/s)3.62762.88582.88583.43073.9427
mMLM30.09950.09890.29930.09920.1993
W P d m , m d (W/m2)48.478548.611429.669554.910460.8032
W P d 2 W P D F M O M (W/m2)46.023847.190425.662243.936456.9828
W P d 3 W P D F M O M (W/m2)47.380447.479527.603550.867758.9828
W P d 2 W P D F M L M (W/m2)45.298547.528527.438547.332558.7037
W P d 3 W P D F M L M (W/m2)53.769052.969031.863551.893570.2944
RMSEMOM20.02450.01130.04000.10970.0346
RMSEMOM30.01100.01230.02070.04040.0182
RMSEMLM20.03180.01080.02230.07580.0201
RMSEMLM30.05290.06280.02190.03020.0949
Table 6. Wind direction statistics of Mthatha for the whole period and its seasons.
PeriodMPWD M P W D t f MFWSR M F W S R f NWFLSR L S R f HSR H S R f
WholeESE12.0877 2 v ¯ < 4 36.520113.3845 0 v ¯ < 2 24.3440 v ¯ 16 0.0035
SummerESE16.4171 1.25 v ¯ < 2.5 29.25315.2035 0 v ¯ < 1.25 3.0290 v ¯ 10 0.1392
AutumS9.3503 2 v ¯ < 4 33.827424.9341 0 v ¯ < 2 25.8152 v ¯ 16 0.0082
WinterW8.6034 1.25 v ¯ < 2.5 30.317528.0764 0 v ¯ < 1.25 6.6694 v ¯ 10 1.1164
SpringESE15.5468 2 v ¯ < 4 38.84777.7734 0 v ¯ < 2 19.0605 v ¯ 16 0.0048
Disclaimer/Publisher’s Note: The statements, opinions and data contained in all publications are solely those of the individual author(s) and contributor(s) and not of MDPI and/or the editor(s). MDPI and/or the editor(s) disclaim responsibility for any injury to people or property resulting from any ideas, methods, instructions or products referred to in the content.

