Article

Numerical Investigation of the Evolving Inelastic Deformation Path of a Solder Ball Joint under Various Loading Conditions

1
School of Mechanical Engineering, Sungkyunkwan University, Suwon 16419, Gyeonggi-do, Republic of Korea
2
Department of Smart Fabrication Technology, Sungkyunkwan University, Suwon 16419, Gyeonggi-do, Republic of Korea
3
Department of Intelligent Robotics, Sungkyunkwan University, Suwon 16419, Gyeonggi-do, Republic of Korea
*
Author to whom correspondence should be addressed.
These authors contributed equally to this work.
Appl. Sci. 2023, 13(22), 12137; https://doi.org/10.3390/app132212137
Submission received: 26 September 2023 / Revised: 3 November 2023 / Accepted: 6 November 2023 / Published: 8 November 2023

Abstract

:
Solder joints of ball grid arrays (BGA) have been widely used to connect electronic components to printed circuit boards (PCBs) and are often subjected to mechanical stress. Several studies have been conducted on the mechanical reliability of solder joints. While these studies have been useful in the industry, detailed studies on how the inelastic deformation path of the solder ball joints evolves under specific loading conditions have not been sufficiently reported. This study aims to understand how the inelastic deformation path evolves when a solder joint is subjected to a constant external force by utilizing the theory of mechanics. It has also been found that the mechanical failure is strongly influenced by the evolution history of the deformation modes in materials. For this study, an elastoplastic constitutive model and a ductile fracture criterion were implemented into the vectorized user-defined material (VUMAT) subroutine of the ABAQUS program for finite element (FE) analysis. With the model, the evolution of the inelastic deformation path of a single solder ball under different loading conditions was numerically analyzed. Three loadings (shear, compression, and bending) were chosen as the basic loading conditions. In addition, combinations of the basic loadings resulted in three dual loadings and one complex loading. The simulation results showed that the shear and bending caused the fracture for both single and dual loadings, but when combined with compression, the fracture was suppressed. The results indicate that fracture is not solely determined by the magnitude of equivalent plastic strain but also by the evolution of inelastic deformation mode. This research offers an improved understanding of the significance of the inelastic deformation path and fracture.

1. Introduction

With the increasing demand for high-performance electronic devices, the semiconductor industry is undergoing a process of densification and performance improvement. In this context, Ball Grid Array (BGA) packaging has gained popularity in modern electronics owing to its several advantages, such as high pin density, smaller size, and improved thermal performance. However, concerns have been raised about the mechanical reliability of BGA packages, specifically in relation to the solder balls that connect the package to a printed circuit board (PCB). Solder balls play a critical role in the BGA package, and the failure of these solder joints can negatively affect the reliability of the entire electronic system. Analyzing the inelastic deformation and fracture mechanism of a specific target product can make the optimization of its design much more manageable [1,2,3]. Therefore, it is essential to gain a thorough understanding of the mechanical reliability of the BGA packages and the solder ball connections to ensure the long-term functionality and reliability of electronic systems.
The mechanical failure of solder balls can occur during various processes and conditions, such as reflow processing and thermal cycling testing throughout the life cycle of an integrated circuit (IC) package module. Several studies have investigated the failure mechanisms of solder joints under various conditions. For instance, Yu et al. [4] explored the failure position of solder in a BGA-type system in package (SiP) under thermal cycling, highlighting the dominance of creep strain over plastic strain and the shift in the failure position from the center to the corner of the BGA. Gao et al. [5] investigated the failure mechanism of SnAgCu/SnPb mixed solders during the manufacturing process and identified two failure modes: intermetallic compound (IMC) cracks and shrinkage within the solder matrix and near the IMC layer. Surendar et al. [6] studied the interaction between thermal cycling and drop impact conditions, revealing that drop impact during thermal cycling accelerates solder joint failure owing to the increased accumulated creep strain. The strain-to-fracture ratio decreased with an increasing number of drop impacts. Pang et al. [7] emphasized that thermal effects, from the solder manufacturing process to assembly tests such as thermal cycling, play a critical role in the microvoid behavior, leading to crack propagation. Reliability prediction methods for solder joints have been proposed based on creep, fatigue, and drop impact analyses at both the package and board levels. Che and Pang [8] performed thermal cycling tests and predicted the life cycle of fine-pitch BGA (fBGA) packages using elastoplastic creep (EPC) models. Kim et al. [9] conducted the machine learning analysis to investigate the effect of the design pattern of the package substrate on the thermal properties that can effect deformation. Qin et al. [10] investigated the geometrical effects of individual solder joint models under the shear loading. Parametric modeling and lab-scale experiments on rectangular single solders were conducted by Shen et al. [11] and Chawla et al. [12], respectively.
These studies mainly focused on the failure of solder joints based on the in-plane shear stress resulting from the coefficient of thermal expansion (CTE) mismatch between the layers. Failure can occur in various deformation modes, including shear, owing to the interaction of internal microvoids caused by externally applied loads. Several theories have been proposed to explain the void nucleation, growth, and coalescence processes leading to crack initiation and propagation. Furthermore, in the case of inelastic deformation or failure of materials, it is crucial to clearly define the history of the inelastic deformation path. However, previous studies have extensively examined the solder ball analysis, and most of them have focused on analyzing the effects of the entire PCB. Consequently, analyzing the precise evolution of the inelastic deformation path in a single solder ball will offer insights into the quantitative impact of external forces.
Mechanical theories of plasticity and ductile fracture criteria can provide valuable insights into structure deformation and failure predictions. Solder joint failures occur through various deformation modes, such as shear, owing to the interaction between internal microvoids and external loads. Damage models involving the nucleation, growth, and coalescence of voids affected by pressure and Lode parameters have been introduced to simulate the ductile fracture [13,14,15,16,17]. Coalescence, driven by the maximum shear stress, further contributes to fracture. Recent studies by Bao and Wierzbicki introduced a fracture strain definition based on stress triaxiality and validated it experimentally [18]. Subsequently, Bao et al. calibrated their results using multiple fracture models [19]. Hora proposed a modified maximum force criterion (MMFC) to account for rupture and localized necking [20], whereas Lou et al. and Park et al. presented a ductile fracture criterion considering microvoid interactions during plastic deformation [21,22]. Shim and Lee presented an effective stress-based fracture limit model [23]. Kim et al. presented a fracture modeling considering thermal softening [24], and Olofsson proposed a fracture technique for the heterogeneous distribution of subscale features based on the strain energy density [25]. Starvin et al. recently addressed the calibration of the fracture parameters with respect to the initial crack size and external loads under fatigue fracture situations [26]. These fracture mechanics models can provide a comprehensive understanding of the solder deformation and therefore fracture under mechanical loadings.
This work aims to investigate the evolution of the inelastic deformation path of solder joints under external force conditions through numerical simulations. The motivation for this research stems from the fact that many studies have discussed the occurrence of failure in solder joints when the maximum stress exceeds a critical value [27,28]. However, there has been little discussion on how the stress varies significantly during the occurrence of inelastic deformation due to the change in the deformation path. Additionally, several studies have relied solely on the elastic properties during the stress calculation process. In addition, this study demonstrates that the inelastic deformation path varies depending on the combination of external loading conditions and has a significant influence on the occurrence of fracture. The external force conditions in this study are based on the fundamental modes of shear, compression, and bending, as well as their combinations. These conditions are categorized into seven different cases. This is intended for a fundamental understanding of the impact of external forces on solder from the mechanism perspective, as opposed to the emphasis on the application perspective in previous papers. The solder joints have crystal structures, and their inelastic deformation is governed by slip systems that depend on these crystal structures. In crystal plasticity (CP) modeling [29], the slip rate is correlated with the dislocation density. In addition, each grain, distinguished by grain boundaries, operates on slip systems independently, allowing for a closer simulation of the slip system behavior. However, this approach requires the calibration of numerous modeling parameters. An alternative approach is through dislocation dynamics (DD) [30], which also simulates inelastic deformation through the behavior of the dislocations themselves. In the case of DD, it can better predict the interactions such as grain boundary and dislocation. At present, it is feasible to simulate submicron scales such as those of a single crystal or bicrystal structure. Therefore, this paper utilizes continuum-level plasticity theory to study the evolution of inelastic deformation in an entire solder structure under external forces.
In this numerical simulation, the study used the associated flow rule based on the J2 flow rule to calculate the inelastic flow and implemented an effective ductile fracture model to determine the fracture limit in the Lagrangian framework. Because the J2 flow rule and ductile fracture criterion have been extensively validated in the previously mentioned papers [17,18,19], recently, while effective metal plasticity models based on Eulerian formulation [31,32] have been developed, this paper employed the Lagrangian theory for more general discussion and simplicity. The models were implemented in the vectorized user-defined material (VUMAT) subroutine of the ABAQUS 2020 program for finite element (FE) analysis. FE simulations were performed for seven different cases, including single loading scenarios for each type, dual loading scenarios, and a complex loading scenario. The results showed that the occurrence of fracture in the solder ball was not solely determined by the magnitude of equivalent plastic strain; rather, it was significantly affected by the evolution of the inelastic deformation modes. Moreover, they illustrate that changing the combination of loading conditions can result in substantial changes in inelastic deformation modes. These discoveries help us to understand how inelastic deformation modes evolve within solder ball joints and hold promise for future research applications.
The structure of this paper is organized as follows: Section 2 summarizes the numerical model, and Section 3 describes the FE model. Section 4 presents the results and discussion. Finally, Section 5 provides the conclusions.

2. Numerical Models

In the Euclidean space, the position vector x and its time derivative define the velocity as follows:
v = x ˙ .
The velocity gradient L , rate of deformation D , and rate of spin W are then defined as
L = g r a d v .
L = D + W ,   D = 1 2 L + L T ,   and   W = 1 2 L L T .
They can be separated into elastic and plastic parts as
L = L e + L p ,   D = D e + D p ,   and   W = W e + W p .
The superscripts ‘ e ’ and ‘ p ’ denote the elastic and plastic parts, respectively.
The deformation gradient tensor F is also defined as [33,34]
F = R U = F e F p ,
F ˙ = L F ,
F e and F p represent the elastic and plastic parts of F , respectively. R and U are rotational and stretch tensors, respectively. The three deformation gradient tensors define each dilatancy as
J = d e t ( F ) .
J e = d e t ( F e ) .
J p = d e t F p = 1 .
Note that the elastic dilatancy J e is the same as the total dilatancy J , because of the isochoric condition of plasticity, as shown in Equation (9). In addition, F and F e define strain tensors as follows:
E = 1 2 F T F I ,
E e = 1 2 F e T F e I ,
E p = E E e .
E is the Green–Lagrangian strain tensor. E e and E p are the elastic and plastic parts in E . I is the identity matrix. The Cauchy stress tensor T is now defined in this study as
T = 1 J e [ F e ψ ¯ E e F e T ]   and   T = T T .
ψ ¯ = 1 2 K [ t r ( E e ) ] 2 + μ [ t r ( E e 2 ) ] ,
E e = E e 1 3 t r ( E e ) I .
Next, to define the plastic flow, the dissipation inequality should be considered as [31,32,33]
ξ = T : D p 0 .
The flow rule defines the rate of plastic strain [35],
D p = σ ¯ T Γ ,
where σ ¯ is a plastic potential function, and Γ is the plastic multiplier. σ ¯ T and Γ control the direction and magnitude of plastic flow, respectively. Based on J 2 associated flow rule, this work defines the equivalent stress as
σ ¯ = 3 J 2 ,   where
J 2 = 1 2 ( S 11 2 + S 22 2 + S 33 2 + 2 S 12 2 + 2 S 13 2 + 2 S 23 2 ) .
S i j represents the components of the deviatoric stress, given by
S i j = T 1 3 t r T I : ( e i e j )
e i denotes the basis vectors of the Euclidean space. The yield condition is then specified as
f = σ ¯ σ h ,   where
σ h = A + B ε ¯ p n .
σ h is the hardening stress. A and B are material constants, and n is the exponent value for hardening. Solving Equations (17), (21), and (22) simultaneously provides the value of Γ . Since the numerical method to solve Γ has been explained in many works [36], this study does not repeat it. By substituting Equations (17–19) into (16), it can be easily shown that the dissipation equality condition (16) is always satisfied in this model.
Next, the ductile fracture criterion should be considered. As discussed in [21,22], the ductile fracture can be modeled as
d ˙ = V × ˙ D ,
where d ˙ represents the rate of damage, V is driven by pressure, and D is related to plastic strain. In this study, V and D are specified as
V = 1 / D 1 + D 2 exp D 3 η ,
D = ε ¯ p ,
D 1   ~   D 3 are model parameters. η 
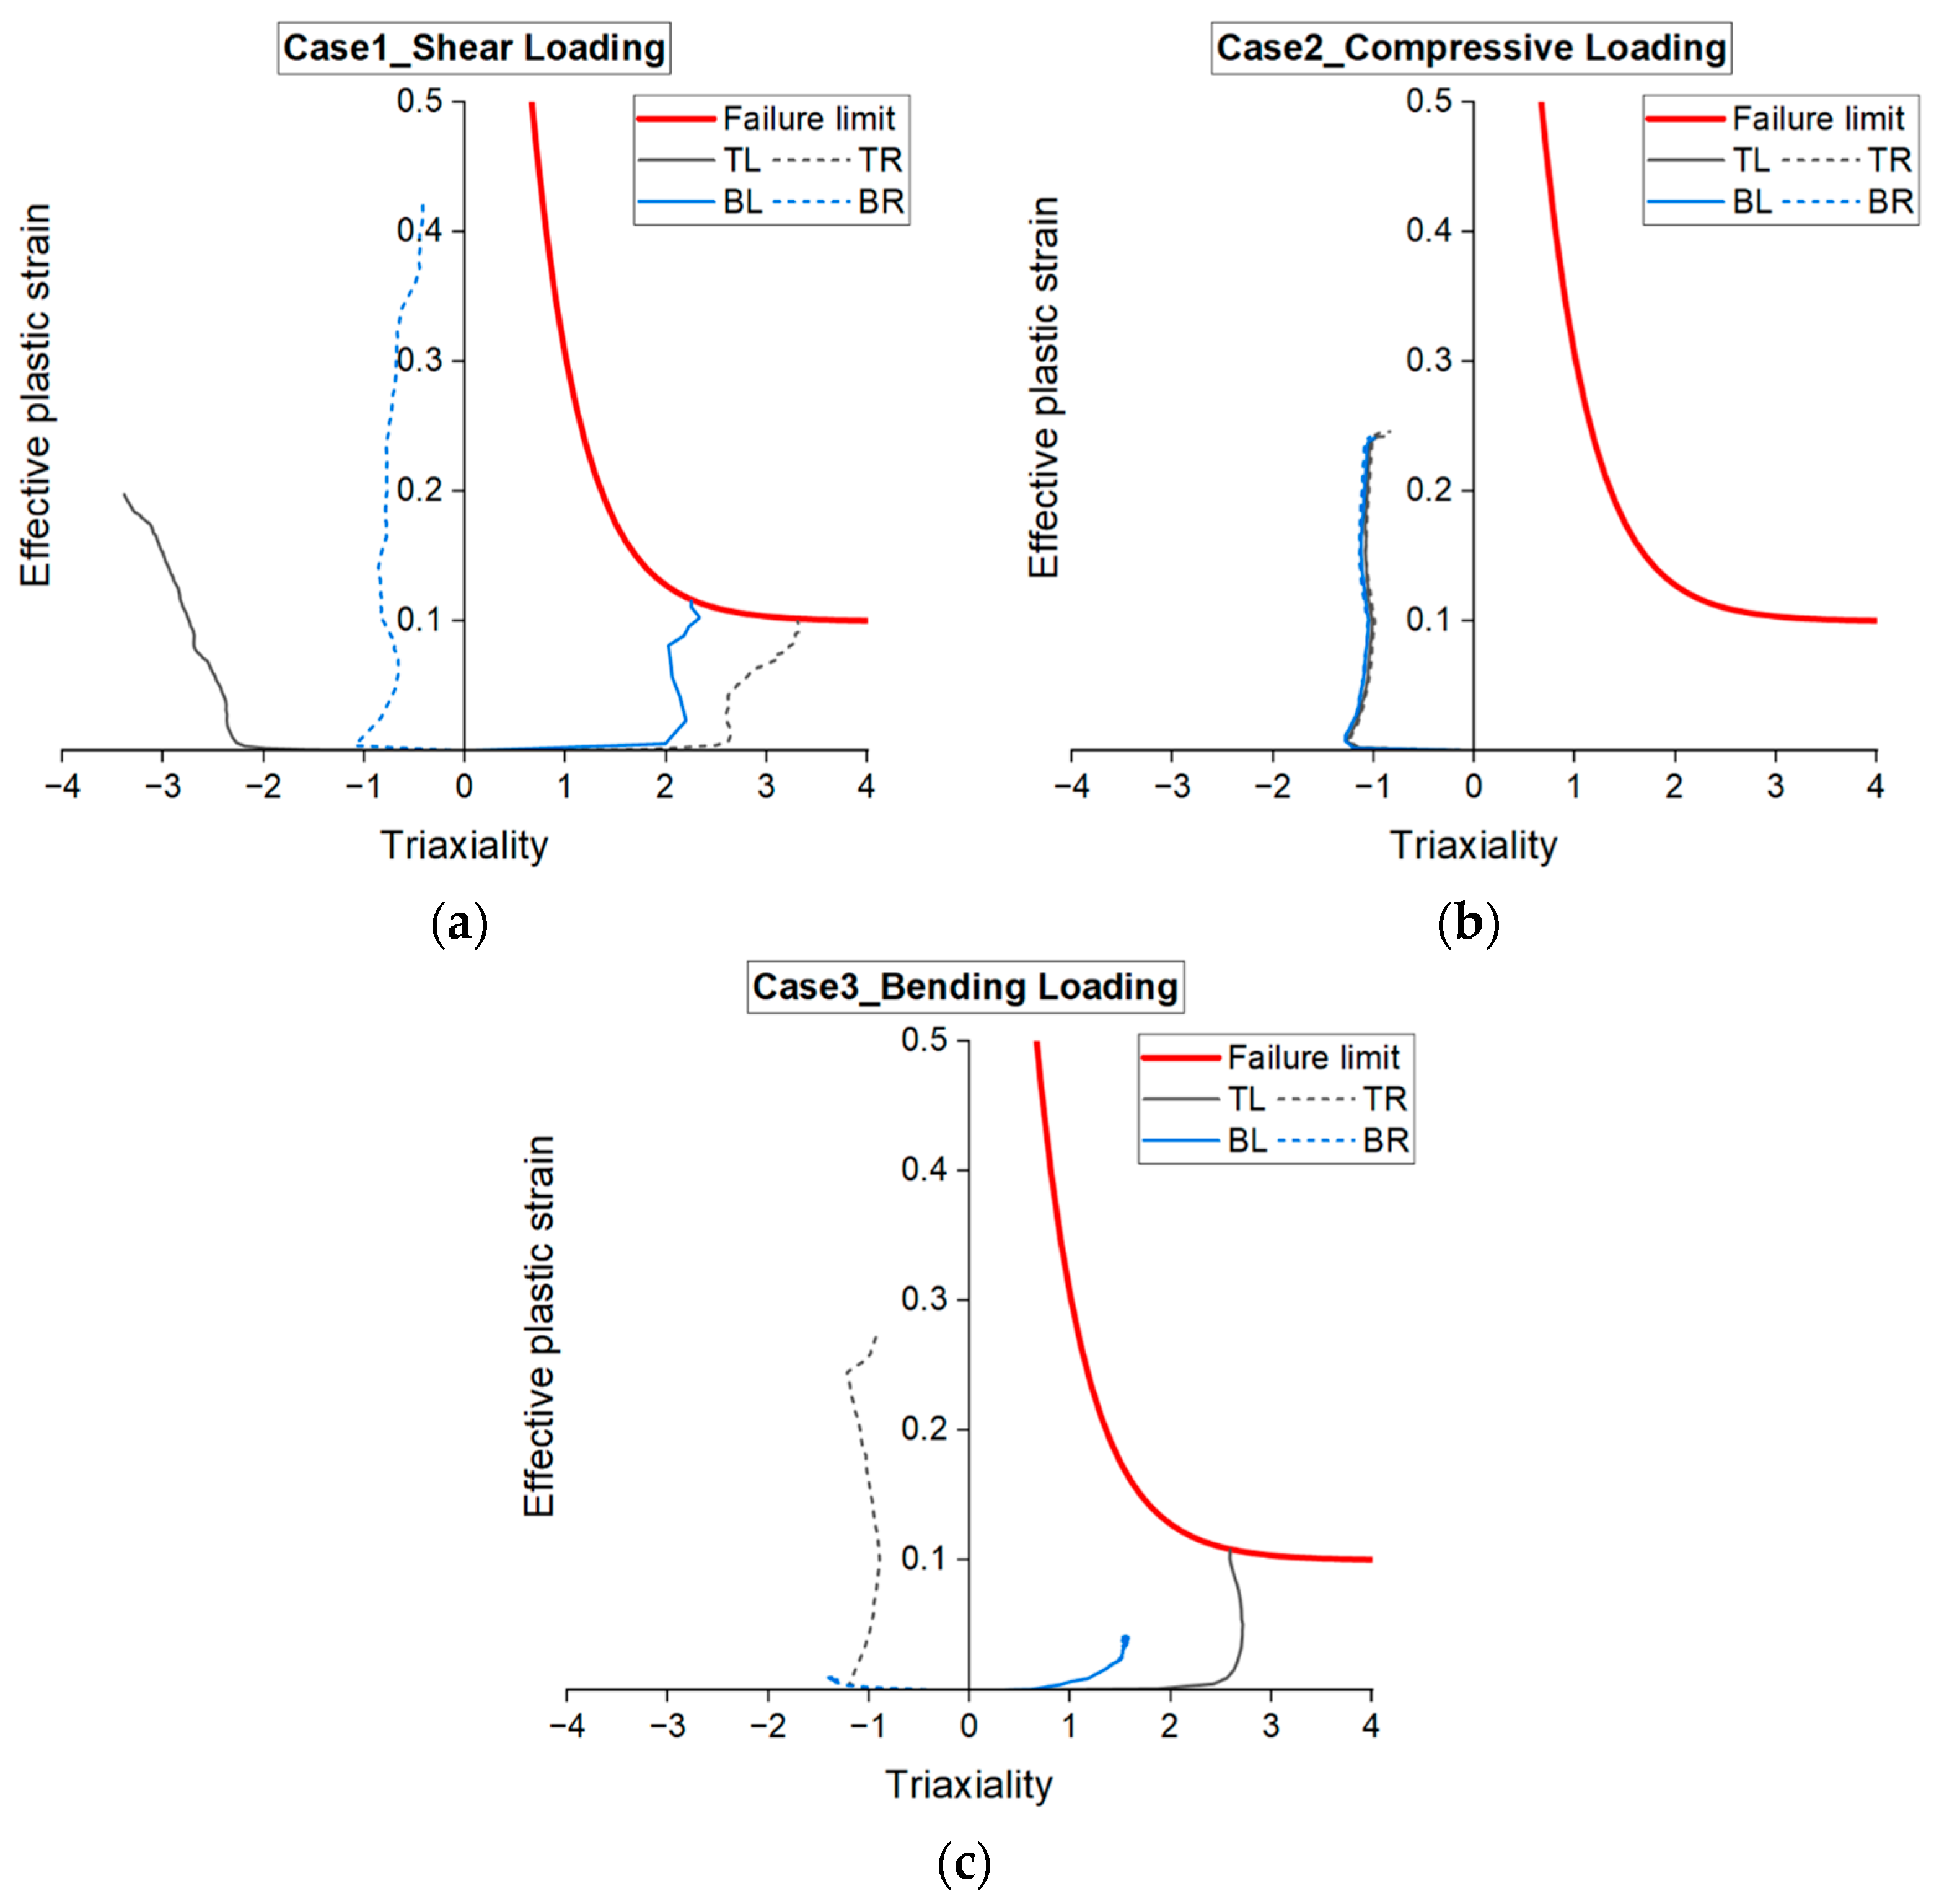
represents the stress triaxiality, defined as
η = σ m σ ¯ ,
σ m = 1 3 t r ( T ) .
Integrating Equation (23) along the loading path resulted in the cumulative damage. This cumulative damage can be used as a criterion for the occurrence of fracture, where a fracture occurs when the cumulative damage reaches the critical value d c as
d c = ( d ˙ ) d t = ε f / D 1 + D 2 exp D 3 η .
Here, ε f is the equivalent plastic strain at facture. The value of d c is generally set to be 1.0, and this work also uses 1.0 for d c . Then, Equation (28) can be re-written as
ε f = D 1 + D 2 exp D 3 η .
Equation (29) gives the limit of fracture strain ε f in a wide range of triaxiality η , and the form of the expression seems to be a simplified version of the Johnson–Cook model [16]. The modeling in this section was implemented using ABAQUS 2020 software with VUMAT. In the numerical simulation, when the equivalent plastic strain at a material point reaches a point on the fracture limit, the material is determined to be fractured, and the element is deleted in the simulation to represent the fracture.

3. FE Modeling

To construct the FE model, the model parameters described in Section 2 must be calibrated. The material used for modeling was SAC305, and the hardening parameters obtained from [37] are listed in Table 1. The fracture criterion parameters for SAC305 material were derived from the Johnson–Cook damage model [38] and are listed in Table 2. Figure 1a,b show the hardening curve and fracture strain limit of the model, respectively.
Figure 2 illustrates the 3D FE model for analyzing the deformation of the solder ball. The fine mesh was organized to ensure accuracy, especially in the corner zone of the solder. Three-dimensional linear elements with eight nodes (C3D8R) were used. In this model, the chip and PCB were assumed to be rigid bodies, while the solder ball was modeled as a deformable body. Tie constraints were applied at both interfaces where the solder ball contacts the PCB and chip. However, this approach is not entirely representative of the actual structure as it does not consider the IMC, which prevents the relative displacement difference at the solder–PCB and –chip contacts. Some studies [27,28] have attempted to model IMC in failure simulations, but they only use elastic properties, which cannot yield sufficiently accurate results. To account for the IMC, a clear understanding of its inelastic properties is necessary, but this information is difficult to find in the literature and may require additional experimentation. This study focuses on the changes in inelastic deformation in the solder under varying external loading conditions while maintaining other conditions constant. Therefore, the model does not consider the IMC and leaves it for future work, as discussed in the Conclusions section. 
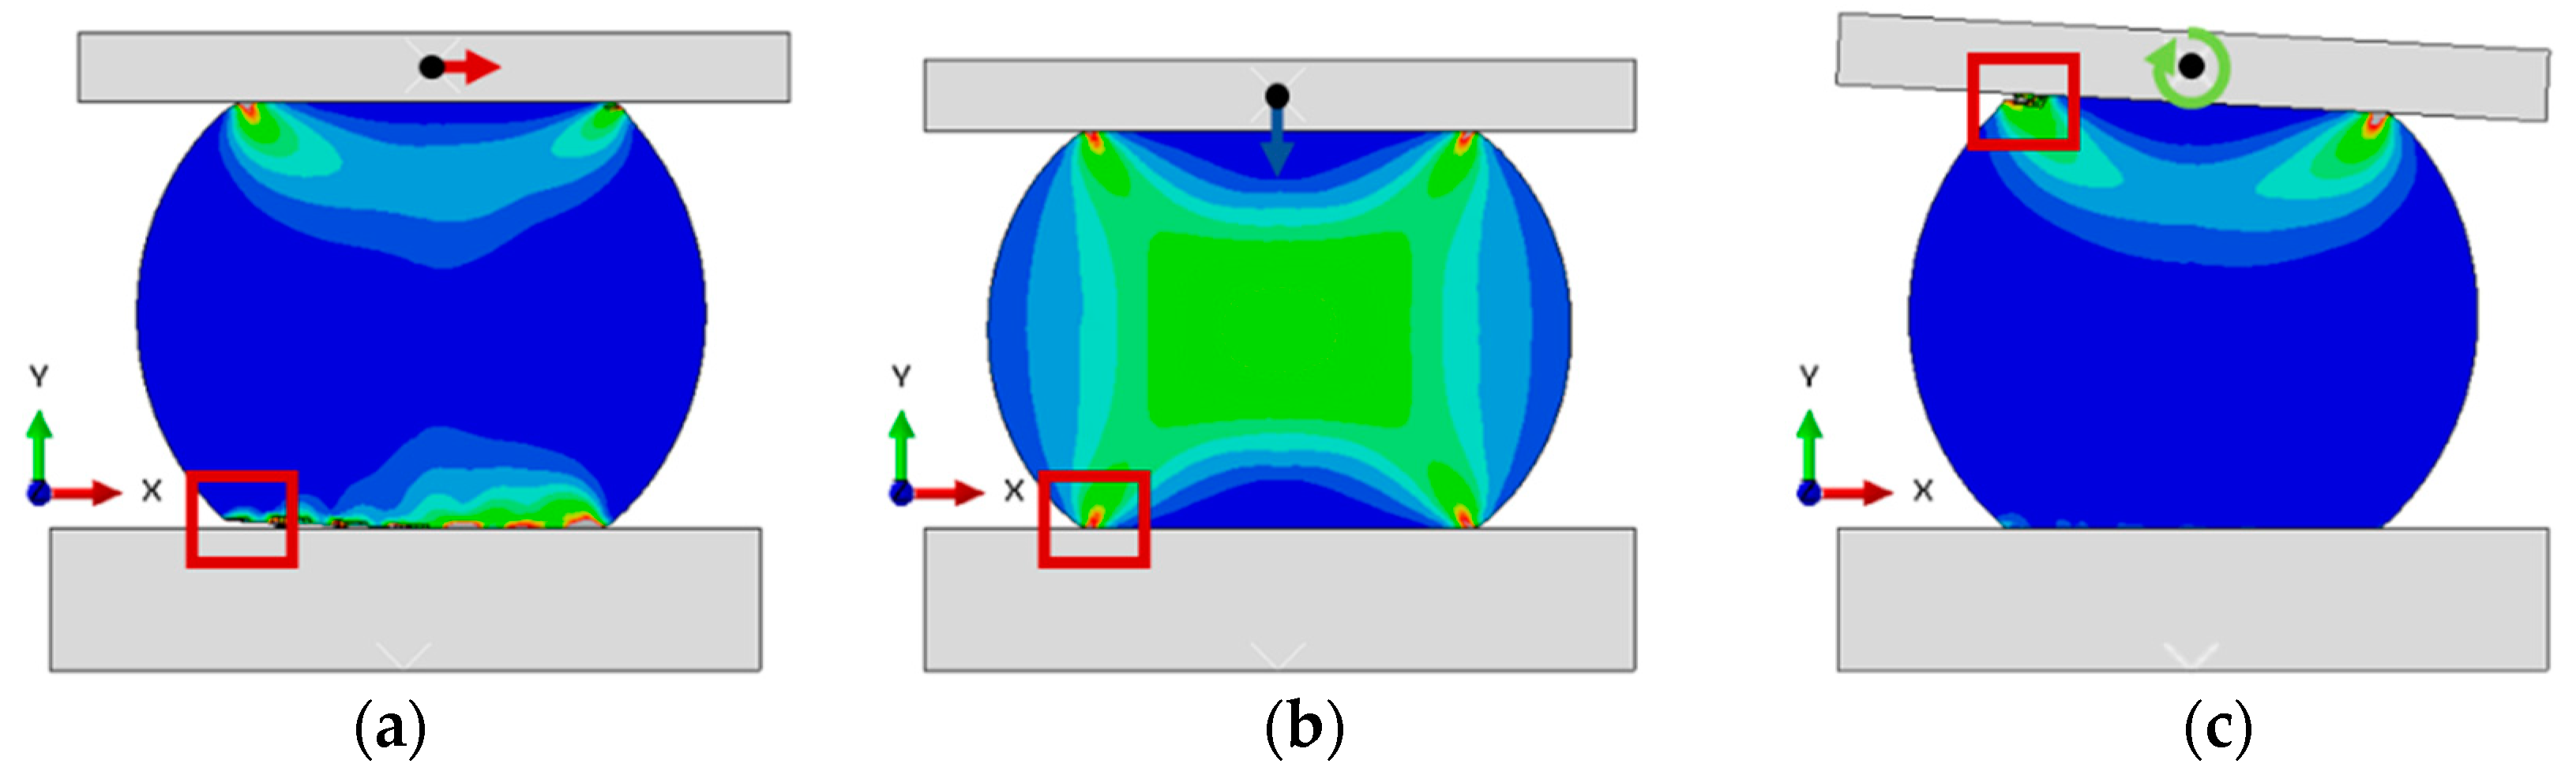
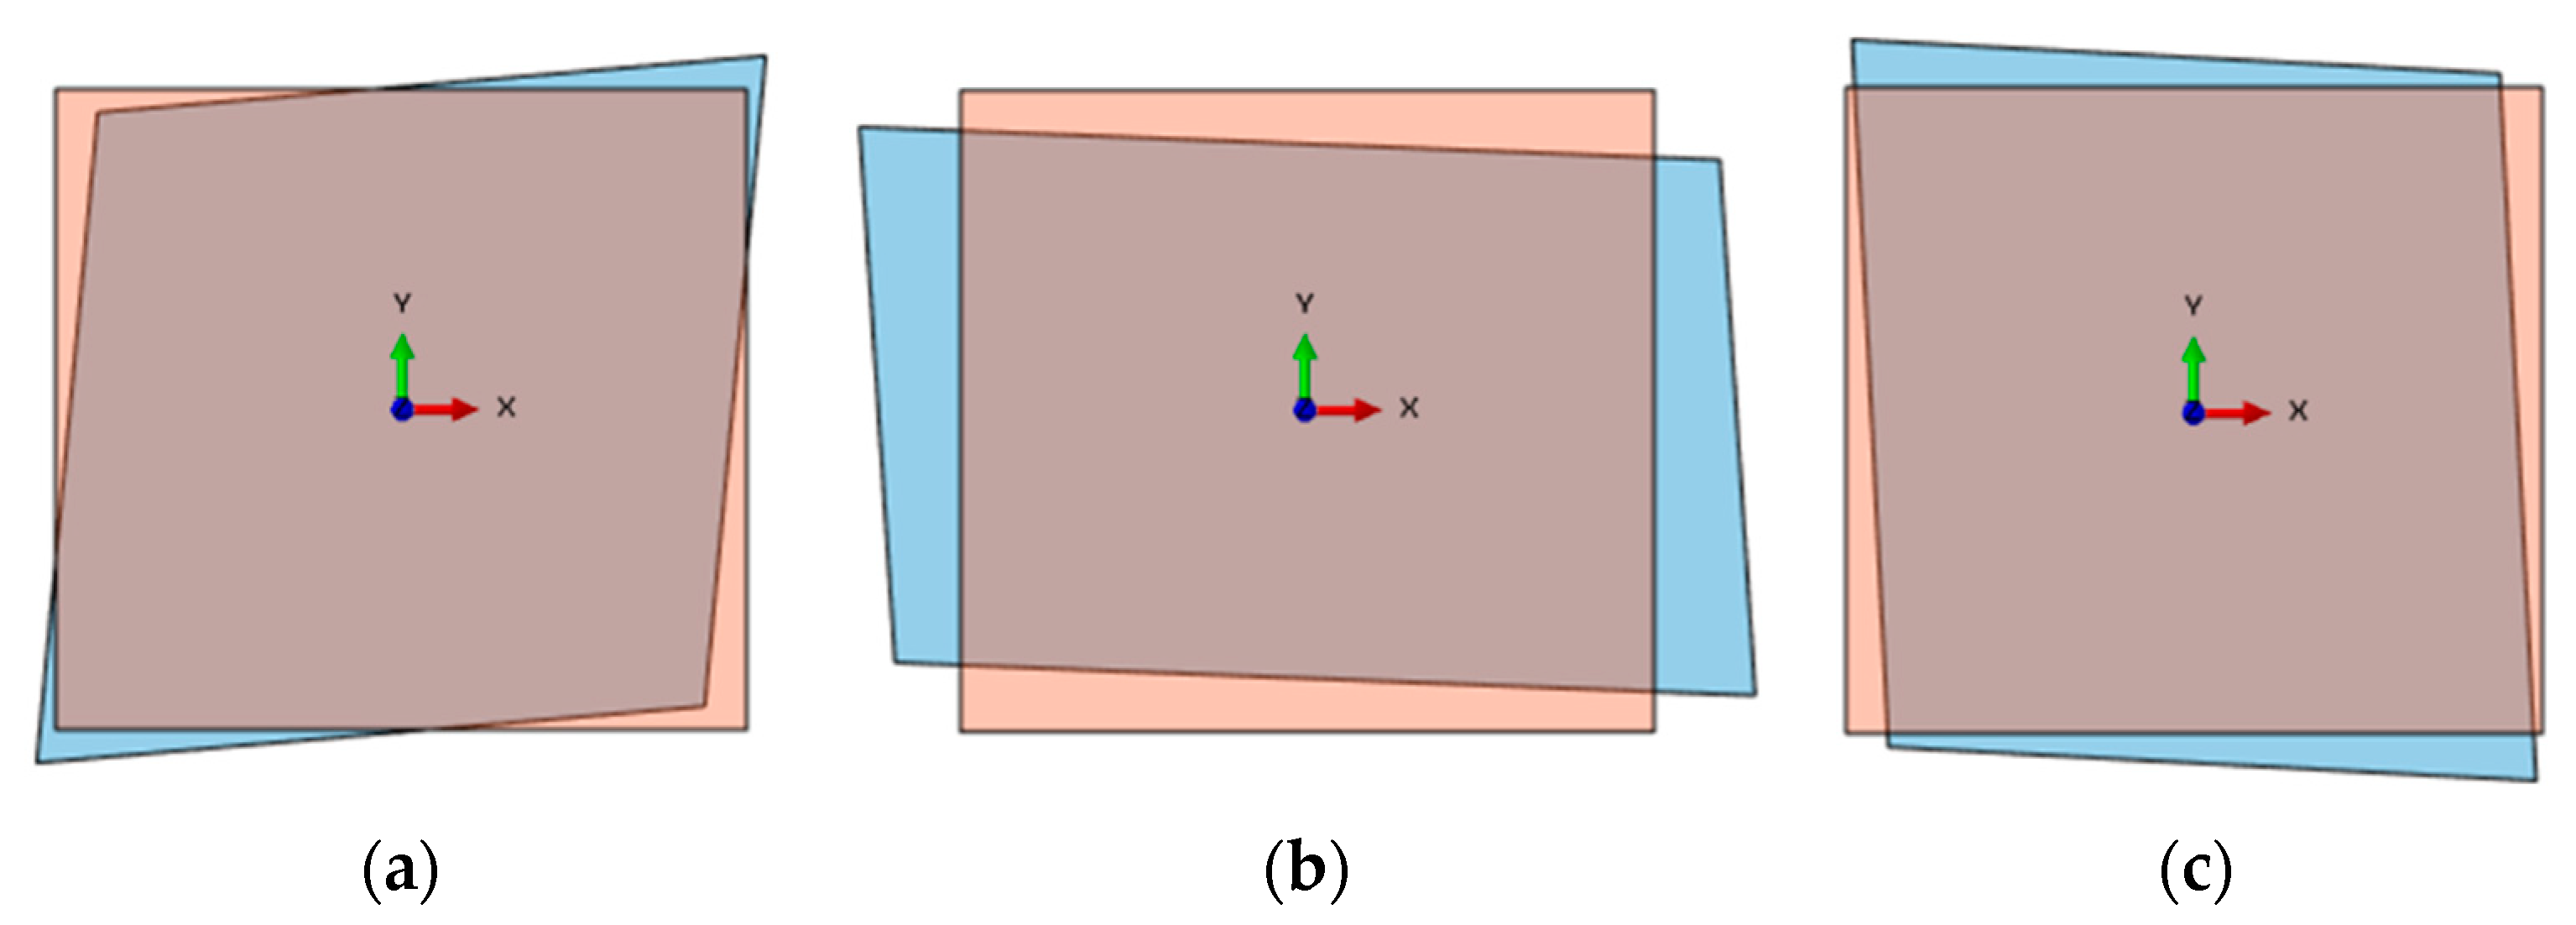
Figure 3 shows a schematic of the seven loading conditions, and Table 3 provides a detailed description of the loading cases. Each loading condition was applied as a single loading case involving shear, compression, and bending for cases 1 to 3, respectively. Dual loading cases were compared for cases 4 to 6. Lastly, case 7 involved complex loading, which combined all three loading conditions. The loading directions of shear, compression, and bending are shown in Figure 2 as red, blue, and green arrows, respectively.

4. Discussion

4.1. Single Loading Cases

Figure 4 shows the equivalent plastic strain (EPS) results for the single loading cases. In this paper, the fracture or maximum deformation occurred at the four corners, which are referred to as top-left (TL), top-right (TR), bottom-left (BL), and bottom right (BR) for convenience. In the shear loading case shown in Figure 4a, fractures occurred at the BL and TR corners of the solder. Although the EPS at the BR and TL corners rose significantly, no fractures were observed. In the case of compression shown in Figure 4b, the largest plastic strain was evenly concentrated at all four corners, but no fracture occurred. For the bending case shown in Figure 4c, severe deformation occurred at the TL and TR corners, but fracture occurred only at the TL corner. These results clearly indicate that fracture in the solder ball cannot be determined solely based on the magnitude of the equivalent plastic strain. For more understanding, deformation history should be analyzed.
Figure 5 shows the critical elements surrounded by red squares for each loading condition, and Table 4 lists the deformation gradient F , rotation R , and stretch tensor U , as defined in Section 2. For the shear loading shown in Figure 5a, the element at BL was contracted horizontally but stretched vertically with rotation to counterclockwise direction. For the compression shown in Figure 5b, four corner elements were almost equally stretched horizontally but contracted vertically. They also rotated clockwise for TL and BL but counterclockwise for TR and BR, respectively. The bending case shown in Figure 5c caused the most deformation near the top region, wherein the critical element of TL was contracted horizontally but stretched in a vertical direction. The same element was rotated in a clockwise direction. Because all cases showed different tendency, a quantitative comparison in a normalized state is necessary.
Figure 6 shows the undeformed and deformed configurations for the normalized critical elements. The deformed configuration was obtained from the Lagrangian strain E to calculate the pure deformation without the effect of the rotation and the values are listed in Table 5. For the shear and bending loading cases, the critical elements were compressed in the x-direction by 3.28% and 6.99%, respectively, and stretched in the y-direction by 1.56% and 9.47%, respectively. Although the shear loading caused the predominant shear deformation of the critical element, the bending showed a uniaxial tensile shape with a small shear deformation. Meanwhile, under the compressive loading, the critical element was stretched by 24.02% in the x-direction and compressed by 16.46% in the y-direction. In summary, when the effect of rotation is neglected, the shear deformation was dominant in the shear loading case, while the normal deformation in the x-direction and y-direction was dominated in the compression and bending cases, respectively.
For a more detailed analysis of the evolving inelastic deformation changes under single loading conditions, the deformation paths of the critical elements were traced and plotted on the stress triaxiality and equivalent plastic strain diagrams, as depicted in Figure 7. A red line represents the proposed fracture limit strain obtained in Figure 1b. Measurements were obtained until the fracture, or at the final deformation in the absence of a fracture, as listed in Table 6. In the case of the shear loading shown in Figure 7a, the elements at the BL and TR corners exhibited a positive range of triaxiality [2, 3.5] and eventually reached the fracture limit at strain values of 0.1 and 0.111, respectively. However, the critical elements for the TL and BR corners reached much higher strain levels without fracture because the TL and BR were in the negative triaxiality zone, where the fracture limit was much higher. From the perspective of the evolving deformation mode, the influence of the top and bottom was greater than that of the left and right. Both TL and TR had larger absolute values of triaxiality compared to BL and BR, and the absolute values of triaxiality for TL and TR indicated that the deformation path evolved increasingly in the direction where these values became larger on both sides.
For compressive loading shown in Figure 7b, all the points were in almost the same deformation mode. In this case, the deformation mode hardly changed, and fracture did not occur because the vulnerable regions are in a negative triaxiality range where the fracture limit is very high. From a deformation point of view, compressive loading can be seen as creating a uniform and stable deformation across the entire structure. In the bending case shown in Figure 7c, fracture occurred at a lower strain of 0.108 in the TL corner where a positive triaxiality was applied. However, no fracture appeared in the opposite corner, even though the strain was twice as high as that in the TL corner. This can be attributed to the negative triaxiality value that can prevent fracture despite high plastic strain. In all the discussed single loading cases, the triaxiality fluctuated to some extent but does not undergo significant changes, and the deformation mode can be considered to be maintained.

4.2. Dual Loading Cases

The deformation results of dual loading cases are shown in Figure 8. For shear and compression loading case shown in Figure 8a, the plastic strain was dominated at the TL and BR corners without fracture and was not symmetrical in either direction. In addition, there is almost no deformation at the BL corner, whereas a significant strain occurred at the TL and BR corners. This result differs from the case in which the shear loading was applied alone, where fracture occurred at the BL corner, and that in which the compressive loading was applied alone with the symmetrical strain distributions at all four corners. For the shear and bending cases shown in Figure 8b, a fracture only occurred at the BL corner. Despite a larger strain at the BR corner, no fracture was observed. A significant and dramatic change occurred where there was minimal plastic strain in the top corners. This result can be attributed to the opposing triaxiality tendencies exhibited at the TR and TL corners under each single loading condition of shear and bending, effectively compensating each other. For the compression and bending cases shown in Figure 8c, there were no fractures at all corners, and the strain at the TR corner was more than six times greater than that at the TL corner without fracture.
Figure 9 shows the stress triaxiality and equivalent plastic strain plot for the dual loading cases. Table 7 lists the fracture strain and the largest plastic strain in the case of no fracture. For the shear and compression case shown in Figure 9a, the stress triaxiality remained in the negative region at all corners. When the solder was subjected to shear loading alone, as shown in Figure 7a, the BL and TR corners exhibited a positive triaxiality. However, for this case, the stress triaxiality value shifted significantly toward the negative side. This indicates that the combination of these two loadings leads to significant change in the deformation mode. This increased the fracture limit in areas where fractures were occurring under shear loading, so that fractures did not occur even at high plastic strain levels. The results of the shear and bending combined loading are shown in Figure 9b. As observed in Figure 8b, the plastic strain at the top corners occurred very minimally. This is because, as mentioned earlier, shear and bending generated opposing deformation paths, leading to the mutual cancellation of the inelastic deformation.
For the compression and bending case shown in Figure 9c, the effect of compression caused a significant change in the deformation path under the external bending forces, especially at the TL and BR corners. Compared to the single bending case, as shown in Figure 7c, the TL point experienced deformation in the positive triaxiality region, leading to eventual fracture. However, in the single compression loading case, the TL corner exhibited a deformation path associated with negative triaxiality, and when both external force conditions were combined, as evidenced in Figure 9c, deformation was minimal due to the offsetting effects of positive and negative triaxiality. On the other hand, the BR corner, which falls within the negative triaxiality region during bending, did not undergo significant deformation. However, it experienced a substantial increase in plastic strain levels due to compressive forces. Nonetheless, no fractures occurred in this region due to the high fracture limit associated with the negative triaxiality region.

4.3. Complex Loading Cases

Figure 10 and Figure 11 show the deformed results of a complex loading case that combines three loading conditions. Table 8 also lists the maximum strain values. The BL corner experienced a comparatively lower level of strain. The stress triaxiality values at all corners maintain a value between [−1.5, −0.5], implying that each critical element is experiencing compressive deformation. The results in Section 4 demonstrate that the fracture of a solder ball cannot be determined solely based on the magnitude of the plastic strain. This shows that a combination of various loading conditions can lead to a change in the deformation mode, highlighting the importance of considering multiple factors in fracture analysis.

5. Conclusions

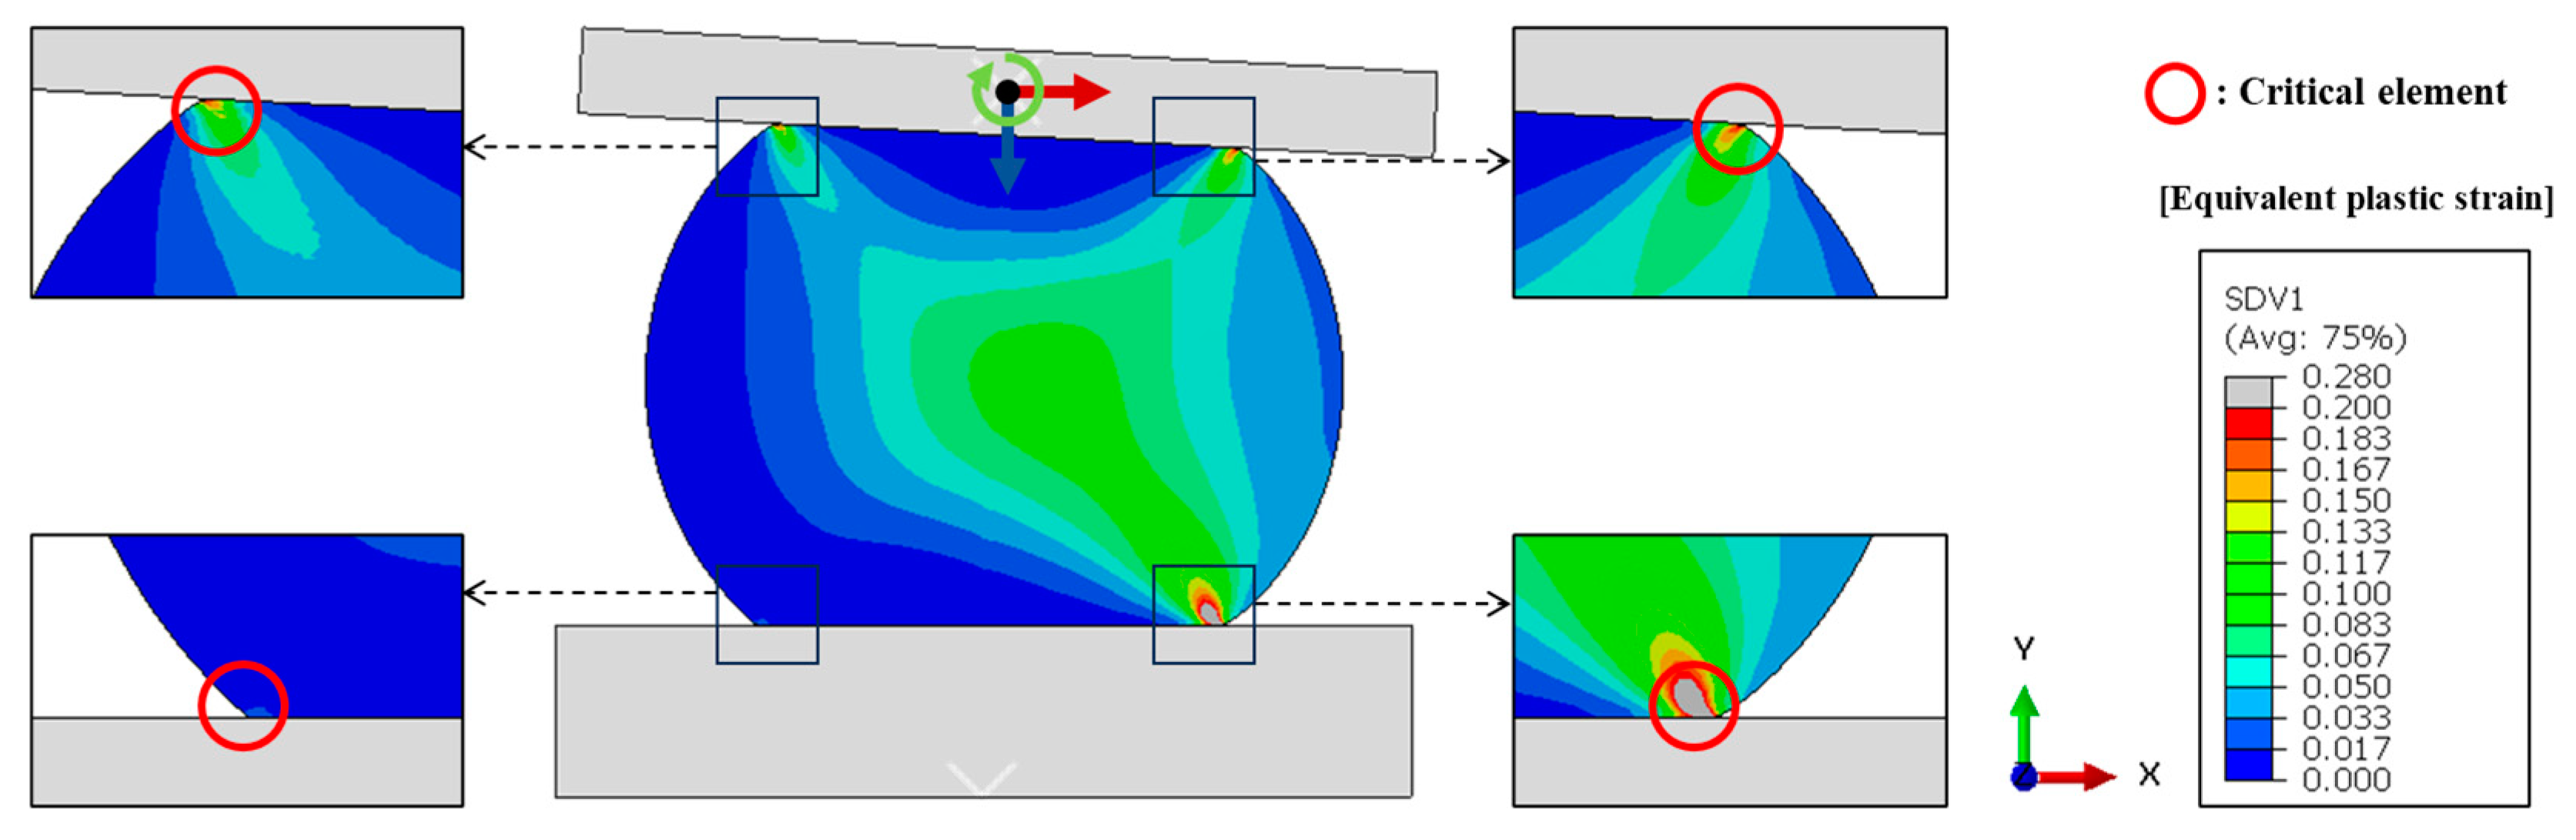
The evolution of inelastic deformation paths of a single solder ball under mechanical loading has been studied based on the Lagrangian formulation. The mechanical loadings applied to the solder joint were substituted into three simplified loadings: shear, compression, and bending. The deformation of the solder joints was obtained under these simplified loadings as well as their combinations. The fracture of the solder ball was predicted using a damage model, taking into account the differences in fracture limit strain with stress triaxiality. Under single loading conditions, plastic strain concentrated in the corners of the solder ball. However, we only observed fractures under shear and bending loading conditions. Compressive loading resulted in a similar deformation path for all corners with significant plastic strain but no fracture. Under dual loading conditions, compressive loading combined with other loadings changed the critical location and resulted in larger plastic strain. However, the compressive load suppressed fracture by shifting the stress triaxiality in a negative direction. Under complex loading conditions, the position of large plastic strain differed significantly. Hence, this work highlights the importance of the path change of inelastic deformation under different mechanical loading conditions. Based on the results, this study plans some future works. First, by accounting for the IMC and PCB as deformable bodies, it plans to conduct a more detailed study. For this purpose, experimental verification of the inelastic properties of IMC and PCB will be conducted. Subsequently, DIC (Digital Image Correlation) can be employed to develop an advanced model, considering the strain rate effect with more diverse external force conditions, which will enable more accurate predictions as part of our future work. Furthermore, upon obtaining images of the solder’s microstructure before and after deformation, microscale analysis through CP and DD interpretations would also be feasible.

Author Contributions

Conceptualization, E.-H.L.; methodology, J.-H.L., D.-H.L. and E.-H.L.; software, J.-H.L. and D.-H.L.; validation, J.-H.L. and D.-H.L.; formal analysis, J.-H.L., D.-H.L. and E.-H.L.; investigation, J.-H.L. and D.-H.L.; resources, E.-H.L.; data curation, J.-H.L. and D.-H.L.; writing—original draft preparation, D.-H.L.; writing—review and editing, J.-H.L. and E.-H.L.; visualization, J.-H.L. and D.-H.L.; supervision, E.-H.L.; project administration, E.-H.L.; funding acquisition, E.-H.L. All authors have read and agreed to the published version of the manuscript.

Funding

This work was partially supported by the Korea Institute for Advancement of Technology (KIAT) grant (P0008458, HRD Program for Industrial Innovation) funded from the Ministry of Trade, Industry & Energy (MOTIE, Korea), and the Technology Innovation Program (Public-private joint investment semiconductor R&D program (K-CHIPS) to foster high-quality human resources) (RS-2023-00236091, Hybrid bonding technologies for 3D package interconnects).

Institutional Review Board Statement

Not applicable.

Informed Consent Statement

Not applicable.

Data Availability Statement

Data are contained within the article.

Conflicts of Interest

The authors declare that there are no conflict of interest.

References

  1. Li, K.; Cheng, G. A nested algorithm of truss topology optimization for maximum plastic shakedown loading capacity. J. Comput. Des. Eng. 2022, 9, 670–688. [Google Scholar] [CrossRef]
  2. Song, S.; Xiong, C.; Yin, J.; Yang, Z.; Wang, L. Fabrication, design, and optimization of hierarchical composite Kagome honeycomb sandwich structure under uniaxial compression. J. Comput. Des. Eng. 2023, 10, 873–891. [Google Scholar] [CrossRef]
  3. Wang, Y.; Wu, T.; Liu, J.; Yu, H. Deposition path-dependent lightweight support design and its implication to self-support topology optimization. J. Comput. Des. Eng. 2022, 9, 2314–2331. [Google Scholar] [CrossRef]
  4. Yu, S.Y.; Kwon, Y.-M.; Kim, J.; Jeong, T.; Choi, S.; Paik, K.-W. Studies on the thermal cycling reliability of BGA system-in-package (SiP) with an embedded die. IEEE Trans. Compon. Packag. Manuf. Technol. 2012, 2, 625–633. [Google Scholar] [CrossRef]
  5. Gao, L.-Y.; Cui, X.-W.; Tian, F.-F.; Liu, Z.-Q. Failure mechanism of the SnAgCu/SnPb mixed soldering process in a Ball Grid Array structure. J. Electron. Mater. 2020, 49, 6223–6231. [Google Scholar] [CrossRef]
  6. Surendar, A.; Kishore, K.; Kavitha, M.; Ibatova, A.; Samavatian, V. Effects of thermo-mechanical fatigue and low cycle fatigue interaction on performance of solder joints. IEEE Trans. Device Mater. Reliab. 2018, 18, 606–612. [Google Scholar] [CrossRef]
  7. Pang, H.; Tan, K.; Shi, X.; Wang, Z. Microstructure and intermetallic growth effects on shear and fatigue strength of solder joints subjected to thermal cycling aging. Mater. Sci. Eng. A 2001, 307, 42–50. [Google Scholar] [CrossRef]
  8. Che, F.; Pang, J.H. Fatigue reliability analysis of Sn–Ag–Cu solder joints subject to thermal cycling. IEEE Trans. Device Mater. Reliab. 2012, 13, 36–49. [Google Scholar] [CrossRef]
  9. Kim, T.-H.; Park, J.-H.; Jung, K.W.; Kim, J.; Lee, E.-H. Application of Convolutional Neural Network to Predict Anisotropic Effective Thermal Conductivity of Semiconductor Package. IEEE Access 2022, 10, 51995–52007. [Google Scholar] [CrossRef]
  10. Qin, H.; Zhang, X.; Zhou, M.; Li, X.; Mai, Y.-W. Geometry effect on mechanical performance and fracture behavior of micro-scale ball grid array structure Cu/Sn–3.0 Ag–0.5 Cu/Cu solder joints. Microelectron. Reliab. 2015, 55, 1214–1225. [Google Scholar] [CrossRef]
  11. Shen, Y.-L.; Chawla, N.; Ege, E.; Deng, X. Deformation analysis of lap-shear testing of solder joints. Acta Mater. 2005, 53, 2633–2642. [Google Scholar]
  12. Chawla, N.; Shen, Y.-L.; Deng, X.; Ege, E. An evaluation of the lap-shear test for Sn-rich solder/Cu couples: Experiments and simulation. J. Electron. Mater. 2004, 33, 1589–1595. [Google Scholar]
  13. Freudenthal, A.M. The Inelastic Behavior of Engineering Materials and Structures; John Wiley & Sons Inc.: New York, NY, USA, 1950. [Google Scholar]
  14. Latham, M.G.C.D.J. Ductility and the Workability of Metals. J. Inst. Met. 1968, 96, 33–39. [Google Scholar]
  15. Brozzo, P.; Deluca, B.; Rendina, R. A new method for the prediction of formability limits in metal sheets. In Proceedings of the 7th Biennal Conference IDDR, Amsterdam, The Netherlands, 9–13 October 1972. [Google Scholar]
  16. Johnson, G.R.; Cook, W.H. Fracture characteristics of three metals subjected to various strains, strain rates, temperatures and pressures. Eng. Fract. Mech. 1985, 21, 31–48. [Google Scholar] [CrossRef]
  17. Lou, Y.; Huh, H. Extension of a shear-controlled ductile fracture model considering the stress triaxiality and the Lode parameter. Int. J. Solids Struct. 2013, 50, 447–455. [Google Scholar]
  18. Bao, Y.; Wierzbicki, T. On fracture locus in the equivalent strain and stress triaxiality space. Int. J. Mech. Sci. 2004, 46, 81–98. [Google Scholar]
  19. Wierzbicki, T.; Bao, Y.; Lee, Y.-W.; Bai, Y. Calibration and evaluation of seven fracture models. Int. J. Mech. Sci. 2005, 47, 719–743. [Google Scholar]
  20. Hora, P.; Tong, L.; Berisha, B. Modified maximum force criterion, a model for the theoretical prediction of forming limit curves. Int. J. Mater. Form. 2013, 6, 267–279. [Google Scholar]
  21. Lou, Y.; Huh, H.; Lim, S.; Pack, K. New ductile fracture criterion for prediction of fracture forming limit diagrams of sheet metals. Int. J. Solids Struct. 2012, 49, 3605–3615. [Google Scholar]
  22. Park, N.; Huh, H.; Lim, S.J.; Lou, Y.; Kang, Y.S.; Seo, M.H. Fracture-based forming limit criteria for anisotropic materials in sheet metal forming. Int. J. Plast. 2017, 96, 1–35. [Google Scholar]
  23. Shim, Y.-D.; Lee, E.-H. An Effective Formability Model of Pearlitic Steel Wires in Multi-stage Drawing Process Based on the Stress-Based Forming Limit Criterion. Int. J. Precis. Eng. Manuf. 2022, 24, 1723–1737. [Google Scholar] [CrossRef]
  24. Kim, T.-H.; Park, S.-H.; Lee, E.-H.; Kang, Y.H.; Chung, J.S.; Ha, J. A New Mechanical Cold Trimming Process Assisted by Dashed Lined Infrared Heat Treatment of Martensitic Steel Considering Energy Efficiency. Int. J. Precis. Eng. Manuf. -Green Technol. 2022, 1–22. [Google Scholar] [CrossRef]
  25. Olofsson, J. Local microstructure-based material performance and damage in design and finite element simulations of cast components. J. Comput. Des. Eng. 2018, 5, 419–426. [Google Scholar] [CrossRef]
  26. Starvin, M.; Ganesh, K.; Pandiyarajan, R. Correlation of fracture parameters during onset of crack in middle tension specimen. J. Comput. Des. Eng. 2017, 4, 169–177. [Google Scholar] [CrossRef]
  27. Luan, J.E.; Tee, T.Y.; Zhang, X.; Hussab, E. Solder joint failure modes, mechanisms, and life prediction models of IC packages under board level drop impact. In Proceedings of the 6th International Conference on Electronic Packaging Technology, Shenzhen, China, 30 August–2 September 2005; pp. 382–388. [Google Scholar]
  28. Cho, Y.; Hahn, M.; Jeong, H.; Jang, G. Shear test evaluation of the mechanical reliability of micro bumps in semiconductors. Microsyst. Technol. 2022, 28, 2173–2180. [Google Scholar] [CrossRef]
  29. Mánik, T.; Asadkandi, H.M.; Holmedal, B. A robust algorithm for rate-independent crystal plasticity. Comput. Methods Appl. Mech. Eng. 2022, 393, 114831. [Google Scholar] [CrossRef]
  30. Zhang, X.; Lu, S.; Zhang, B.; Tian, X.; Kan, Q.; Kang, G. Dislocation–grain boundary interaction-based discrete dislocation dynamics modeling and its application to bicrystals with different misorientations. Acta Mater. 2021, 202, 88–98. [Google Scholar] [CrossRef]
  31. Lee, E.-H.; Rubin, M. Modeling anisotropic inelastic effects in sheet metal forming using microstructural vectors—Part I: Theory. Int. J. Plast. 2020, 134, 102783. [Google Scholar] [CrossRef]
  32. Lee, E.-H.; Rubin, M. Eulerian constitutive equations for the coupled influences of anisotropic yielding, the Bauschinger effect and the strength-differential effect for plane stress. Int. J. Solids Struct. 2022, 241, 111475. [Google Scholar] [CrossRef]
  33. Lee, E.H. Elastic-plastic deformation at finite strains. J. Appl. Mech. 1969, 36, 1–6. [Google Scholar] [CrossRef]
  34. Lee, E.H.; Liu, D.T. Finite-Strain Elastic—Plastic Theory with Application to Plane-Wave Analysis. J. Appl. Phys. 1967, 38, 19–27. [Google Scholar] [CrossRef]
  35. Stoughton, T.B.; Yoon, J.W. Anisotropic hardening and non-associated flow in proportional loading of sheet metals. Int. J. Plast. 2009, 25, 1777–1817. [Google Scholar] [CrossRef]
  36. Yoon, J.W.; Barlat, F.; Dick, R.E.; Chung, K.; Kang, T.J. Plane stress yield function for aluminum alloy sheetsdpart II: FE formulation and its implementation. Int. J. Plast. 2004, 20, 495–522. [Google Scholar] [CrossRef]
  37. Loh, W.K.; Kulterman, R.; Fu, H.; Tsuriya, M. Recent trends of package warpage and measurement metrologies. In Proceedings of the 2016 International Conference on Electronics Packaging (ICEP), Hokkaido, Japan, 20–22 April 2016; pp. 89–93. [Google Scholar]
  38. Qin, F.; An, T.; Chen, N. Strain rate effects and rate-dependent constitutive models of lead-based and lead-free solders. J. Appl. Mech. 2010, 77, 011008. [Google Scholar] [CrossRef]
Figure 1. Material behavior for SAC305 (a) hardening curve and (b) fracture strain with respect to triaxiality.
Applsci 13 12137 g001
Figure 2. 3D FE model of solder joint: (a) parts dimensions and (b) section view of a solder ball with mesh distribution.
Applsci 13 12137 g002
Figure 3. Schematic diagram of single, dual, and complex loading conditions.
Applsci 13 12137 g003
Figure 4. Equivalent plastic strain contour of the single loading cases: (a) shear, (b) compression, and (c) bending.
Applsci 13 12137 g004
Figure 5. Position of critical elements for (a) shear, (b) compression, and (c) bending loadings.
Applsci 13 12137 g005
Figure 6. Normalized deformation of critical element by green strain tensor for (a) shear, (b) compression, and (c) bending.
Applsci 13 12137 g006
Figure 7. Stress triaxiality vs. equivalent plastic strain diagram for the single loading cases: (a) shear, (b) compression, and (c) bending.
Applsci 13 12137 g007
Figure 8. Equivalent plastic strain contour of the dual loading cases: (a) shear and compression, (b) shear and bending, and (c) compression and bending.
Applsci 13 12137 g008
Figure 9. Stress triaxiality vs. equivalent plastic strain diagram for the dual loading cases: (a) shear and compression, (b) shear and bending, and (c) compression and bending.
Applsci 13 12137 g009
Figure 10. Equivalent plastic strain contour of the complex loading case.
Applsci 13 12137 g010
Figure 11. Stress triaxiality vs. equivalent plastic strain diagram for the complex loading case.
Applsci 13 12137 g011
Table 1. Hardening parameters [34].
A B n
382750.710
Table 2. Damage model parameters.
D 1 D 2 D 3 D 4 D 5
0.11.5−200
Table 3. Mechanical loading cases.
CaseShearCompressionBending
Single loadingCase 1 (S) d = 0.08   m m --
Case 2 (C)- d = 0.08   m m -
Case 3 (B)-- r e v . = 10 °
Dual loadingCase 4 (SC) d = 0.04 2   m m d = 0.04 2   m m -
Case 5 (SB) d = 0.08   m m - r e v . = 10 °
Case 6 (CB)- d = 0.08   m m r e v . = 10 °
Complex loadingCase 7 (SCB) d = 0.04 2 m m d = 0.04 2 m m r e v . = 10 °
Table 4. Deformation gradient F , rigid body rotation R , and stretch tensor U of critical elements under single loading cases.
Deformation ComponentsShearCompressionBending
F
0.9664 0.2038 0.0203 0.9948
1.1936 0.2406 0.2360 0.7829
0.9263 1.662 0.0458 1.0779
R
0.9935 0.1137 0.1137 0.9935
0.9721 0.2344 0.2344 0.9721
0.9945 0.1052 0.1052 0.9945
U
0.9625 0.0894 0.0894 1.0115
1.2157 0.0504 0.0504 0.8175
0.9260 0.0519 0.0519 1.0894
Table 5. Green strain tensor ( E ) for the normalized deformation of each single loading cases.
Green Strain TensorShearCompressionBending
E
0.0328 0.0883 0.0883 0.0156
0.2402 0.0512 0.0512 0.1646
0.0699 0.0523 0.0523 0.0947
Table 6. The largest equivalent plastic strain values for critical elements under the single loading cases.
Loading ConditionsTLTRBLBR
Shear (S)0.198 (O)0.100 (X)0.111 (X)0.423 (O)
Compression (C)0.243 (O)0.246 (O)0.240 (O)0.241 (O)
Bending (B)0.108 (X)0.274 (O)0.041 (O)0.011 (O)
Note: (X) denotes fracture and (O) denotes safety.
Table 7. The largest equivalent plastic strain values for the critical elements under the dual loading cases.
Loading ConditionsTLTRBLBR
Shear + Compression (SC)0.3050 (O)0.0040 (O)0.0048 (O)0.311 (O)
Shear + Bending (SB)0.0191 (O)0.0008 (O)0.0950 (X)0.287 (O)
Compression + Bending (CB)0.0445 (O)0.3290 (O)0.2660 (O)0.218 (O)
Note: (X) denotes fracture, and (O) denotes safety.
Table 8. The largest equivalent plastic strain values for the critical elements under the complex loading case.
Loading ConditionTLTRBLBR
Shear + Compression + Bending (SCB)0.178 (O)0.184 (O)0.018 (O)0.287 (O)
Note: (X) denotes fracture, and (O) denotes safety.
Disclaimer/Publisher’s Note: The statements, opinions and data contained in all publications are solely those of the individual author(s) and contributor(s) and not of MDPI and/or the editor(s). MDPI and/or the editor(s) disclaim responsibility for any injury to people or property resulting from any ideas, methods, instructions or products referred to in the content.

