Article

The Impact of Ultrasound Pre-Treatment on Hot-Air-Drying Kinetics and Quality of Carrot Slices Assessed by Simulations and Experiments

by
Thi Thu Hang Tran
1,
Thi Thuy Dung Nguyen
1,2,
Abdolreza Kharaghani
3 and
Kieu Hiep Le
1,*
1
School of Mechanical Engineering, Hanoi University of Science and Technology, 01 Dai Co Viet Street, Hai Ba Trung, Hanoi, Vietnam
2
Faculty of Mechanical Engineering, University of Transport and Communications, 03 Cau Giay Street, Dong Da, Hanoi, Vietnam
3
Thermal Process Engineering, Otto von Guericke University Magdeburg, Universitätsplatz 2, 39106 Magdeburg, Germany
*
Author to whom correspondence should be addressed.
Appl. Sci. 2023, 13(21), 11865; https://doi.org/10.3390/app132111865
Submission received: 24 September 2023 / Revised: 25 October 2023 / Accepted: 26 October 2023 / Published: 30 October 2023
(This article belongs to the Topic Advanced Heat and Mass Transfer Technologies)

Abstract

:
This study investigated experimentally and numerically the influence of ultrasound pre-treatment on the drying kinetics of sliced carrot samples. Drying experiments were performed under different conditions, including scenarios with and without ultrasound pre-treatment at drying temperatures of 30 °C, 40 °C, and 50 °C. A diffusion-based-drying model was developed to study the impact of ultrasound pre-treatment on drying kinetics. The effective moisture diffusivity of carrots was expressed as a function of moisture content and temperature. Given the complexity of the dehydration process in carrot slices, which depends on the spatiotemporal variations in moisture content and temperature, and is challenging to monitor experimentally, the effective moisture diffusivity is computed by minimizing the discrepancy between numerical predictions and experimental moisture-content changes over time. This study revealed that ultrasound pre-treatment significantly enhanced the moisture diffusivity of the samples, increasing it by 43% to 90% at drying temperatures of 40 °C and 50 °C, respectively. To apply this analysis of ultrasound pre-treatment in large-scale dryers where thousands of slices may be involved, the proposed diffusion model was simplified to a characteristic drying-curve model. Afterwards, this characteristic drying-curve model was incorporated into a belt-dryer model. The results indicated a 12% reduction in the length of the belt dryer when ultrasound pre-treatment was applied. Additionally, the color of carrot samples was preserved better with ultrasound pre-treatment. On the basis of these results, the application of ultrasound pre-treatment in the hot-air drying of carrot slices was favored, both in terms of improved drying kinetics and quality aspects.

1. Introduction

The carrot (Daucus carota L.) is a popular root vegetable which is commonly seen as orange in color. From a nutrition point of view, carrots are a good source of alpha- and beta-carotene, vitamin K, and vitamin B6. Carrots are planted worldwide, with a production of around 44 million tons in 2019 according to the data from Food and Agriculture Organization (FAO). Traditionally, the taproot of carrot is freshly eaten in daily meals. Nowadays, in addition to their fresh consumption, carrots have been dried to prolong storage time and save transport cost. Dried carrot is used in the production of instant soups, instant sauces, ingredients for stuffings, casseroles, stews, and ped food [1].
Carrot is often dried at high temperatures in tunnel, tray, and belt dryer systems, with hot air serving as the drying agent. The heat and mass transfer kinetics of carrot in the course of hot-air drying has been investigated in several previous studies. Traditionally, the moisture diffusivity of carrots during the hot-air-drying process has been described by the Arrhenius equation and the modified Arrhenius equation [2,3,4,5,6,7]. The difference in core and annular moisture diffusivity in carrot was also investigated [8]. The impact of drying conditions on the product quality aspects (color, chemical composition: β-carotene, antioxidants, vitamin B1, B2, polyphenols, etc.) was experimentally investigated [9,10,11]. Recently, to improve product quality and to reduce energy consumption, carrot has been dried in a low-temperature air environment [12,13,14]. However, since the temperature difference between the drying agent and the product is small, the drying process at low temperatures is often slow. External energy sources (such as microwave, infrared, and ultrasound (US)) have, therefore, been used to assist the drying process by enhancing water vaporization [12,14,15]. The US-assisted drying process has experimentally been proven to shorten drying time and improve product quality. This implies that US-assisted drying techniques have the potential to save energy and improve the economic benefit of food processing products. In the laboratory-scale dryer, it has been demonstrated that the integration of US pre-treatment in conjunction with microwave and hot-air drying effectively reduces the specific energy consumption required to remove one kilogram of water. The reduction falls within the range of 10% to 20% for various products, such as pistachio kernel, basil, and raspberries [16,17,18]. Furthermore, the introduction of US pre-treatment can enhance overall energy efficiency by a margin, ranging from 16% to 29%, as reported in [19]. Thus, for the industrial sector to effectively implement US-assisted drying techniques, a comprehensive understanding of drying kinetic in US-assisted drying is essential [20].
In addition to using US sources to assist the drying process directly, US pre-treatment has also been progressively applied in recent years and has demonstrated the potential to significantly reduce the drying time of carrots as reported, for example, in the work of Ricce et al. [21], Wang et al. [22], and Gamboa-Santos et al. [23]. This positive impact of US pre-treatment on drying behavior is attributed to the cavitation due to powerful waves in liquid solutions which is dependent on the properties of the liquid, the presence of air, and the acoustic power of the ultrasonic system. The use of US causes cavitation by producing micro gas bubbles within a liquid. These bubbles, when they burst, release powerful shock waves and free radicals across the cell membrane, both of which contribute to the inactivation of microorganisms. Despite this understanding, however, the mathematical description of the drying processes remains at the empirical level, where models such as Page and Newton models have been used. Furthermore, the enhancement of US pre-treatment on moisture diffusivity has not been considered.
This paper describes our attempts to investigate the impact of US pre-treatment on the drying kinetics of carrot slices. Classically, the diffusion model is used to investigate the drying kinetics of a single slice. The effective moisture diffusivity of a single carrot slice has been determined from the solution to Fick’s equation under isothermal conditions. When the variation in surface temperature is significant, the isothermal approximation may not be appropriate. Additionally, since the respective simulations are performed for a single slice under constant gas properties, they cannot reflect the influence of actual maldistribution of gas velocity, temperature, and relative humidity in the dryer on the drying process of a huge population of slices. To pave the way for designing procedures and optimization of the dryer operation, several conveyor-belt-drying models have been developed [24,25,26,27]. In the work of Montazer-Rahmati and Amini-Horri, a correlation of drying flux depending on the moisture ratio, gas temperature, and gas velocity was integrated into the belt-drying model [27]. Since the correlation is purely fitted from experiment data, the extrapolation ability of the model is still questionable. Recently, Firso developed conveyor-belt-drying models to determine the required dryer length for the designed final moisture contents of the product [25]. In these models, the critical moisture-content and the relation between the drying flux and drying conditions remain unchanged.
In this paper, a one-dimensional diffusion model that incorporates the heat and mass transfer processes is developed to simulate the drying process of carrots. Following the Section 1, a description of the diffusion model of a single carrot slice and the related numerical scheme are detailed. The mathematical model of the conveyor-belt-drying model is presented. Instead of using the empirical model or correlation, the heat and mass interaction between the drying product and airflow is expressed by a semi-empirical model which is reduced from the diffusion model. The validity of the diffusion model is qualitatively checked against the experimental observations, with fair agreement. The diffusion model, which describes the drying process of a single slice, is reduced to a semi-empirical characteristic drying-curve model and this model is then integrated into the belt-dryer model. After that, the comparison between the drying process with and without US pre-treatment is presented in the belt-dryer model. The color of dried carrot obtained in different drying scenarios is explored to examine qualitatively the quality of the dried product.

2. Material and Experimental Methods

2.1. Material

The typical fresh carrot from Northern Vietnam was chosen as the material for this study. Only carrots with a length longer than 200 mm and a maximal diameter larger than 30 mm were selected for the experiments. The fresh carrot was cleaned, and tissue was used to remove superficial water. Slicing was performed using two thin parallel knives, with the distance between the two knives adjusted to ensure a constant slice thickness of 2 mm. Half of the carrot slices were stored in a glass bottle in a refrigerator, while the other half were subjected to ultrasound pre-treatment before the drying experiments were carried out.

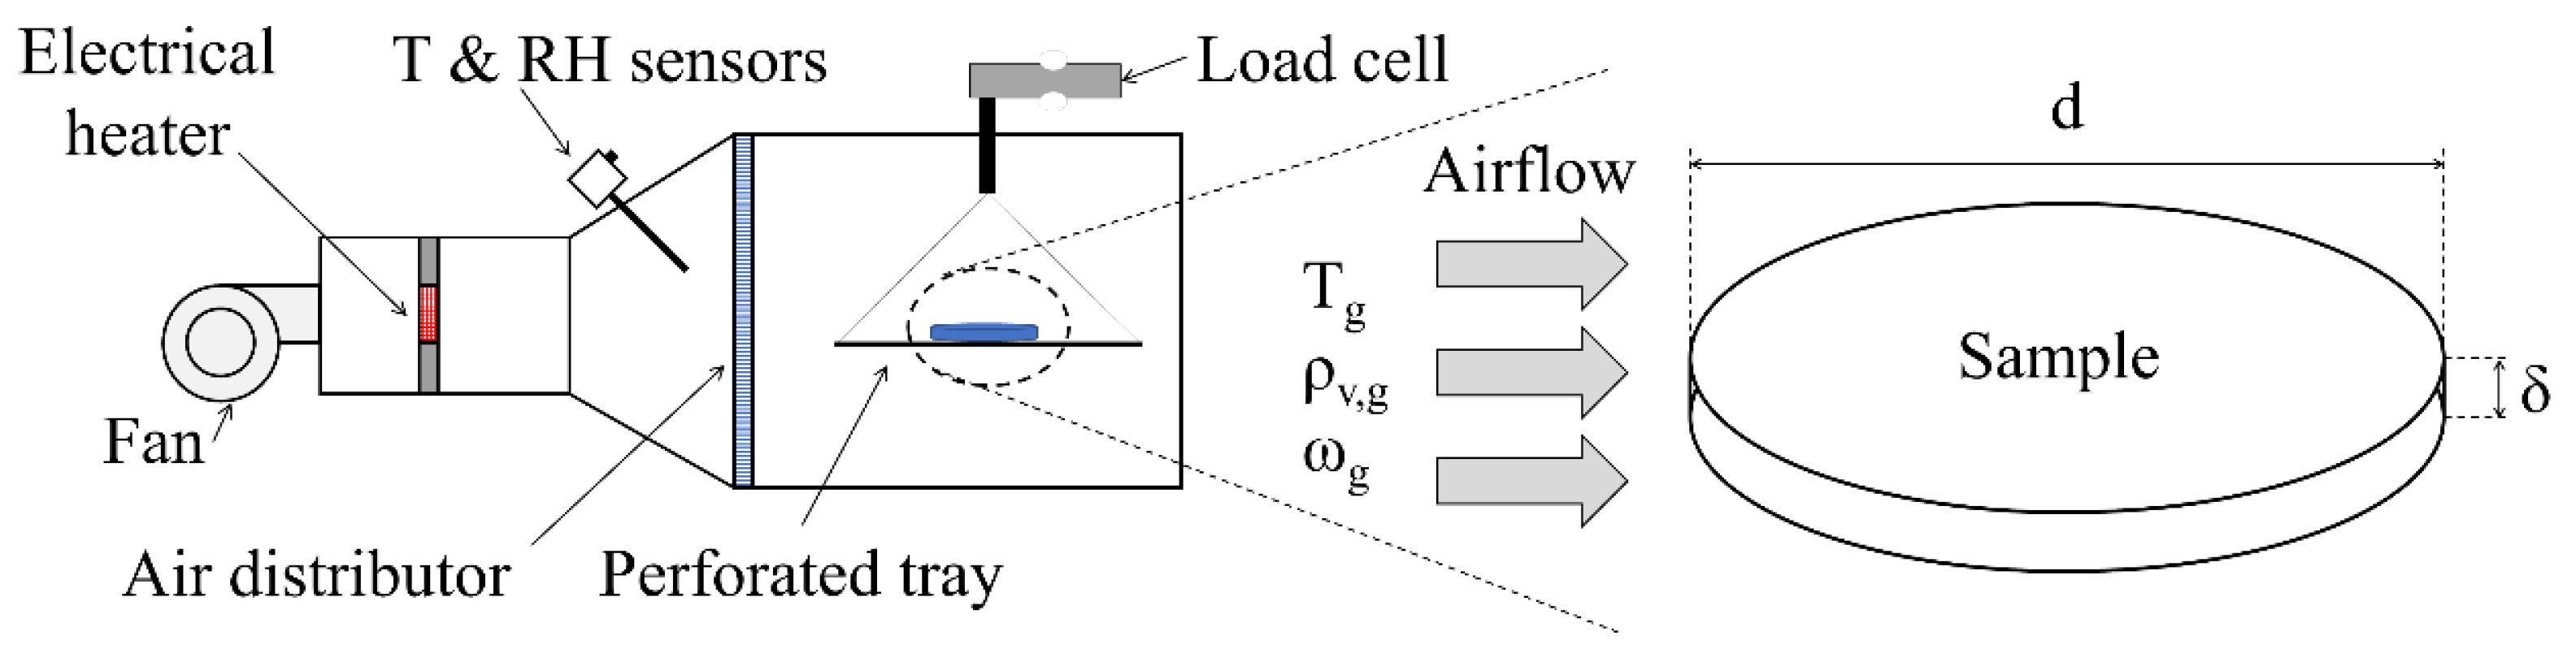
2.2. Experimental Apparatus

An SUS 304 tank with a volume of 0.8 L filled with distilled water was used for the experiment. A US transducer with a frequency of 40 kHz and power of 50 W was attached to the tank’s outer surface. For the pre-treatment, the carrot slices were soaked in water under the effect of ultrasound. It has been demonstrated that extended US pre-treatment time can accelerate the drying process [21]. However, when the pre-treatment time was extended from 30 min to 60 min, the discrepancies in moisture-content evolutions over time were negligible. Additionally, the cavitation effect may lead to the disruption of the carrot’s cell wall, allowing the release of various bioactive substances such as antioxidant compounds, carotenoids, and flavonoids into the surrounding liquid medium [20]. Following pre-treating, any superficial water on the sample surface was removed using tissue before the samples were stored for the drying experiments.
The experimental system used in this work is schematically presented in Figure 1. Air was introduced into the drying chamber through a variable-speed fan, and the air temperature was controlled using a controller. To maintain uniform air velocity, a perforated distributor was employed. The sample was placed in a plastic wire mesh tray with a mesh size of 10 mm × 10 mm, which was connected to a load cell (1006—Pavone Italia) before being connected to a transducer (DAT500—Pavone, Concorezzo, Italia) with an output range of 0–5 V. The temperature and relative humidity of the drying agent were continuously monitored using a datalogger (MCC-2416, Measurement Computing Corporation, Norton, USA). The air velocity, measured with a hot wire anemometer (HHF-SD1—Omega, Norwalk, USA), was maintained at a constant rate of 0.9 m/s by fixing the fan speed, while the air temperature was varied between 30 °C and 50 °C. This low drying temperature was chosen to avoid excessive cell damage, as higher temperatures, such as 60 °C, can lead to increased cell damage [21]. For each drying condition, the experiments were performed five times, resulting in a total of 30 experiments performed under 6 different drying conditions. The drying experiments were conducted when the change in sample mass was less than 0.01 mg after 3 min. The appearance of the dried products was captured using a camera and subjected to color analysis.

2.3. Determination of Moisture Content

The moisture content of the fresh carrot was determined following standard ASTM D4442-92. The sample was dried at 103 ± 2 °C for 2 h in a forced convection drying chamber Dry Cabinet GMP500 (Thermo-plus). Dealing with an assumption that the volatile chemical released during the oven-dry process is negligible, the oven-dry mass was considered as the solid mass M d r y . The intermittent moisture content of the sample was calculated as
X i ( t i ) = M i ( t i ) M d r y M d r y
where Xi (kg water/kg dry solid) and Mi (kg) are, respectively, the moisture content and the mass of the sample at time step ti.

3. Drying Model

3.1. Diffusion Model

The diffusion-drying model is used in this work to describe the drying process. The underlying idea of the diffusion model was that the mixture of liquid water and water vapor was treated as a single phase named moisture. Based on Fick’s law of diffusion, the driving force of the moisture transport was assumed to be the gradient of the moisture content. The mass conservation of moisture was written as the evolution of moisture concentration due to the moisture diffusion flow
ρ 0 X t = [ D e f f ( ρ 0 X ) ] ,
where ρ 0 = M d r y V (kg dry solid/m3) is the apparent density of the dried medium. The effective diffusivity of moisture in the porous medium Deff (m2/s) is defined as the ratio between the moisture flux and the moisture-content gradient. Indeed, the convection–diffusion transport mechanism of the liquid-vapor mixture in the heterogeneous void space of the food during the process is lumped into this artificial effective diffusion coefficient concept. The Arrhenius equation is classically used to represent the relationship between the diffusivity and temperature to estimate the effective moisture diffusivity
D e f f = D 0 exp ( E a R T ) ,
where D 0 is the Arrhenius factor (m2/s), E a denotes the activation energy [kJ/mol]. The relationship shown in Equation (3) is named the temperature-dependent effective diffusivity model. Recently, Kumar et al. proposed that the moisture diffusivity of food products can be represented as a function of their moisture content as [28]
D e f f = D r e f ( 1 + X 0 1 + X ρ l ( 1 + X ) + ρ 0 X ρ l ( 1 + X 0 ) + ρ 0 X 0 ) 2 ,
where Dref and X0 are the reference moisture diffusivity and the initial moisture content, respectively. Equation (4), which is referred to as the moisture-dependent effective diffusivity model, shows that the effective moisture diffusivity reduces with the reduction in moisture content. This hypothesis can be explained as the liquid water accumulated in the large pores of the medium is removed sooner and easier than from the small pores due to the capillary action and Kelvin effect. Firstly, the liquid in the large pores is pumped to the small pores under the capillary force, and it thus keeps the small pores wet longer. Secondly, since the concave liquid curvatures are formed in the partly wetted pores of hygroscopic materials, the equilibrium vapor pressure at the liquid–gas interface becomes smaller with the reduction in pore size, which is known as the Kelvin effect. Therefore, the vapor pressure difference between the gas phase and the liquid surface reduces, and the internal vaporization is restrained in tiny pores. Conclusively, the effective moisture diffusivity becomes smaller with the order of the dehydration process from large to tiny pores.
It is worth noting that the moisture-dependent effective diffusivity model does not directly consider the influence of drying temperatures on volume shrinkage. The experimental findings suggest that higher drying temperatures promote volume shrinkage, resulting in a reduction in pore size as the drying temperature increases. Consequently, it is reasonable to anticipate that the effective moisture diffusivity is influenced by both moisture content and drying temperature. In the context of the hot-air drying of carrots, the moisture diffusivity has been well represented as an exponential function of both moisture content and temperature. Therefore, in this study, to examine the impact of ultrasound pre-treatment on drying kinetics, the moisture-dependent effective diffusivity model is adapted to incorporate the additional influence of temperature as
D e f f = D 0 exp ( E a R T ) ( 1 + X 0 1 + X ρ l ( 1 + X ) + ρ 0 X ρ l ( 1 + X 0 ) + ρ 0 X 0 ) 2 ,
with D r e f = D 0 exp ( E a R T ) .
The energy balance equation is written as the change in temperature caused by the heat conduction in the medium and the enthalpy flow of the water diffusion, namely [29,30]
t [ ( ρ 0 c p , s + ρ 0 c p , l X ) T ] [ D e f f c p , l T ( ρ 0 X ) ] [ λ e f f ( T ) ] = 0 .
In Equation (6), c e f f (J/kg.K) and ρ e f f (kg/m3), respectively, denote the effective heat capacity and density of the medium; c p , l (J/kg.K) denotes the specific heat capacity of liquid water; and λ e f f (W/m.K) denotes the effective thermal conductivity of the porous medium. These thermal properties of carrots are determined from their constituents, according to [31]
ρ = 1 x i ρ i ;   c = x i c i ;   and   λ e f f = x i λ i ρ i x i ρ i ,
where xi is the mass fraction of food components including protein, fat, carbohydrate, fiber, ash, and gas. Particularly, the mass fraction of the components of fresh carrots is presented in Table 1. A detailed description of the physical properties (density, specific heat capacity, and thermal conductivity) of the constituents can be found in [32].
To solve the differential equation system of the diffusion model (Equations (2) and (6)), boundary conditions are needed. Particularly, a thin layer of carrot with a radius of d and thickness of δ is subjected to atmospheric pressure hot-air drying with a constant drying temperature of Tg and a relative humidity of RH (c.f. Figure 1). The carrot slice is initially at a uniform temperature of T0 and moisture content of X0 (kg water/kg dry solid). Since the diameter of the slice is more than ten times the thickness, the heat and mass transfer processes are assumed to be one-dimensional. A one-dimensional coordinate system with the origin located at the sample center is used to solve the drying model, the boundary equations of the developed heat and mass transfer model at the sample surface, i.e., z = δ 2 , are written as
j w n = β ( ρ v , s u r f ρ v , g ) ,
j e n = α ( T g T s u r f ) + Δ h e v p β ( ρ v , s u r f ρ v , g )
In Equations (8) and (9), n denotes the outward unit normal vector pointing out of the sample surface, and jw and je are the vapor and heat fluxes transferred from the sample surface towards the bulk steam, respectively. For a single slice of carrot with the flow configuration presented in Figure 1, the heat and mass transfer coefficients (α and β, respectively) are determined from the correlations
N u = 2 + 0.616 R e 0.52 Pr 1 3 ,
S h = 2 + 0.616 R e 0.52 S c 1 3
In Equations (10) and (11), N u = α d λ g , Re = ω g d υ g and Pr = c p , g μ g λ g are the dimensionless Nusselt, Reynolds, and Prandtl numbers, respectively. Additionally, S h = β d δ v a , S c = υ g δ v a denote the Sherwood and Schmidt numbers. The characteristic diameter ds used in the calculation of the Nusselt, Reynolds, and Sherwood numbers is obtained by the ratio of the surface area over the perimeter of the projection perpendicular to the airflow [29],
d s = 2 π d δ + π d 2 2 4 δ + 2 d .
To calculate the mass and energy fluxes at the sample surface (c.f. Equations (8) and (9)), the vapor density at the sample surface needs to be known. In this study, based on the ideal gas theory, it can be computed from the vapor pressure as
ρ v , s u r f = p v , s u r f R μ v T s u r f .
The vapor pressure p v , s u r f is calculated from the saturated vapor pressure p v , s a t ( T s u r f ) and the sorption isotherm of the carrot aw as
p v , s u r f p v , s a t ( T s u r f ) a w ,
where p v , s a t ( T s u r f ) is the saturated pressure of pure water at the surface temperature T s u r f and is computed from the Antoine equation [32] as
p v , s a t ( T s u r f ) = exp ( 23.462 3978.205 233.349 + T s u r f [ o C ] ) .
To model sorption isotherms, several models, such as the Langmuir model, the BET model, and the Henderson model, can be used. In this work, the GAB equation, which effectively represents the impact of equilibrium water activity in the range of 0.1 to 0.9 on moisture content, is used to describe the sorption isotherm curve of the carrot [5]
X = b 0 b 1 b 2 a w ( 1 b 1 a w ) ( 1 b 1 a w + b 1 b 2 a w ) ;   b 1 = b 10 exp ( b 11 R T ) ;   and   b 2 = b 20 exp ( b 21 R T ) ,
where the parameters are taken from [33]: b 0 = 21.2 , b 10 = 5.94 × 10 5 , b 11 = 28.9 , b 20 = 8.03 , and b 21 = 5.49 .
For the center of the sample z = 0 , the symmetrical boundary conditions are recalled
j w n = 0   and   j e n = 0 .
The developed heat and mass transfer model (Equations (2) and (5)) is numerically solved using the finite volume method. A detailed description of the spatial discretization procedure can be found in our previous studies [29,32]. The resulting time-dependent differential equation system is solved using a MATLAB code in which the ode23s function—a MATLAB non-linear solver—is incorporated. Additionally, a mesh independence study is performed to ensure the solution’s accuracy. It is confirmed that when the number of grid nodes exceeds 50, the solutions and time step are less than 0.1 s, and the mean temperature and moisture-content evolutions over time remain unchanged with the refinement of mesh. Thus, the numerical solution obtained with a grid of 50 nodes and a time step of 0.1 s is used in the rest of this paper.

3.2. Conveyor-Belt-Dryer Model

As discussed, the diffusion model considers the heat and mass transfer process of a single slice, so it cannot be applied to modeling the drying process of an actual dryer where thousands of slices interact with the drying agent. In this section, a mathematical model of a co-current conveyor-belt dryer is developed. A systematic sketch of the belt dryer is presented in Figure 2. The steady-state operation of the dryer is assumed herein.
The interaction between the wet solid and the drying agent can be described based on the principle that the mass flow rate of dry solid remains unchanged, while the change in the mass of water is attributed to liquid vaporization. The convective thermal energy absorbed by the wet solid from the drying agent serves the dual purpose of heating the wet solid and facilitating evaporation. Thus, the heat and mass balance equations for the wet solid are written as
G s d X = g v d F ,
( G s c s + G s X c l ) d T = α b ( T a T s ) d F Δ h e v p g v d F
where G s (kg dry solid/s) is the mass flow rate of the dry solid, α b (W/m2K) is the convective heat transfer between the wet solid and the airflow, d F = W . d l (m2) is a differential area with W (m) as the width of the belt, l is the length of the belt, and g v is the evaporation flux from the wet solid (kg/m2s).
Similarly, the moisture content of the airflow varies as a result of the vapor evaporated from the wet solid. Additionally, alterations in the total energy of the airflow occur due to the convective thermal energy transferred to the wet solid and the enthalpy flow of the vapor transported from the wet solid to the airflow. Consequently, the mass and energy conservation equations for the drying agent are expressed as
G a d Y a = g v d F ,
G a d h a = Δ h e v p g v d F α b ( T a T f ) d F
where G a (kg dry air/s) is the mass flow rate of dry air, and h a = c p , a T a + Y a ( Δ h e v p + c p , v T a ) (J/kg dry air) is the specific enthalpy of the humid air. After arrangement, the heat and mass transfer equations of the belt-dryer model can be rewritten in the form of an ordinary differential equation system as
d X d l = g v W G s ,
d T d l = α b ( T a T s ) W G s c s + G s X c l Δ h e v p g v W G s c s + G s X c l
d Y a d l = g v G a W
d h a d l = Δ h e v p g v W α b ( T a T f ) W G a
For solving this system of differential equations, the evaporation flux from the product’s surface needs to be known. Theoretically, the diffusion model can be applied to accurately describe the heat and mass interaction of the product, however, the computational cost of solving the partial differential equation system of the diffusion model is expensive. This high computation cost becomes a serious problem when the calculation needs to be performed simultaneously for thousands of slides. Thus, this complicated diffusion model is reduced to a semi-empirical model, named the characteristic drying-curve model. The internal mass transfer resistance is omitted, and the drying process is controlled solely by the external mass transfer resistance between the airflow and the product’s surface. This simplification is acceptable for thin slices. The drying process is divided into the first and the second drying periods. During the first drying period, when the moisture content X is high, the liquid is strongly pumped to the surface under capillary action. It helps to keep the sample surface wet enough that it can be considered as a purely liquid surface. Thus, the evaporation flux can be computed as
g v , I = β ( ρ v , s a t ρ v , g ) .
The second drying period commences when the sample surface is partly dried. The drying rate is lowered due to the combination of weaker capillary action and a smaller wetted area. Thus, compared to the evaporation flux of the first drying period, the drying rate now is reduced by a drying rate retardation coefficient f written as
g v , I I = f β ( ρ v , s a t ρ v , g ) .
The transition point between the first and second drying periods is named the critical point. To compute the evaporation flux, the drying rate retardation coefficient f and the critical moisture content Xcr are established from the simulation results of the diffusion model. The critical moisture content Xcr is determined at the time when the drying rate reduces significantly. The drying rate retardation coefficient f is considered as a regression
f ( X n ) = p   X n 1 + ( p 1 ) X n .
In Equation (28), X n = X X e q X c r X e q is the normalized moisture content and p is a fitted constant. The proposed conveyor-belt-drying model is solved by using a built-in solver on Matlab software 2023b, i.e., ode23s. As with the diffusion model, the mesh-independent convergence of the conveyor-belt-drying model is checked. A mesh of belt length with 1,000,000 nodes and a time step of 1 s are used in the simulations reported in this work.

4. Results and Discussion

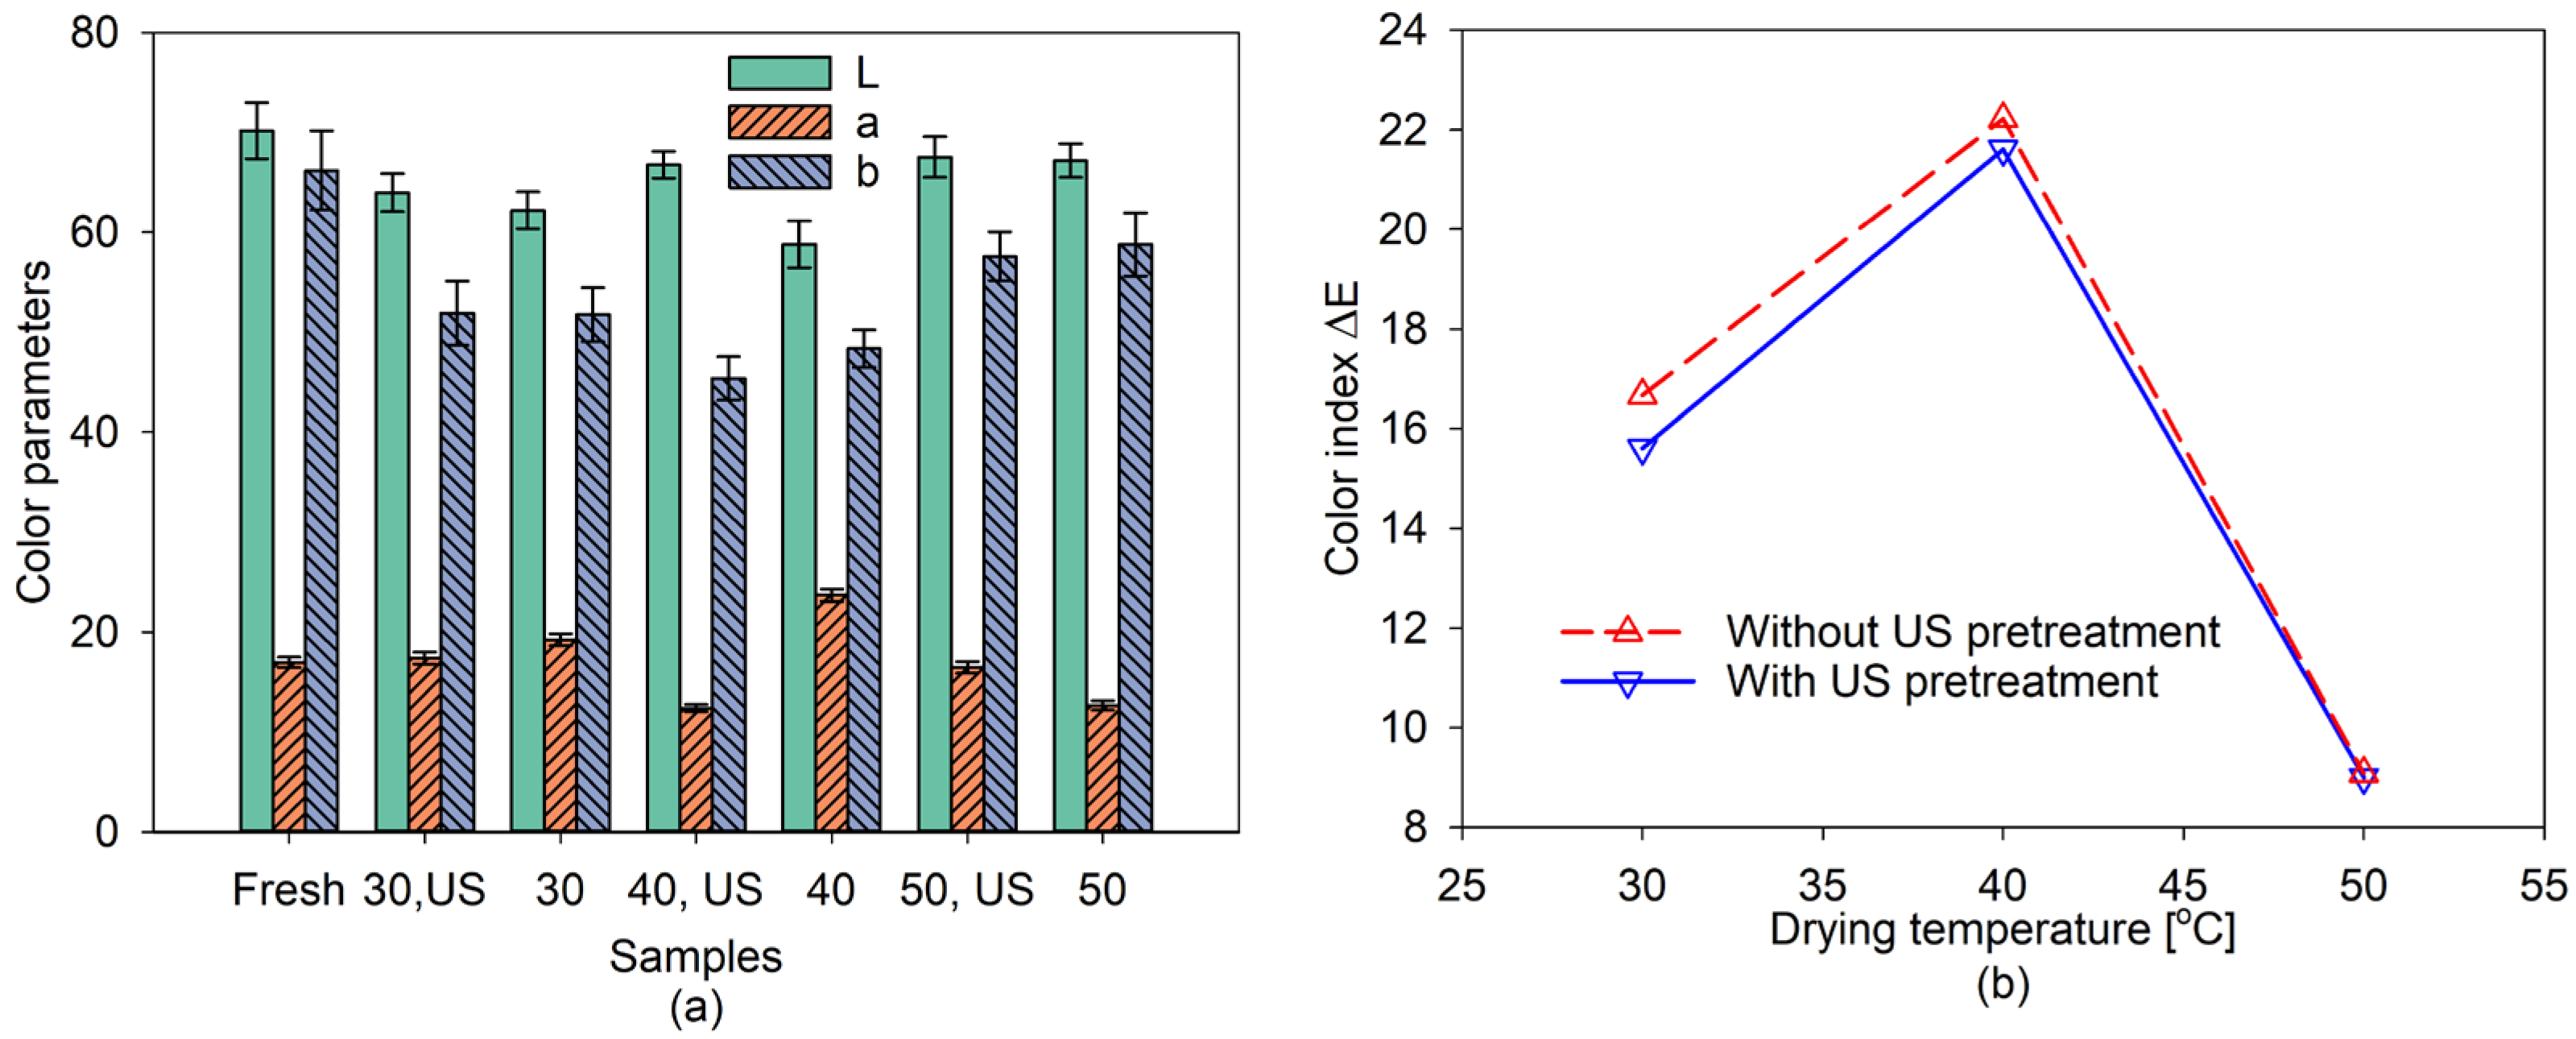
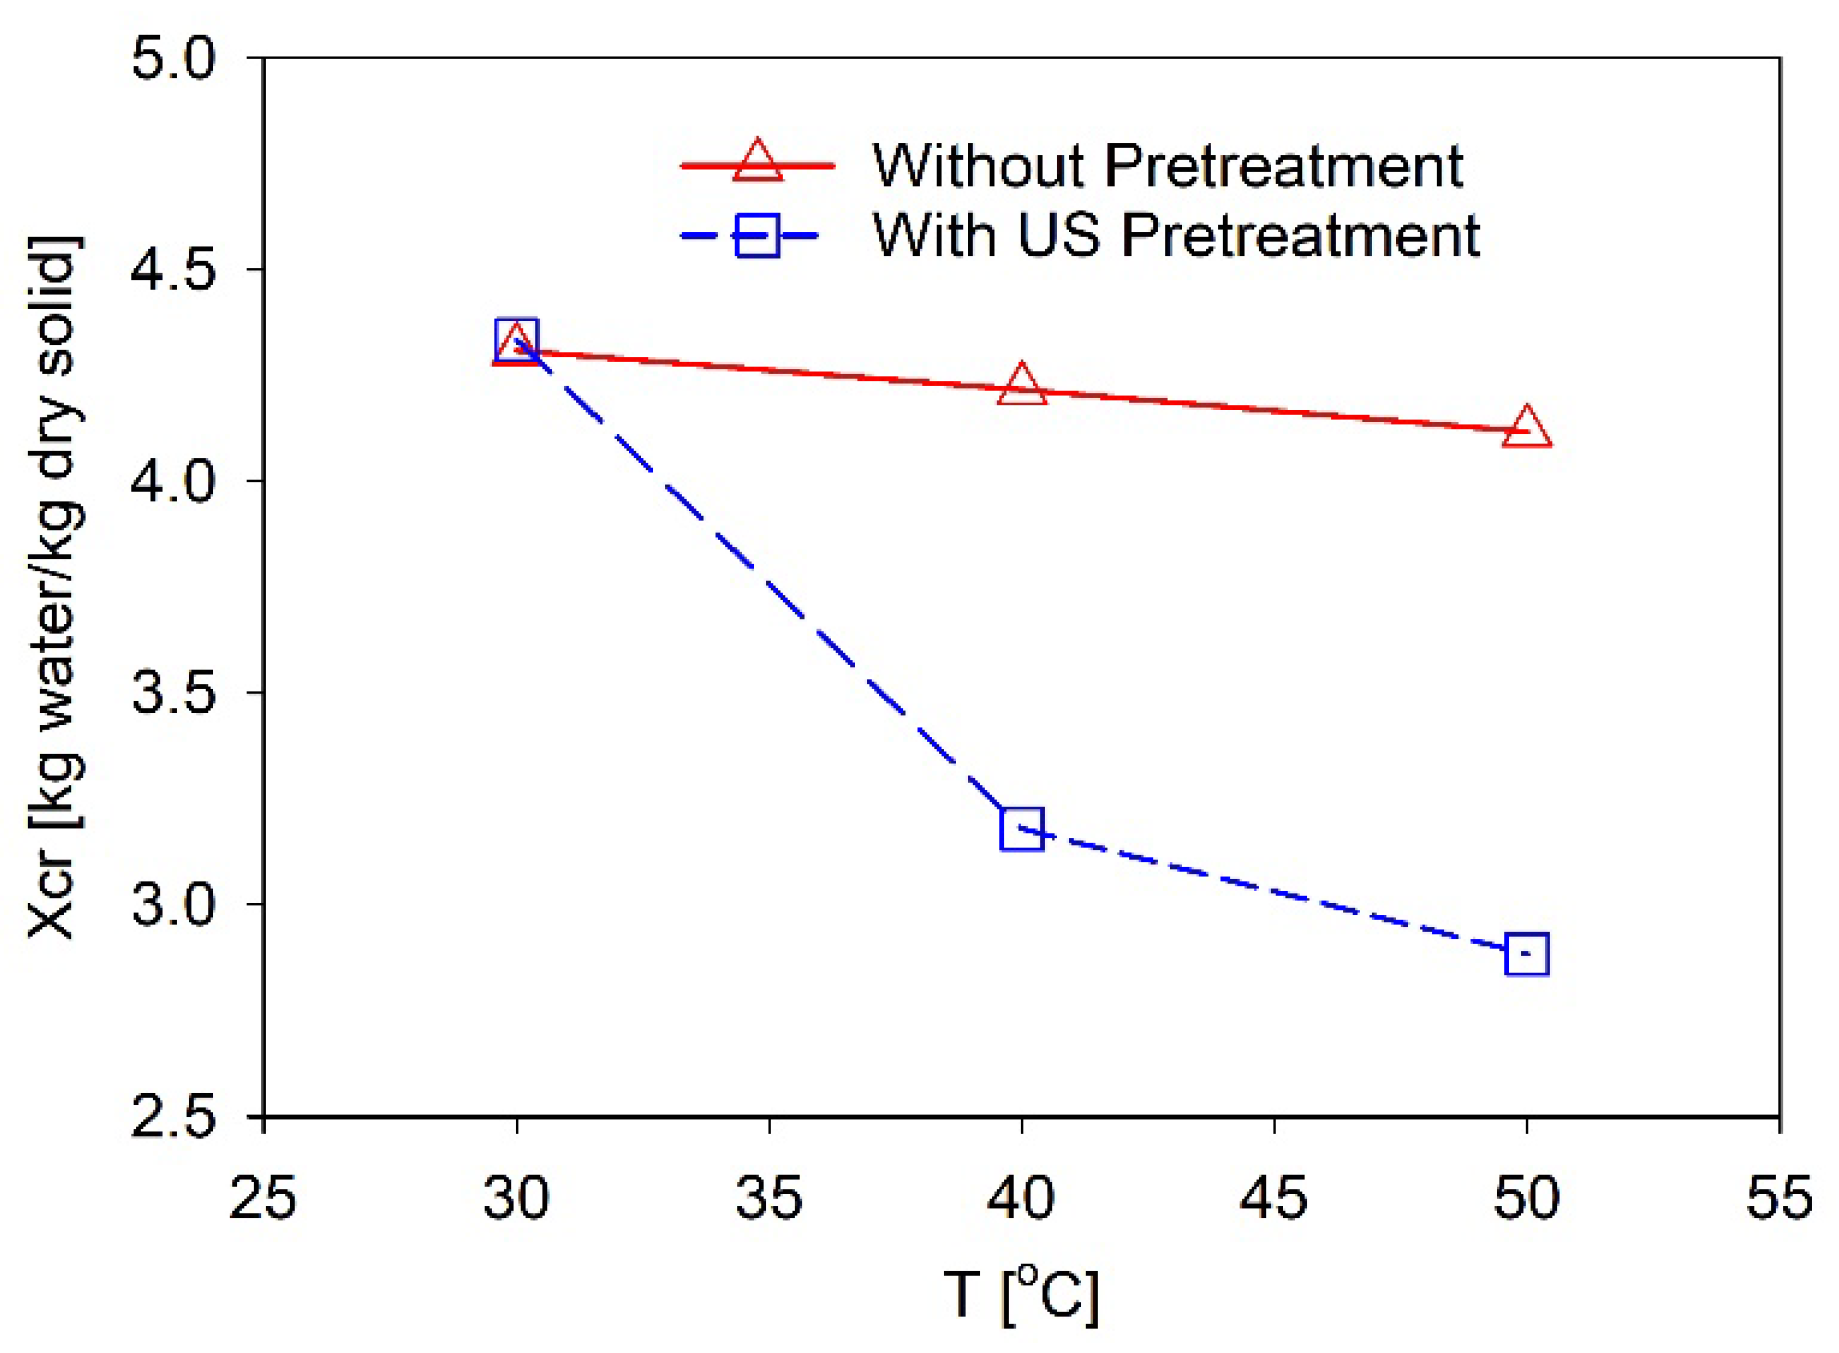
4.1. Influence of Ultrasound Pre-Treatment on Product Quality

In this work, the quality of the drying product is investigated by comparing the color of fresh and dried carrots. To ensure the accuracy of the appearance assessment, the drying processes were triply repeated for 100 g of carrot slices in each experiment, using a large tray. Exemplary images of fresh carrots and carrots dried under different drying conditions are presented in Figure 3. Furthermore, the color of the dried sample was measured using a Colorimeter CHN SPEC CS-10. The samples were explored under a standard light source. Reflected light was captured across the entire visible spectrum and electrically filtered into narrow bands of color. In CIELAB color space, color is characterized by three parameters, namely L, a, and b [29]. The L value, varying in range from 0 to 100, is used as an indicator of brightness. The a value indicates chromaticity on a green to red axis with the respective values of −60 and of 60; b indicates chromaticity on a blue (i.e., b = −60) to yellow axis (i.e., b = 60). Compared to the fresh carrot, the color changes (ΔE) of dried product for the total color difference is computed as [34]
Δ E = ( L L f r e s h ) 2 + ( a a f r e s h ) 2 + ( b b f r e s h ) 2 .
The color parameters L, a, b, and ΔE are presented in Figure 4. As can be seen, a smaller Δ E obtained from the dried sample pre-treated by US indicates that the US pre-treatment favors the color preservation of the carrot. However, with a high drying temperature Tg of 50 °C, the ΔE deviation in cases with and without US pre-treatment becomes marginal. It implies that US pre-treatment significantly enhances the color preservation of carrots only at low drying temperatures (i.e., 30 °C and 40 °C). Additionally, for both US pre-treated and non-US pre-treated drying products, the color changes at a drying temperature Tg of 40 °C are the highest. It can be expected that the color changes were due to both drying time and drying temperature. For instance, at Tg = 40 °C, the incorporation of high temperature and long drying time leads to a significant color change. At Tg = 50 °C, although the drying temperature is the highest, the shorter drying time is the main reason for the marginal color change.

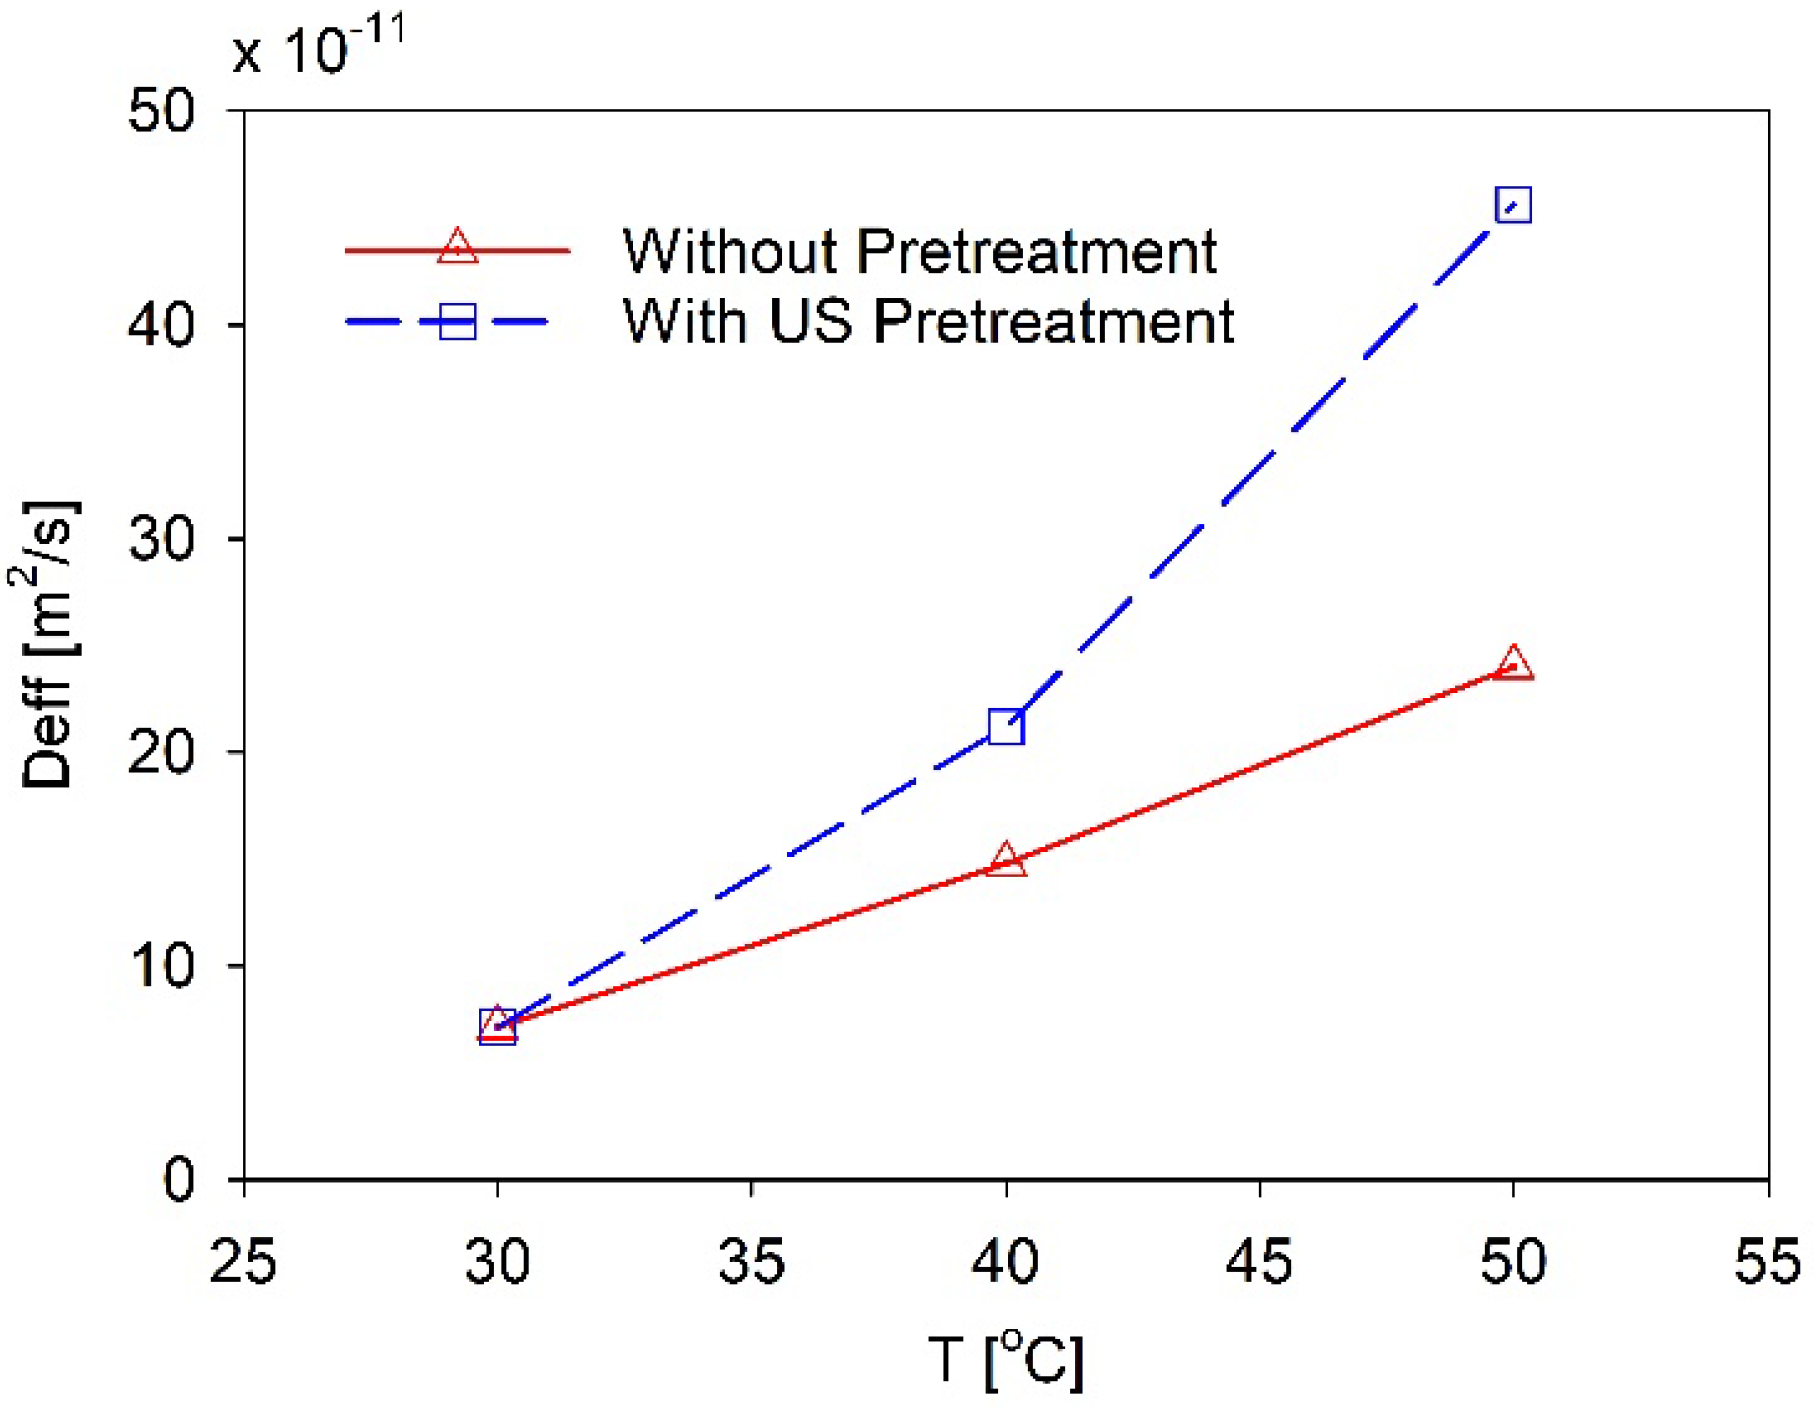
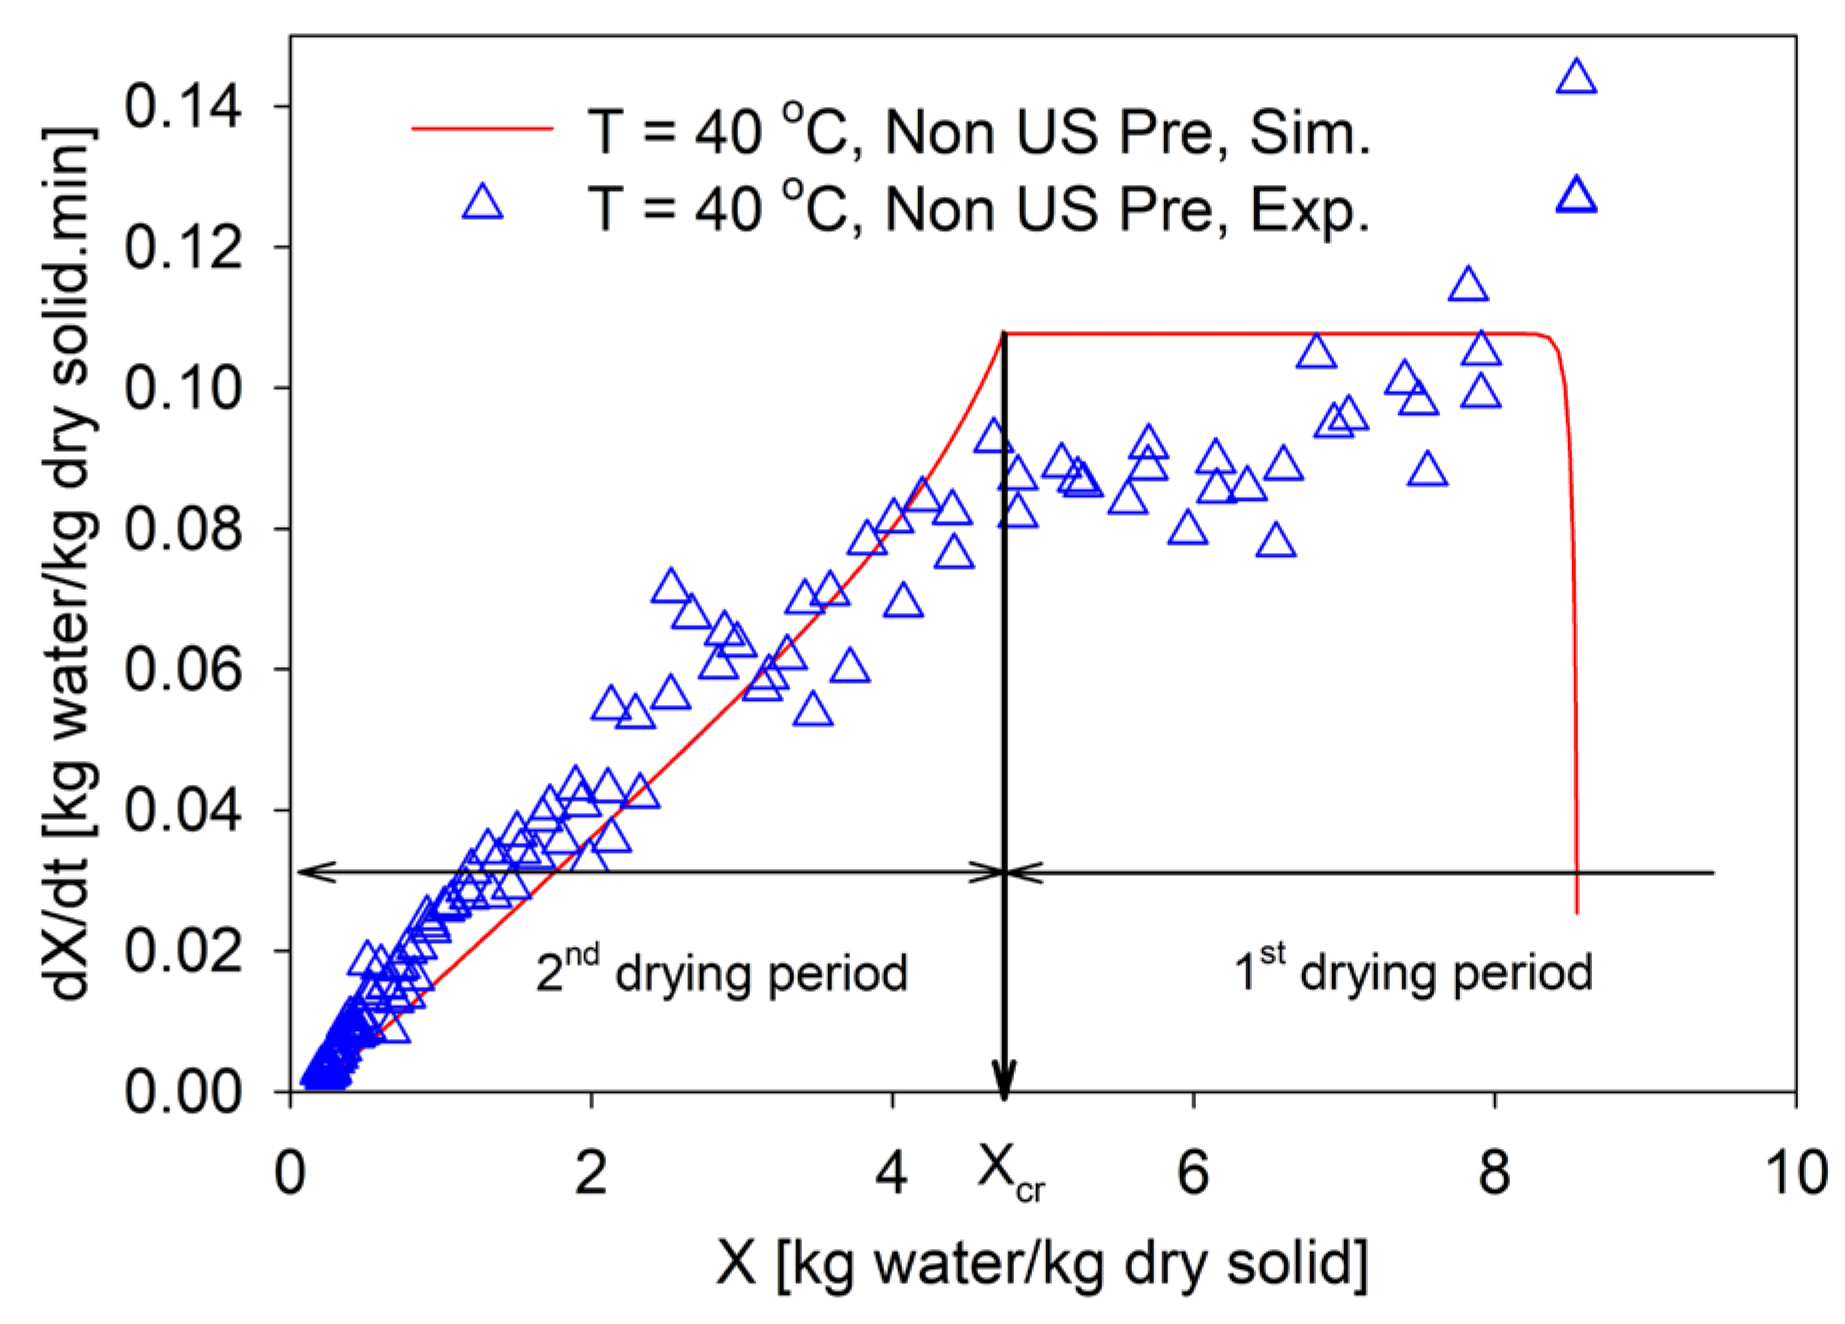
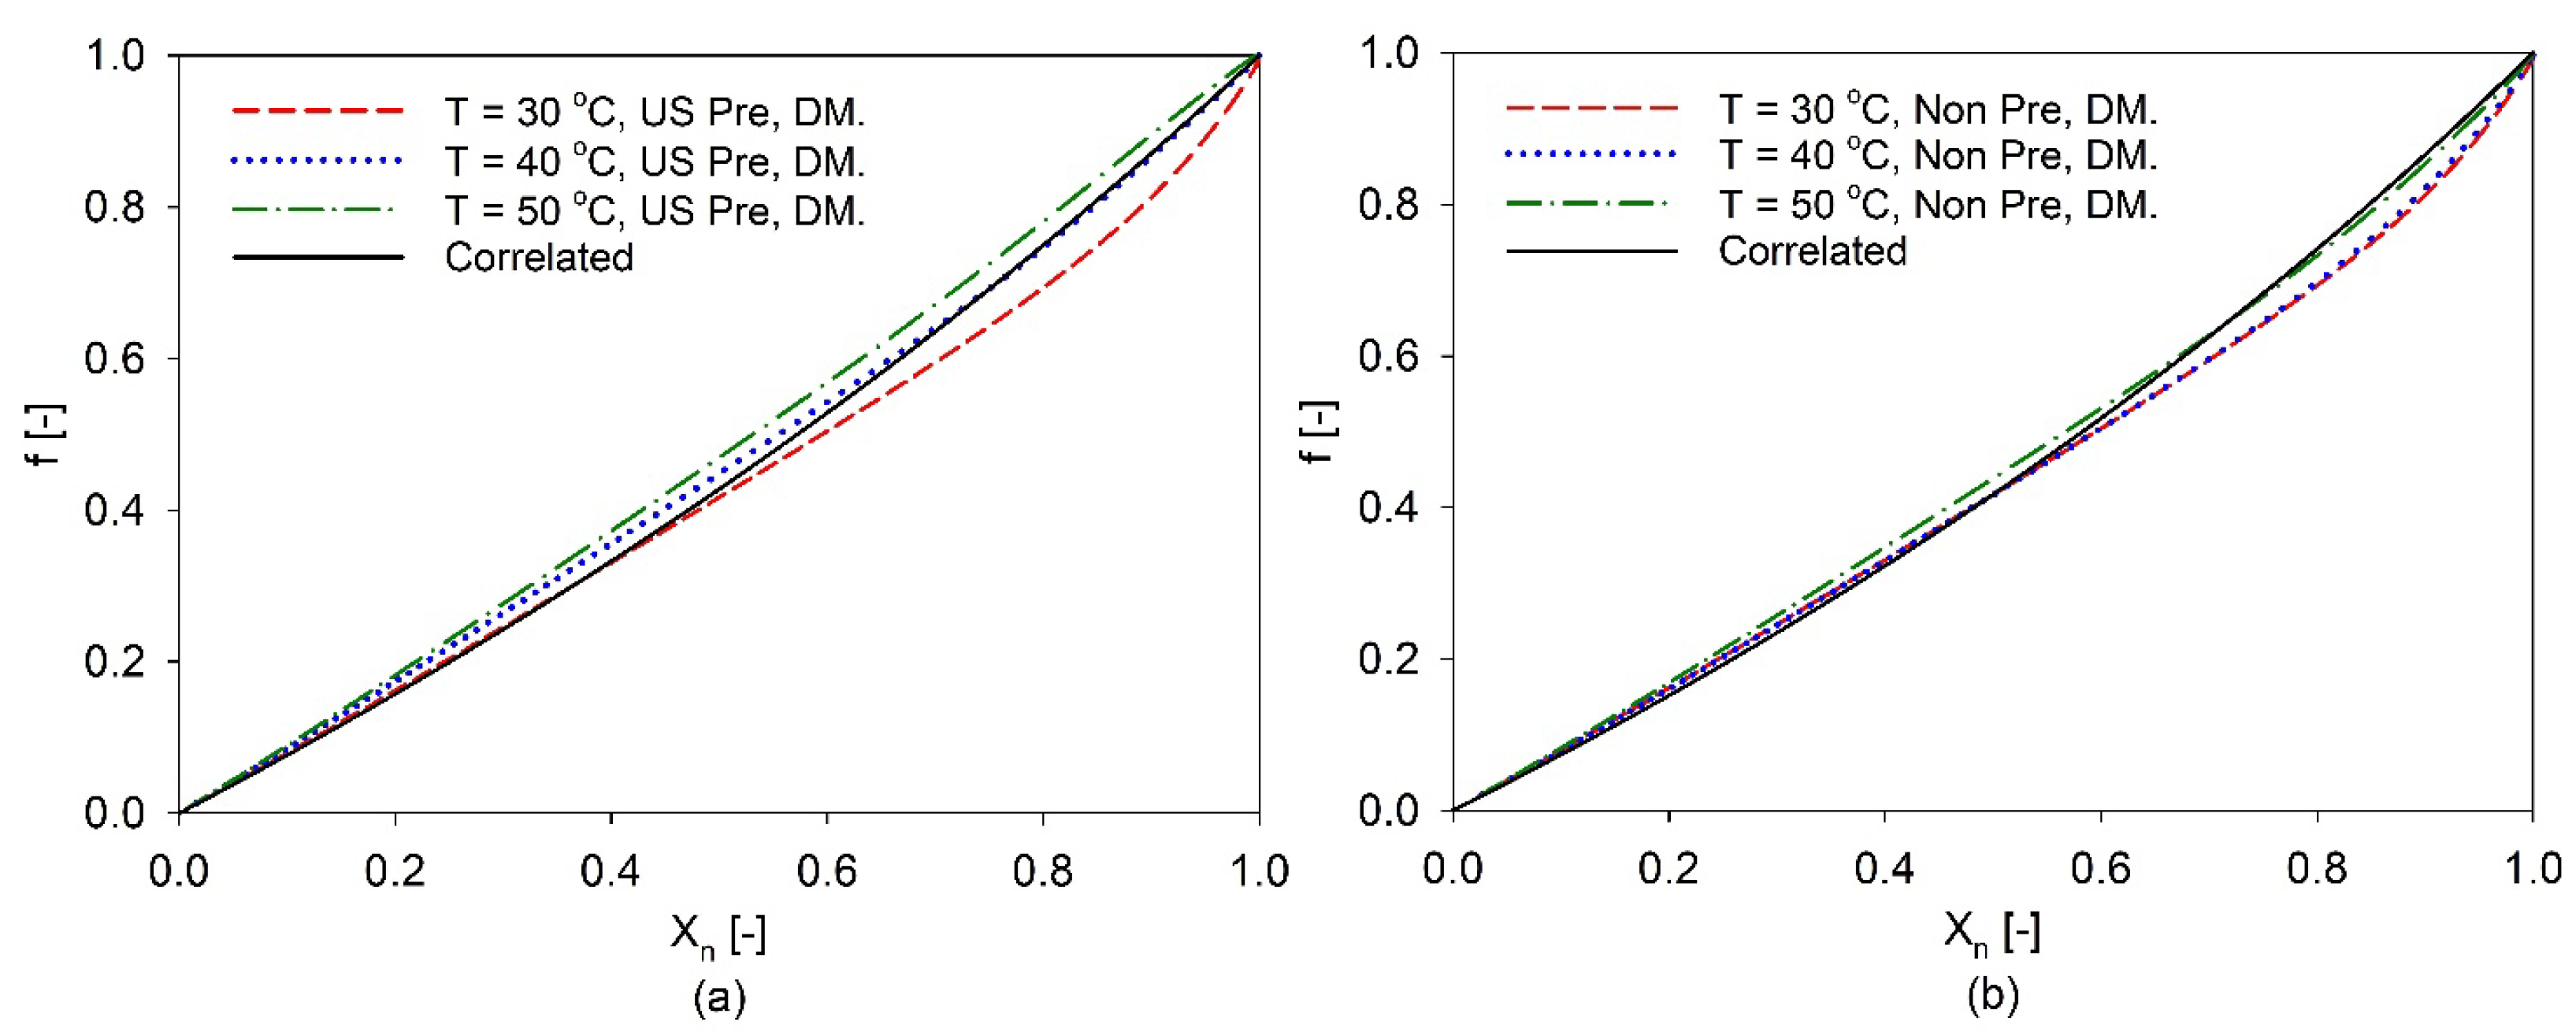
4.2. Influence of Ultrasound Pre-Treatment on Drying Kinetics of a Single Slice

In addition to the quality properties, the influence of US pre-treatment on the mass transport property is explored. The effective moisture diffusivity is determined numerically by using the inverse method. An objective optimizing function g ( D r e f ) is defined as the sum of the square of the difference between numerical and experimental moisture content, i.e., X i , s i m and X i , exp , as
g ( D r e f ) = i = 1 : e n d ( X exp ( t i ) X s i m ( t i ) ) 2 ,
where ti denotes the time interval i of the data sampling. Thus, the value of reference moisture diffusivity D r e f is obtained while the discrepancy between numerical and experimental moisture-content evolutions is minimized. Both optimized numerical and experimental moisture-content evolution of carrot slices during drying processes are plotted together in Figure 5. As can be seen, a good agreement between numerical and experimental drying histories indicates the reliability of the obtained reference moisture diffusivity. Based on the determined values of reference moisture diffusivity, the activation energy E a and Arrhenius factor D 0 are fitted, these parameters for US pre-treatment and non-pre-treatment drying processes are presented in Table 2. As can be seen in Figure 6, the effective moisture diffusivity has been enhanced significantly by the US pre-treatment. The reference moisture diffusivity increases by more than 30% when the US pre-treatment is applied. The obtained benefits of US pre-treatment on drying kinetics and product color align with previous studies where the effective moisture diffusivity was shown to increase by up to 120%, resulting in a drying time reduction of approximately 20% and improved product quality for carrots and different fruits [35,36,37,38,39]. The improved heat transfer in cellular materials due to US pre-treatment can be attributed to cavitation, the sponge effect, and the formation of microchannels. The formation of microchannels, resulting from the ruptures of tissues and cells caused by acoustic cavitation, is a significant contributing factor [16]. This implies that the duration of pre-treatment, the nature of the propagation solution, and the temperature, can directly influence the drying acceleration. This hypothesis should be investigated through X-ray micro-computed tomography measurements in future research.
Due to the penetration of liquid water into the sample during the soaking time, the initial moisture content also increases, i.e., the average initial moisture content of a fresh carrot of 8.60 kg water/kg dry solid, and the average moisture content of a soaked carrot of 8.97 kg water/kg dry solid, resulting in the prolongation of drying time. For a comfortable comparison, the numerical simulations are additionally performed with identical initial conditions of X0 = 8.8 kg water/kg dry solid, T0 = 20 °C, and Tg = 50 °C, pv,g = 2000 Pa for both US pre-treatment and non-pre-treatment drying processes. The results are plotted together in Figure 7. As can be seen, for the US pre-treated case, the sample surface remains wet longer due to the larger moisture diffusive flux. Thus, the surface temperature remains at the saturated adiabatic temperature of the drying agent for a longer time. This may be a reason helping to explain the lower color change obtained with carrot slices pre-treated by the US compared to the non-pre-treated product.

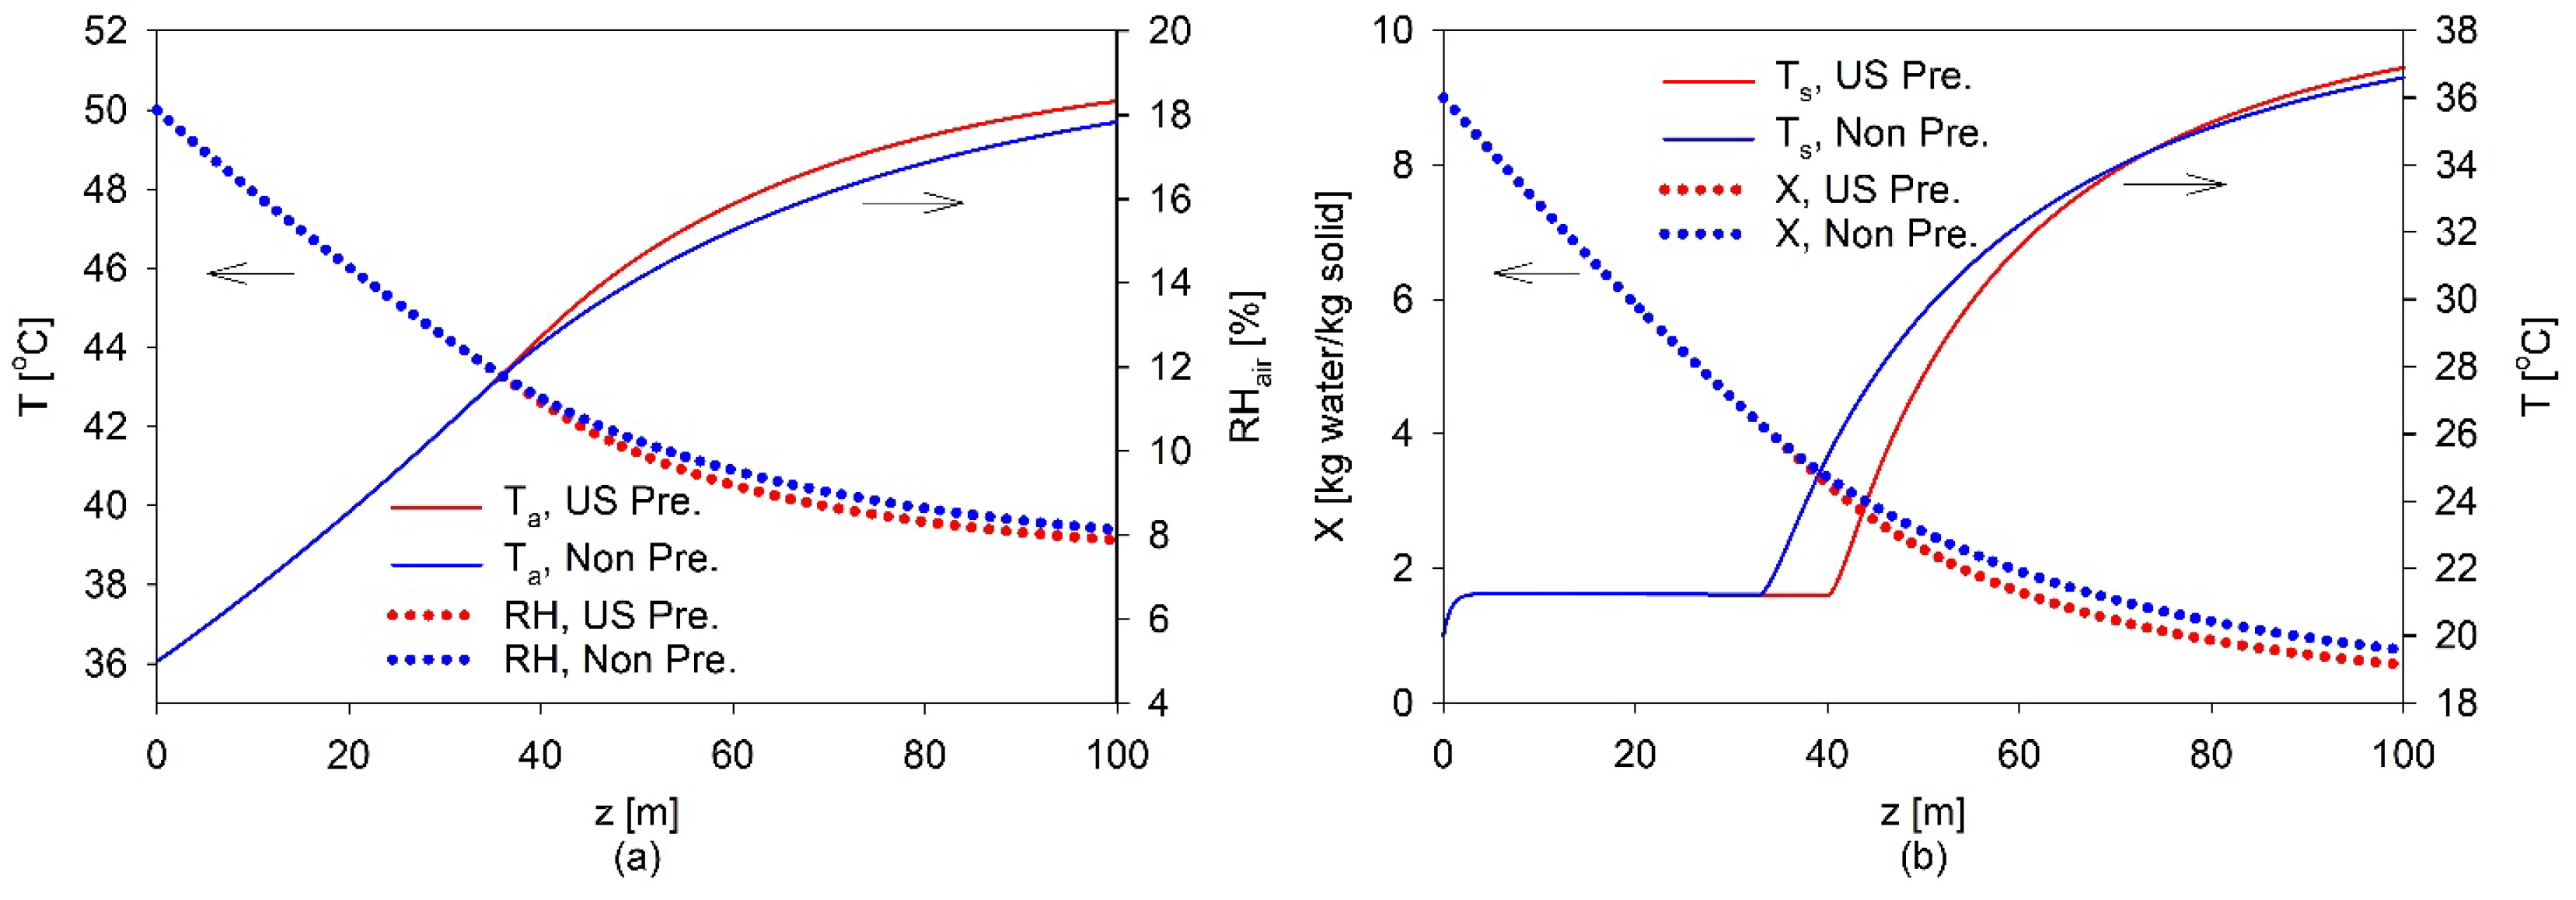
4.3. Influence of Ultrasound Pre-Treatment on Drying Kinetics of Conveyor-Belt Dryer

Based on the numerical results, the parameters of the characteristic drying-curve model are established. As can be seen in Figure 8, the numerical drying kinetic curve can be divided into two periods. In the first drying period, the drying rate remains more or less constant with a high value. When the moisture content is lower than the critical moisture content, the drying rate drops quickly, and the second drying period commences. This drying behavior has been observed in the experimental data as well. The critical moisture content Xcr is determined from the numerical drying curve at the transition point between these two periods. The impact of drying temperature and US pre-treatment on the critical moisture content is plotted in Figure 9. As can be seen, the critical moisture content reduces when the drying temperature increases. It can be reasoned that at high temperatures, a large value of the effective moisture diffusivity (Figure 5) can help to sustain the sample surface sufficiently wetted for a longer period. Additionally, the effective moisture diffusivity is enhanced by the US pre-treatment; therefore, a lower critical moisture content can be observed compared to the non-pre-treatment drying process.
Afterwards, the drying rate retardation coefficient f of the second drying period is computed as the ratio between the temporal drying rate and the drying rate at the transition point. The numerical drying rate retardation coefficient f is correlated as a function of the normalized moisture content Xn using Equation (28). The result indicates that at high temperatures, the relationship between Xn and f approaches linearity. However, for the sake of model simplicity, the data obtained from different temperatures are all fitted together. Values of p = 0.718 and p = 0.746 are used to represent the drying rate retardation coefficient f for the non-pre-treatment and US pre-treatment drying processes, respectively. The discrepancy between the correlated characteristics drying curve and the numerical drying curve obtained from the diffusion model is presented in Figure 10. As can be seen, the correlation using Equation (28) fairly reflects the numerical drying behavior. Thus, Equation (28) with p values of 0.718 and 0.746 can be readily integrated into the conveyor-belt-drying model.
The conveyor-belt-drying model simulation is performed on both non-pre-treated and US pre-treated carrot slices, with the operational conditions outlined in Table 3. The simulation results are plotted in Figure 11. The results indicate that US pre-treatment accelerates the drying process in the belt dryer. The solid temperature remains at the adiabatic saturated temperature for a longer time in the dryer compared to the non-pre-treated product. This implies that the first drying period is extended. As a result, the moisture content decreases more rapidly in the US pre-treated carrot slices. To compare the drying effectiveness, the final moisture content of 1 kg water/kg dried solid, 0.75 kg water/kg dried solid, and 0.5 kg water/kg dried solid are chosen to determine the required belt length. The results are presented in Table 4, revealing that US pre-treatment significantly reduces the belt length needed, by approximately 12.9% to 14.7%. The influence of US pre-treatment on the required belt length becomes even more pronounced at lower final moisture content.

5. Conclusions

In this work, a diffusion-drying model, which considers simultaneous heat and mass transfer, was developed to investigate the hot-air-drying process of sliced carrots. Drying scenarios included traditional hot-air drying and US pre-treated hot-air drying. conducted at three bulk air temperatures: 30 °C, 40 °C, and 50 °C. The results show that the color change in dried carrots obtained with US pre-treatment and hot-air drying was slightly lower than in the traditional hot-air-drying process, with reductions of 6.8% and 2.8% at drying temperatures of 30 °C and 40 °C, respectively. Furthermore, the effective moisture diffusivity was determined by fitting experimental moisture-content evolutions over time. This analysis indicated that US pre-treatment significantly enhanced the effective moisture diffusivity by 43% and 90% at drying temperatures of 40 °C and 50 °C, respectively. These results suggest that US pre-treatment can be reasonably applied to improve product quality and reduce the drying time in the carrot dehydration process. In future research, it is recommended to fabricate a pilot scale belt dryer to examine the drying kinetics of carrot and other fruit slices. This will help to demonstrate the energy-saving potential of US pre-treatment. Additionally, economical aspects such as investment cost, operating cost, and the life-cycle cost of a belt dryer with US pre-treatment should be investigated to pave the way for industrial application of this drying technique. Furthermore, the color, texture, flavor, and nutritional content of dried products should be assessed.

Author Contributions

Conceptualization, K.H.L.; methodology, K.H.L.; software, K.H.L., A.K. and T.T.D.N.; validation, K.H.L. and A.K.; formal analysis, T.T.H.T.; investigation, T.T.D.N.; data curation, T.T.H.T.; writing—original draft preparation, writing—review and editing, K.H.L. and T.T.H.T.; visualization, K.H.L., A.K. and T.T.H.T.; funding acquisition, K.H.L. All authors have read and agreed to the published version of the manuscript.

Funding

This work was supported by funding from the Ministry of Education and Training (MOET), Vietnam (Grant number B2021-BKA-012).

Institutional Review Board Statement

Not applicable.

Informed Consent Statement

Not applicable.

Data Availability Statement

The data used to support the findings of this study are included within the article.

Conflicts of Interest

The authors declare no conflict of interest.

References

  1. Mühlbauer, W.M. Joachim Drying Atlas; Woodhead Publishing: Sawston, UK, 2020. [Google Scholar]
  2. Aversa, M.; Curcio, S.; Calabrò, V.; Iorio, G. Experimental Evaluation of Quality Parameters During Drying of Carrot Samples. Food Bioprocess Technol. 2009, 5, 118–129. [Google Scholar] [CrossRef]
  3. Srikiatden, J.; Roberts, J.S. Measuring moisture diffusivity of potato and carrot (core and cortex) during convective hot air and isothermal drying. J. Food Eng. 2006, 74, 143–152. [Google Scholar] [CrossRef]
  4. Srikiatden, J.; Roberts, J.S. Predicting moisture profiles in potato and carrot during convective hot air drying using isothermally measured effective diffusivity. J. Food Eng. 2008, 84, 516–525. [Google Scholar] [CrossRef]
  5. Mujumdar, A.S. (Ed.) Handbook of Industrial Drying, 4th ed.; CRC Press: Boca Raton, FL, USA, 2015. [Google Scholar]
  6. Kiranoudis, C.T.; Maroulis, Z.B.; Marinos-Kouris, D. Model Selection in Air Drying of Foods. Dry. Technol. 1992, 10, 1097–1106. [Google Scholar] [CrossRef]
  7. Zielinska, M.; Markowski, M. Air drying characteristics and moisture diffusivity of carrots. Chem. Eng. Process. Process Intensif. 2010, 49, 212–218. [Google Scholar] [CrossRef]
  8. Ruiz-Cabrera, M.A.; Salgado-Cervantes, M.; Walislewski-Kubiak, K.; Garcίa-Alvarado, M.Y. The Effect of Path Diffusion on the Effective Moisture Diffuslvlty in Carrot Slabs. Dry. Technol. 1997, 15, 169–181. [Google Scholar] [CrossRef]
  9. Eim, V.S.; Urrea, D.; Rosselló, C.; García-Pérez, J.V.; Femenia, A.; Simal, S. Optimization of the Drying Process of Carrot (Daucus carotav. Nantes) on the Basis of Quality Criteria. Dry. Technol. 2013, 31, 951–962. [Google Scholar] [CrossRef]
  10. Doymaz, İ. Drying kinetics, rehydration and colour characteristics of convective hot-air drying of carrot slices. Heat Mass Transf. 2016, 53, 25–35. [Google Scholar] [CrossRef]
  11. Souci, S.W.; Fachmannm, W.; Kraut, H. (Eds.) Food Composition and Nutrition Tables, 6th ed.; MedPharm: Guildford, UK, 2020. [Google Scholar]
  12. Aktaş, M.; Khanlari, A.; Amini, A.; Şevik, S. Performance analysis of heat pump and infrared–heat pump drying of grated carrot using energy-exergy methodology. Energy Convers. Manag. 2017, 132, 327–338. [Google Scholar] [CrossRef]
  13. Gómez-Daza, J.C.; Ochoa-Martínez, C.I. Kinetic aspects of a dried thin layer carrot in a heat pump dryer. Dyna 2016, 83, 16–20. [Google Scholar] [CrossRef]
  14. Chen, Z.G.; Guo, X.Y.; Wu, T. A novel dehydration technique for carrot slices implementing ultrasound and vacuum drying methods. Ultrason. Sonochem. 2016, 30, 28–34. [Google Scholar] [CrossRef]
  15. Prabhanjan, D.G.; Ramaswamy, H.S.; Raghavan, G.S.V. Microwave-assisted convective air drying of thin layer carrots. J. Food Eng. 1995, 25, 283–293. [Google Scholar] [CrossRef]
  16. Jahanbakhshi, A.; Kaveh, M.; Taghinezhad, E.; Sharabiani, V.R. Assessment of kinetics, effective moisture diffusivity, specific energy consumption, shrinkage, and color in the pistachio kernel drying process in microwave drying with ultrasonic pretreatment. J. Food Process. Preserv. 2020, 44, e14449. [Google Scholar] [CrossRef]
  17. Jafari, A.; Zare, D. Ultrasound-assisted fluidized bed drying of paddy: Energy consumption and rice quality aspects. Dry. Technol. 2016, 35, 893–902. [Google Scholar] [CrossRef]
  18. Sledz, M.; Wiktor, A.; Nowacka, M.; Witrowa-Rajchert, D. Drying Kinetics, Microstructure and Antioxidant Properties of Basil Treated by Ultrasound. J. Food Process Eng. 2015, 40, e12271. [Google Scholar] [CrossRef]
  19. Fikry, M.; Benjakul, S.; Al-Ghamdi, S.; Tagrida, M.; Prodpran, T. Evaluating Kinetics of Convection Drying and Microstructure Characteristics of Asian Seabass Fish Skin without and with Ultrasound Pretreatment. Foods 2023, 12, 3024. [Google Scholar] [CrossRef]
  20. Pandiselvam, R.; Aydar, A.Y.; Kutlu, N.; Aslam, R.; Sahni, P.; Mitharwal, S.; Gavahian, M.; Kumar, M.; Raposo, A.; Yoo, S.; et al. Individual and interactive effect of ultrasound pre-treatment on drying kinetics and biochemical qualities of food: A critical review. Ultrason. Sonochemistry 2023, 92, 106261. [Google Scholar] [CrossRef] [PubMed]
  21. Ricce, C.; Rojas, M.L.; Miano, A.C.; Siche, R.; Augusto, P.E.D. Ultrasound pre-treatment enhances the carrot drying and rehydration. Food Res. Int 2016, 89 Pt 1, 701–708. [Google Scholar] [CrossRef] [PubMed]
  22. Wang, L.; Xu, B.; Wei, B.; Zeng, R. Low frequency ultrasound pretreatment of carrot slices: Effect on the moisture migration and quality attributes by intermediate-wave infrared radiation drying. Ultrason. Sonochemistry 2018, 40 Pt A, 619–628. [Google Scholar] [CrossRef]
  23. Gamboa-Santos, J.; Soria, A.C.; Villamiel, M.; Montilla, A. Quality parameters in convective dehydrated carrots blanched by ultrasound and conventional treatment. Food Chem. 2013, 141, 616–624. [Google Scholar] [CrossRef] [PubMed]
  24. Friso, D. Conveyor-Belt Dryers with Tangential Flow for Food Drying: Mathematical Modeling and Design Guidelines for Final Moisture Content Higher Than the Critical Value. Inventions 2020, 5, 22. [Google Scholar] [CrossRef]
  25. Friso, D. Mathematical Modelling of Conveyor-Belt Dryers with Tangential Flow for Food Drying up to Final Moisture Content below the Critical Value. Inventions 2021, 6, 43. [Google Scholar] [CrossRef]
  26. Kiranoudis, C.T.; Maroulis, Z.B.; Marinos-Kouris, D. Modelling and design of conveyor belt dryers. J. Food Eng. 1994, 23, 375–396. [Google Scholar] [CrossRef]
  27. Montazer-Rahmati, M.M.; Amini-Horri, B. From Laboratory Experiments to Design of a Conveyor-Belt Dryer via Mathematical Modeling. Dry. Technol. 2005, 23, 2389–2420. [Google Scholar] [CrossRef]
  28. Khan, M.I.H.; Kumar, C.; Joardder, M.U.H.; Karim, M.A. Determination of appropriate effective diffusivity for different food materials. Dry. Technol. 2016, 35, 335–346. [Google Scholar] [CrossRef]
  29. Le, K.H.; Tsotsas, E.; Kharaghani, A. Continuum-scale modeling of superheated steam drying of cellular plant porous media. Int. J. Heat Mass Transf. 2018, 124, 1033–1044. [Google Scholar] [CrossRef]
  30. Vu, H.T.; Tsotsas, E. Mass and Heat Transport Models for Analysis of the Drying Process in Porous Media: A Review and Numerical Implementation. Int. J. Chem. Eng. 2018, 2018, 9456418. [Google Scholar] [CrossRef]
  31. ASHRAE. Refrigeration SI Edition; Ashrae Publisher: Atlanta, GA, USA, 2006. [Google Scholar]
  32. Le, K.H.; Tran, T.T.H.; Tsotsas, E.; Kharaghani, A. Superheated Steam Drying of Single Wood Particles: Modeling and Comparative Study with Hot Air Drying. Chem. Eng. Technol. 2020, 44, 114–123. [Google Scholar] [CrossRef]
  33. Mujumdar, A.S. Handbook of Industrial Drying; Taylor & Francis: Abingdon, UK, 2006. [Google Scholar]
  34. Salehi, F.; Kashaninejad, M. Modeling of moisture loss kinetics and color changes in the surface of lemon slice during the combined infrared-vacuum drying. Inf. Process. Agric. 2018, 5, 516–523. [Google Scholar] [CrossRef]
  35. Magalhães, M.L.; Cartaxo, S.J.; Gallão, M.I.; García-Pérez, J.V.; Cárcel, J.A.; Rodrigues, S.; Fernandes, F.A. Drying intensification combining ultrasound pre-treatment and ultrasound-assisted air drying. J. Food Eng. 2017, 215, 72–77. [Google Scholar] [CrossRef]
  36. Rawson, A.; Tiwari, B.; Tuohy, M.; O’donnell, C.; Brunton, N. Effect of ultrasound and blanching pretreatments on polyacetylene and carotenoid content of hot air and freeze dried carrot discs. Ultrason. Sonochemistry 2011, 18, 1172–1179. [Google Scholar] [CrossRef] [PubMed]
  37. García-Pérez, J.V.; Rosselló, C.; Cárcel, J.A.; De la Fuente, S.; Mulet, A. Effect of Air Temperature on Convective Drying Assisted by High Power Ultrasound. Defect Diffus. Forum 2006, 258–260, 563–574. [Google Scholar]
  38. Huang, D.; Men, K.; Li, D.; Wen, T.; Gong, Z.; Sunden, B.; Wu, Z. Application of ultrasound technology in the drying of food products. Ultrason. Sonochem. 2020, 63, 104950. [Google Scholar] [CrossRef] [PubMed]
  39. Llavata, B.; García-Pérez, J.V.; Simal, S.; Cárcel, J.A. Innovative pre-treatments to enhance food drying: A current review. Curr. Opin. Food Sci. 2020, 35, 20–26. [Google Scholar] [CrossRef]
Figure 1. The schematic of the experimental apparatus used for drying experiments.
Applsci 13 11865 g001
Figure 2. The sketch of the co-current conveyor-belt dryer.
Applsci 13 11865 g002
Figure 3. Fresh and dried carrot samples.
Applsci 13 11865 g003
Figure 4. The color change of carrots under different drying conditions: (a) The values of L, a, and b obtained from fresh and dried product; (b) Impact of drying temperature on the color change index.
Applsci 13 11865 g004
Figure 5. Numerical and experimental moisture content evolution over time during the hot-air-drying process with (a) and without (b) US pre-treatment.
Applsci 13 11865 g005
Figure 6. Reference moisture diffusivity of carrot with and without US pre−treatment.
Applsci 13 11865 g006
Figure 7. Moisture-content (a) and temperature (b) evolutions over time obtained from numerical simulation with and without US pre-treatment (Tg of 50 °C, pv,g of 2000 Pa, and X0 of 8.7 kg water/kg dry solid).
Applsci 13 11865 g007
Figure 8. An exemplary drying kinetic curve obtained from numerical and experimental data.
Applsci 13 11865 g008
Figure 9. Impact of drying temperature on the critical moisture content.
Applsci 13 11865 g009
Figure 10. Numerical normalized characteristic drying curve obtained from diffusion model for US pre−treatment (a) and non−pre−treatment (b) and the correlated characteristics drying curve.
Applsci 13 11865 g010
Figure 11. The evolution of air temperature and relative humidity (a); product temperature and moisture content (b) over a length of belt.
Applsci 13 11865 g011
Table 1. The mass fraction of the constituents of a fresh carrot sample [4].
ConstituentMoistureProteinFatCarbohydrateFiberAsh
Mass fraction (%)88.290.930.246.583.000.96
Table 2. The activation energy and Arrhenius factor used in the calculation of reference moisture diffusivity.
Drying Process D 0 × 10 3 (m2/s) E a (KJ/mol.K)
With US pre-treatment87.761.01
Without US pre-treatment41.6249.53
Table 3. The operating conditions of the conveyor-belt dryer used in simulations.
Drying ProcessValues
Belt width2 m
Inlet air temperature50 °C
Inlet air relative humidity10%
Inlet air velocity0.9 m/s
Dry air mass flow rate3 kg/s
Inlet drying product temperature20 °C
Inlet drying product moisture content9 kg water/kg solid
Dried solid mass flow rate 0.005 kg solid/s
Table 4. Impact of US pre-treatment on the required belt length of conveyor-belt dryer.
Final Moisture ContentBelt Length
US Pre-TreatmentNon-Pre-Treatment
1 kg water/kg dried solid77.5 m89.2 m
0.75 kg water/kg dried solid88.4 m102.7 m
0.5 kg water/kg dried solid105.9 m124.3 m
Disclaimer/Publisher’s Note: The statements, opinions and data contained in all publications are solely those of the individual author(s) and contributor(s) and not of MDPI and/or the editor(s). MDPI and/or the editor(s) disclaim responsibility for any injury to people or property resulting from any ideas, methods, instructions or products referred to in the content.

