1. Introduction
Fiber optic sensors are very popular due to their characteristic properties, which include small size and resistance to various factors, including electromagnetic radiation. One of the main groups of fiber optic sensors are those based on periodic structures. These include Bragg gratings. Introducing the particular tilt angle of the periodic structure during the inscription process results in the so-called tilted fiber Bragg gratings (TFBGs). Such structures have many sensing applications. The most popular application is in measuring the refractive index (RI) of the medium surrounding the optical fiber. High repeatability and the complex nature of spectral changes have resulted in the development of both the sensors themselves and the algorithms for demodulating their spectra [
1,
2]. The most important advantage of periodic fiber optic structures is high sensitivity. However, the method used to create such sensors is of great importance, as it must not cause physical weakening of the optical fiber. The structure recording process does not require physical distortion of the optical fiber. The fiber is distorted only for optical radiation, which merely leads to a change in the optical properties of the fiber core, giving it new properties. Additionally, structures of this type can be used to measure at least two physical quantities simultaneously, such as temperature and stress [
3] and the twist and bending radius [
4]. Periodic structures produced in modified fibers can also lead to a sensor capable of measuring two quantities simultaneously [
5].
Curvature or the bending radius is an important parameter that is measured for various important applications. It is used particularly often in structural health monitoring [
6], shape measurements and reconstruction [
7], or angular movement of manipulators [
8]. The literature refers to several types of bending sensors using fiber optic technology. Most often, they exploit interferometric systems with classical Bragg gratings (FBG) [
9,
10], Mach-Zehnder [
11,
12,
13,
14], or Fabry–Pérot [
15,
16] interferometers. The use of FBGs to obtain bending sensitivity requires the creation of a grating zone away from the central axis of the optical fiber. This necessitates the use of multi-core fiber (MCF), which increases the cost of producing the sensor element [
17]. The use of a hybrid structure containing sections of various special light guides for curvature measurements has also been proposed [
18]; however, the production of the structure discussed requires a complicated process.
Emerging spatial asymmetry within the recorded structure causes high sensitivity to radiation polarization. There are two specific orientations of the polarization plane of the introduced light, the P-type (parallel) and S-type (perpendicular), the latter marked with an S from the German equivalent term of Senkrecht. Typically, with TFBGs, changing the angle of the polarization plane from the P state to the S state causes the most significant changes in spectral parameters [
19]. Maintaining the polarization state right in front of the sensor is difficult. It requires the use of special optical fibers or additional optical elements, which increase the complexity and costs of the system. It is important to survey the influence of input light polarization on the accuracy of measurement of other physical quantities. The development of methods which will provide results with reduced cross-sensitivity to input polarization could lead to the obtainment of simpler measurement setups and more reliable results. It could also be useful in cases where changing the sensing grating is necessary.
Bending the fiber at the location of the written TFBG significantly affects lower-order modes with effective refractive indices close to the fundamental mode, propagating at the smallest distance from the fiber core [
20]. Both the central wavelengths of individual resonances and their amplitude changes. The complex nature of these changes makes it necessary to use an appropriate method to demodulate the spectra. It should be noted that most of the previous publications in this field assume the influence of only one quantity on the sensor. The second type of spectrum analysis method involves searching for a spectrum range that is sensitive only to one interacting quantity. The second method will not be fully effective in the case of simultaneous impact of polarization change and bending. An interesting issue is in surveying the impact of polarization changes on determining the bending radius for methods used to demodulate the SRI (surrounding refractive index). An important aspect will also be the need to transform and adapt these methods to demodulate the bending radius. The spectra and spectral changes of the TFBG grating used for SRI measurements differ significantly from the spectra of gratings used for bending measurements. The nature of changes in the spectra of these gratings under the influence of SRI and bending is significantly different.
Determining the bending radius of an optical fiber with a written tilted grating can be used to test not only the curvature of an arc-shaped element but also, indirectly, the distance between the elements. An application example is shown in
Figure 1b, where changing the distance between the walls directly affects the radius of the arc created by the TFBG fiber. The measurement range can be significantly larger than when using conventional FBG sensors, where the limitation is the tensile strength of the optical fiber (up to approximately 1% elongation).
2. Materials and Methods
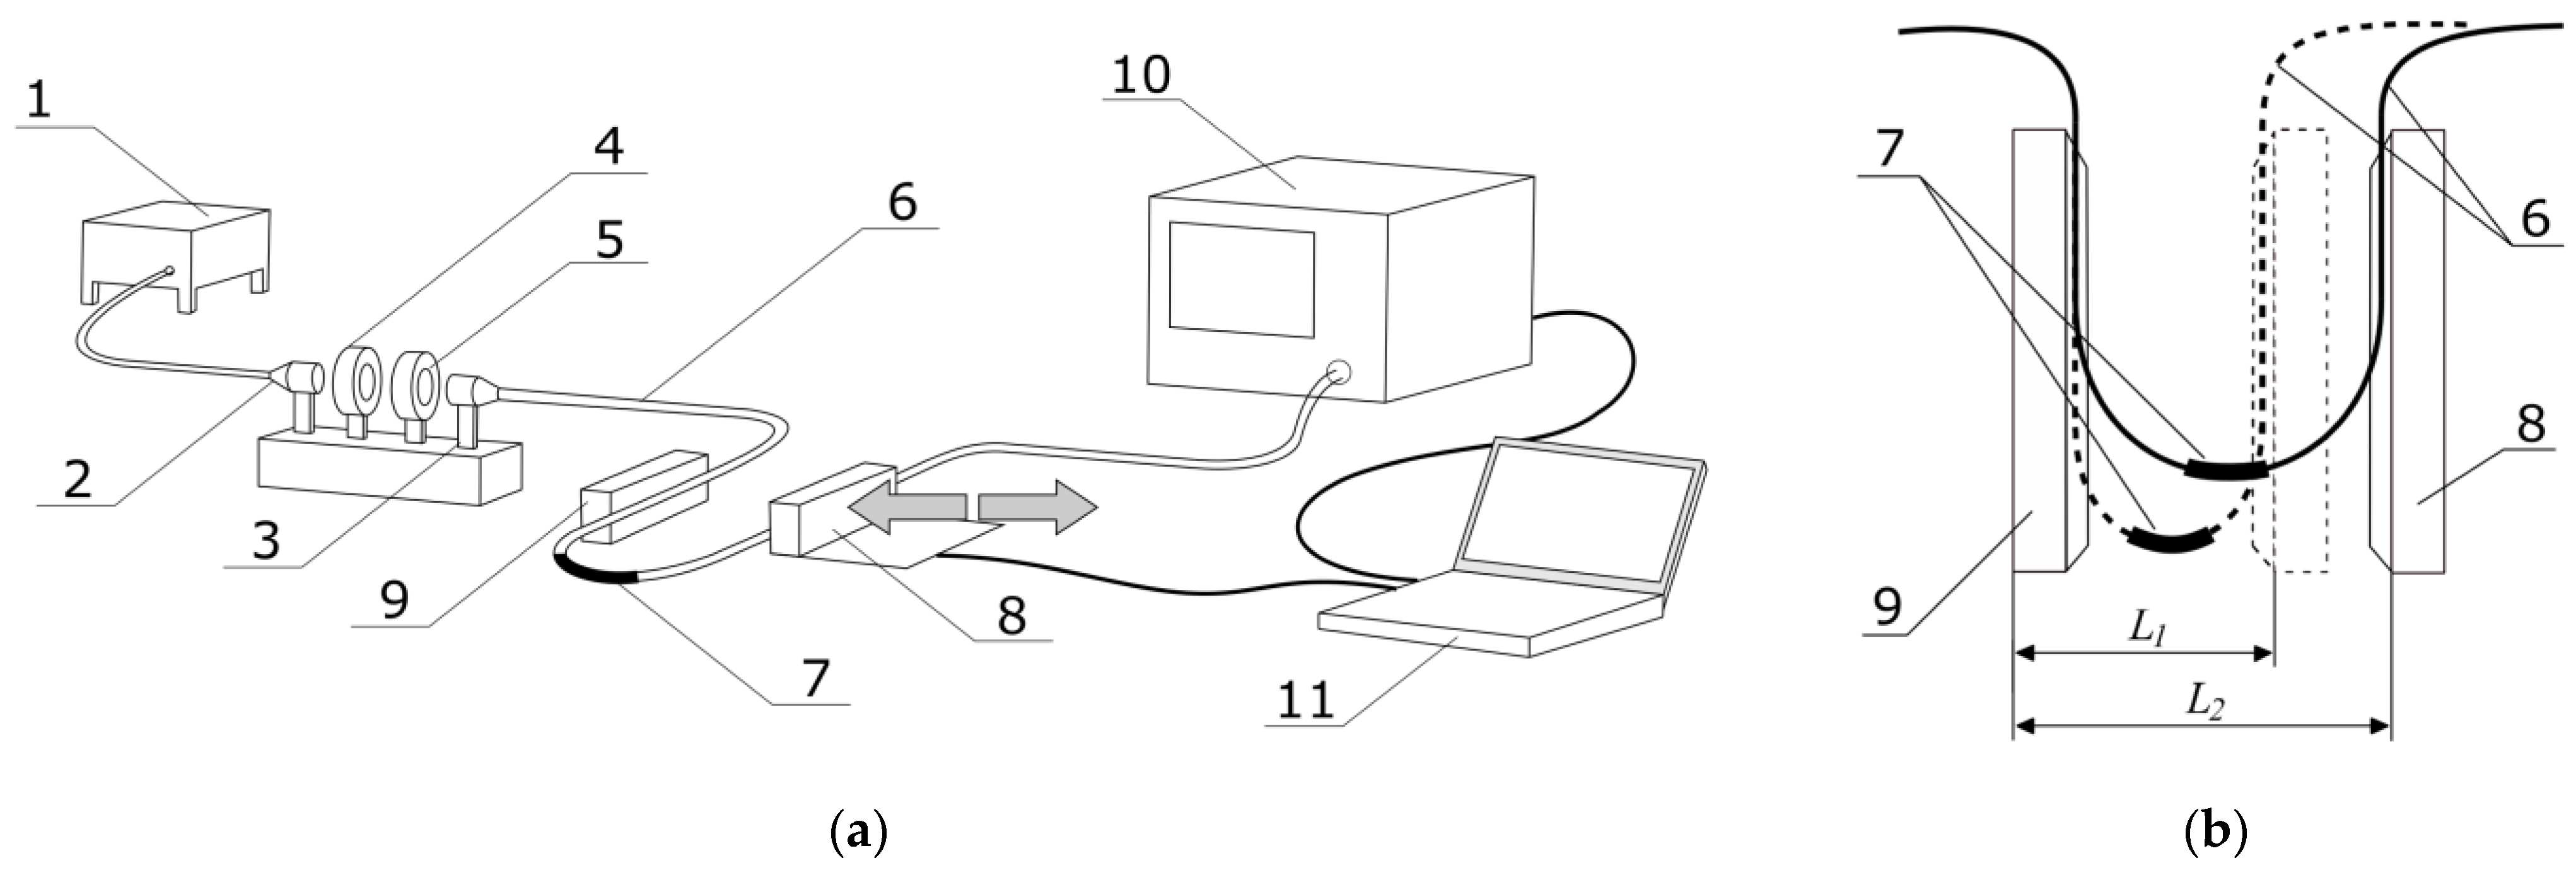
The measurement setup was built in a way that allowed the bending radius of the optical fiber to be changed in the range from 15 to 50 mm. At the same time, the use of a half-wave plate allowed us to change the angle of the polarization plane of the introduced light in the full range from 0 to 360 degrees. The system allows for recording the spectrum of light generated by a broadband source, transmitted through an optical fiber with a recorded tilted fiber Bragg grating. A fragment of the fiber with inscribed periodic structure was placed in the central part of the arc created by the optical fiber placed between sliding tables with a variable distance.
Measurements were conducted by using laboratory-class equipment. Tilted fiber Bragg gratings used for experiments were inscribed in photosensitive Ge-doped fiber by using the phase mask method. The fiber was illuminated by 248 nm excimer BraggStar laser. The experimental setup was placed in the NEXUS vibroisolating table to provide the isolation from additional interference from the ground vibrations and consisted of (according to
Figure 1a): 1—Thorlabs SLED broadband light source; 2, 3—optical lenses; 4—polarizer; 5—half-wave plate; 6—single mode optical fiber; 7—optical fiber with a TFBG inscribed in its core; 8—motorized translation stage; 9—fixed mount; 10—optical spectrum analyzer; 11—PC computer.
Figure 1b presents a detailed view of the optical fiber with a TFBG inscribed in its core, which was formed in the arc and placed between two mounts with adjustable distance marked with the letter L. Decreasing the distance created an arc with a smaller radius so the curvature was stronger. This setup presents one of the possible applications of TFBG bending sensors—measurement of distance between objects.
The light from source was transmitted by optical fiber through the lens to create the parallel beam, which was directed to polarize, thereby resulting in strong linear polarization of light. The beam was then transmitted through a half-wave plate mounted in motorized rotation stage, allowing for precise adjustment of the angle of the light polarization plane. Modified light was focused by a second lens to be introduced into second fiber, which had a TFBG inscribed in its core and was formed to the arc with an adjustable radius. The curvature of the fiber with an inscribed TFBG was modified by changing the distance between the two plates, as shown in
Figure 1b. One of the plates was fixed and the second one was mounted at a motorized translation stage which provided precise control of the distance, and as a result the radius of the fiber curvature.
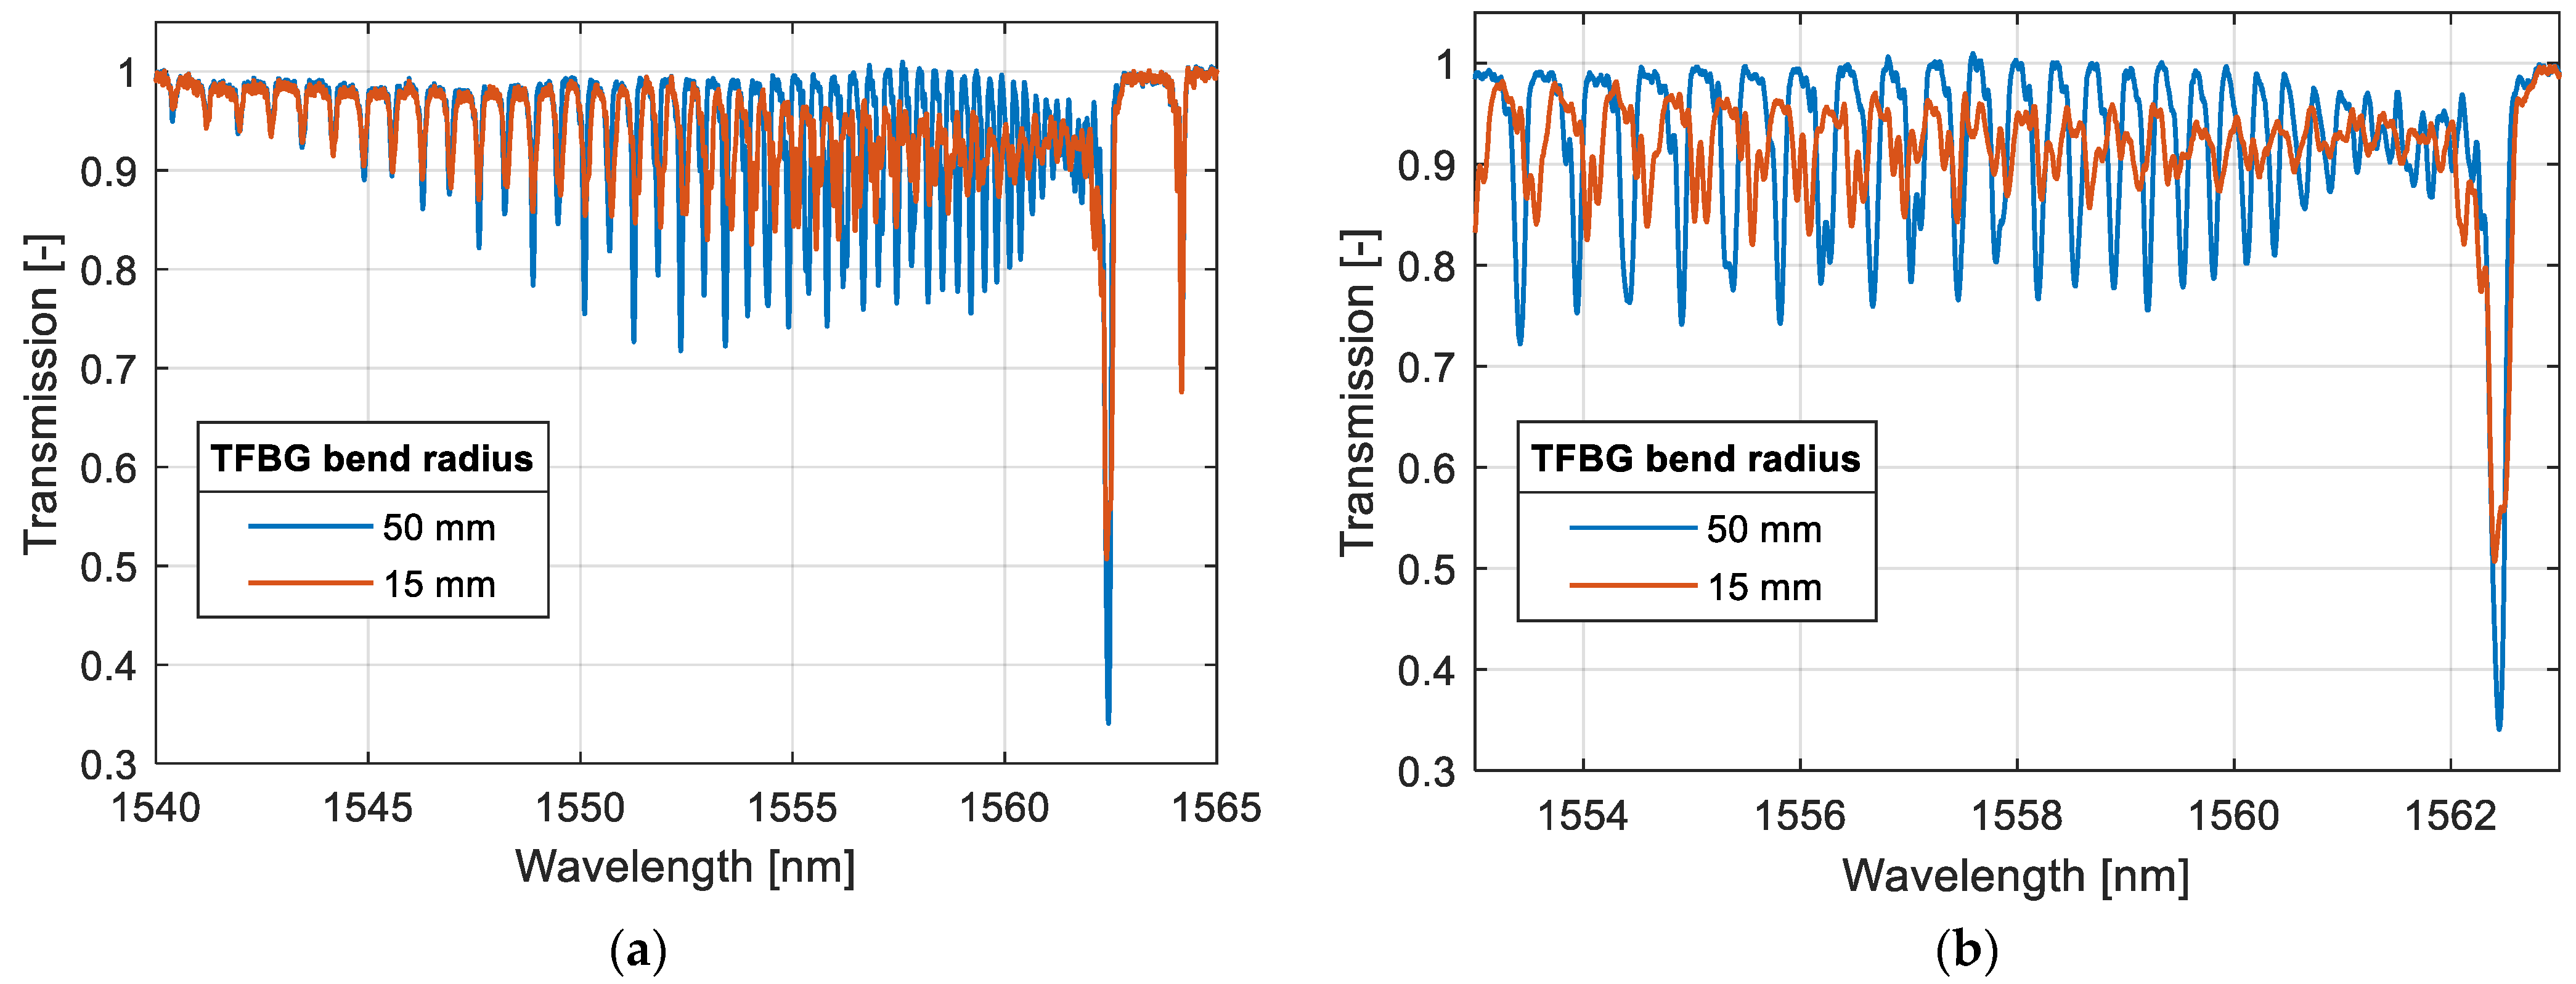
Figure 2 shows two transmission spectra of a TFBG with a 2° internal tilt angle.
The spectra presented in
Figure 2 show that the different cladding modes of TFBG reacts with different change of their spectral parameters. It can be seen that the strongest change was observed for the so-called low order cladding modes, which have the longest wavelengths, next to the Bragg wavelength.
Figure 2b presents the spectrum measured in the range in which the amplitude and the wavelengths of resonances was the most changed. This is a reason that the algorithms used for the demodulation of bending radius should be based on the analysis of the part of the spectrum. Appropriate selection of the wavelength range should result in the improvement of the sensitivity and accuracy of the developed methods.
3. Analysis of Measurement Data
3.1. Quantitative Analysis of Spectra
Quantitative analysis of spectra requires the definition of an appropriate model of the relationship between the determined quantity and the parameters of the measured spectrum. The structure of the data was initially determined because each grid differs slightly in spectral parameters. In particular, if the refractive index inclination angle and the refractive index modulation depth of the grating are changed, the parameters extracted from the spectrum will change. In principle, separate calibration is required for each such sensor. The simplest and most popular algorithms use the amplitude changes of individual cladding mode resonances.
Determining a single parameter based on the optical spectrum basically serves two functions in the data analysis process. This is the extraction of features and at the same time reduction of the dimensionality of data.
The spectra change overall and locally. The determined parameters can use intensities from all points of a given range. The selection of this range may give the algorithm a local or global character. Global methods are characterized by a larger measurement range.
The first and most popular algorithm is the algorithm of the area occupied between the upper and lower envelope of the cladding modes. However, this algorithm most often uses the search for individual peaks in the spectrum. It does not use all the available information. Additionally, it is sensitive to noise contained in the spectrum, coming from the radiation source and the spectrum analyzer itself. To use all the information contained in the spectrum, all available points in the spectrum should be used for calculations, not just one point related to the peak of a given cladding mode. The general rule is to use all points of the spectrum carrying information in a given range. It is the spectral range of the analyzed spectrum that we match with the measurement range we are interested in. A narrow spectral range limits the measurement range, and a too wide one causes deterioration of its metrological parameters.
The second type of method is those of projecting changes in spectrum parameters onto the wavelength axis. In general, such methods are less sensitive to changes in the radiation intensity of the source. For methods that determine parameters on the wavelength axis, the fundamental problem is the discrete nature of cladding modes. For local methods, it limits the measurement range when a single mode is used. For global methods, there are problems related to jumping the determined characteristic wavelength between modes. In global methods a parameter is basically determined, which is an estimate of the cut-off wavelength. For SRI measurements, these methods are characterized by very good linearity, significantly better than all the methods based on parameters reflecting changes in spectral intensity. The initial location of the cut-off wave can be made by selecting a mode whose intensity has decreased significantly compared to longer wavelength modes. In order to determine the cut-off wavelength more precisely, a method was proposed to determine the maximum of the derivative for the upper and lower envelope of the cladding modes [
21]. The effect of this solution is a smoother relationship between the determined wavelength parameter and the SRI coefficient.
3.2. Analysis of the Resolution and Accuracy of Demodulation Methods
A calibration curve is a quantitative relationship between the response of a measurement method and the values of the quantities we are interested in. This curve is then used to determine the value of the quantity being measured based on data from the measuring instrument. In the case of spectral measurements, the response of the measuring instrument is a specific spectral parameter, such as the area between the mode envelopes or the length of the spectral contour. The calibration curve is most often approximated by polynomials of a certain degree with a possible prior transformation of the variables. However, if the calibration curve is non-linear, it is better to approximate its inverse, i.e., the dependence of the measured quantity on the readings of the measuring instrument [
22]. In the case of bending measurements, we are interested in the value of the bending radius. However, in calibration equations it is better to use curvature as the determined parameter because the calibration curves are then more linear.
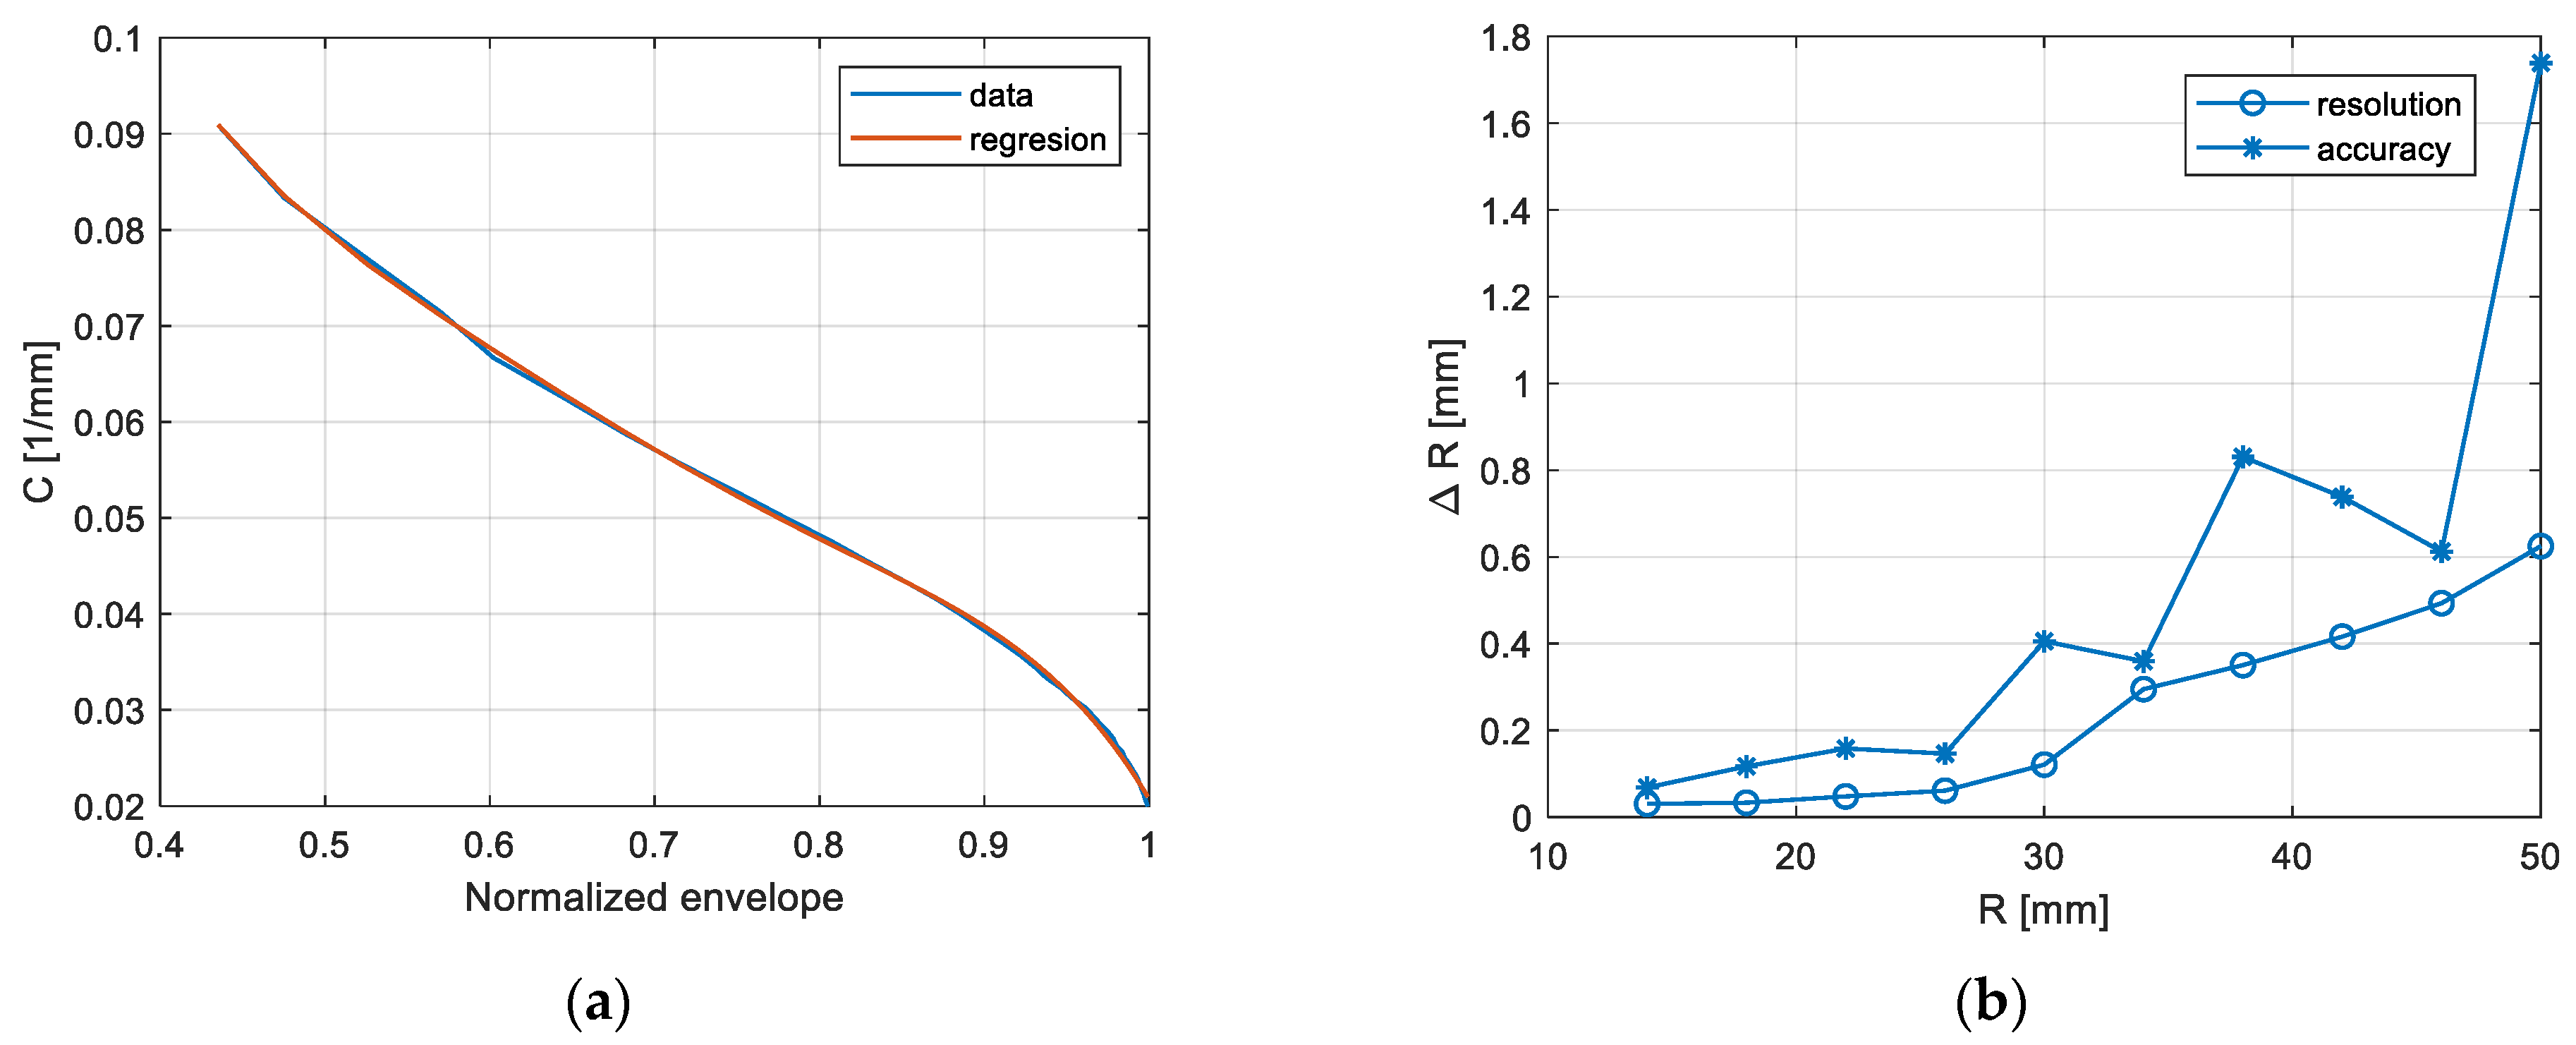
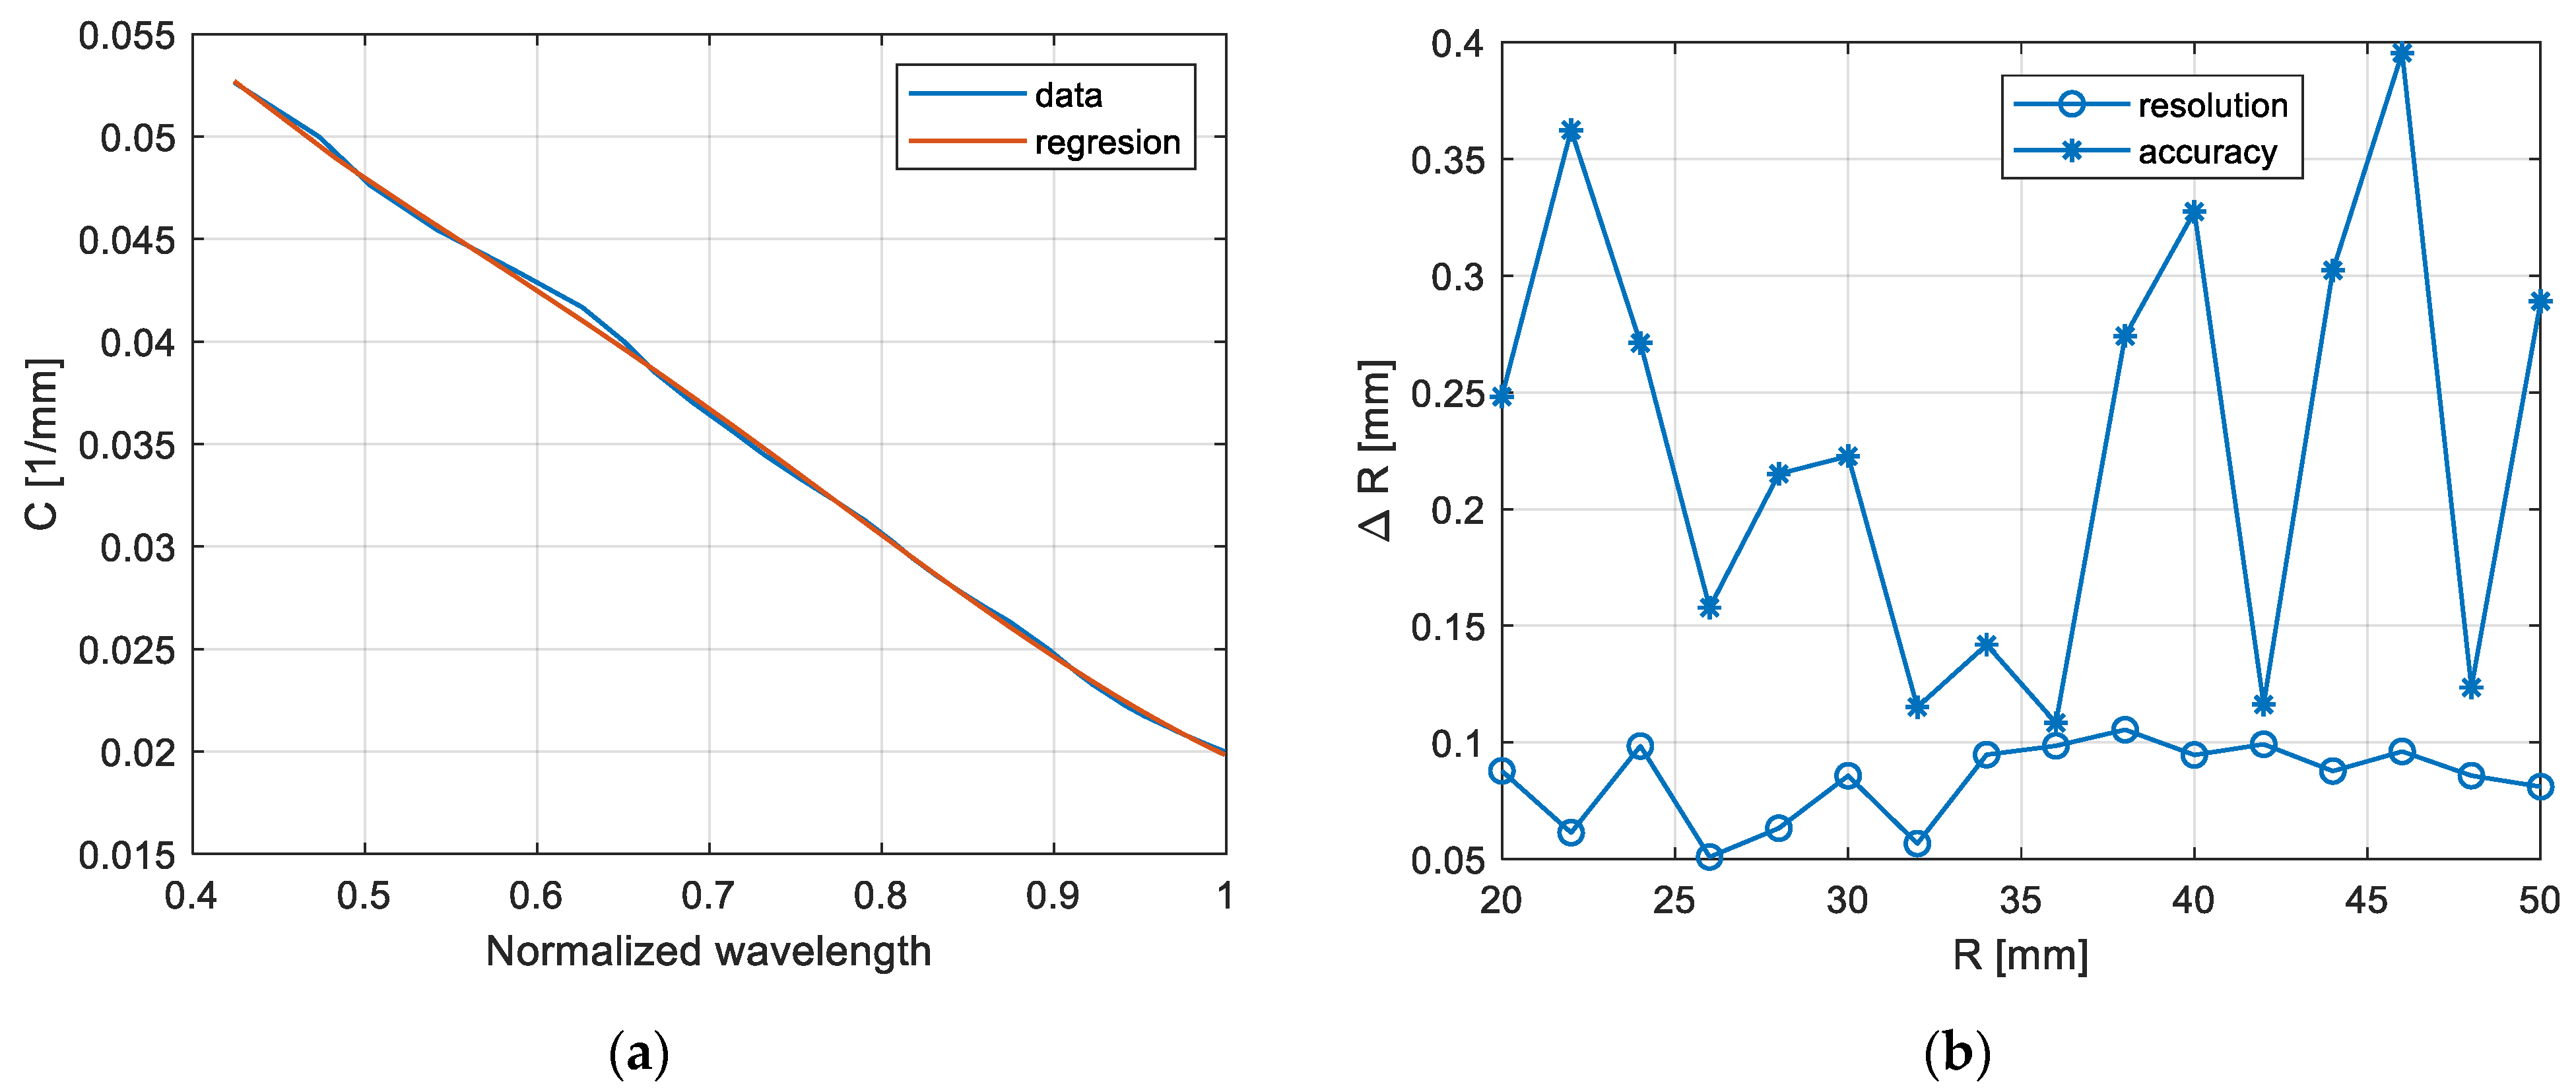
Figure 3 shows the curvature versus normalized area relationship between the upper and lower cladding mode envelopes.
Figure 3a shows the curve determined on the basis of the data and one approximated by a 5th degree polynomial.
Figure 3b shows the resolution and accuracy values for determining the bending radius based on the spectrum area and the calibration curve from
Figure 3a. Greater resolution and accuracy values occur for larger bending radii.
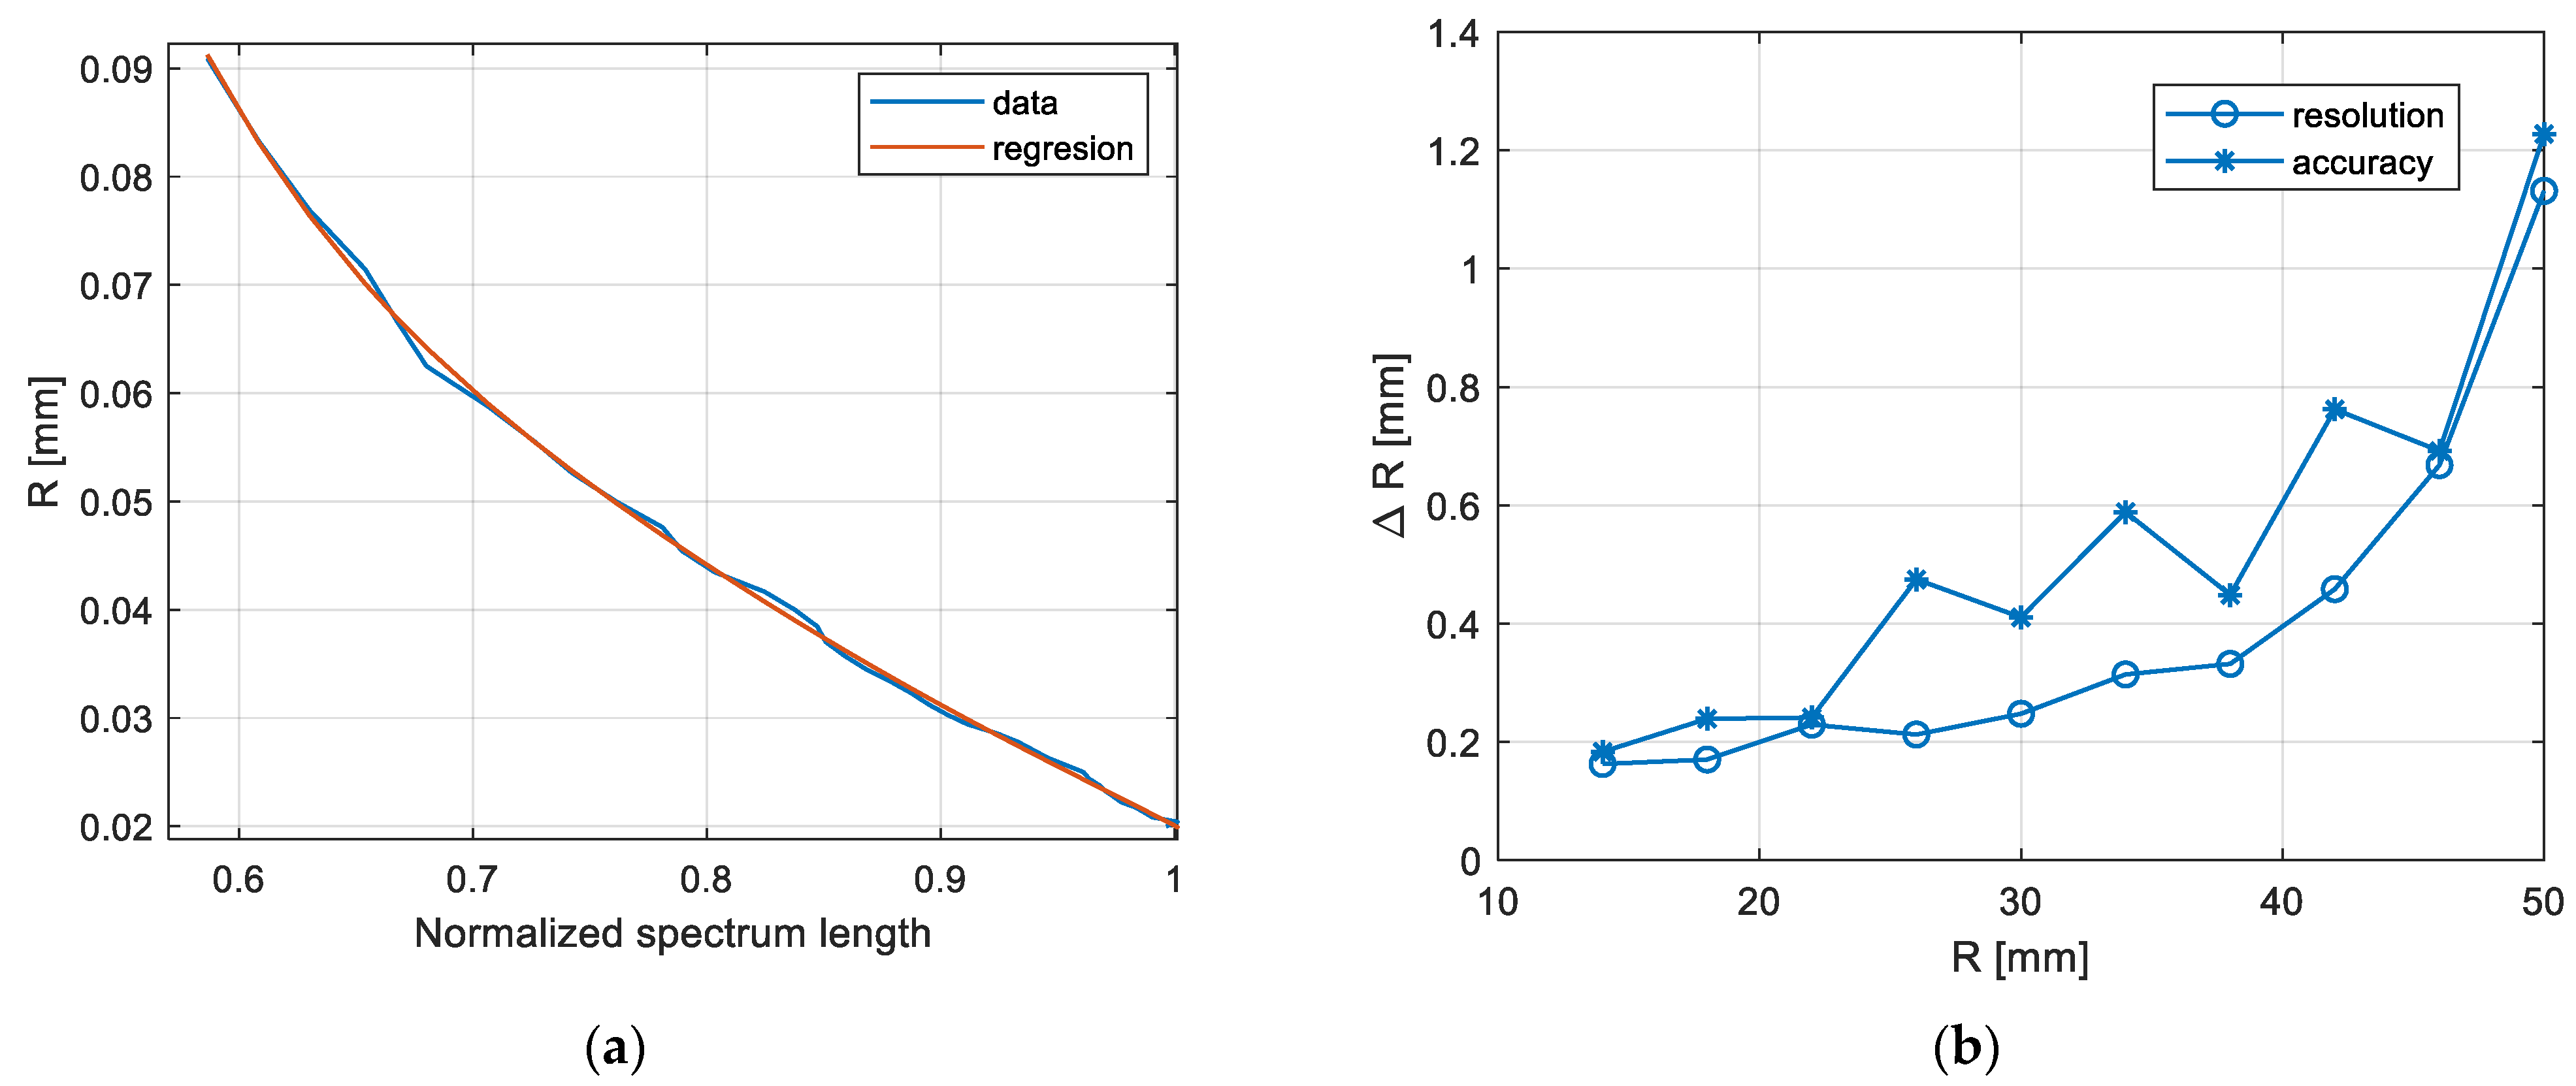
The next parameter considered is the length of the contour (
Figure 4a), which can be regarded the simplest parameter in the calculations. The resolution values are slightly higher than for the area method (
Figure 4b).
The last amplitude parameter is the mean deviation from the local mean parameter which is presented on
Figure 5a. It has slightly lower resolution values than the previous methods (
Figure 5b).
Local parameter changes shift towards shorter wavelengths as the curvature increases (bending radius decreases). The movement of these changes can be used as a parameter to determine the value of the curvature (radius). The simplest indicator of the characteristic wavelength may be the derivative of the transformed transmission spectrum. To highlight the differences in individual spectra, the parameter function of the absolute value of the spectrum length versus wavelength was used. To smooth the spectrum processed in this way, a smoothing filter with a rectangular shape of the impulse response was used. The characteristic wavelength is the extremum of the derivative of the spectrum processed in this way. The dependence of the curvature on the normalized wavelength is shown in
Figure 6a. It is characterized by greater linearity than the previously presented amplitude methods. The resolution and accuracy of determining the bending radius is better than for amplitude methods. The resolution and accuracy values are the same for the entire range of the bending radii considered (
Figure 6b).
3.3. Analysis of the Influence of Polarization on Demodulation Accuracy
In order to assess the influence of the polarization state on demodulation algorithms and bending radius determination, a series of numerical experiments were performed on previously collected measurement data. The characteristics of the normalized parameters determined on the basis of the spectrum were established depending on the curvature and bending radius. Then, the bending radii were determined using the characteristics for the zero polarization state. The results were presented in the form of graphs of the estimated radius value against the actual bending radius value and the difference between the estimated and actual value as a function of the radius.
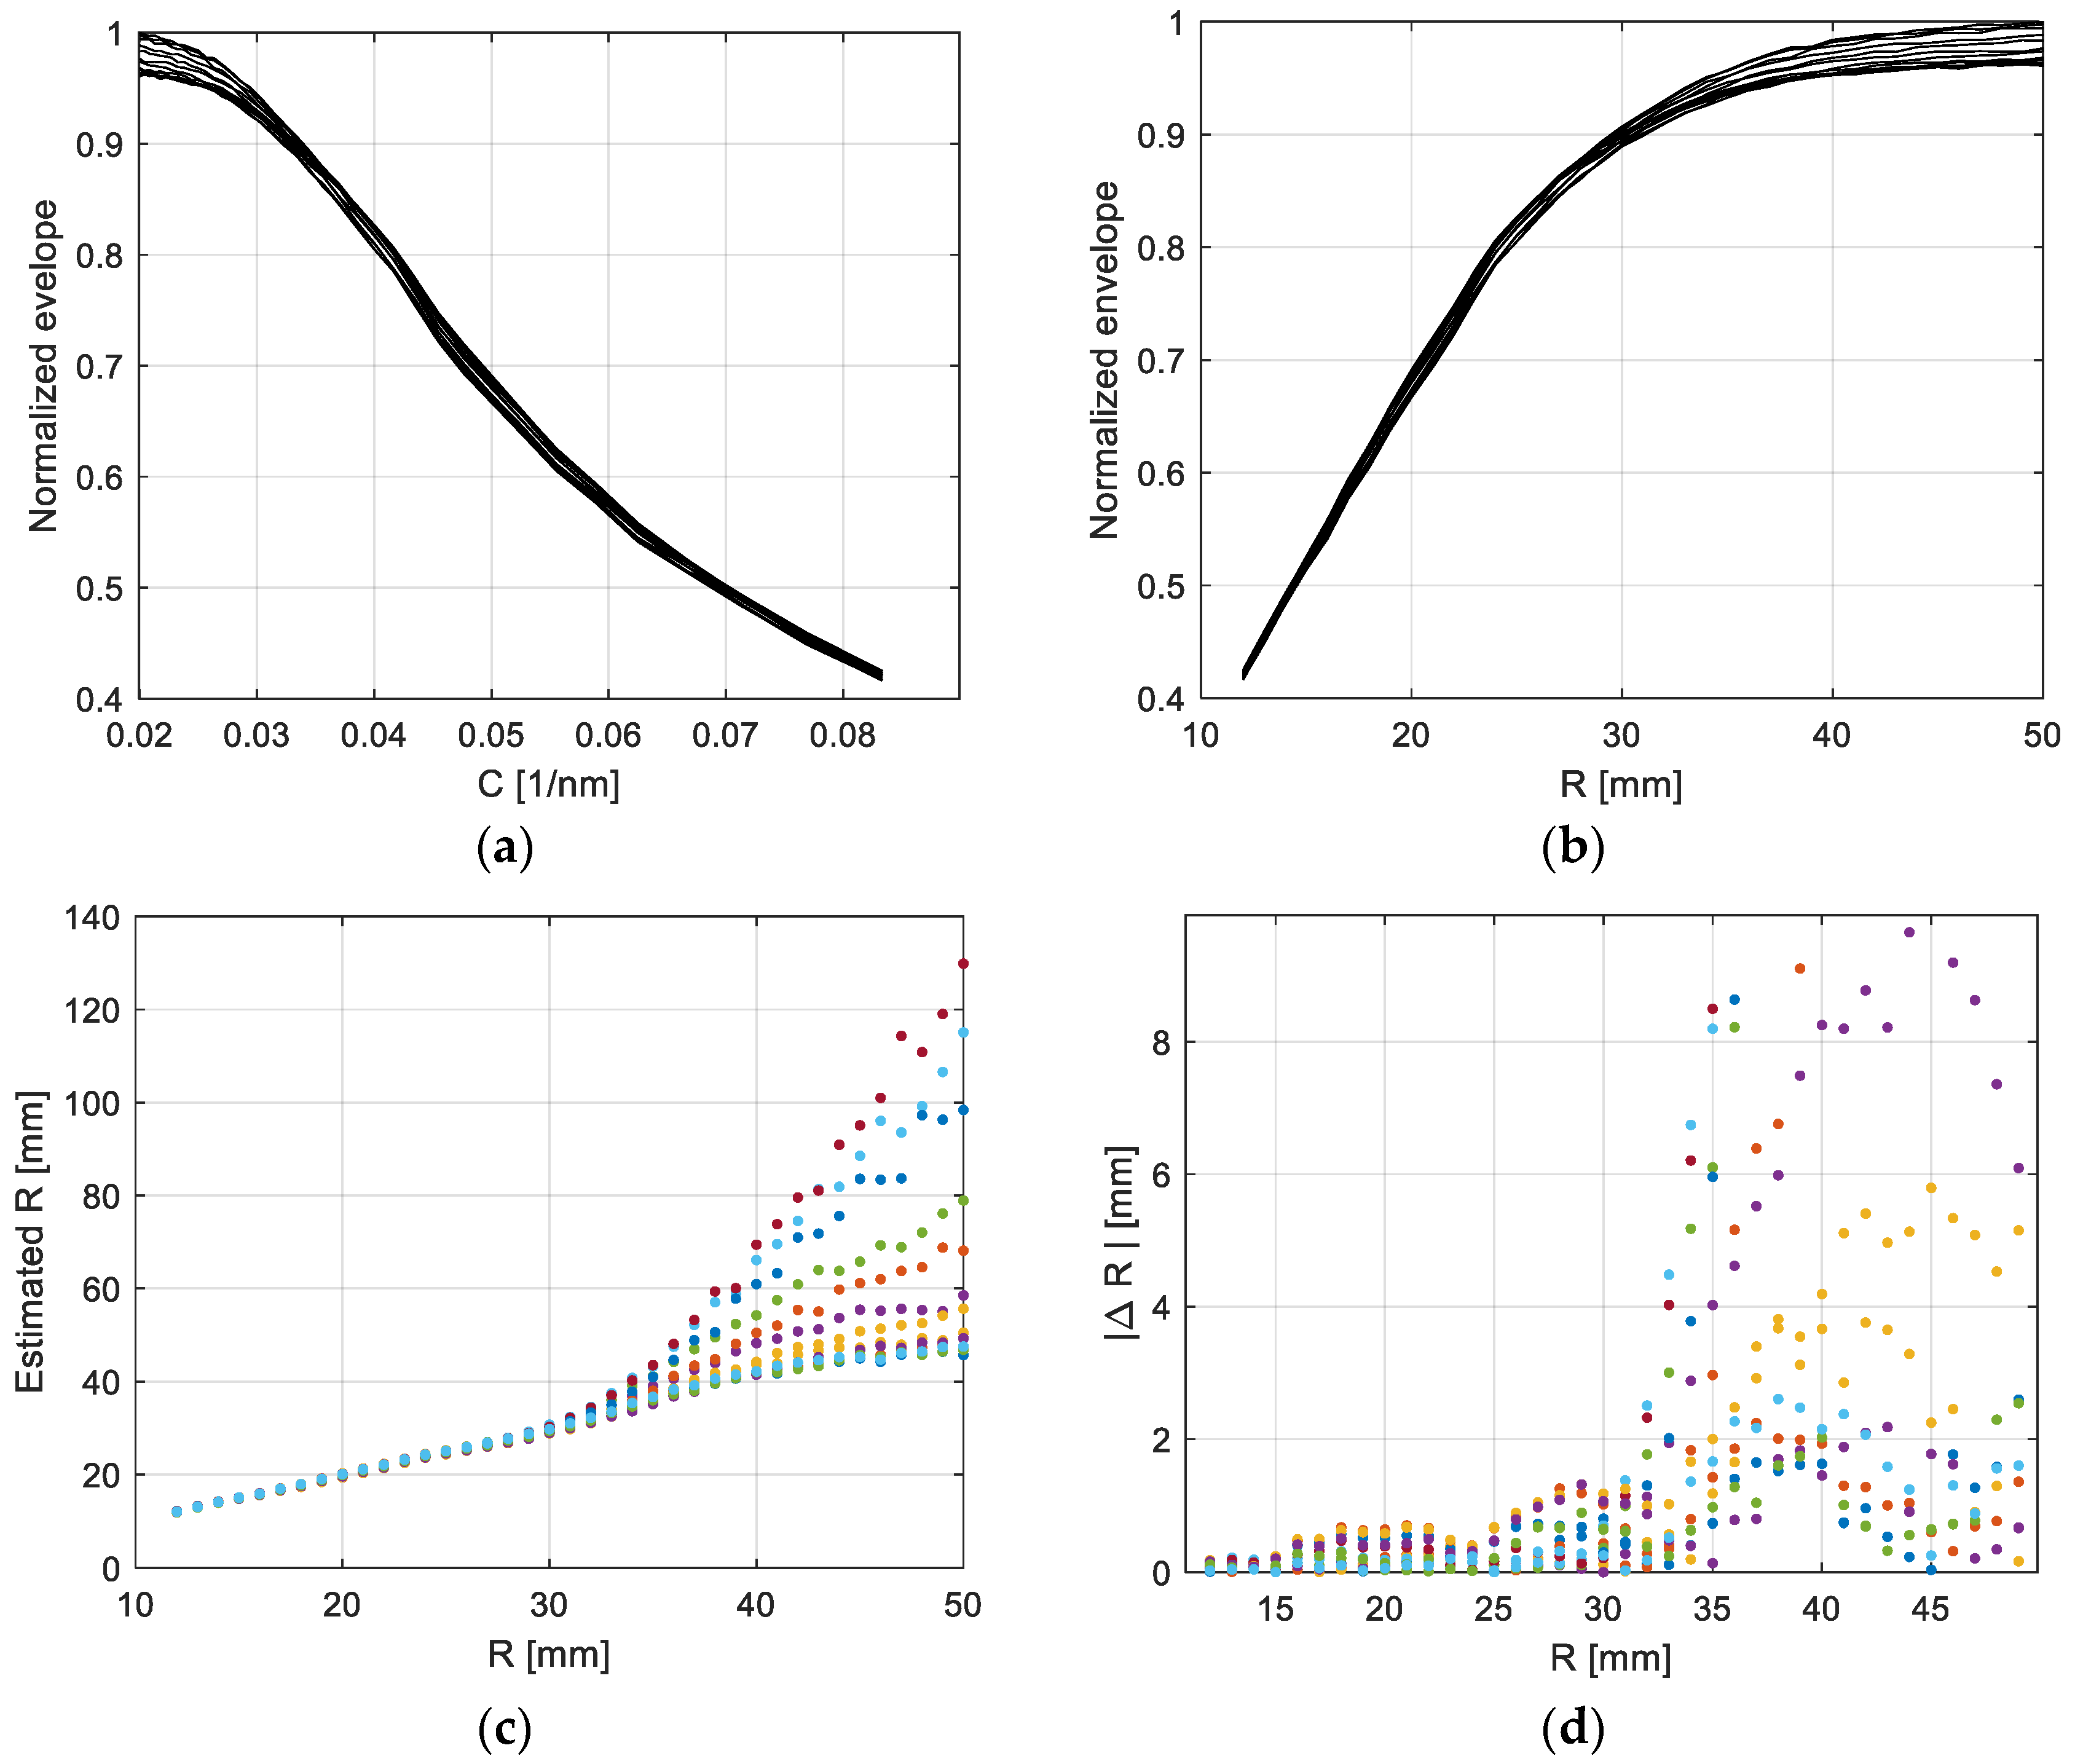
To determine the radius, a curve depending on the curvature was used as a calibration characteristic. For the envelope region, it is shown in
Figure 7a. It was better conditioned numerically than the dependence of the envelope area on the radius (
Figure 7b). However, ray analysis was easier and simpler to understand. When analyzing
Figure 7b, one immediately notices an increase in the spread of characteristics as the radius of curvature increases. Therefore, for longer radii, its determined values will differ more significantly from the real values when polarization changes (
Figure 7c). The error value increases significantly for radii longer than 30 mm (
Figure 7d).
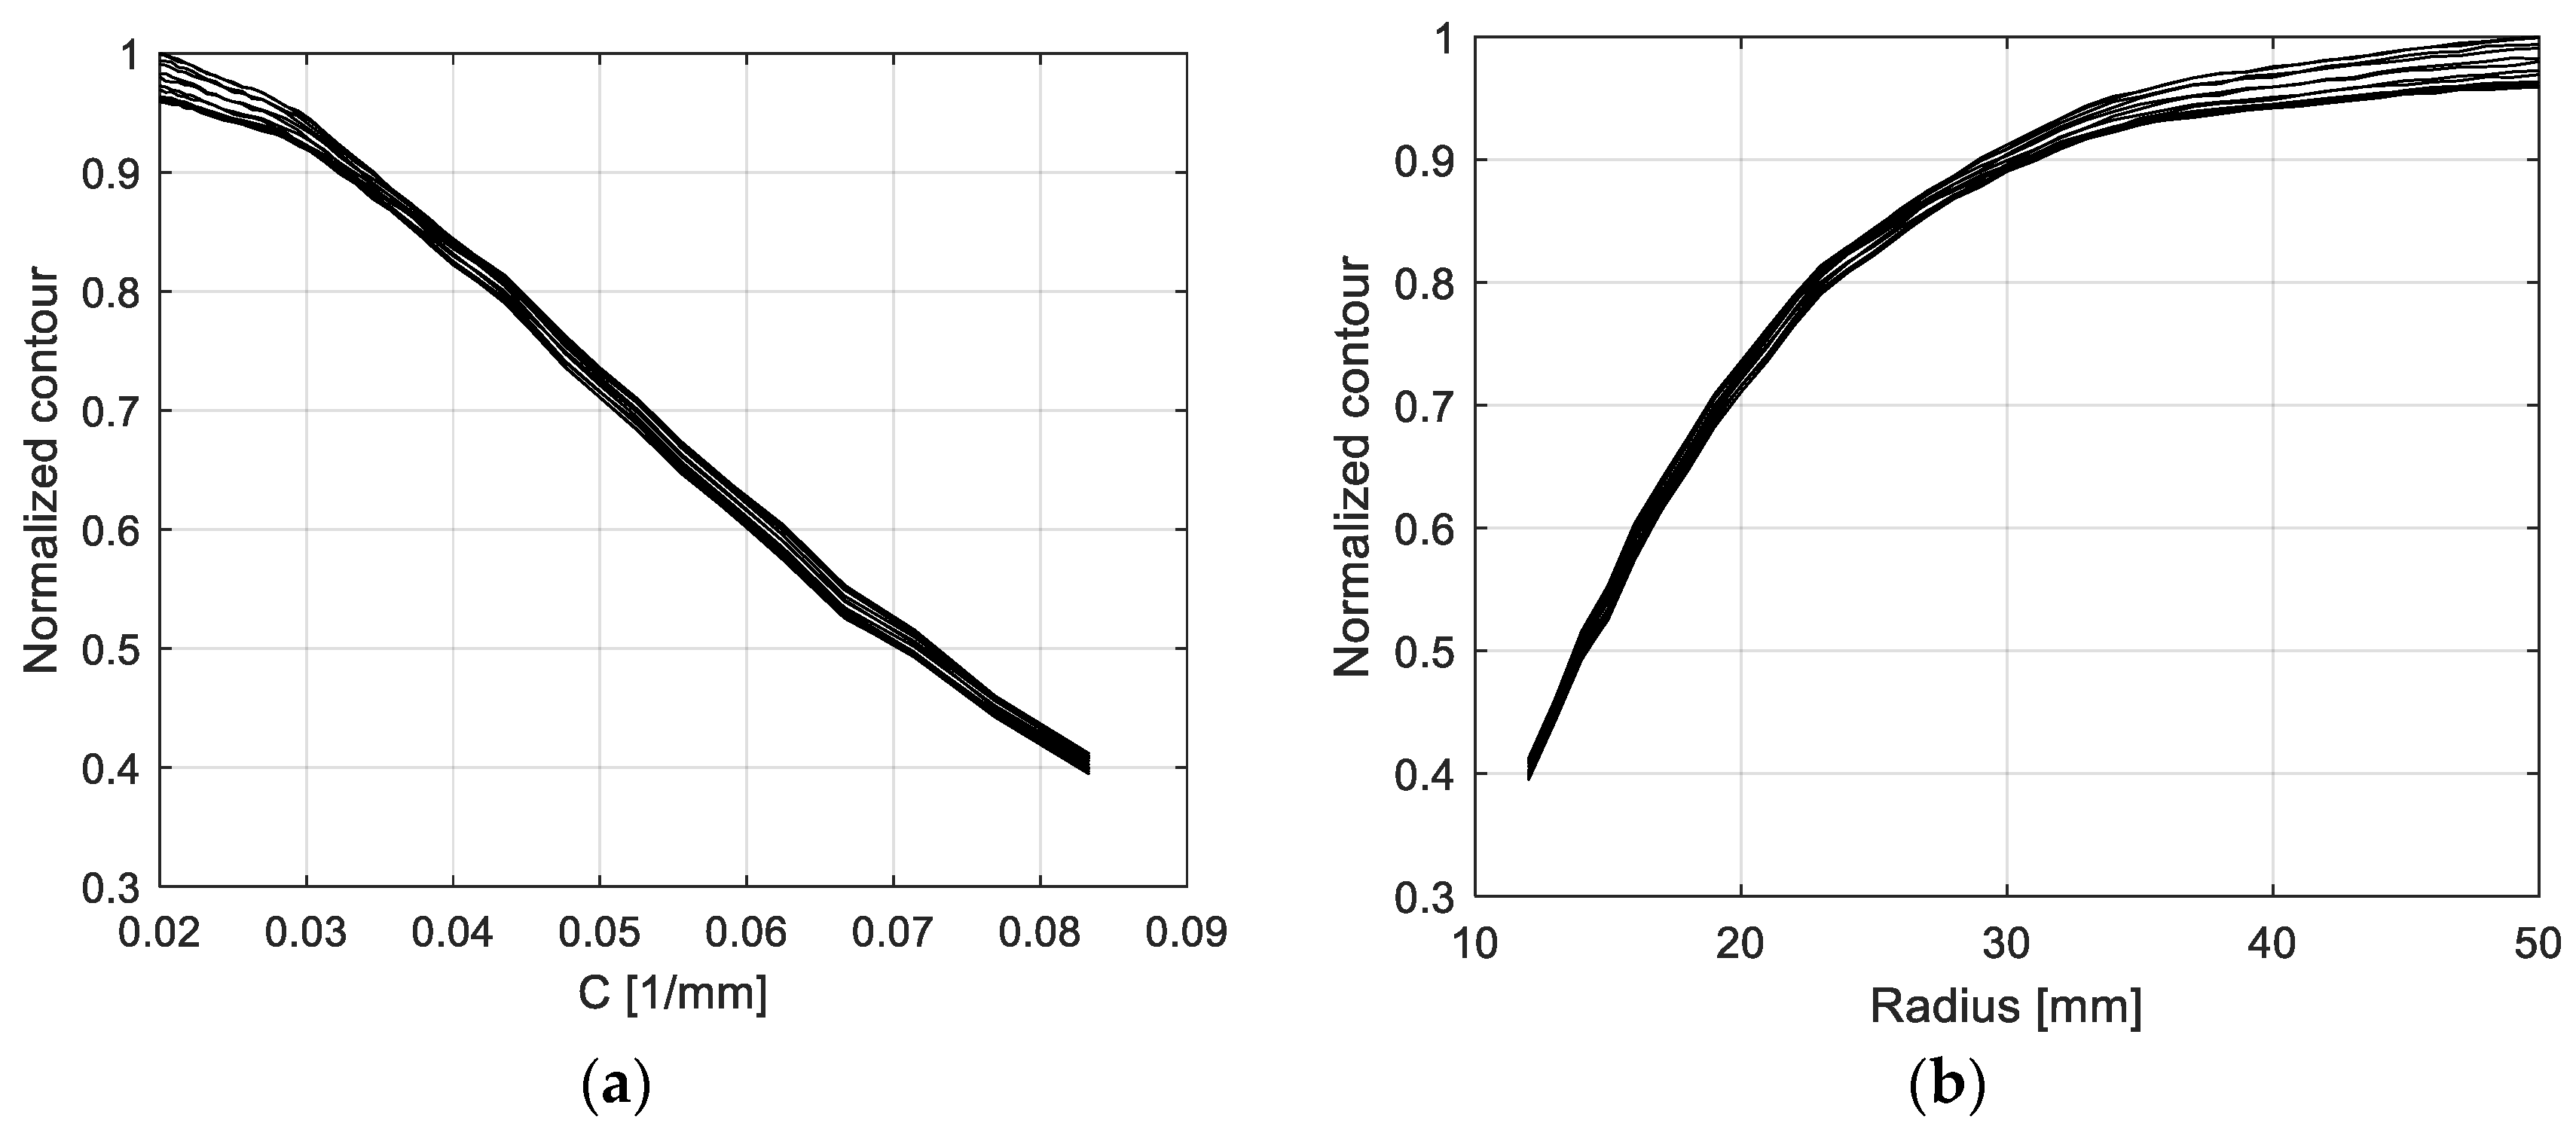
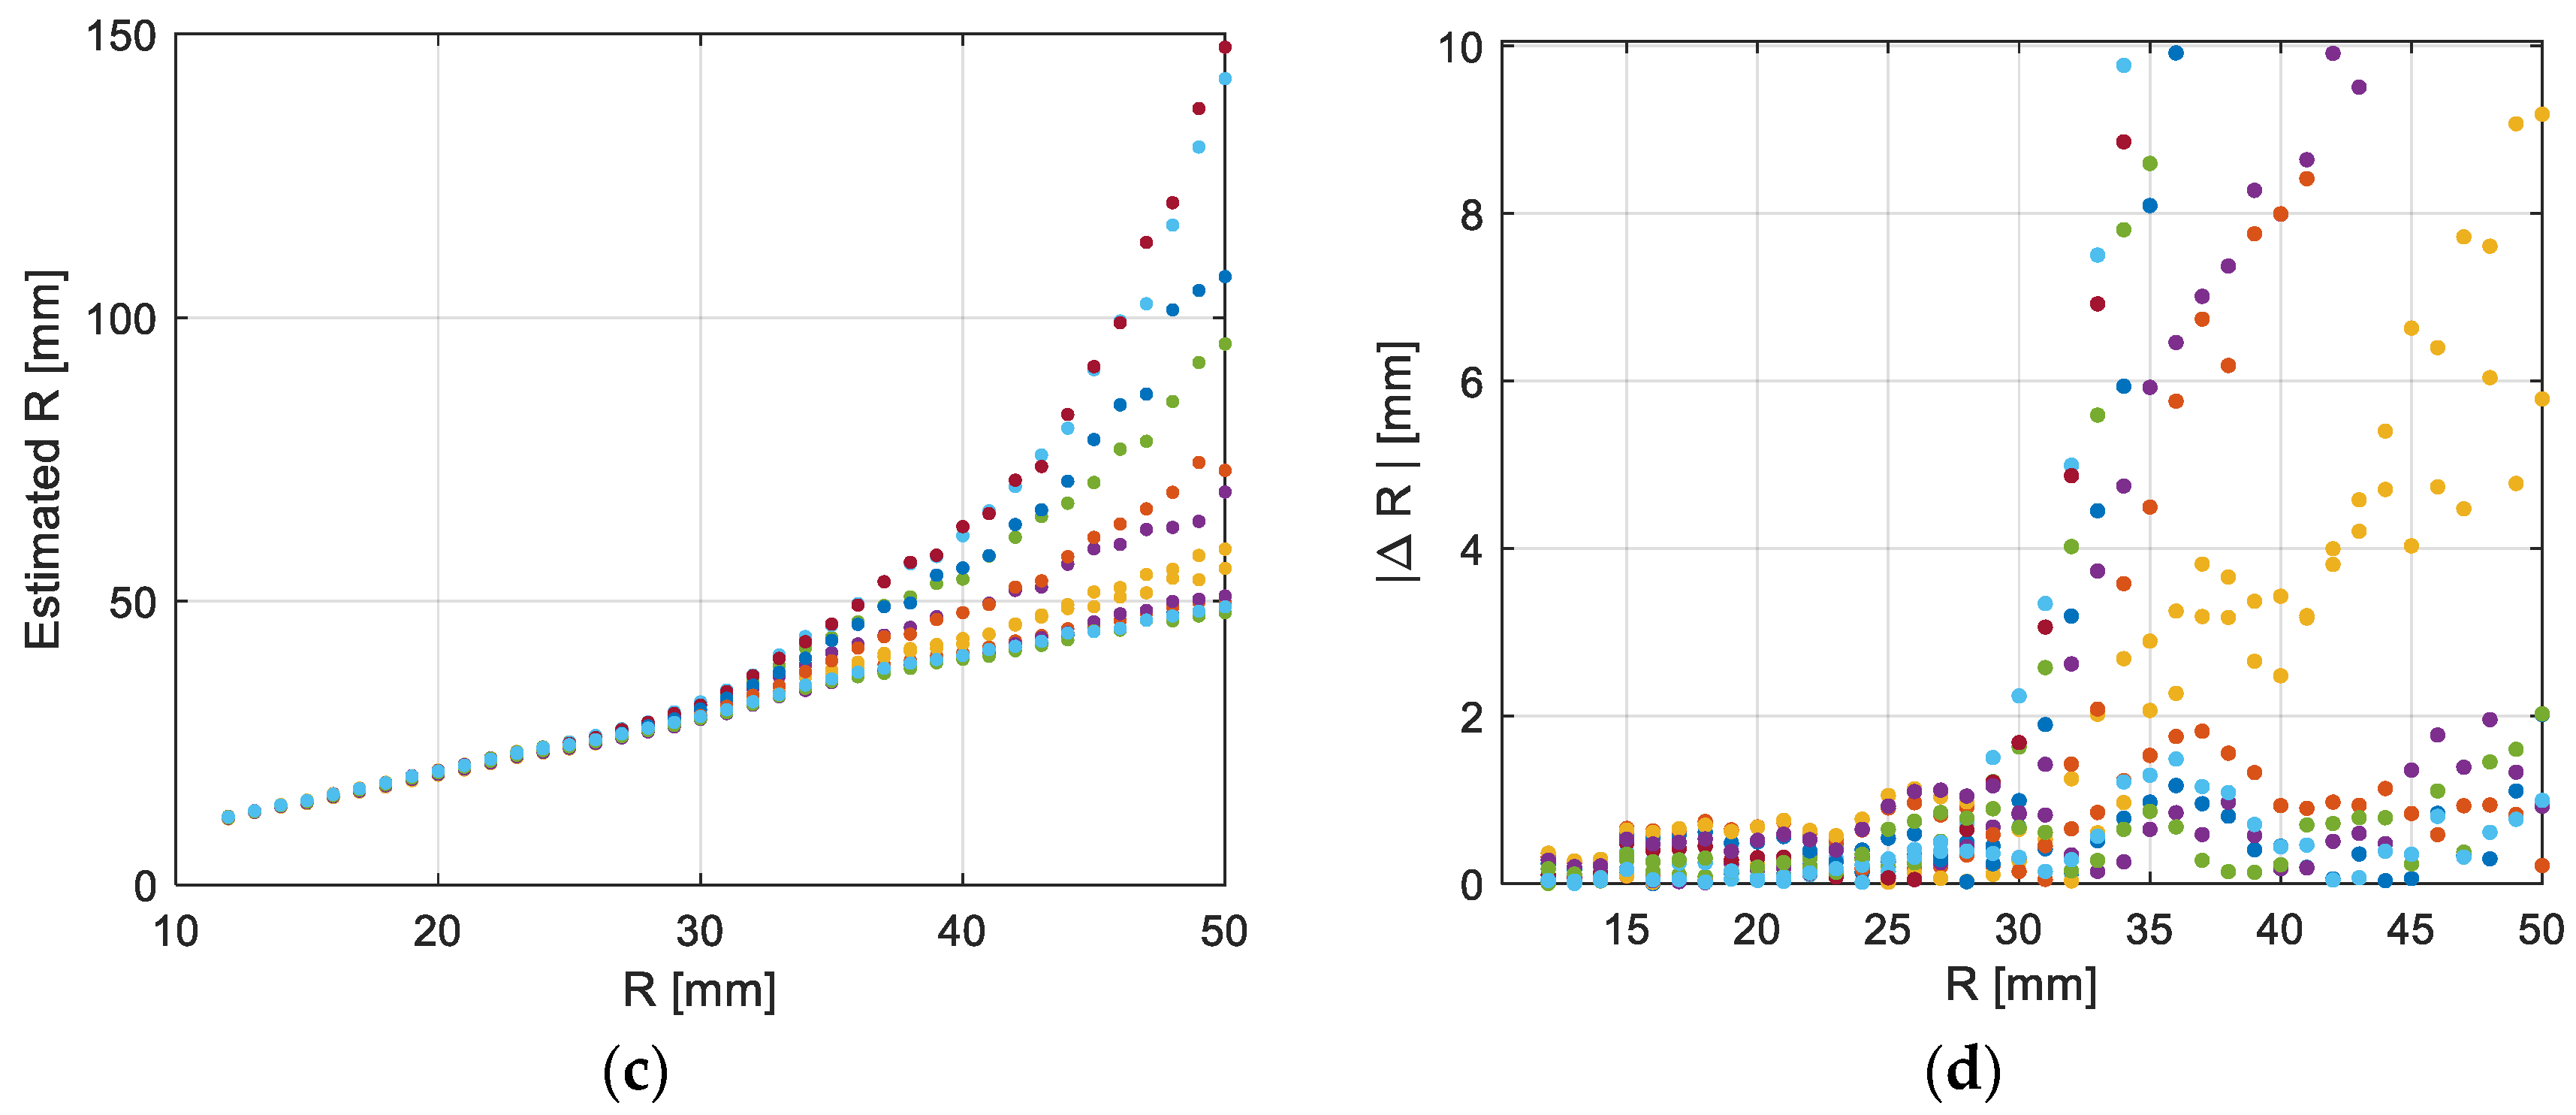
Similar conclusions as those obtained for the analysis of the influence of polarization on the envelope area method can be drawn for the contour length method (
Figure 8a–d). The dispersion of the curves in
Figure 8b for radii larger than 30 mm is particularly noticeable, which also results in a significant error in determining the radius.
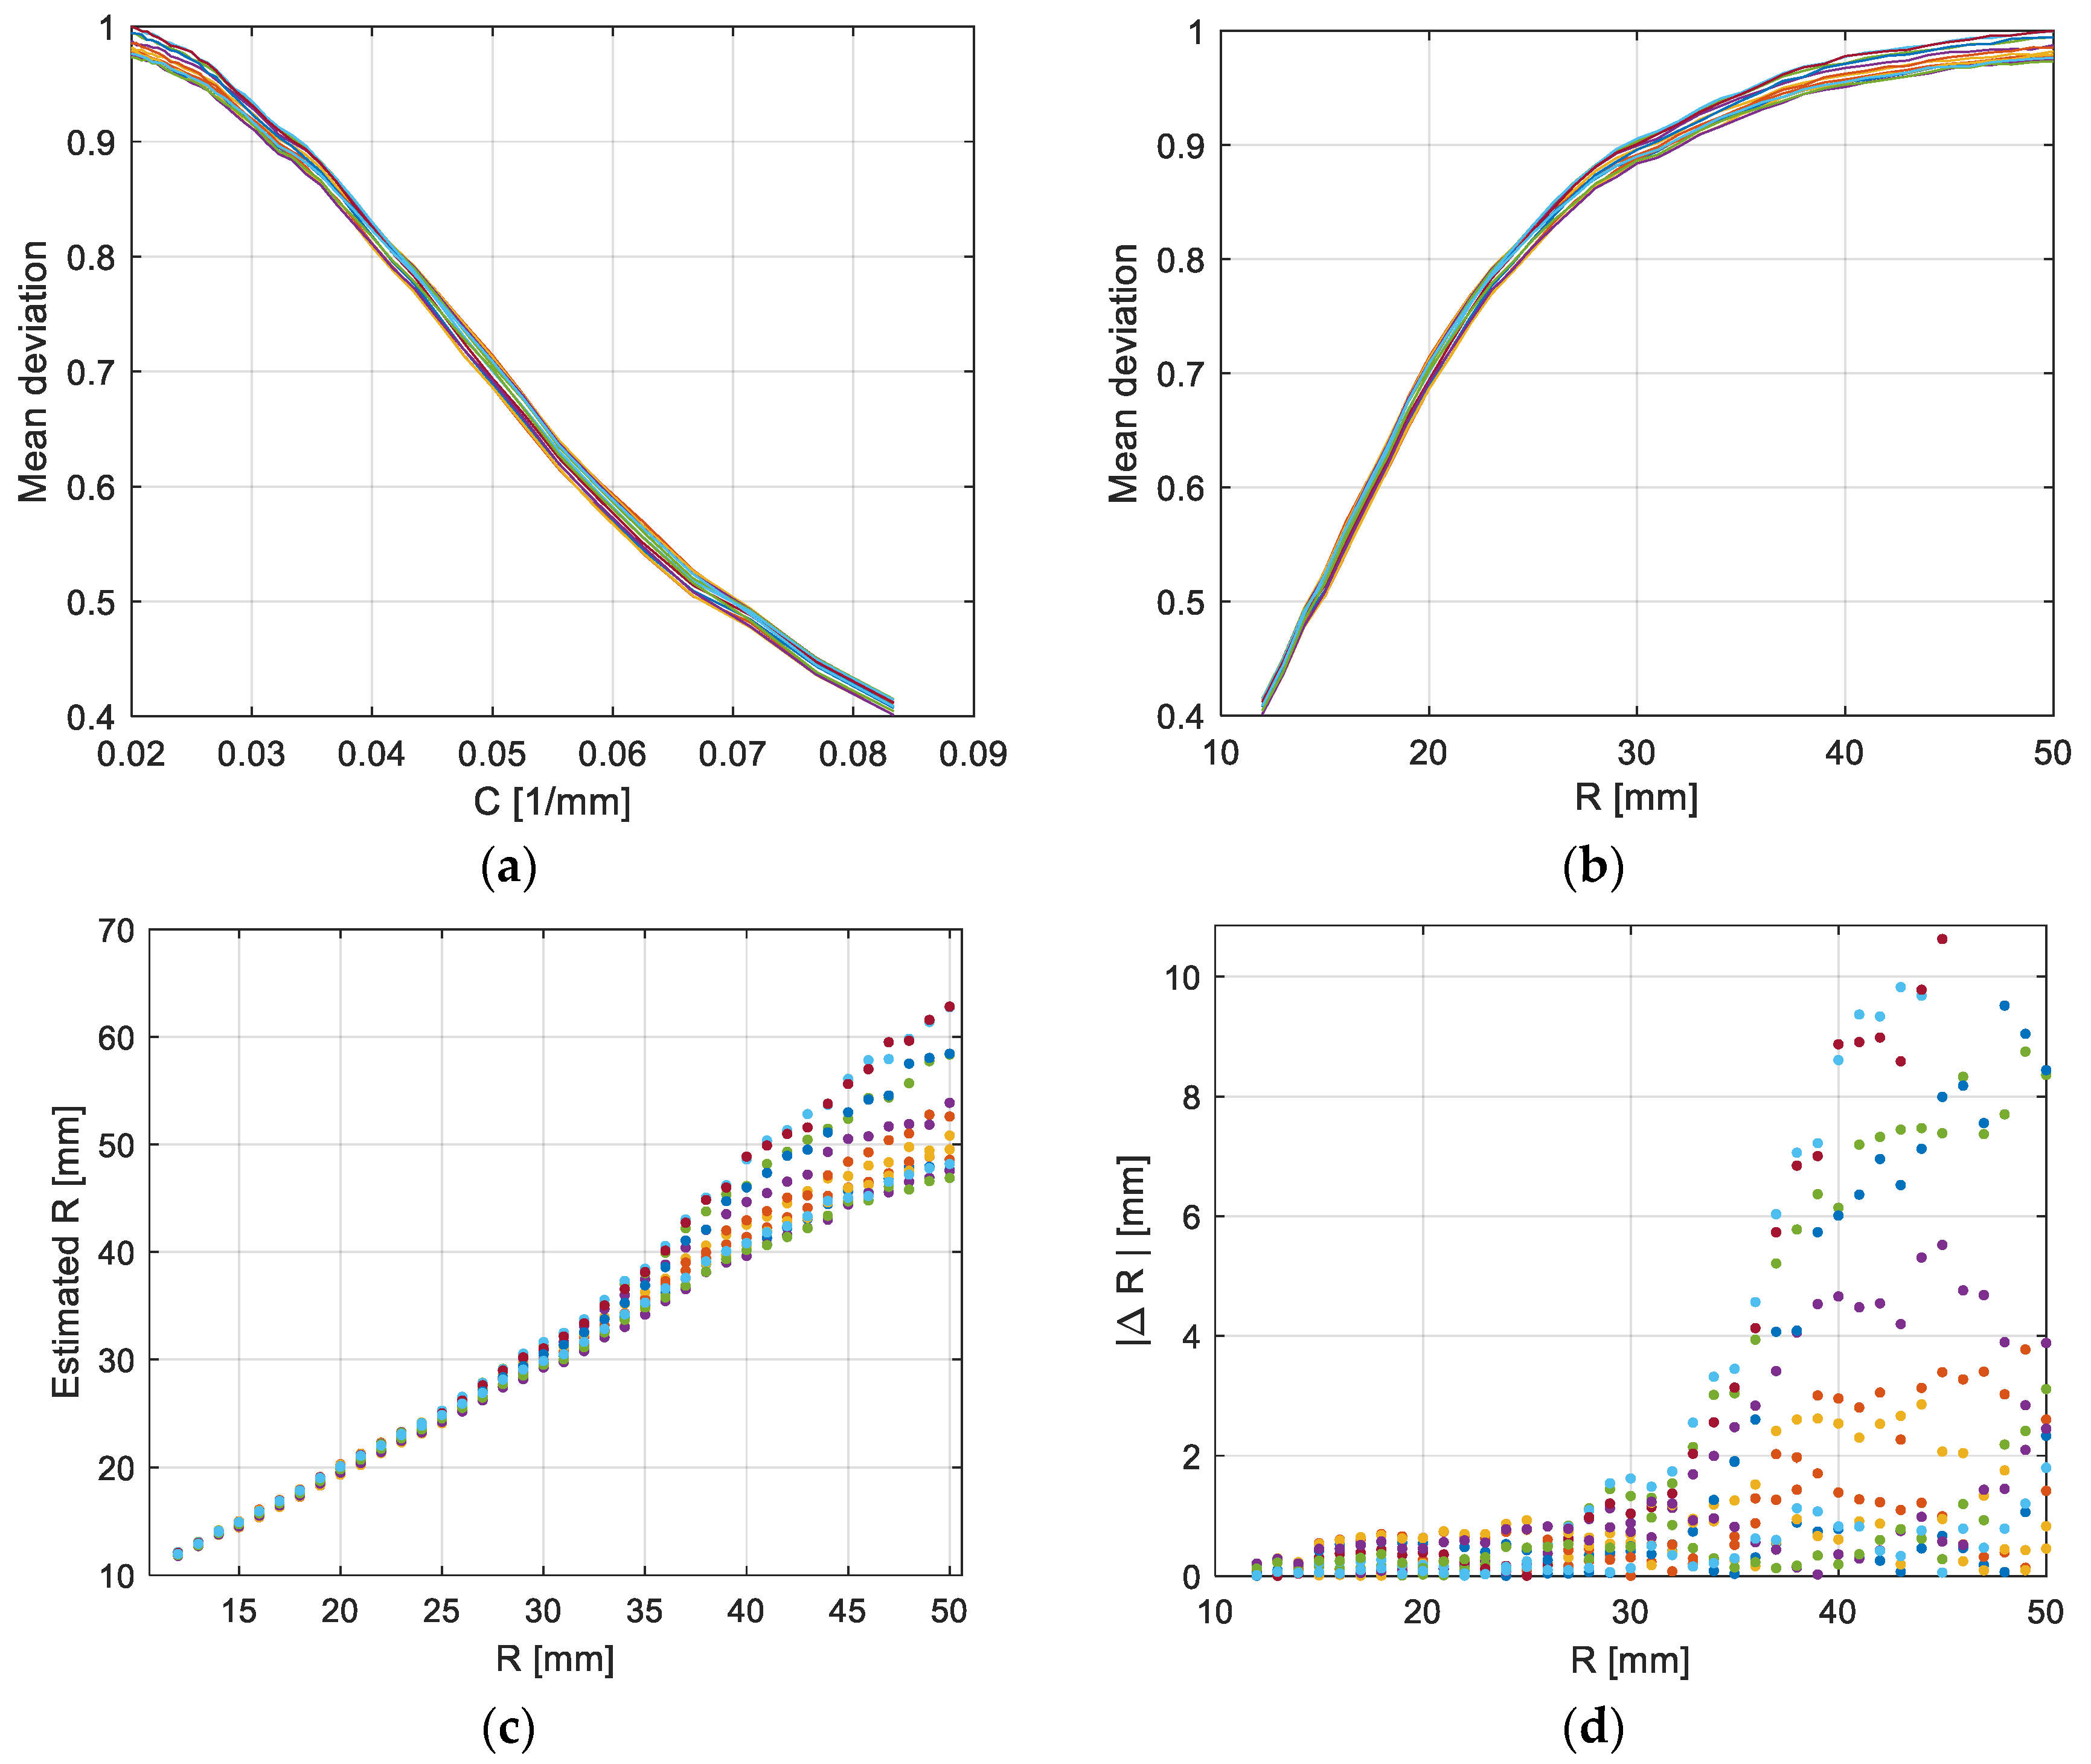
The dependency curves characteristic of the mean deviation from the local mean method are located closer to each other (
Figure 9a). The spread of the dependence of the mean deviation on the radius increases for larger radius values less than for the two previous methods (
Figure 9b). However, the radius values determined on the basis of the spectrum also differ significantly from the real values (
Figure 9c,d).
The above analysis of the three amplitude methods indicates that they are significantly dependent on the introduced radiation polarization. Wavelength determination methods are generally less sensitive to additional influencing factors.
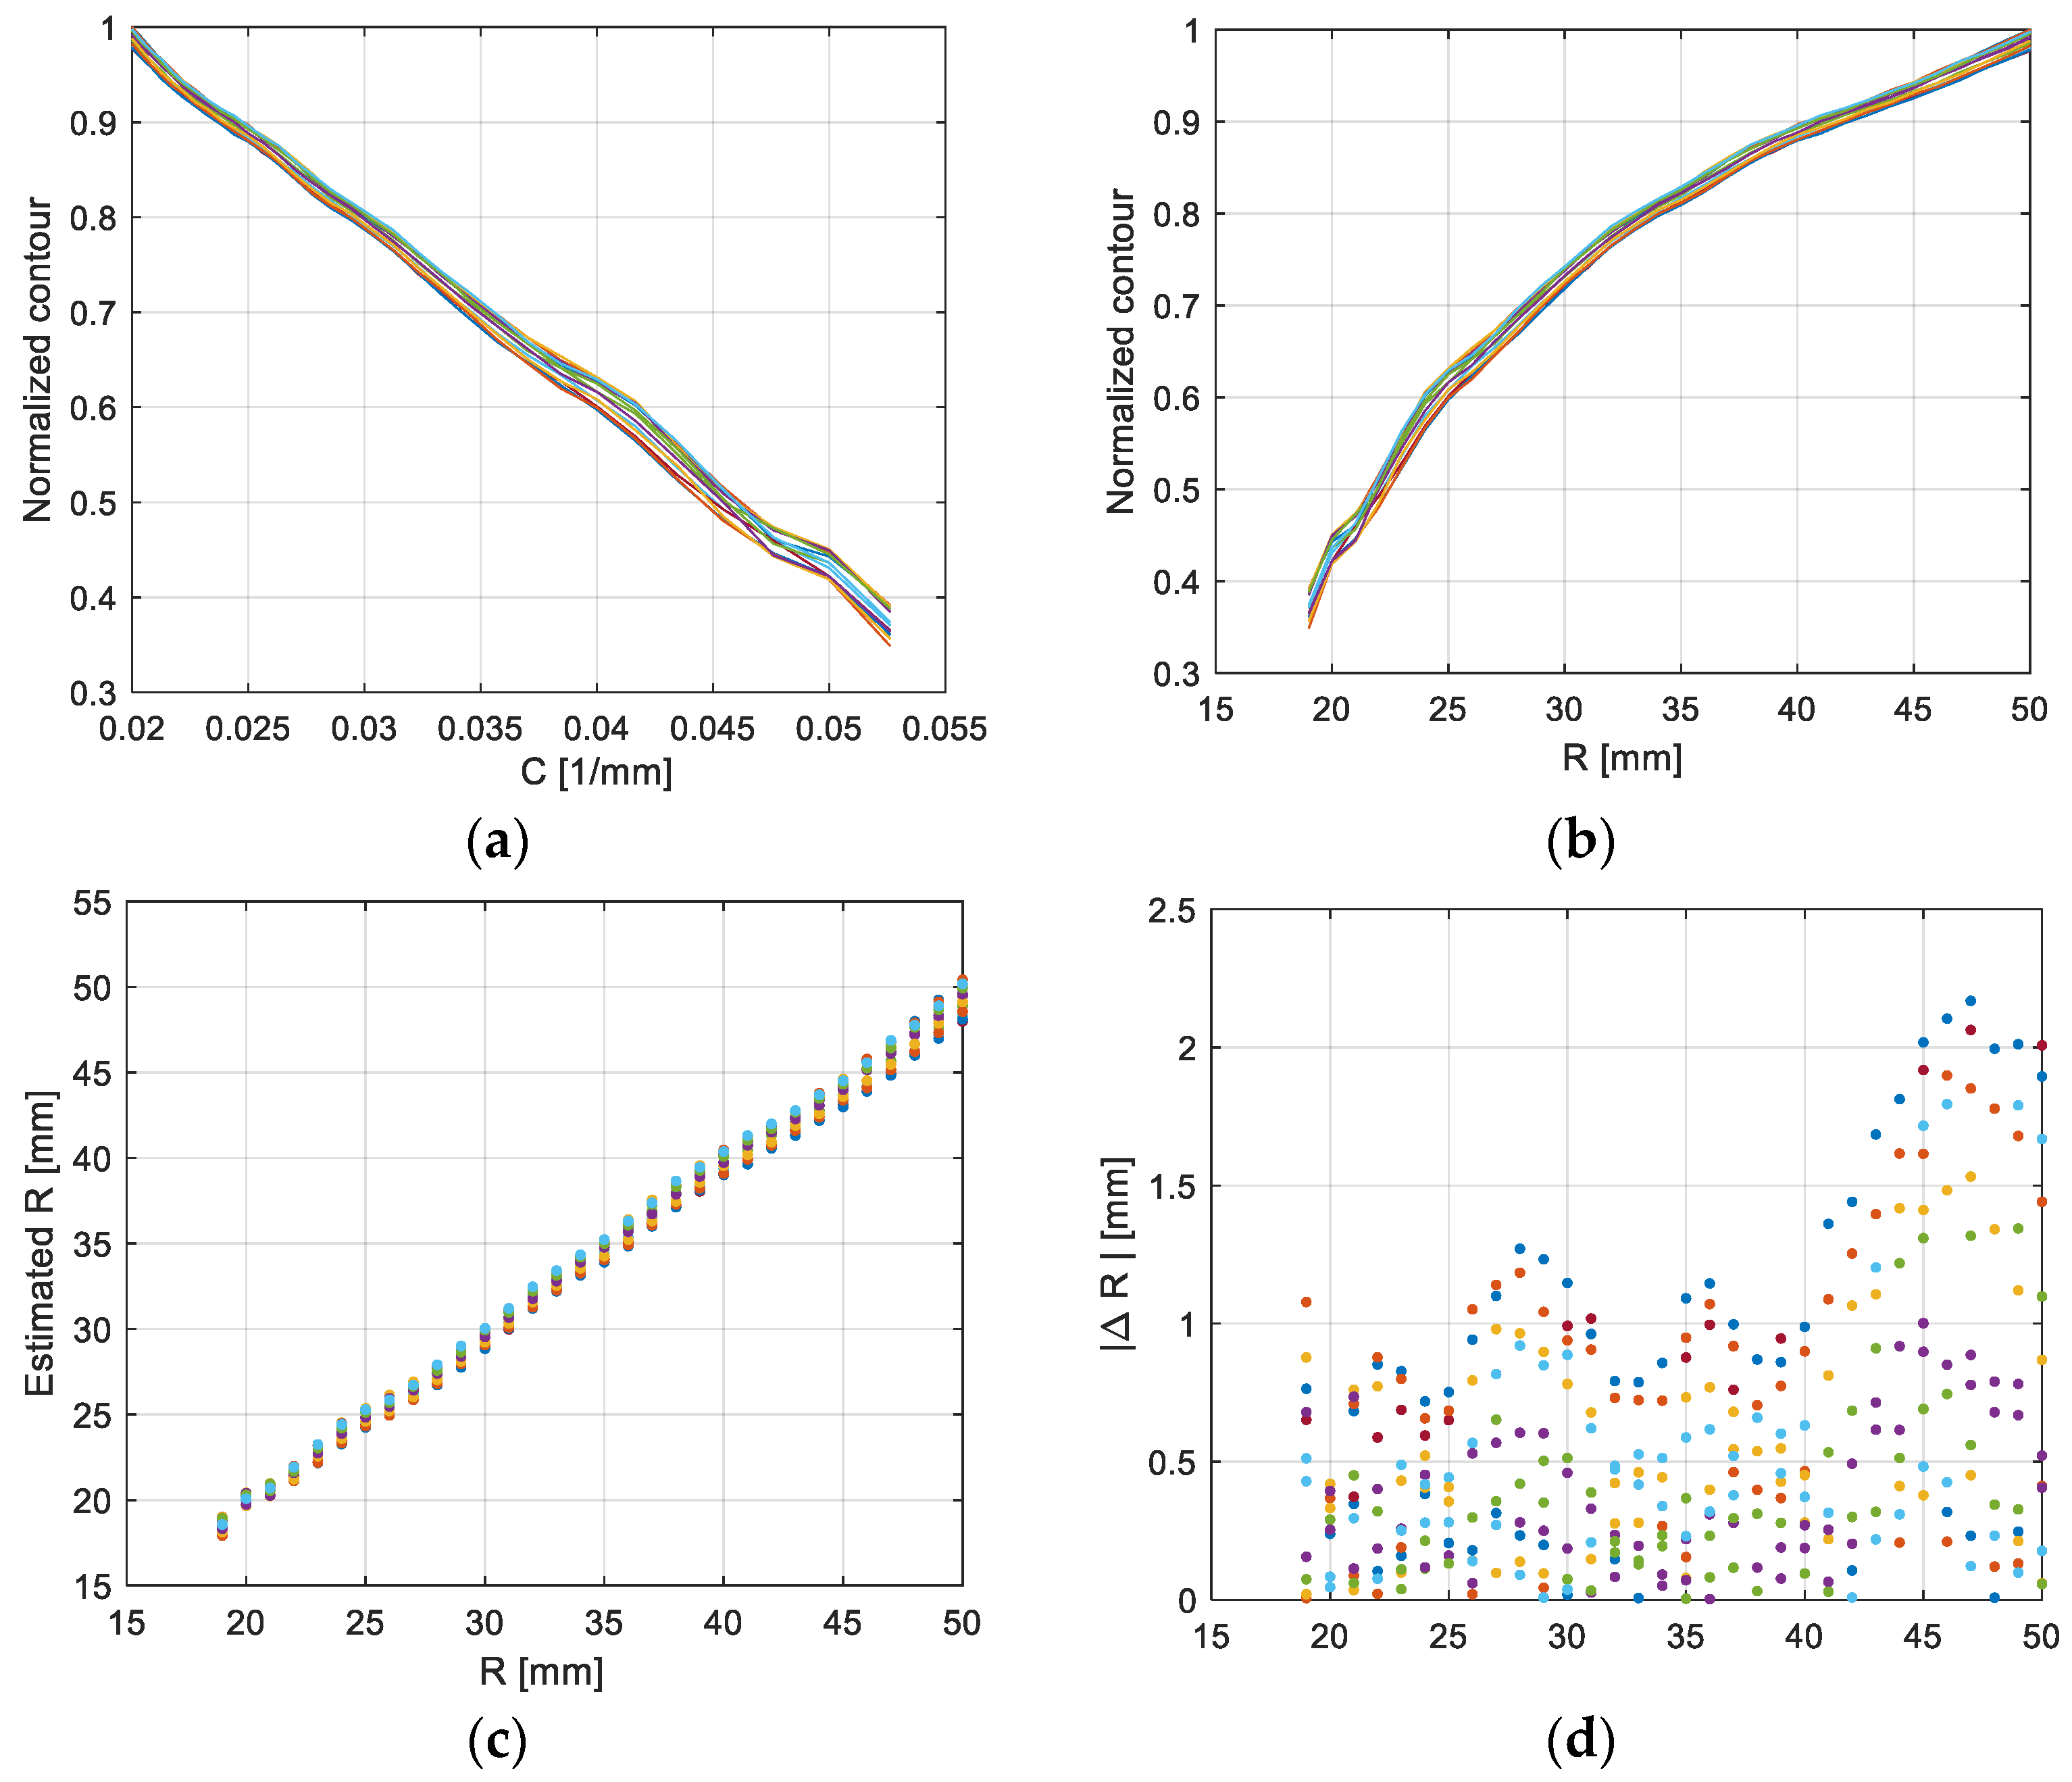
Figure 10a,b shows a very uniform distribution of characteristics for the entire analyzed range of radii. The estimated radius values shown in
Figure 10c,d are less dependent on polarization than for the amplitude methods. For radii above 40 mm, the increase in error for extreme polarizations is twice as large but is significantly smaller than for the amplitude methods.
4. Partial Regression of the Transformed Spectrum Length Method
The transmission spectrum of the TFBG grating can be treated as an analytical signal and methods such as multivariate calibration can be used.
The imperfection in measuring instruments means that optical spectra contain components that do not carry information and make its extraction difficult. As with every measurement, there is noise, but the characteristic distortion of the spectra is the baseline. For the data presented in this article, an additional effect that makes interpretation difficult is the change in polarization. The calibration regression model looks for the relationship between the measurement vector (optical spectrum) and the determined radius (curvature).
Methods such as PLS regression use the concept of the so-called latent variables. This method is used in many fields [
23]. Even in cases of complex dependencies and additional impacts [
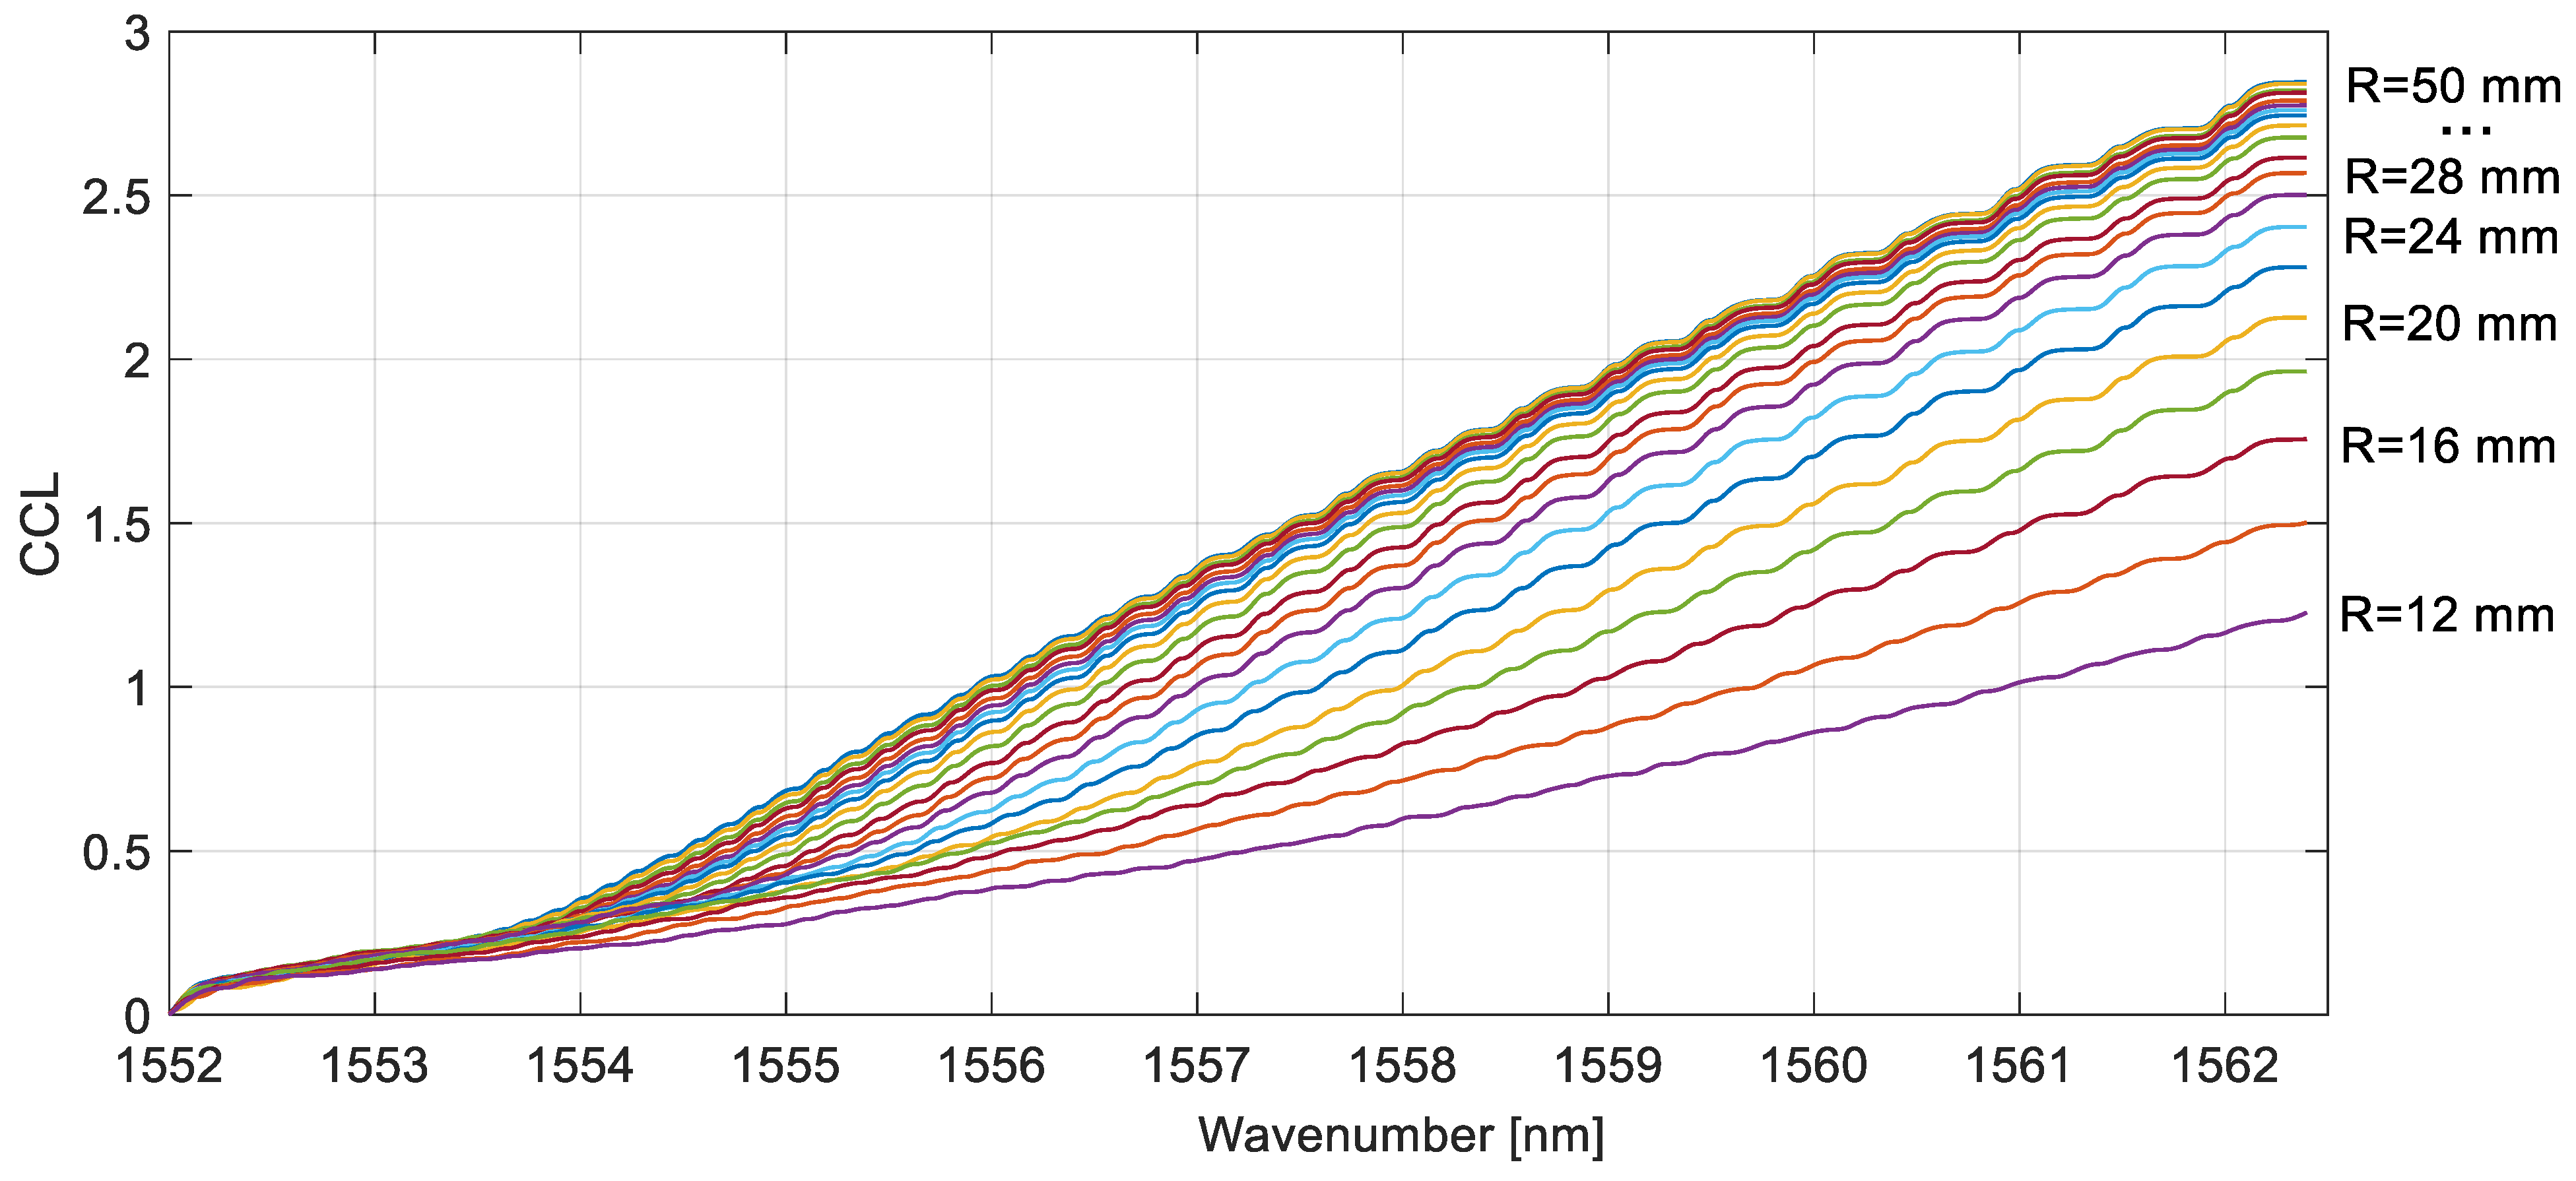
24]. The partial regression method belongs to the group of chemometric methods, which are a specific application of statistics and mathematics to the analysis of multidimensional data. Cumulative contour spectra were used to build the model (
Figure 11). The data set was divided into a training set consisting of 338 points and a test set of 169 points.
The results of modeling the relationship between the spectrum and the determined radius are shown in
Figure 12.
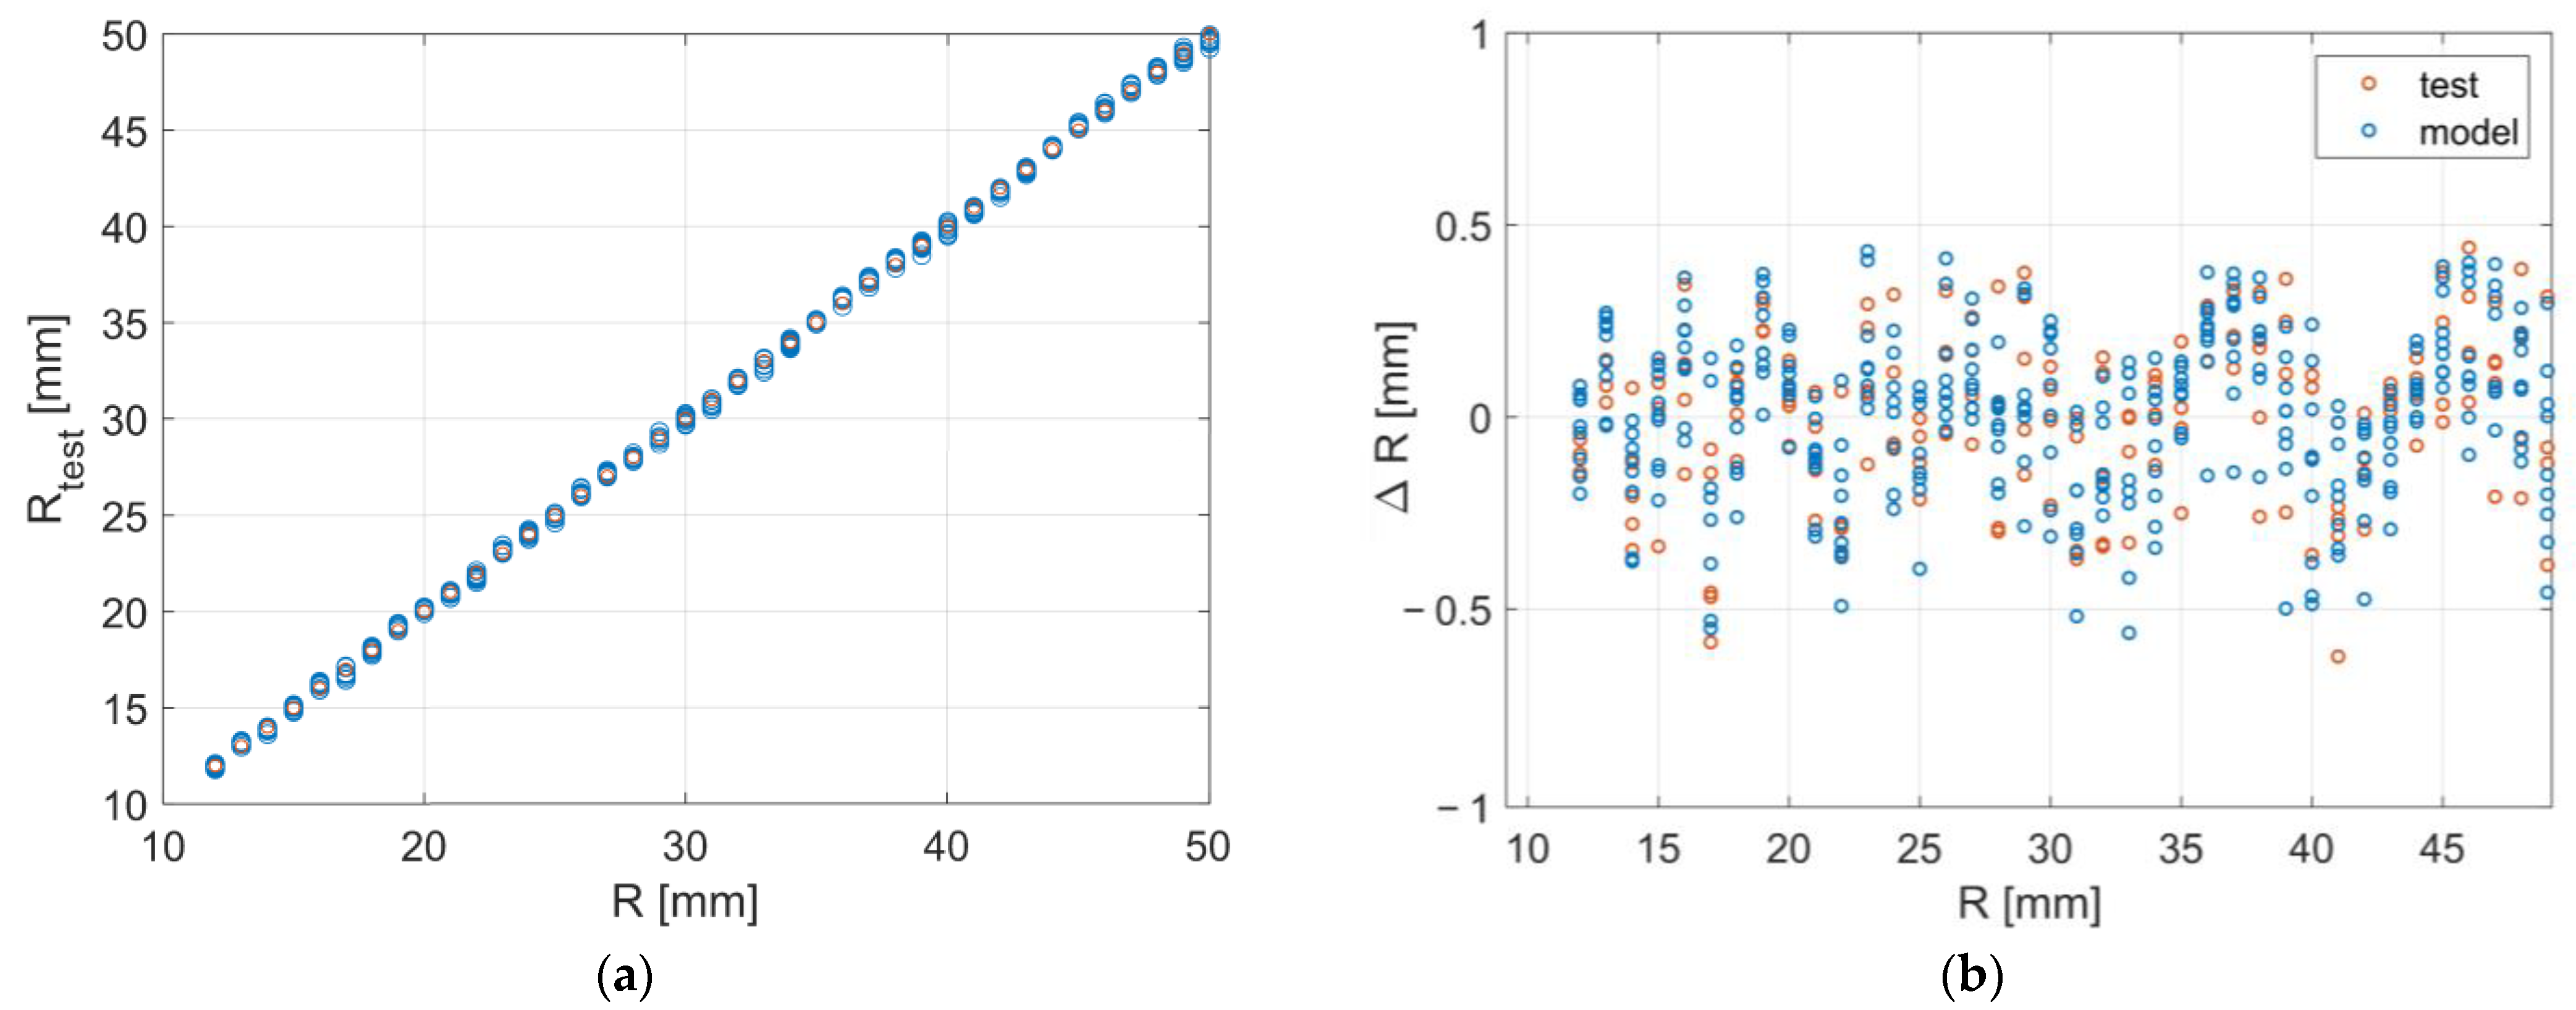
It could be seen in
Figure 12a that the estimated radius reflects the value from the experiment. There are no points that strongly deviate from the trend determined by the characteristics. The error of the bending radius estimation is presented in
Figure 12b and it could be seen that its value is only slightly changing for the different curvatures. The mean square error for the training data set was only 0.215 mm. However, for the test data set 0.223 mm. The method can handle the entire range of analyzed radii.
Table 1 presents a summary of the calculations performed. The parameters of the root mean square error (RMS) and the maximum error were used as indicators for comparing individual methods. The parameters were calculated for two ranges of bending radii, the limit of which is 30 cm. In the range of 12–30 cm, the mean squared error value for classical methods used in TFBG demodulation differs by two to three times compared to the PLS method. The maximum error is three to six times larger. In the range of 31–50 cm, the amplitude methods are characterized by a much higher value of both RMS and maximum error. Envelope and contour methods in this area can only be used under strict polarization control. The mean deviation from the local mean method fares only slightly better here. The wavelength method has a good RMS value of 0.87 cm. The wavelength method has a more even distribution of errors. By far the best parameters, respectively, 0.23 cm for RMS and 0.44 cm for maximum error, can be found with the newly developed method using the PLS model.


