Article

Comparing Usability of Augmented Reality and Virtual Reality for Creating Virtual Bounding Boxes of Real Objects

1
Electrical and Computer Systems Engineering, Monash University, Clayton 3800, Australia
2
Faculty of Engineering and Computer Science, University of Victoria, Victoria, BC V8P 5C2, Canada
3
School of Info Technology, Melbourne Burwood Campus, Deakin University, Burwood 3125, Australia
*
Author to whom correspondence should be addressed.
Appl. Sci. 2023, 13(21), 11693; https://doi.org/10.3390/app132111693
Submission received: 15 August 2023 / Revised: 2 October 2023 / Accepted: 3 October 2023 / Published: 26 October 2023
(This article belongs to the Special Issue Advanced Human-Robot Interaction)

Abstract

:
This study conducts a comparative analysis of user experiences of Augmented Reality (AR) and Virtual Reality (VR) headsets during an interactive semantic mapping task. This task entails the placement of virtual objects onto real-world counterparts. Our investigation focuses on discerning the distinctive features of each headset and their respective advantages within a semantic mapping context. The experiment employs a user interface enabling the creation, manipulation, and labeling of virtual 3D holograms. To ensure parity between the headsets, the VR headset mimics AR by relaying its camera feed to the user. A comprehensive user study, encompassing 12 participants tasked with mapping six tabletop objects, compares interface usability and performance between the headsets. The study participants’ evaluations highlight that the VR headset offers enhanced user-friendliness and responsiveness compared to the AR headset. Nonetheless, the AR headset excels in augmenting environmental perception and interpretation, surpassing VR in this aspect. Consequently, the study underscores that current handheld motion controllers for interacting with virtual environments outperform existing hand gesture interfaces. Furthermore, it suggests potential improvements for VR devices, including an upgraded camera feed integration. Significantly, this experiment unveils the feasibility of leveraging VR headsets for AR applications without compromising user experience. However, it also points to the necessity of future research addressing prolonged usage scenarios for both types of headsets in various interactive tasks.

1. Introduction

The accelerated evolution of Augmented Reality (AR) and Virtual Reality (VR) technologies has ushered in transformative possibilities across diverse domains. AR overlays digital information onto the real world, enhancing contextual understanding, while VR immerses users in entirely virtual environments. These technologies have demonstrated their prowess in education, healthcare, gaming, and beyond. Recent studies, such as the work of Bozgeyikli et al. [1], have dissected the nuances of user experiences, emphasizing the significance of tangible interfaces and motion controllers. Xiao et al. [2] highlighted the latency and errors in hand-tracking systems compared to traditional touch screens. Batmaz et al. [3] explored stereo deficiencies in AR and VR headsets, revealing AR’s superiority in user target selection due to heightened spatial awareness. While the existing literature delves into these differences, our study explores a common interface granting users comprehensive control over virtual objects designed and crafted on both AR and VR devices.
AR/VR is increasingly used for human–robot interaction [4,5,6]. It can also facilitate human-augmented mapping with various use cases, including direct teleoperation [7], providing robot goals [8], aiding robotics application development [9], and visualizing robot intent [10]. Our study introduces a uniform interface enabling user control of virtual objects across an AR and a VR headset. This application aligns with human-augmented mapping [11] principles, actively involving users in the mapping process. Past works employed query-based human-in-the-loop systems, allowing users to rectify and inform robots about the semantic details of different regions using natural gestures [12]. Machine learning algorithms empower gesture recognition systems, infusing naturalism into interactions and expanding the scope of these technologies in computational science and engineering [13] and more specifically in human–robot interaction. We specifically focus on user experiences in semantic mapping, entailing the attachment of meaningful labels to sensory data for environment depiction.
This paper presents a comparison study of the Microsoft Hololens 2 AR headset and the Meta Quest 2 VR headset on the same mapping task. An important difference between user experiences is how the user is able to manipulate the virtual objects: Hololens uses hand gestures and Quest uses controllers. Notably, the VR headset emulates AR through the Meta Quest 2’s Passthrough feature, presenting users with grayscale surroundings. This emulation ensures controlled experiments, and our consistent environment facilitates in-depth analysis via a within-subjects user study. This study comprehensively compares the usability and feasibility of current AR and VR technologies in interactive tasks, including human-augmented semantic mapping. Specifically, we evaluate the usability, comfort, overall map accuracy, and task completion speed of various AR and VR headsets for creating and manipulating virtual objects and attaching labels to represent real-world tabletop objects. In particular, we investigate the usability and effectiveness of the different AR and VR headsets for a task in which the users manually create and manipulate virtual cuboid, spherical, and cylindrical volumes and attach labels to them to represent real-world tabletop objects. We explore which headset is easier to learn and use, more comfortable to use and wear, and which produces better overall map accuracy and faster task times. Our developed interfaces can also be extended to work on pre-generated autonomous semantic maps of larger room-scale environments. This comprehensive study contributes to understanding the capabilities and limitations of AR and VR technologies in enhancing user experiences in human-augmented semantic mapping scenarios.

2. Mixed Reality User Mapping Interface

The aim of this project is to explore and evaluate whether AR and VR can aid in human-augmented semantic mapping, with a focus on how AR and VR technology compare for this particular interactive mapping task. This project features a common UI that provides users with the ability to create and customize virtual 3D maps populated with virtual 3D objects, attaching rich semantic labels to these objects. We deploy this interface on an AR and a VR headset, with both devices having the same semantic map-building functionalities. However, the VR system utilizes VR motion controllers, whereas the AR system utilizes natural hand gestures. A user performing a mapping task with the VR system as well is shown in Figure 1.
The interface provides the user with the following map-building functionalities:
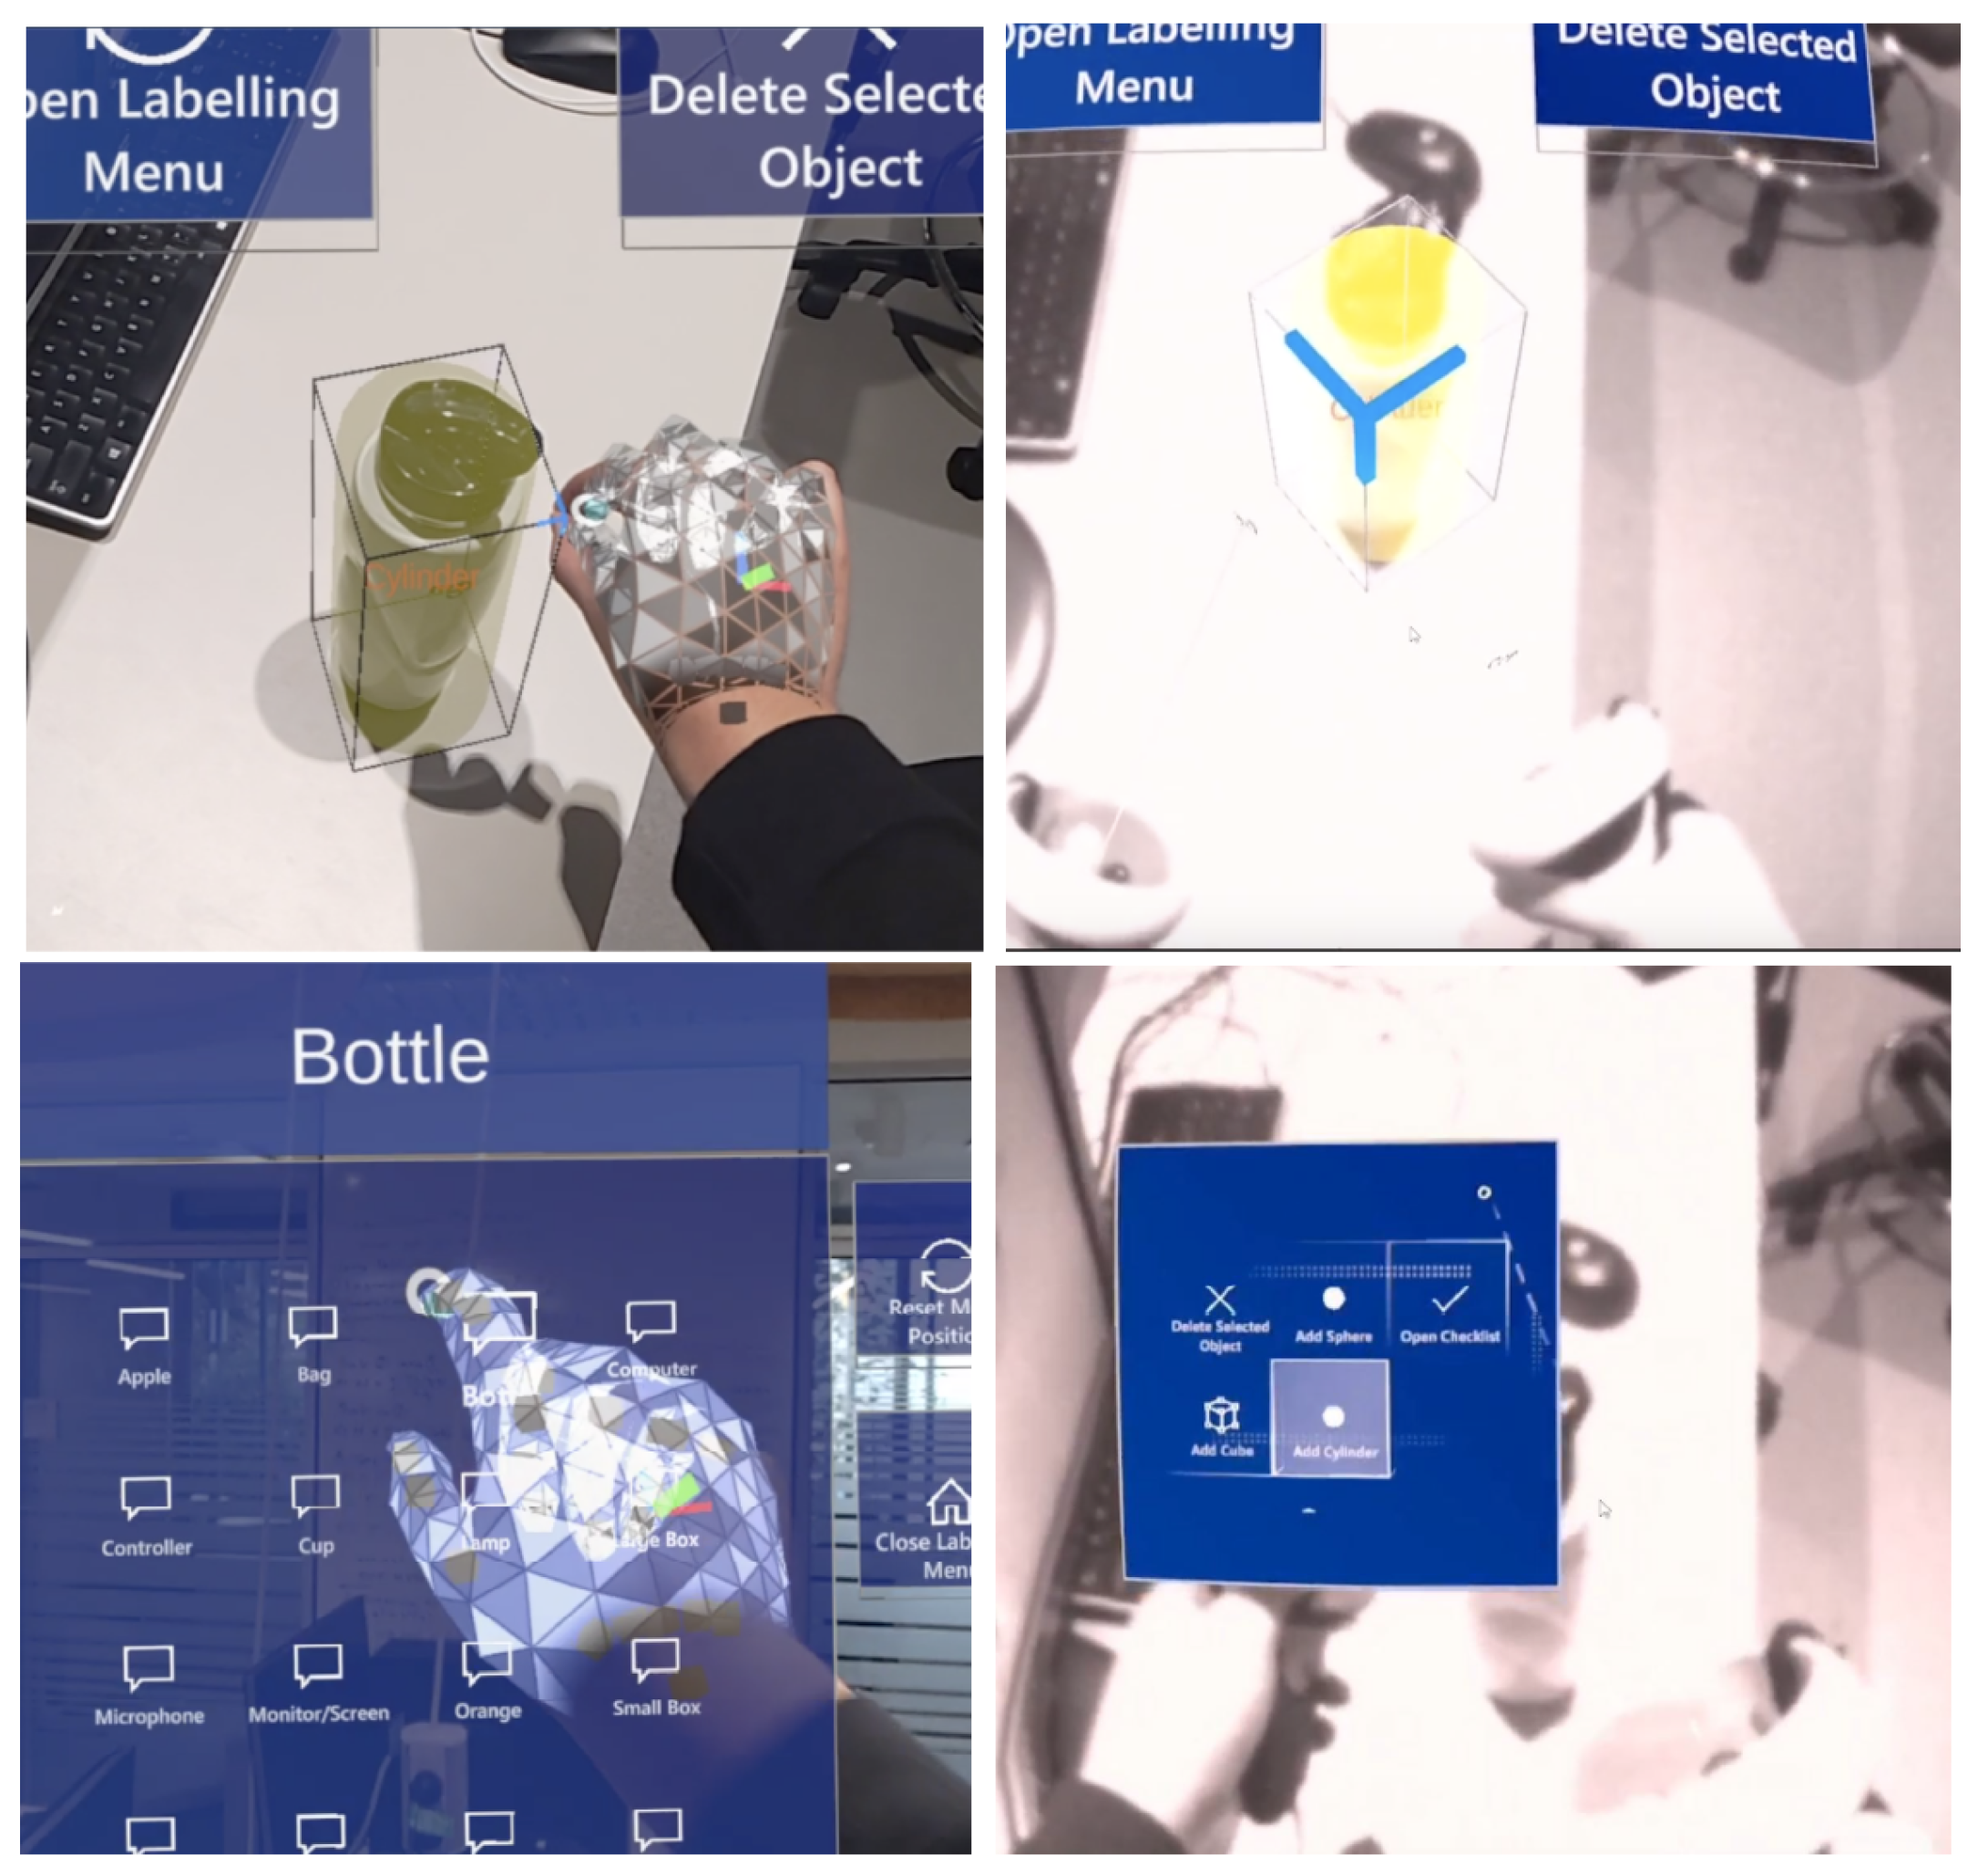
  • Virtual Object Creation and Deletion: The interface allows users to create and delete virtual 3D geometries to virtually map real objects. This is shown in Figure 2. These geometries represent primitive shapes, which are cuboids, spheres, and cylinders. These virtual objects can be spawned at the user’s command using hand gestures/controller inputs. Users are also given the ability to remove any virtual object from their virtual map at their discretion.
  • Manipulating and Labelling Virtual Objects: The system also allows users to label virtual objects using a predetermined list of object labels corresponding to the physical objects used in the user study. Each virtual object’s pose is also modifiable by interacting with its bounding box, allowing users to translate, rotate, and scale these virtual objects.
  • Input Methods: All functions provided by the virtual mapping interfaces can be accessed using hand gestures in the AR system or controller inputs in the VR system. In AR, near interactions are supported through finger-tap and hand-grab gestures, while far interactions can be performed using pointed air-pinch gestures which made use of an arm ray that could be directed at virtual objects and their modifiable features. In VR, the triggers of VR controllers are mapped to perform object selection and object manipulation when squeezed, while labeled buttons provide shortcuts for creating and deleting virtual objects when pressed. The different control methods are employed by users to manipulate and create any virtual objects and their semantic labels (shown in Figure 2). These methods form the basis of our comparison.

3. User Study

3.1. User Study Procedure

Before the user study commenced, each participant read an explanatory statement and filled out a consent form. In our study, each participant was asked to generate a 3D semantic map of a fixed experimental tabletop environment shown in Figure 3 using the common interface described in Section 2 with both headsets. The order of devices was alternated to reduce ordering effects.
Each participant received a 5-min tutorial on the operation of each headset and the developed mapping interface. This involved a practice session to familiarize themselves with the headset controls. To begin the mapping task, the participant starts at a known, fixed initial position; however, they are free to move about the environment once the task begins. Each task consists of the participant identifying and labeling six differently sized real-world objects (whose 3D bounding box ground truths are known) representing cuboids, spheres, and cylinders. These objects are shown in Figure 1. The participant is given 8 min to complete the task and is only allowed one attempt per headset. The participant is also given a checklist of objects and their labels to include in their semantic map. This feature was included to avoid the mislabelling of objects by selecting incorrect labels to focus on the comparison of the different AR and VR devices. At the completion of the task, or after exceeding the time limit, the participant is then asked to save the created map and complete a questionnaire to capture their experience working with the provided device. The participant is then asked to repeat the task on the other device, after which the participant is asked to complete a final post-study questionnaire.

3.2. Devices

For the mapping performance comparison between the two devices, we wanted users to see the real-world environment that was being mapped as we believed this would be a practical application for AR and VR within this interactive task. While this is trivial in AR applications, this had to be implemented in the VR application. We used the Microsoft HoloLens 2 as our AR platform and the Meta Quest 2 as our VR platform.

3.2.1. Virtual Reality (VR) Interaction Interface

In the realm of Virtual Reality (VR), the interaction interface primarily revolves around specialized motion controllers. These controllers are designed with precision and functionality in mind, typically consisting of ergonomic handheld devices equipped with buttons, triggers, and sensors. Users can manipulate virtual objects within the digital environment through direct physical gestures. This includes actions such as pointing, grabbing, rotating, and scaling virtual objects. Importantly, VR motion controllers often provide tactile feedback to users, enhancing immersion by simulating the sensation of touching and interacting with objects. Users can physically reach out and grasp objects in the virtual world, offering a high degree of control and precision in spatial interactions. However, it is essential to acknowledge that the learning curve associated with VR motion controllers may vary among users, particularly those new to VR technology. The initial unfamiliarity with the controllers can lead to a brief adjustment period, which can affect the user experience during the early stages of interaction.

3.2.2. Augmented Reality (AR) Interaction Interface

In the Augmented Reality (AR) domain, the interaction interface takes a different form, relying primarily on natural hand gestures and movements. AR headsets are equipped with sophisticated sensors and cameras that track the user’s hands and gestures in real-time. This enables users to interact with virtual objects and overlay digital information onto the physical world seamlessly. AR interfaces often leverage intuitive gestures, such as swiping, pinching, and tapping, to manipulate virtual content. Users can interact with these virtual elements directly within their natural field of view, fostering a sense of presence and integration with the real world. AR interfaces excel in offering an intuitive and visually unobtrusive means of interaction. They capitalize on the user’s innate understanding of physical gestures, making them accessible to a wide range of users without the need for specialized controllers. However, challenges may arise in achieving precise interactions in complex AR environments, where recognizing fine-grained gestures accurately can be demanding.

3.2.3. Practical Utilization

Both VR and AR interaction interfaces find practical utilization across a spectrum of industries and applications. In VR, these interfaces have gained prominence in fields such as gaming, architectural design, and medical training, where users can engage with virtual environments, simulate procedures, and manipulate digital models with a high degree of fidelity. In contrast, AR interfaces have found applications in industries like education, maintenance, and navigation, enabling users to access contextual information and perform hands-free tasks within their real-world surroundings. The choice between VR and AR often depends on the specific use case. VR’s immersive interaction interface shines in scenarios requiring detailed spatial manipulation and full immersion, while AR’s gesture-based interface excels in situations where users need to overlay digital information onto their immediate environment without disrupting their physical surroundings. As both technologies continue to advance, their practical utilization is expected to expand into new domains, transforming how users interact with digital content and information in diverse contexts.
The Quest 2 provides the Passthrough feature, which uses the device’s various cameras and infrared sensors to visualize the user’s real-world surroundings [14], as seen in Figure 2. As a result, both of these devices can display virtual objects co-located and visualized in the real world. Both devices provide head pose tracking and localize to a fixed reference frame. To ensure consistency between trials and an accurate ground truth map, both devices had to be localized to a known fixed world origin before beginning the mapping tasks. This was carried out on the AR headset using packages provided by Vuforia [15] to identify an ArUco marker representing the world’s origin. On the VR headset, localization was performed using spatial anchors provided by the Oculus SDK. User map data were then saved relative to these known points in the reference frame of the headsets.

3.3. Metrics

3.3.1. Objective Metrics

To analyze the performance of the different devices for the semantic mapping task, the following metrics were utilized:
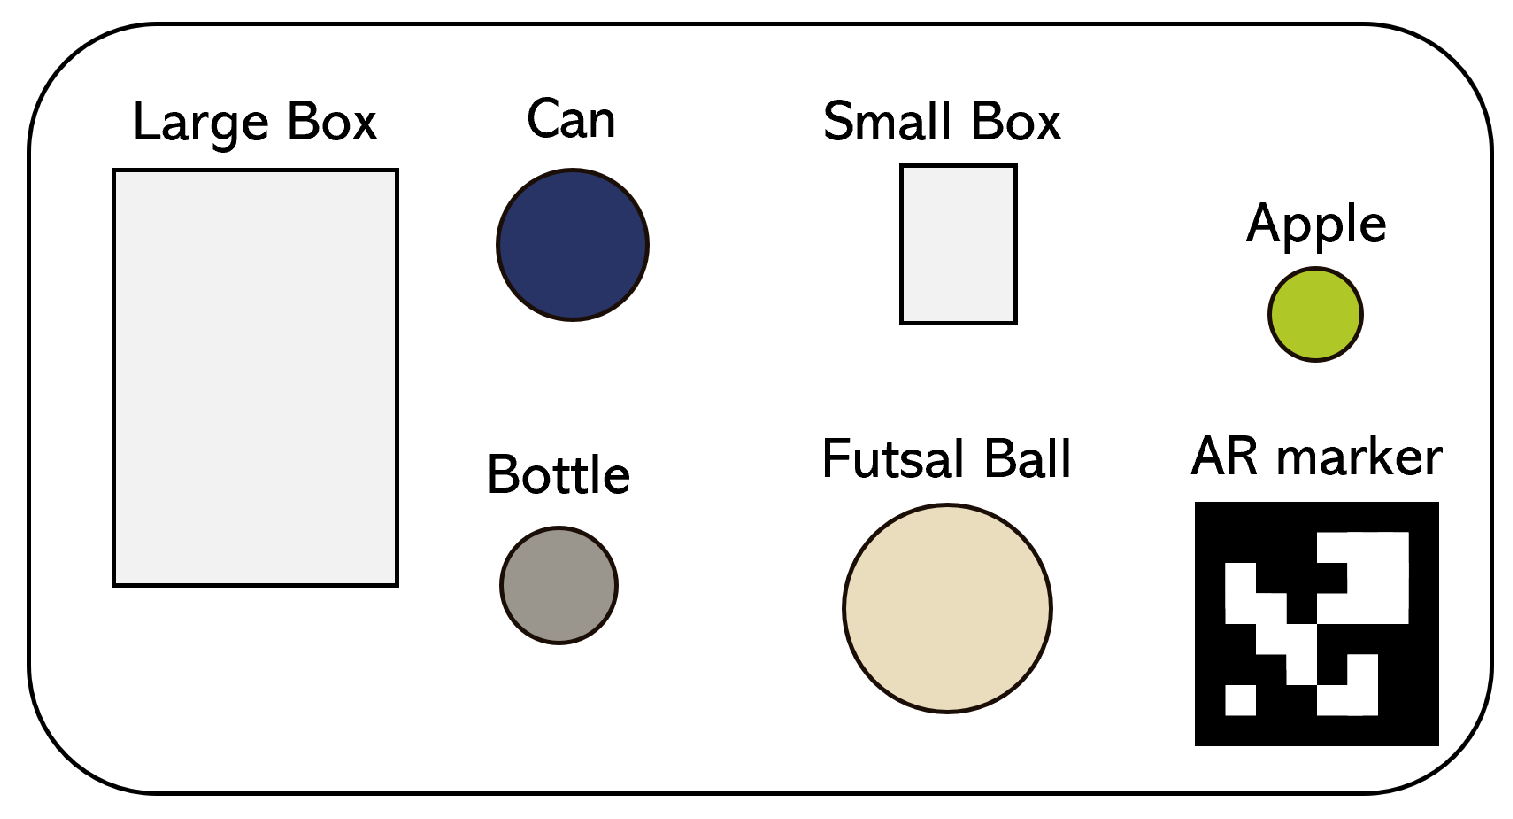
  • Three-Dimensional (3D) Intersection Over Union (IoU) (%): The user-generated semantic maps are evaluated using a known ground truth map by examining the volume of the intersection of the 3D bounding boxes of each object over the volume of the union of the bounding boxes. The ground truth map was created by measuring the dimensions of each of the six objects and their position and orientation relative to a fixed start point. Google’s Objectron library is used for computing the 3D IoU given the user-generated 3D bounding box and the corresponding ground truth bound box [16].
  • Task Completion Time (s): The total time taken for a user to complete the mapping task.

3.3.2. Subjective Metrics

After each task, the participant was asked to answer a set of questions using a 7-point Likert scale regarding their experience with the given headset, shown in Table 1. Each question was designed to evaluate the headsets on intuitiveness, visual performance, and overall preference. After the participant completed the mapping task on both devices, they were asked to respond to a final written feedback form to provide their opinions on the mapping interface and how it could be improved.

3.4. Hypotheses

We consider the following alternate hypothesis (Ha) for this experiment:
  • H1: The VR headset will produce virtual maps with greater accuracy.
  • H2: Participants will complete the task quicker with the VR headset.
  • H3: Participants will find the controls provided by the VR headset easier to use.
  • H4: Participants will find the real-world environment easier to see and interpret when using the AR headset when compared to the VR headset.
  • H5: Participants will enjoy using the VR headset for assisted mapping tasks more than the AR headset.
We expect the VR headset to be easier to use and control, perform better in object identification and localization, and produce faster task times. This is due to the use of VR motion controllers, which we expect to be more precise and responsive to user input when compared to pure hand gestures. However, we expect users to prefer the AR headset for visualizing their virtual semantic maps due to the see-through holographic lenses, which provide a constant undistorted view of the real world. The VR headset on the other hand relies on infrared sensors to reconstruct a virtual view of the real world, resulting in a grayscale view that is at a lower resolution.

4. Results

We recruited twelve participants: eight male and four female participants between the ages 21 and 23 ( μ = 21.25 , σ = 0.62 ), all were students at Monash University. Six participants had no prior experience operating an AR or a VR device and two participants had no prior experience operating an AR device. The participant pool is sampled from relatively narrow demographics, and we do not explicitly consider the participant backgrounds such as the AR/VR experience in the results, which can impact the potential impact on the study’s results. All the following statistical tests are performed to a 0.05 significance level.

4.1. Objective Metrics Results and Analysis

The means and standard deviations for the IoU and task time metrics are shown in Table 2. The VR headset had a higher IoU percentage and faster average task time compared to the AR headset. It should be noted that none of the objects were mislabelled by users with either headset. This is likely because a checklist of objects and their labels were provided to participants during the mapping task.
To evaluate H1 and H2, a single-tailed paired t-test was used to compare the objective metrics between the AR and VR headsets. The t-test results are shown in Table 3.
From these results, we observed that the VR headset performed better than the AR headset in mapping accuracy and in task time, with the difference in the objective metrics between the two headsets being statistically significant in favor of the VR headset. While this does affirm H1 and H2, it must be noted that out of the twelve participants, seven failed to complete the mapping task in the given 8-min time limit when using the AR device, with four of these participants failing to label all six objects. The large difference in variance between devices for task times seen in Table 2 can also be attributed to this fact, as all participants spent longer than 420 s to complete their map using the AR device, while no participant failed to complete the mapping task in the time limit when using the VR device, with the longest task time being 458 s and the shortest task time being 219 s.

4.2. Subjective Metrics Results and Analysis

The raw distribution of responses for each survey question is shown in Figure 4. Due to the ordinal nature of the Likert scale variables, a non-parametric test was applied to test H3–H5. As a result, we chose to employ a single-tailed Wilcoxon signed-rank test on the paired differences between the AR and VR headsets. Statistical significance was found in most questions, with p-values shown in Table 4.
The VR headset was found to be easier to learn, more responsive to user input, was perceived as being more efficient and participants perceived fewer errors when compared to the AR headset. Four out of five survey questions related to Intuitiveness showed a statistically significant improvement of the VR headset over the AR headset. For question I2, which asked about the comfort of use, VR again received better ratings but the difference was not statistically significant. Given these results, while we can claim that H3 is mostly supported, more user studies can be useful in testing whether the VR headset is also more comfortable to use compared to the AR headset in question.
When examining users’ preferences towards the different graphical interfaces between the AR and VR devices, the AR headset was found to provide a better view of real-world objects and was overall more visually comfortable. However, we did not observe statistical significance in the user responses to AR visualization of virtual objects over VR. Hence, H4 is only partially supported. No subjective metric used to evaluate H5 was found to be statistically significant. Hence, H5, that participants will enjoy the VR headset more, cannot be affirmed.

4.3. Discussion

When examining the survey data from Figure 4, we observe that the VR headset performed strongly amongst participants for controller responsiveness, intuition, and seeing and interpreting virtual objects, and performed weakly for overall visual comfort. We also observe that the AR headset performed strongly for seeing and interpreting real objects and visual comfort; however, participants found it to be less intuitive, less enjoyable, and less comfortable to use. For the Likert responses related to hypothesis H3, we observe that participants generally found the VR controls easier to learn and more responsive than the AR controls. We believe a likely explanation for this is due to the use of VR controllers. Given that the position and orientation of the controllers are known and each button/trigger has well-defined functions, it is expected that the VR controllers would provide a more accurate and user-friendly interface, a conclusion which has been affirmed in several related studies [17,18,19]. This is further evidenced by the fact that only two participants felt that they experienced mapping issues whilst using the VR headset, with a participant (P8) noting that “the [VR] controllers were much more responsive, making it easier to pick and perform the correct interaction”. On the other hand, we observed that more users found the AR input interface to be unintuitive and difficult to use, with many participants experiencing hand-tracking issues and incorrect inputs. It was noted (P6) that the “[AR] hand tracking [was] very inconsistent and [could] be frustrating”. These observed results are understandable when considering the use of real-time hand-tracking technology to track users’ hand gesture inputs. Past studies have shown that interfacing with application controls using hand gestures has generally resulted in lower input accuracy and precision when compared to the use of motion controllers for the same task [2,19]. Our observed results are further influenced by the fact that many users had little to no experience working with AR devices prior to the study, and as such had difficulty learning the hand gesture controls and applying them to the task. This was a common point noted by many participants, with one (P10) stating that the “[the] AR [controls were] very difficult to get used to”. This suggests that the current hand-tracking system of the HoloLens 2 will be a barrier to entry for users and that improved and fine-tuned real-time hand-tracking is necessary for future improvements in the usability of AR hand gesture controls for interactive tasks similar to this semantic mapping application.
Though we cannot affirm H4, participants did find that the AR headset significantly improved their ability to see real-world objects when compared to the VR headset, where a participant (P9) found it “much easier to see what [they were] doing in AR”. This is likely due to the holograms projecting onto the AR headset’s see-through lens, allowing participants to have a clear view of the real-world environment. In contrast, the Quest 2’s Passthrough feature uses infrared sensors to construct a lower-resolution grayscale view of the user’s surroundings, which some participants found difficult to adapt to and use. A participant (P2) even raised concerns about the Passthrough view potentially “trigger[ing] motion-sickness in people”. This point also raises an issue of emulating AR with VR technology as the VR mapping approach may not be accessible for extended use in all users due to the current real-world visualization techniques available on the Quest 2. However, when comparing the virtual object visualization, the AR headset did not improve over the VR headset. This may be due to the virtual holograms being too transparent on the AR headset, making it difficult for users to determine where their virtual objects were co-located onto the real environment. In contrast, the colored object bounding boxes are more visually striking against the grayscale background—which is why we believe the VR headset was rated higher than the AR headset for survey question V2 on seeing virtual objects with ease. Further work should be undertaken to improve upon the drawbacks of each headset in their visualization methods to enhance the use of these AR and VR devices for semantic mapping.
Surprisingly, our hypothesis tests showed that participant enjoyability was the only metric that showed no improvement between the two headsets, with no variable affirming H5. This result is interesting as participants all explicitly stating a preference for the VR headset in a post-study survey. A possible explanation for this result is that participants valued the intuitiveness and visual performance of the VR device more than the overall enjoyability of completing the task. Further work should focus on the design of these survey questions to better evaluate this hypothesis; however, this result implies that improved visualization and control methods for the AR and VR headsets would lead to higher user satisfaction.
When evaluating the response to question I3 (Perceived Efficiency), we note that participants perceived the VR headset to be significantly more efficient in assisting the mapping task over the AR headset (p = 0.005 for variable I3). This is consistent with the observed task times and object mapping accuracy (p ≤ 0.001 for all objective metrics in favor of the alternate hypotheses H1 and H2). We expect these results are mainly caused by how the VR headset utilizes motion controllers to interface with the mapping application, which supports greater tracking accuracy and lower input latency when compared with real-time hand-tracking systems for hand-gesture control [2,17,18,19]. Although these results were expected, it is important to note that the object mapping accuracies were generally poor, with 3D IoU averaging around 40% for maps generated using the VR headset. In particular, we found that users struggled more when mapping smaller objects, as these objects inherently require greater precision and control over the virtual objects to co-locate them correctly. A summary of the average 3D IoU percentages for each of the experimental objects shown in Table 5 also demonstrates this observation, as users struggled the most when mapping the apple and small box objects.
It is also important to consider the potential effect of time pressure on participants when considering IoU results from the AR headset, with all participants requiring more than seven minutes out of a total of eight minutes to complete their mapping task when using the AR device. In addition, seven participants failed to complete the task in time, making it plausible that the participants had to rush the placement of some of their virtual objects, therefore negatively affecting their average IoU for the task. While this could be attributed to the generally difficult hand-tracking controls given that all participants completed the mapping task using the VR device, future studies should increase the time limit allowed in order for a better comparison between the two devices. Further development of the UI controls along with improvements in AR hand-tracking technology are likely required to make the mapping task easier for users and improve the overall mapping accuracy.

5. Conclusions

We compared the Microsoft Hololens 2 (AR) and the Meta Quest 2 (VR) headsets for an interactive semantic mapping task. Though the Quest 2 is a VR headset, we emulated AR on it through the “Passthrough” feature, which lets users see the environment from a video feed generated by its outward-facing IR cameras. A proof-of-concept mapping application interface was developed for this task, wherein users were provided mapping functionalities including the ability to add, delete, and manipulate virtual primitively shaped objects and the ability to attach semantic labels to them. A user study was conducted, where 12 participants were asked to provide their subjective opinions on intuitiveness, visual performance, and preference. Task completion time and map accuracy were also measured.
The results of the user study show that participants subjectively found the VR headset to be easier to learn, more responsive to user input, and perceived to be more efficient compared to the AR headset. Participants also found that VR provided better visualization of virtual objects. Furthermore, the participants completed the task faster and generated more accurate bounding boxes with the VR headset. We attribute these results to the use of handheld motion controllers for the VR headset, which provides more precise control for object manipulation compared to natural hand gestures used for the Hololens 2. This could change if, in the future, the state-of-the-art hand-tracking and gesture recognition is improved. The AR headset, on the other hand, was rated higher for seeing and interpreting the real world. This shows that the participants preferred seeing the real world instead of observing the environment through a camera feed. Given this observation, an immediate improvement to the VR headset would be the option to show the world through a color camera feed with a high refresh rate and low latency. However, all participants indicated that they preferred the VR headset for this task, which shows that users placed a greater value on the high-precision controls for this interactive mapping task. This was an interesting result considering that the users were constrained to see the world through a low-resolution grayscale camera feed when using the VR headset. Therefore, we can conclude that, with today’s technology, it would be best to combine the best features of both AR and VR headsets; seeing the real world accurately as in the AR headset whilst having handheld controllers like those found with VR headsets.
Given the promising results of the user study for the VR headset, we can also claim that VR headsets can be used as pseudo-AR headsets by viewing a camera feed without compromising the user experience, a conclusion made in other related studies [20,21]. This is an important advantage for VR headsets, especially considering that AR headsets are currently multiple times more expensive than VR headsets. However, we note that the task in our experiments was completed in under 4 min on average. We believe that seeing the world through a camera’s view could be tiring for people and might lead to motion sickness, therefore future work should investigate whether the conclusions of our study can be applied to other interactive tasks that require wearing the headsets for longer periods.

Author Contributions

Conceptualization, A.C.; Methodology, A.C.; Software, N.K.; Validation, M.G.; Formal analysis, N.K. and M.G.; Investigation, N.K.; Writing—original draft, N.K.; Writing—review & editing, M.G. and A.C.; Supervision, E.C. and A.C.; Project administration, A.C.; Funding acquisition, E.C. All authors have read and agreed to the published version of the manuscript.

Funding

This project was supported by the Australian Research Council (ARC) Discovery Project Grant DP200102858. Authors did not pay APC.

Institutional Review Board Statement

This study was approved on 13 Feb 2022 by the Monash University Human Research Ethics Committee with Project ID 31659.

Informed Consent Statement

Informed consent was obtained from all subjects involved in the study.

Data Availability Statement

The user study data in this paper is not made public due to privacy considerations.

Conflicts of Interest

The authors declare no conflict of interest.

References

  1. Bozgeyikli, E.; Bozgeyikli, L.L. Evaluating object manipulation interaction techniques in mixed reality: Tangible user interfaces and gesture. In Proceedings of the 2021 IEEE Virtual Reality and 3D User Interfaces (VR), Lisbon, Portugal, 27 March–1 April 2021; pp. 778–787. [Google Scholar]
  2. Xiao, R.; Schwarz, J.; Throm, N.; Wilson, A.D.; Benko, H. MRTouch: Adding Touch Input to Head-Mounted Mixed Reality. IEEE Trans. Vis. Comput. Graph. 2018, 24, 1653–1660. [Google Scholar] [CrossRef] [PubMed]
  3. Batmaz, A.U.; Machuca, M.D.B.; Pham, D.M.; Stuerzlinger, W. Do head-mounted display stereo deficiencies affect 3D pointing tasks in AR and VR? In Proceedings of the 2019 IEEE Conference on Virtual Reality and 3D User Interfaces (VR), Osaka, Japan, 23–27 March 2019; pp. 585–592. [Google Scholar]
  4. Gu, M.; Cosgun, A.; Chan, W.P.; Drummond, T.; Croft, E. Seeing thru walls: Visualizing mobile robots in augmented reality. In Proceedings of the IEEE International Conference on Robot & Human Interactive Communication (RO-MAN), Vancouver, BC, Canada, 8–12 August 2021. [Google Scholar]
  5. Waymouth, B.; Cosgun, A.; Newbury, R.; Tran, T.; Chan, W.P.; Drummond, T.; Croft, E. Demonstrating cloth folding to robots: Design and evaluation of a 2d and a 3d user interface. In Proceedings of the IEEE International Conference on Robot & Human Interactive Communication (RO-MAN), Vancouver, BC, Canada, 8–12 August 2021. [Google Scholar]
  6. Szczepanski, R.; Bereit, A.; Tarczewski, T. Efficient Local Path Planning Algorithm Using Artificial Potential Field Supported by Augmented Reality. Energies 2021, 14, 6642. [Google Scholar] [CrossRef]
  7. Xu, S.; Moore, S.; Cosgun, A. Shared-control robotic manipulation in virtual reality. In Proceedings of the International Congress on human–computer Interaction, Optimization and Robotic Applications (HORA), Ankara, Turkey, 9–11 June 2022. [Google Scholar]
  8. Gu, M.; Croft, E.; Cosgun, A. AR Point & Click: An interface for setting robot navigation goals. In Proceedings of the International Conference on Social Robotics, Florence, Italy, 13–16 December 2022. [Google Scholar]
  9. Hoang, K.C.; Chan, W.P.; Lay, S.; Cosgun, A.; Croft, E.A. Arviz: An augmented reality-enabled visualization platform for ros applications. IEEE Robot. Autom. Mag. 2022, 29, 58–67. [Google Scholar] [CrossRef]
  10. Newbury, R.; Cosgun, A.; Crowley-Davis, T.; Chan, W.P.; Drummond, T.; Croft, E.A. Visualizing robot intent for object handovers with augmented reality. In Proceedings of the IEEE International Conference on Robot and Human Interactive Communication (RO-MAN), Naples, Italy, 29 August–2 September 2022. [Google Scholar]
  11. Topp, E.A. human–robot Interaction and Mapping with a Service Robot: Human Augmented Mapping. Ph.D. Thesis, KTH, Stockholm, Sweden, 2008. [Google Scholar]
  12. Cosgun, A.; Christensen, H. Context Aware Robot Navigation using Interactively Built Semantic Maps. arXiv 2018, arXiv:1710.08682. [Google Scholar] [CrossRef]
  13. Frank, M.; Drikakis, D.; Charissis, V. Machine-learning methods for computational science and engineering. Computation 2020, 8, 15. [Google Scholar] [CrossRef]
  14. Chaurasia, G.; Nieuwoudt, A.; Ichim, A.E.; Szeliski, R.; Sorkine-Hornung, A. Passthrough+: Real-Time Stereoscopic View Synthesis for Mobile Mixed Reality. Proc. ACM Comput. Graph. Interact. Tech. 2020, 3, 7. [Google Scholar] [CrossRef]
  15. Vuforia Developer Portal. Available online: https://developer.vuforia.com/ (accessed on 15 July 2023).
  16. Ahmadyan, A.; Zhang, L.; Ablavatski, A.; Wei, J.; Grundmann, M. Objectron: A large scale dataset of object-centric videos in the wild with pose annotations. In Proceedings of the IEEE Conference on Computer Vision and Pattern Recognition, Virtual Online, 19–25 June 2021. [Google Scholar]
  17. Jost, T.A.; Nelson, B.; Rylander, J. Quantitative analysis of the Oculus Rift S in controlled movement. Disabil. Rehabil. Assist. Technol. 2021, 16, 632–636. [Google Scholar] [CrossRef] [PubMed]
  18. Shum, L.; Valdés, B.; Loos, H. Determining the Accuracy of Oculus Touch Controllers for Motor Rehabilitation Applications Using Quantifiable Upper Limb Kinematics: Validation Study. J. Med. Internet Res. 2019, 4, e12291. [Google Scholar] [CrossRef]
  19. Kern, F.; Kullmann, P.; Ganal, E.; Korwisi, K.; Stingl, R.; Niebling, F.; Latoschik, M.E. Off-The-Shelf Stylus: Using XR Devices for Handwriting and Sketching on Physically Aligned Virtual Surfaces. Front. Virtual Real. 2021, 2, 684498. [Google Scholar] [CrossRef]
  20. Lahoud, F.; Susstrunk, S. Ar in VR: Simulating infrared augmented vision. In Proceedings of the 2018 25th IEEE International Conference on Image Processing (ICIP), Athens, Greece, 7–10 October 2018; pp. 3893–3897. [Google Scholar]
  21. Lee, C.; Bonebrake, S.; Hollerer, T.; Bowman, D.A. A replication study testing the validity of AR simulation in VR for controlled experiments. In Proceedings of the 2009 8th IEEE International Symposium on Mixed and Augmented Reality, Orlando, FL, USA, 19–22 October 2009; pp. 203–204. [Google Scholar]
Figure 1. (Left) a user performing the mapping task using a VR headset. Users can add, delete, manipulate, and label virtual object holograms co-located with real objects. (Right) Objects used for the experiments along with their dimensions.
Applsci 13 11693 g001
Figure 2. What the user sees in AR (left column) vs. VR (right column). The labeling panel (bottom left) and main menu (bottom right) are also shown.
Applsci 13 11693 g002
Figure 3. Experimental setup.
Applsci 13 11693 g003
Figure 4. Summary of the raw data obtained from the surveys filled out by 12 participants, comparing the AR and VR headsets, for each one of the 11 survey questions shown in Table 1.
Applsci 13 11693 g004
Table 1. User Study Survey Questions. I—Intuitiveness, V—Visual Performance, P—Preference. These questions are answered using a 7—point Likert scale. * denotes reverse scale.
Questions
I1The headset’s input system was easy to learn.
I2The headset’s input system was comfortable to use.
I3The headset’s input system helped me achieve the task efficiently.
I4The headset’s input system was responsive to user input.
I5 *The headset’s input system was affected by errors (e.g., inaccurate tracking, incorrect interactions, wrong inputs, general bugs).
V1It was easy to see the real-world objects I was mapping using this headset.
V2It was easy to see the virtual objects I was manipulating using this headset.
V3I would be comfortable seeing my surroundings using this headset for long periods of time.
P1I enjoyed using this headset to complete the task.
P2 *It was mentally demanding to use this headset to complete the task.
P3It was comfortable to use the headset’s accompanying headset.
Table 2. Mean and standard deviation for each objective metric for the two headsets.
ARVR
IoU (%)0.262 ( σ = 0.112)0.407 ( σ = 0.157)
Task Time (s)466.6 ( σ = 21.1)333.8 ( σ = 83.5)
Table 3. p-values using paired t-test for objective metrics used to evaluate hypotheses H1 and H2. Significant results are indicated in bold.
H a ρ
IoU (%)VR > AR0.001
Task Time (s)VR < AR<0.001
Table 4. One-tailed Wilcoxon signed-rank test results. Variables I1–I5 test H3, variables V1–V3 test H4, and variables P1–P3 test H5. Significant results are indicated in bold. * denotes reverse scale.
H a ρ
I1—Easy to LearnVR > AR0.006
I2—Comfortable to UseVR > AR0.262
I3—Perceived EfficiencyVR > AR0.005
I4—Responsive to InputVR > AR0.001
I5—Prone to Errors *VR < AR0.021
V1—Seeing Real ObjectsAR > VR0.006
V2—Seeing Virtual ObjectsAR > VR0.163
V3—Visual ComfortAR > VR0.017
P1—Perceived EnjoyabilityVR> AR0.662
P2—Mental Load *VR < AR0.180
P3—User ComfortVR > AR0.072
Table 5. Average IoU (%) and standard deviation for each object in the mapping environment.
ARVR
Bottle0.22 ( σ = 0.19)0.40 ( σ = 0.21)
Can0.20 ( σ = 0.18)0.39 ( σ = 0.23)
Apple0.25 ( σ = 0.20)0.32 ( σ = 0.15)
Futsal Ball0.39 ( σ = 0.16)0.54 ( σ = 0.14)
Small Box0.10 ( σ = 0.11)0.15 ( σ = 0.11)
Large Box0.42 ( σ = 0.20)0.64 ( σ = 0.19)
Disclaimer/Publisher’s Note: The statements, opinions and data contained in all publications are solely those of the individual author(s) and contributor(s) and not of MDPI and/or the editor(s). MDPI and/or the editor(s) disclaim responsibility for any injury to people or property resulting from any ideas, methods, instructions or products referred to in the content.

