1. Introduction
Water erosion stands as the most prevalent form of soil degradation, representing a significant contributor to land degradation and desertification on a global scale, with significant impacts on the economy, society, and the environment [
1]. Its consequences are particularly pronounced in semi-arid regions, where soil erosion leads to decreased water retention, silting of hill reservoirs, and severe losses of soil organic carbon that undermine efforts to mitigate climate change through landscape restoration. It presents a considerable challenge to the continued viability of rainfed agricultural systems and has a notable adverse effect on farmers’ earnings [
2].
Since the 1960s, a comprehensive management program, incorporating water erosion and water harvesting techniques, has been implemented in the Merguellil catchment (Central Tunisia), where the El Houareb Dam is situated. The interventions were designed to reduce erosion and enhance the income of the local population [
3].
A healthy and diverse ecosystem and the various approaches employed for land management within a given watershed play a crucial role in exerting a substantial influence on the availability and quality of its water resources, as well as the intricate process of erosion [
4]. The interplay between ecosystem management and the choices made in how the land is used and maintained can either contribute positively to the sustainability of water sources and minimize erosion, or conversely, lead to detrimental effects on these critical natural processes [
5].
Addressing erosion and managing water resources within a watershed requires a comprehensive approach addressing elements like land use, precipitation patterns, and land and soil types [
6,
7]. Effective strategies can include conservation approaches such as sustainable agronomic practices, soil terracing, and vegetation management, as well as regulations and policies aimed at promoting sustainable soil and water management [
8].
Advancements in remote sensing and geospatial technology have resulted in higher-quality and more accessible satellite imagery in recent years. The integration of remote sensing with geographic information systems (GIS) is a common practice used to categorize maps and track changes in land use patterns over time. One significant benefit of this approach is its ability to efficiently address the issues that arise from changes in land use, the implementation of sustainable land management practices, and the development of land use policies. Changes in land use and land cover are crucial factors in soil erosion, frequently exacerbating erosion processes [
9].
SWC structures, such as terracing, contour plowing, strip cropping, and grassed waterways can have substantial impacts on reducing water erosion, as they reduce the velocity and volume of water flow, trap sediments, and reduce soil losses [
10]. They can also help to increase water infiltration and reduce runoff, thereby reducing the amount of water available for erosion. As a result, the implementation of SWC structures leads to a reduction in water erosion, the preservation of soil quality and fertility, and enhances the overall ecological health of a watershed [
11].
Predicting the changes in soil erosion that can be obtained using interventions aimed at changing land use/land cover or implementing SWC structures in a watershed is important in order to generate realistic planning scenarios. The Revised Universal Soil Loss Equation model predicts soil erosion based on several factors, particularly rainfall intensity, slope steepness, soil erodibility, and vegetation cover [
12,
13]. By running the model using datasets generated in different time periods, the effectiveness of soil erosion interventions can be predicted and assessed [
14]. Utilizing remote sensing data enables the retrieval of diachronic information about erosion factors that change over time [
14,
15]. This technology allows for the monitoring and analysis of dynamic environmental changes, contributing to a deeper understanding of how erosion processes evolve and supporting the formulation of efficient strategies for soil conservation and management.
The sediment delivery ratio (SDR) is a critical parameter utilized to assess the proportion of sediment generated from erosion at a specific location that is ultimately delivered to a downstream location. It is an essential factor in sediment yield modeling and erosion control planning, different equations and models provide estimates of the sediment delivery ratio based on different landscape and environmental factors [
16,
17]. It is crucial to emphasize that the accuracy of these predictions relies on input data accessibility and quality, along with the assumptions incorporated into the models [
18].
Recognizing the consequences of changes in LULC on soil erosion patterns, sediment transportation, and the delivery of ecosystem services is of the highest importance when crafting holistic approaches for successful watershed management. Numerous investigations have been carried out to evaluate the influence of LULC changes [
19,
20,
21] on soil erosion and sediment yield [
22,
23]. These investigations provide valuable insights into the relationship between land use alterations and erosion processes.
Moreover, multiple studies have illustrated the advantages of SWC techniques in mitigating soil erosion. In Africa, terracing has proven to be highly effective in decreasing soil erosion, preserving water, and retaining nutrients at the watershed scale [
24]. Similarly, in semi-arid regions of China, these methods have been shown to significantly diminish sediment runoff on hillsides [
25,
26]. Despite the critical importance of understanding the combined effects of Land Use and Land Cover (LULC) changes and SWC techniques on soil erosion, a limited number of studies have specifically addressed this aspect.
Additionally, the majority of published studies have focused on assessing short- or medium-term effects more than long-term impacts. Meta-analyses of SWC impact assessments have revealed a lack of studies that offer consistent, long-term quantitative evidence of the impacts of SWC on erosion at the watershed scale [
23].
Furthermore, the sediment delivery ratio (SDR) model plays a crucial role in accurately estimating the quantity of sediment yield originating from individual units within a watershed. This model serves as a fundamental tool for assessing the transport and deposition of sediment, aiding in the understanding of how erosion processes impact the overall sediment load and contributing to informed decision-making for sustainable land and water management practices. Thus, the SDR has been extensively utilized in various studies [
16,
17]. However, various equations and models have been developed to predict the sediment delivery ratio based on different factors, and they vary in their structure, their assumptions, and the factors they consider. Most of the equations used topographic factors [
18].
The primary objective of this paper is to analyze the spatiotemporal patterns of water erosion in the Merguellil catchment area from 1980 to 2020 and evaluate its consequences. Specifically, the purpose is to investigate alterations in water erosion and sediment production, which are influenced by shifts in land use and the implementation of SWC techniques. Furthermore, the research aims to analyze the repercussions of these changes on both the watershed and sub-watershed scales. By accomplishing these goals, the study aims to provide important information on the changing erosion patterns and their environmental repercussions. This can contribute to more effective watershed management and conservation practices.
More specifically, this study conducted a comprehensive long-term analysis of the combined impact of LULC change and SWC structure implementation on soil erosion over a period of 40 years. The integration of RUSLE and SDR methodologies allows for the quantification of the possible impact of alterations in land use on soil erosion and sediment yield. This information is essential for comprehending the outcomes of diverse land management practices during the studied timeframe. The used SDR model incorporates both topography and LULC changes.
This research addresses significant gaps in existing knowledge by combining a long-term perspective, using RUSLE/SDR to provide a comprehensive and practical approach for assessing soil erosion and predicting sediment yield. This methodology will contribute to a more comprehensive and informed approach to erosion control, land management, sustainable development, and watershed management decisions. The outcomes of this study are anticipated to offer valuable information that can help managers and policymakers concerning the conservation and safeguarding of natural resources within a given area.
2. Materials and Methods
2.1. Study Area
The Merguellil watershed was selected as a study area based on several criteria, including geographic relevance, environmental significance, human impact, data availability, and management relevance. Indeed, the Merguellil watershed represents a particular ecosystem with its size, location, or unique characteristics. It is particularly vulnerable to land use and land cover changes. Also, the Merguellil watershed has experienced significant human interventions, such as agricultural activities, urbanization, and industrial development. The availability of relevant and reliable data for the Merguellil watershed is crucial for conducting research or analysis. Finally, it could be strategically chosen based on its importance for water resource management, land use planning, or conservation efforts.
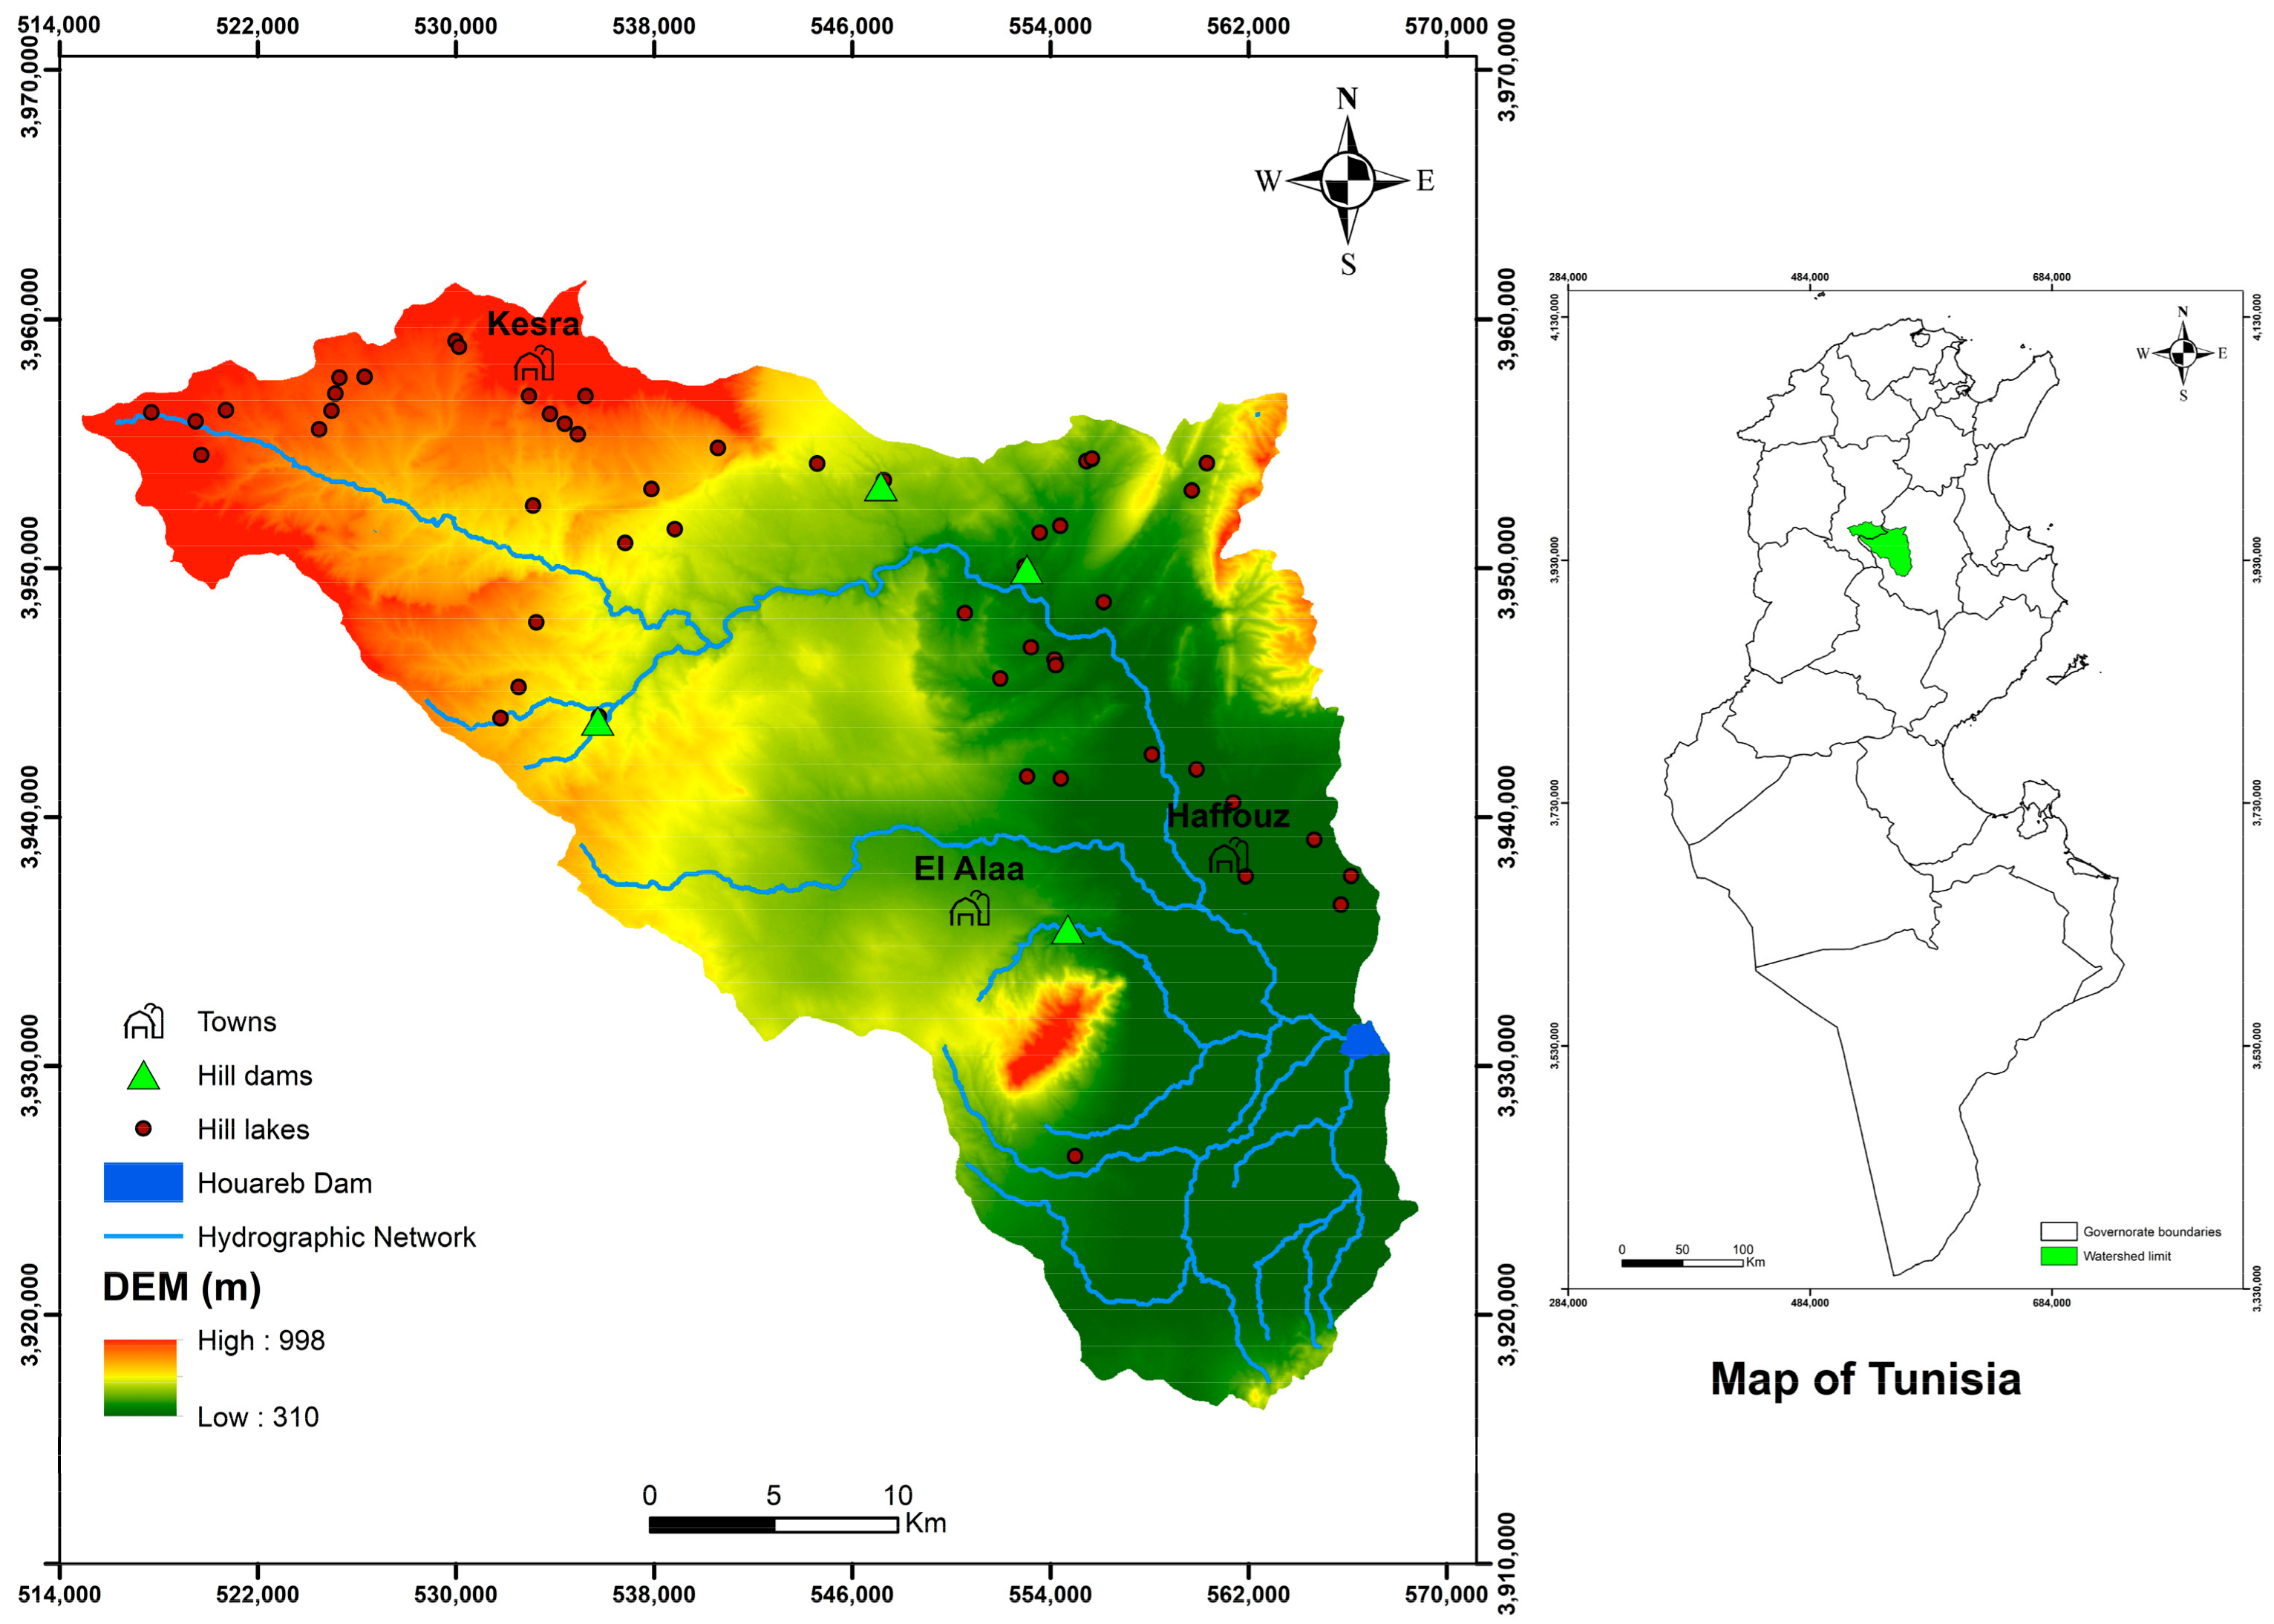
The Merguellil catchment area (1175 km
2), situated in Central Tunisia, exemplifies the environmental degradation challenges common to semi-arid zones, including high erosion rates, low land cover, and limited economic income (
Figure 1). This area encompasses 1175 km
2 and consists of cropland (35%), rangelands (45%), and forests (20%).
The Merguellil watershed belongs to a climatic transition zone between the north of the country, under Mediterranean influence, and the pre-Saharan zone to the south, and it is hot and arid. During the observation period from 1980 to 2020, the average annual rainfall in the area was approximately 300 mm, with variations ranging from 265 mm in the plain to 515 mm in the highlands. The average annual temperature was 19.5 °C, with average daily temperatures less than 12 °C in January and more than 28 °C in July–August. These climatic conditions play a significant role in shaping the hydrological and ecological dynamics of the region, influencing factors such as water availability, vegetation growth, and erosion patterns.
The Merguellil catchment area is demarcated by the El Haouareb Dam, constructed in 1989. The catchment area encompasses a hilly terrain with diverse geological, morphological, vegetation, and land use conditions.
The elevation within the area varies from 310 m.a.s.l. at El Haouareb Dam to 1226 m.a.s.l. at djebel Barbrou. The slope direction predominantly follows a northwest/southeast axis, which aligns with the prevailing wind direction. This topographical configuration can have significant implications for water flow, erosion patterns, and ecological dynamics.
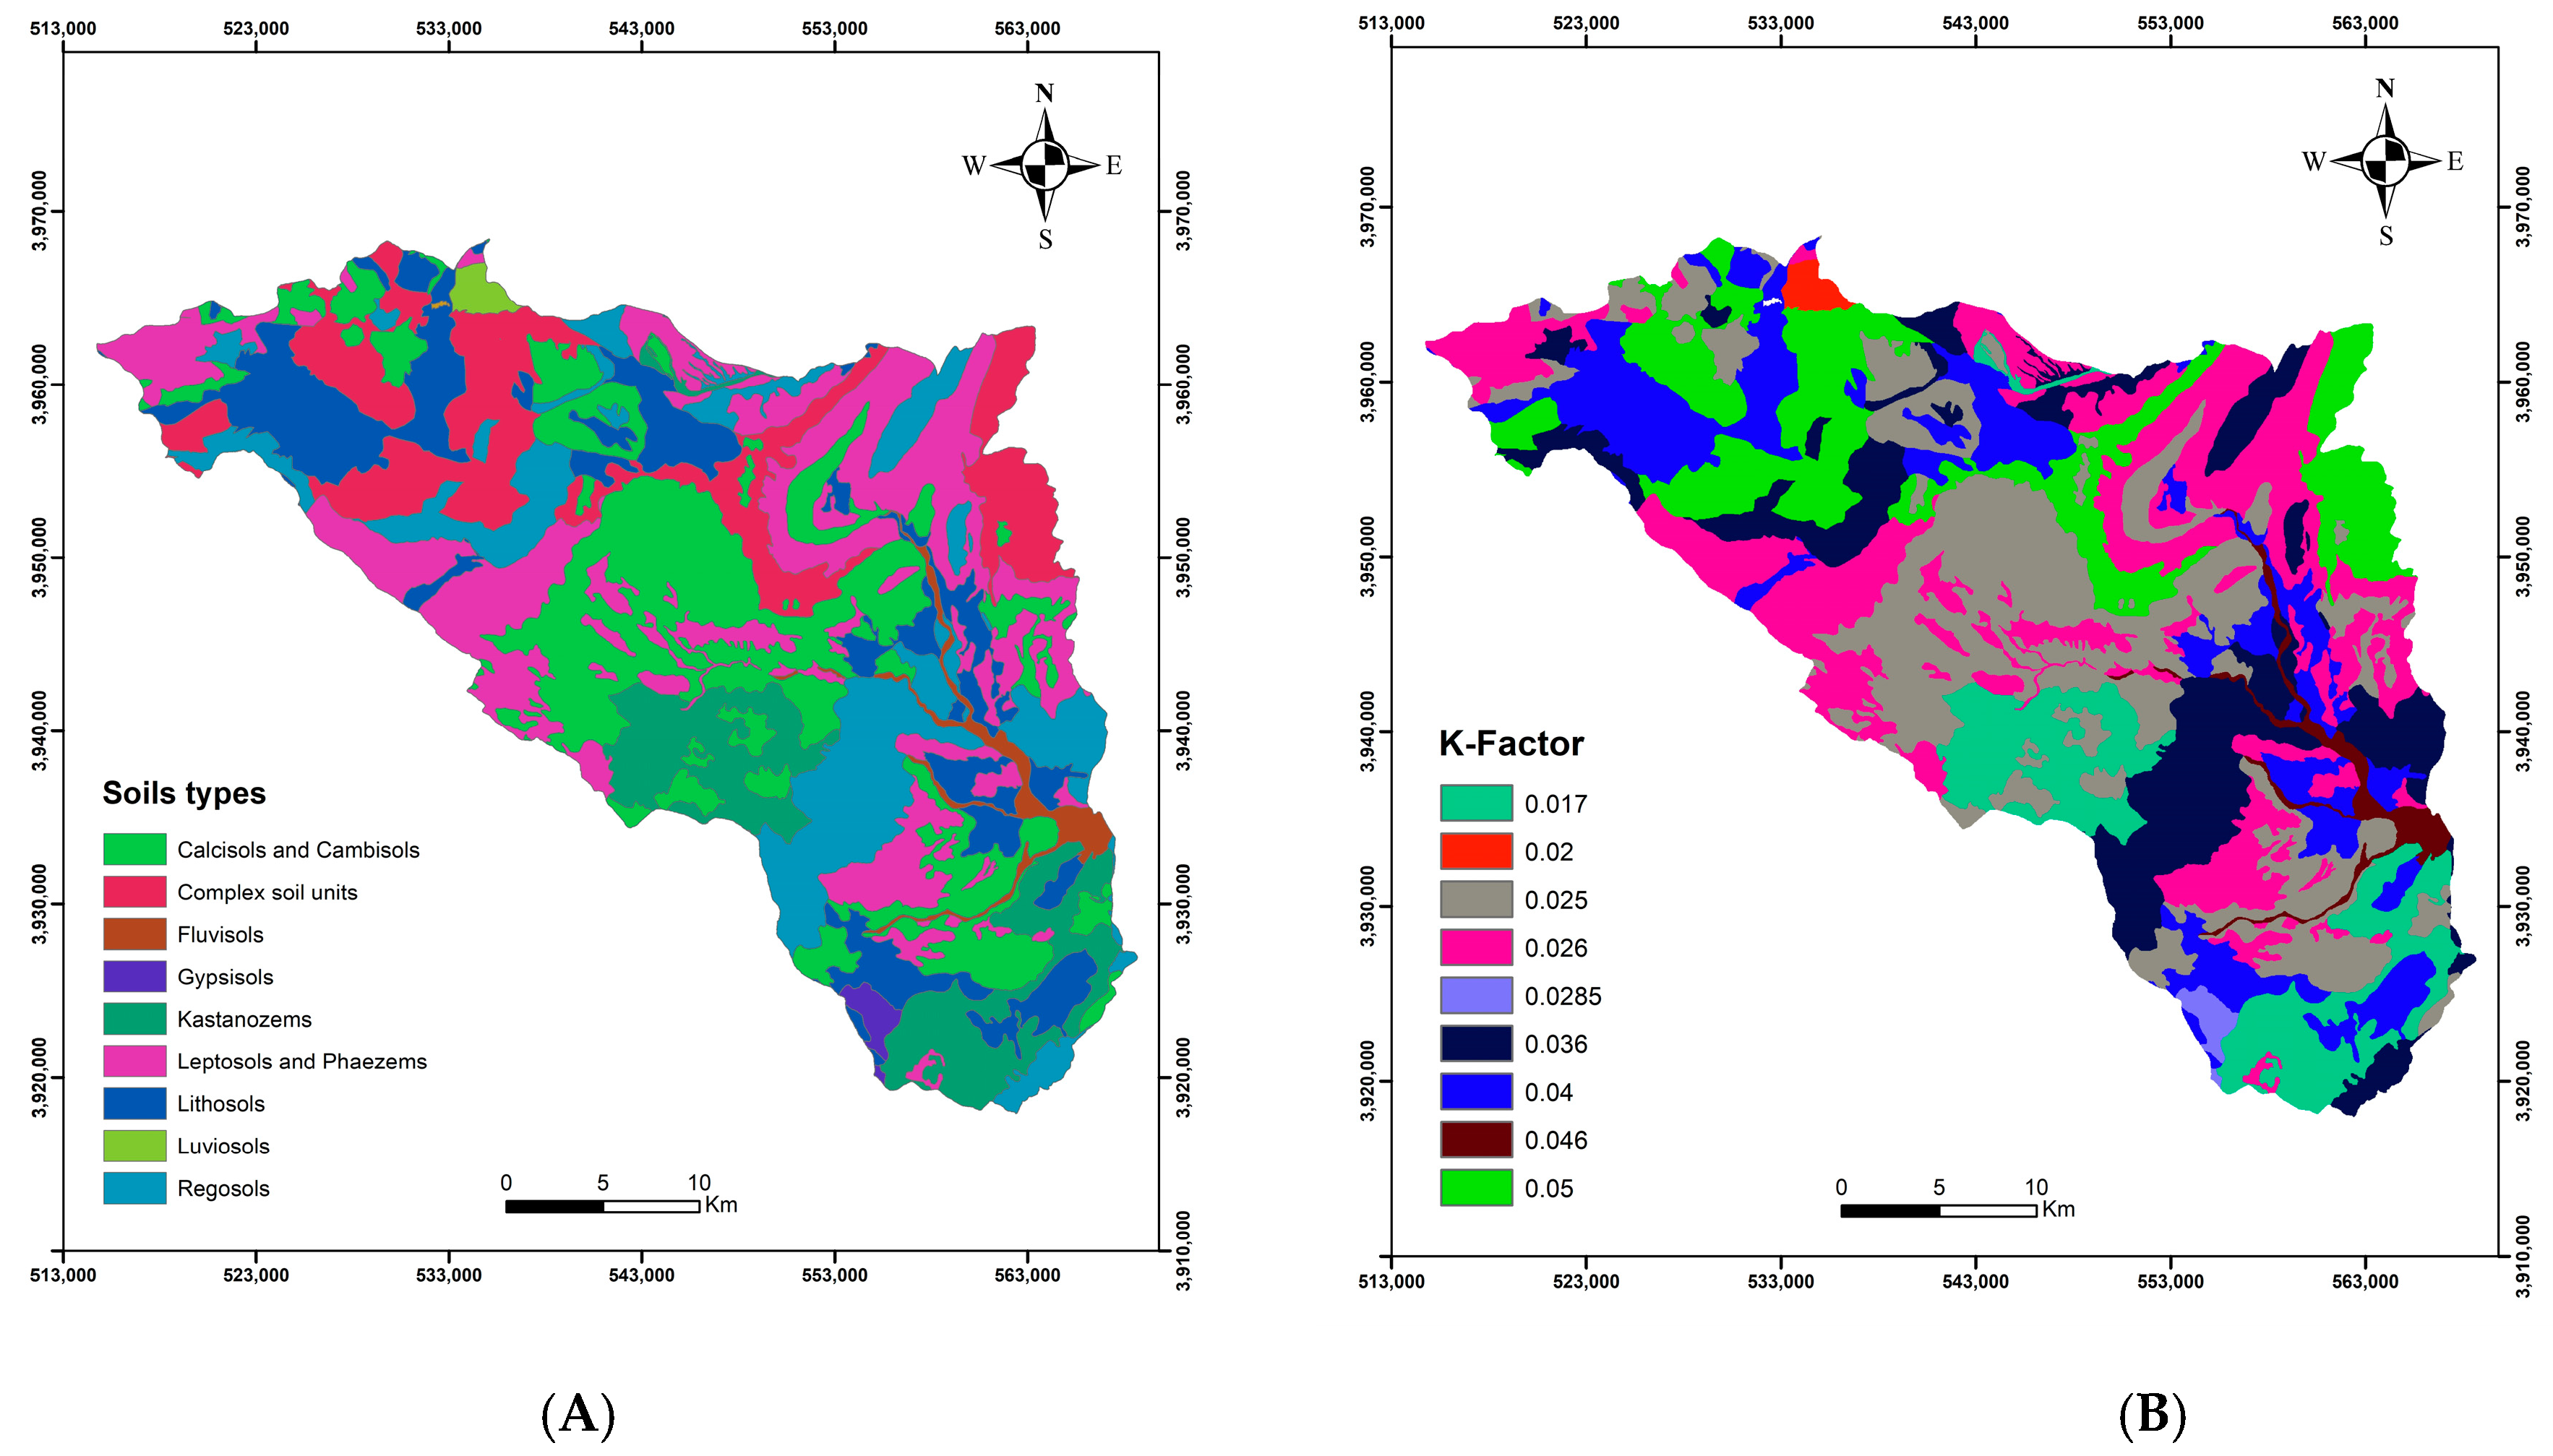
The geology of the Merguellil watershed is complex, primarily consisting of limestone, marl-calcareous, and marly sedimentary formations from the Cretaceous and Eocene periods. The oldest formation in this area dates from the Triassic era [
27]. The soils are mainly developed in situ from dissolution and weathering of the bedrock. The content of humus and clay–humic complexes is low, about the low density of the land cover. Exposed to very strong erosion, they are weakly developed and shallow. Based on the French classification system (
Commission de Pédologie et de Cartographie des Sols, 1967), the major soil types in the study area are defined as follows “
Sols Calcimagnesiaques and
Sols Isohumiques”. According to the international classification system (International Union of Soil Sciences Working Group—World Reference Base, 2022), they could be named, respectively, “Leptosols or Cambisols, Calcisols or Cambisols, and Kastanozems or Cambisols”.
Additionally, over the past four decades, extensive conservation measures have been undertaken in the upstream catchment areas to mitigate erosion and prevent the siltation of the El Haouareb Dam. These widespread efforts focus on reducing soil erosion and sediment deposition, thus ensuring the dam’s lifetime and maintaining its functionality for the surrounding environment and communities.
In fact, works mainly consisted of bench terraces and small dams to create hill lakes. Currently, bench terraces cover 30% of the total area of the upstream catchment, although they have not been extended to all the areas that are most sensitive to erosion. The surface area upstream of the small and medium dams covers 12.5% of the catchment.
The overall population of the Merguellil basin is young and more than 80% rural. Only a few small urban centers such as Haffouz and El Ala are exceptions to this very pronounced rurality [
28].
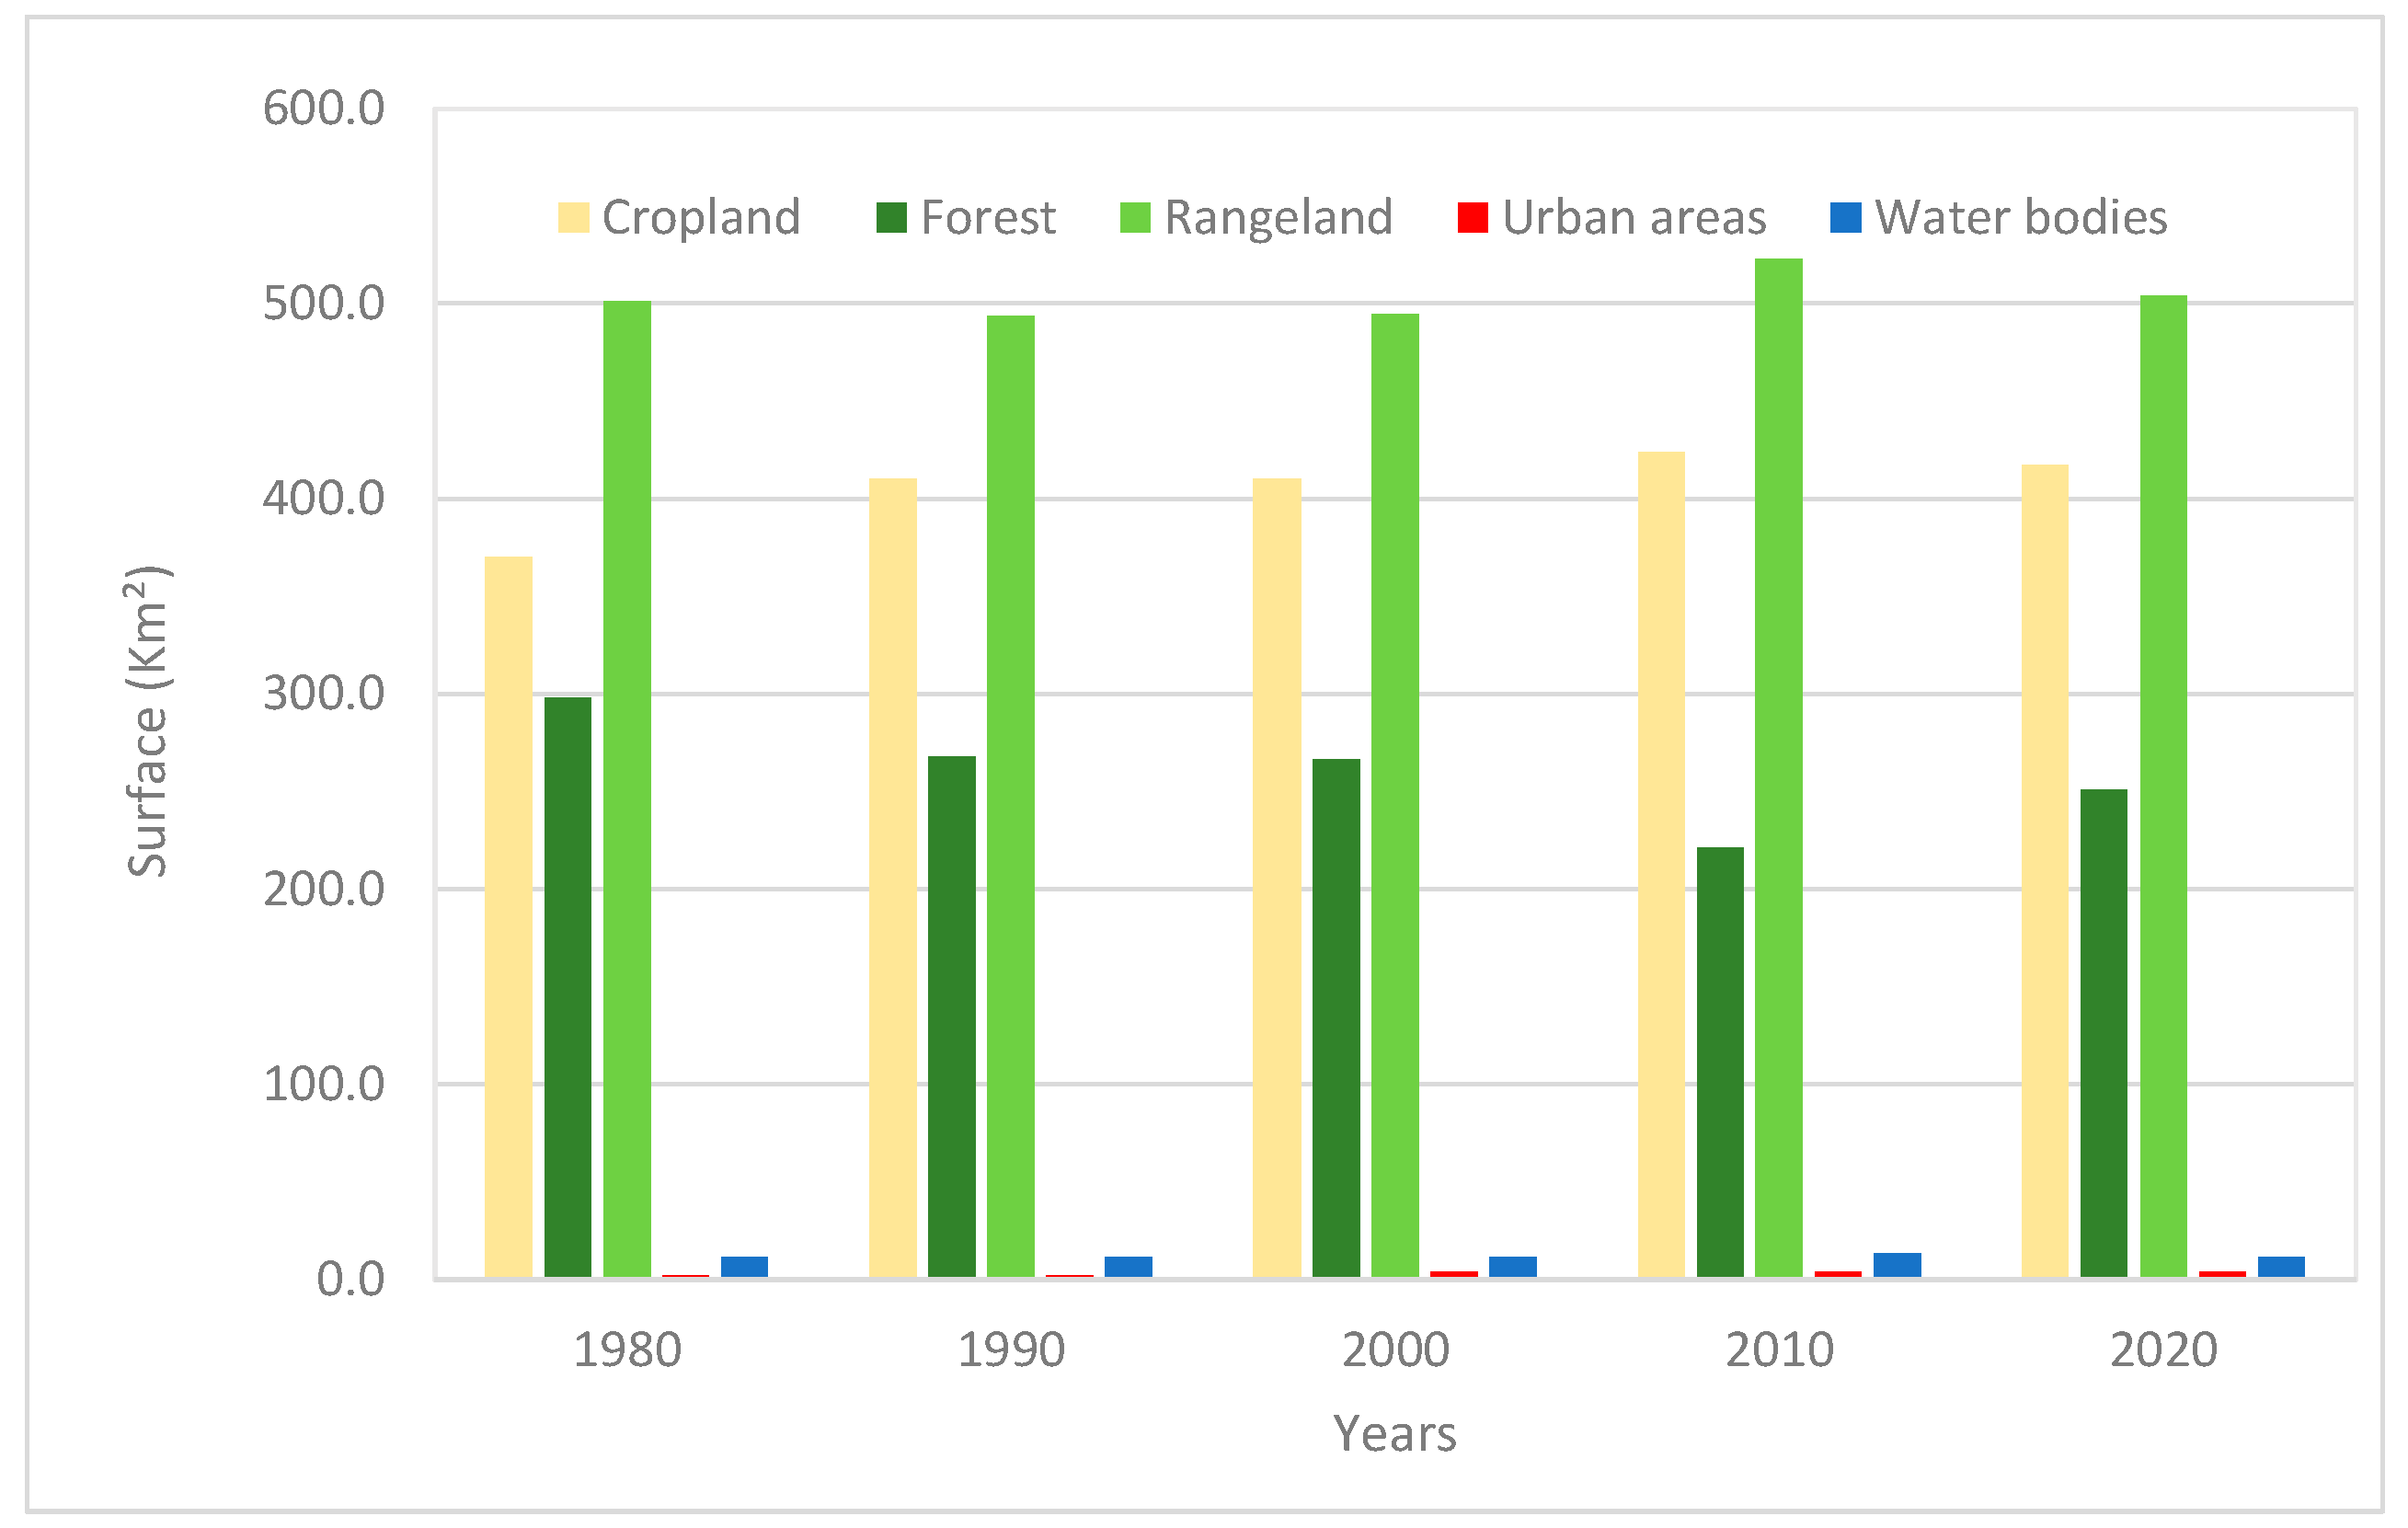
2.2. Land Use and Land Cover Change Detection
This study employed Landsat imagery captured by Multispectral Scanner (MSS), Thematic Mapper (TM), Enhanced Thematic Mapper Plus (ETM+), and Operational Land Imager (OLI) sensors, each possessing a spatial resolution of 30 m. The imageries selected covered the temporal periods of 1980, 1990, 2000, 2010, and 2020. These images were harnessed to detect Land Use and Land Cover (LULC) changes, as outlined in
Table 1. Landsat data files were gathered from the website of the US Geological Survey (
https://earthexplorer.usgs.gov/, accessed on 1 March 2021).
For the identification of land use classes, very high-resolution images accessible through Google Earth were employed. This identification process involved photo interpretation guided by a previously agreed legend. To ensure uniformity and consistency, a five-class legend was established, drawing inspiration from the Land Cover Classification System (LCCS) introduced by the FAO (Food and Agriculture Organization) in 2014. The study focused its investigation on five primary LULC classes: forests, rangeland, cropland, water bodies, and urban areas.
In addition to the imagery analysis, supplementary data sources such as maps, field surveys, databases, and insights from domain experts were also leveraged. These complementary resources were utilized to enhance and refine the classification process, contributing to a comprehensive and robust understanding of the LULC dynamics within the study area [
29]. To prevent discrepancies caused by seasonal variations in vegetation distribution throughout the year, summer images were selected for each year, which also made it easier to differentiate rainfed croplands from natural vegetation cover.
The classification process was carried out using the Support Vector Machine (SVM) method, a robust machine learning algorithm known for its effectiveness in classification and regression analysis. The integration of SVM within OTB (Orfeo ToolBox) facilitated the accurate delineation of land use categories. SVM has been widely used in a variety of fields, such as image classification, text classification, and bioinformatics due to its high accuracy and robustness [
29].
The assessment of classification accuracy involved analyzing the confusion matrix to ascertain the total number of pixels that were correctly classified. The Kappa coefficient, or Cohen’s Kappa, was utilized to assess the extent of error reduction achieved as a result of the classification process [
26].
The Kappa coefficient is a statistical metric employed to assess the level of agreement between raters when dealing with categorical data. This measure assesses the agreement level between two or more evaluators or raters who classify items into distinct categories. The Kappa coefficient (1) was computed following the methodology outlined by Mather [
26], where
Pob: observed agreement,
Pe: expected agreement.
The Kappa coefficient is bounded within the range from −1 to 1. A score of 1 signifies complete consensus among the raters, 0 indicates agreement no more significant than random chance, and −1 signifies complete discordance among the raters.
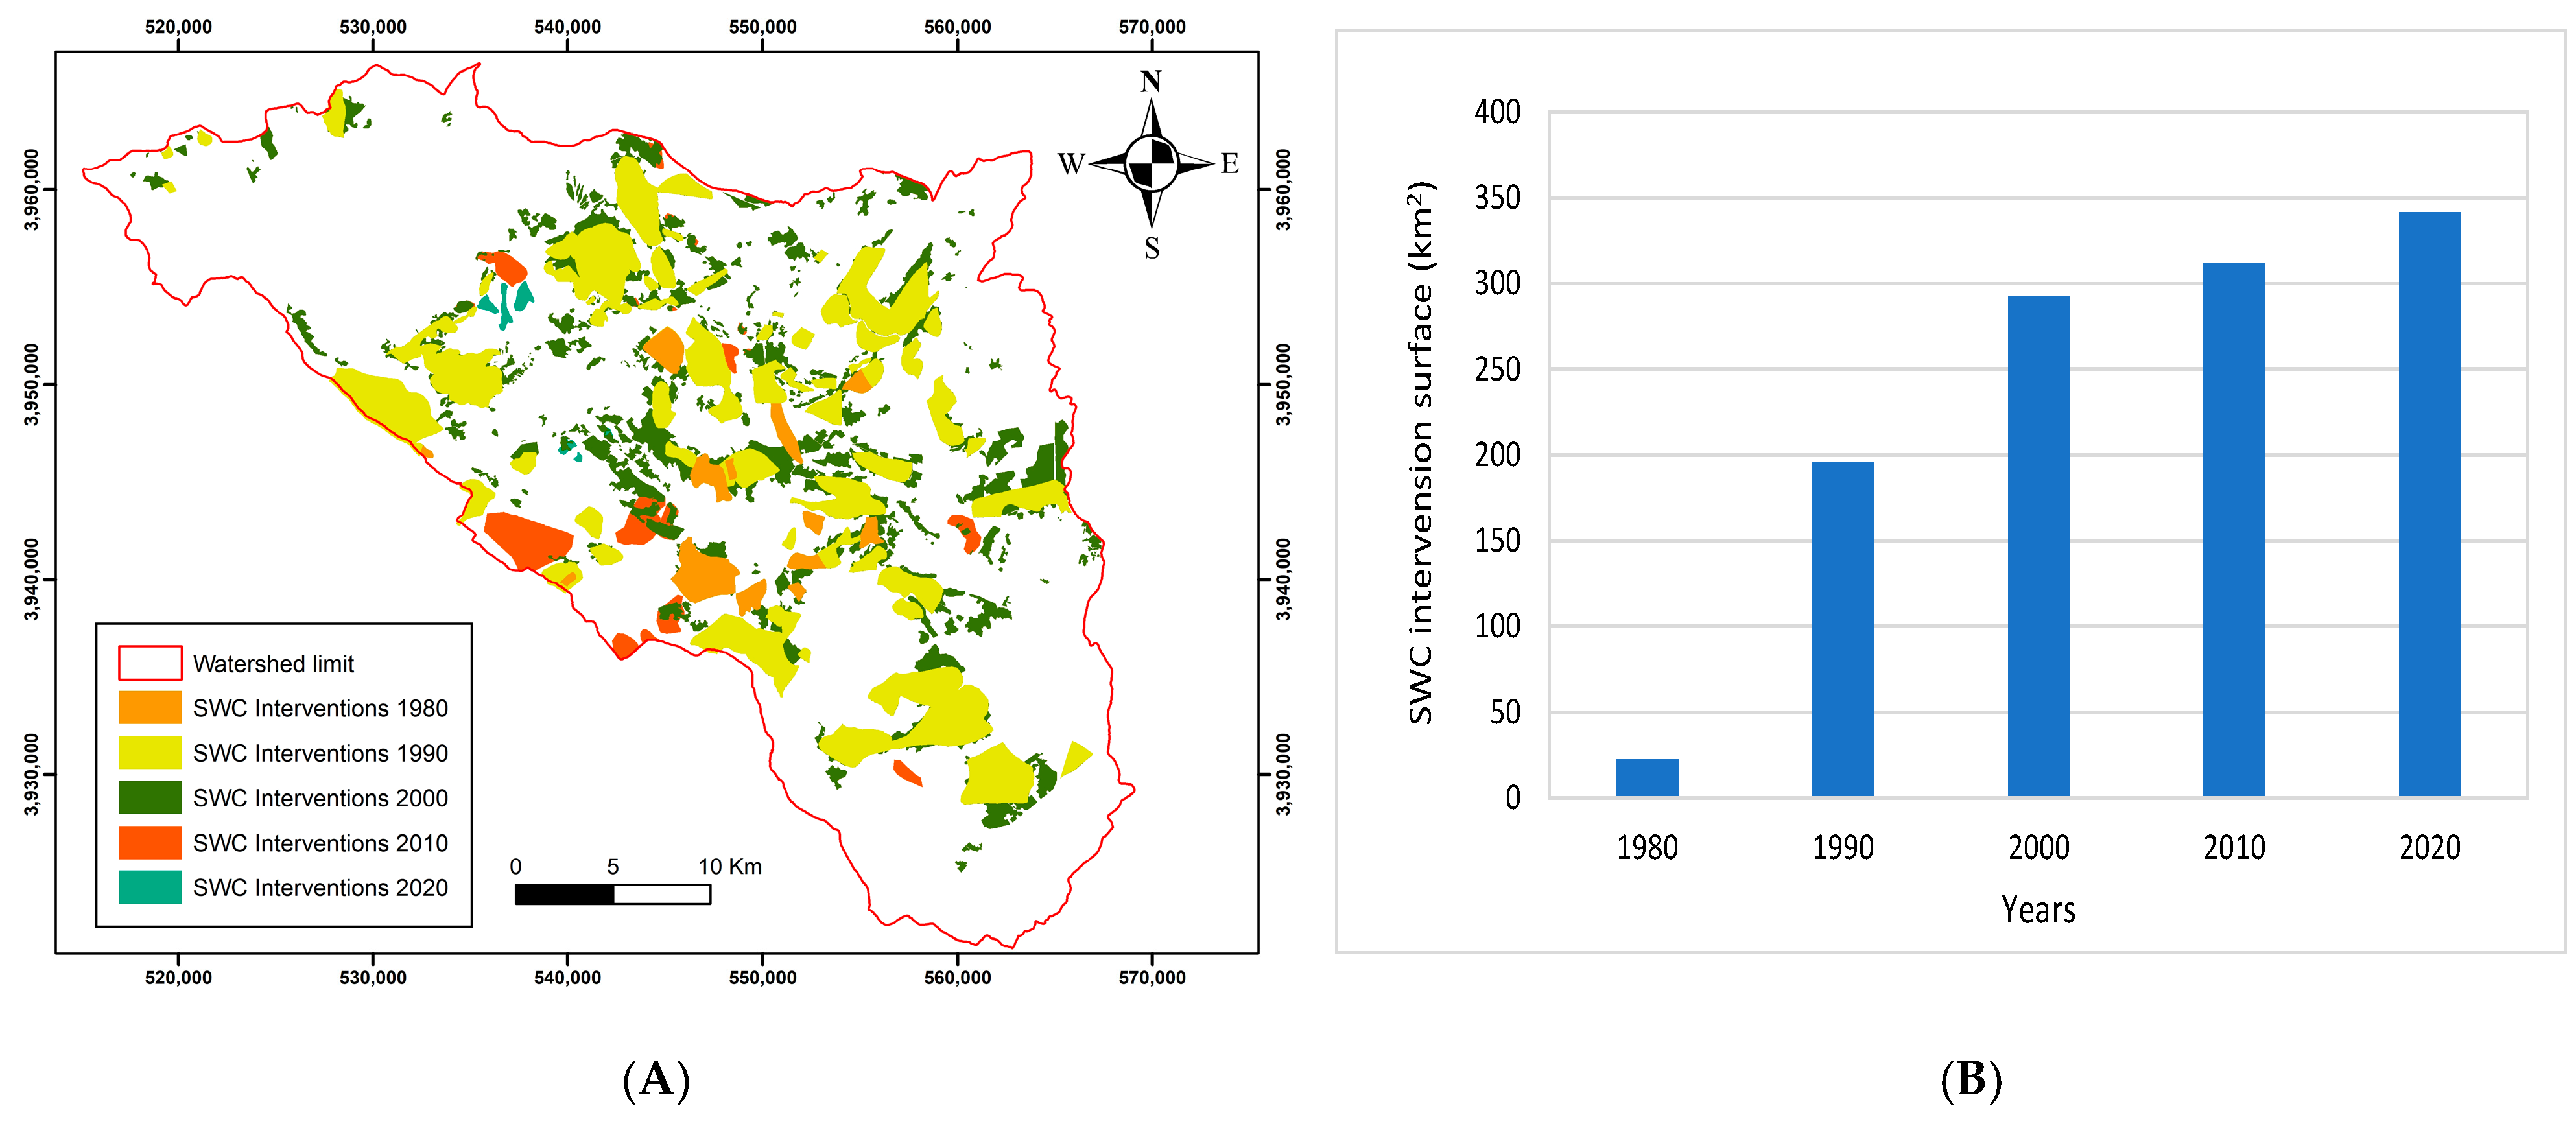
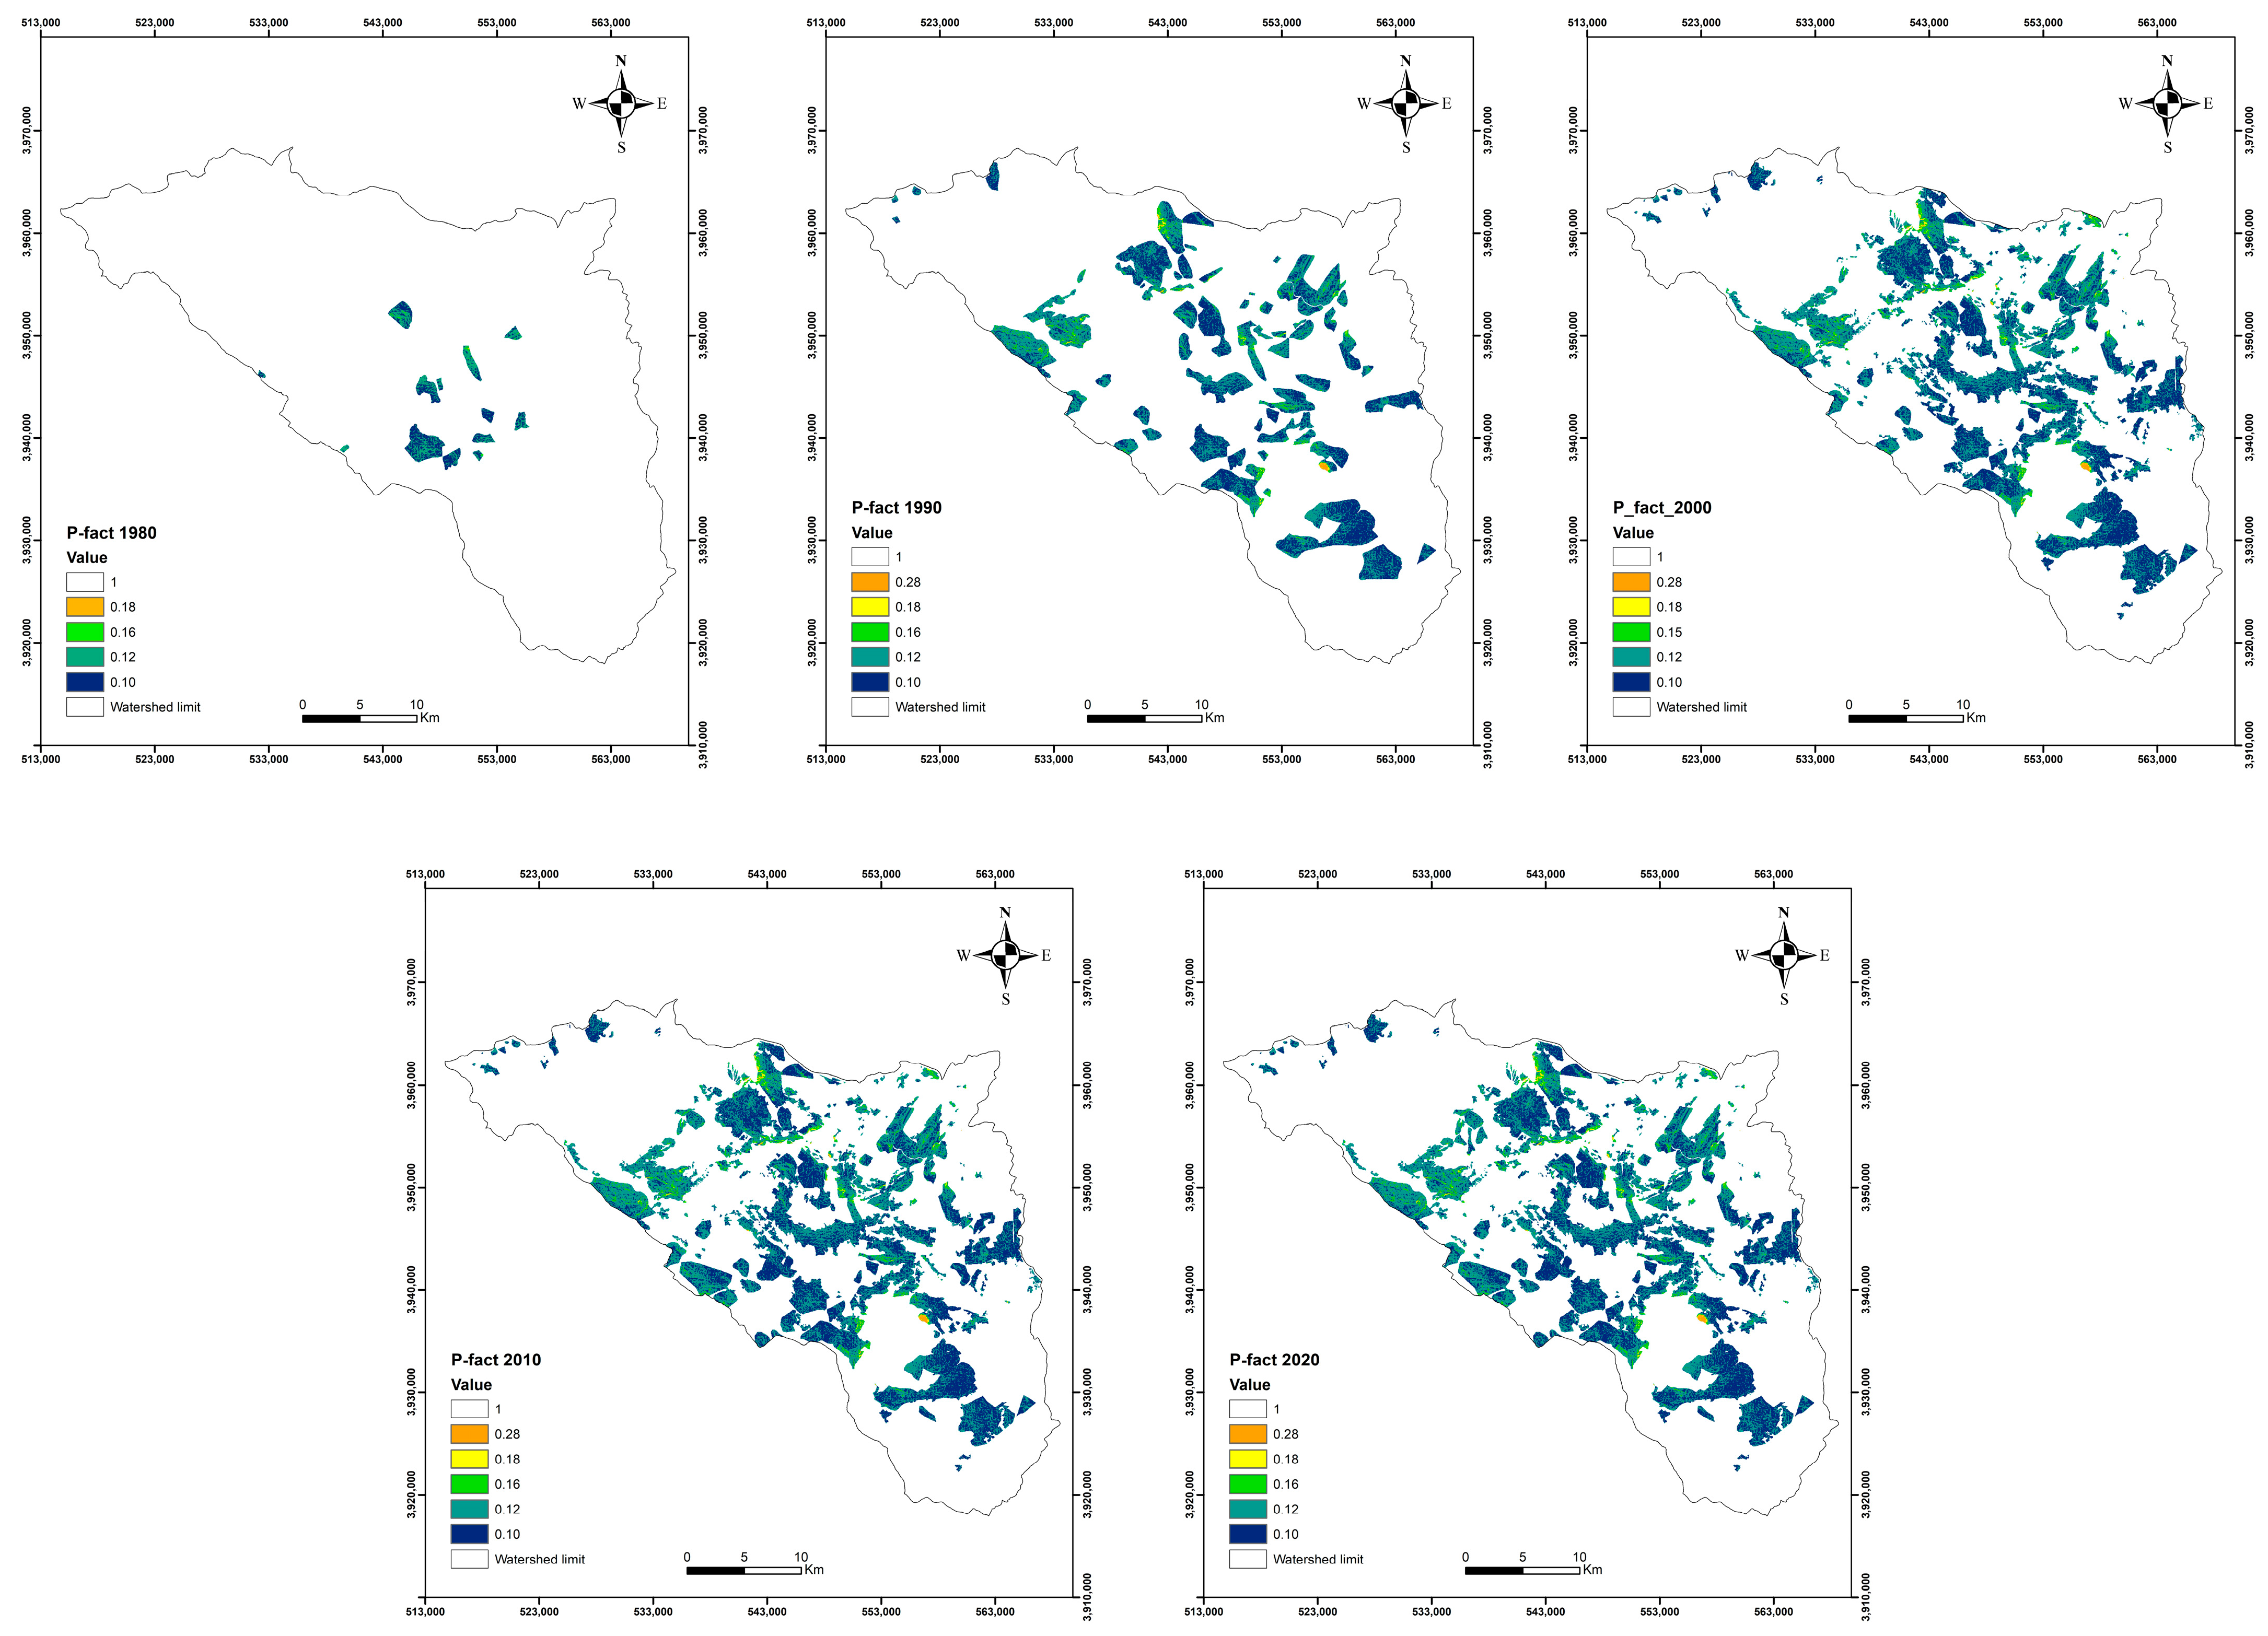
2.3. Diachronic Analysis of SWC Implementations
The temporal evolution of SWC structures’ spatial distribution was depicted through diachronic maps, which were compiled from a diverse array of sources. These sources encompassed the interpretation of satellite imagery, analysis of aerial photographs, utilization of Google Earth imagery, and the digitization of data extracted from prior research endeavors. These multifaceted resources were harnessed to construct maps that captured the SWC layout for the years 1980, 1990, 2000, 2010, and 2020, effectively highlighting the dynamic transformation of SWC structures across the study period.
2.4. The Revised Universal Soil Loss Equation
The RUSLE model stands as a widely adopted and recognized model extensively utilized for the prediction of soil erosion rates. The rationale behind selecting the RUSLE model lies in its robust scientific validity, which has been established through rigorous research and empirical validation. This model’s proven accuracy and reliability in assessing and forecasting soil erosion processes, contribute to more informed and effective soil conservation and land management strategies [
12].
Its widespread acceptance and extensive use in various geographical regions attest to its reliability and effectiveness in predicting soil erosion rates [
12,
13]. The rigorous scrutiny and validation carried out by the scientific community enhance the confidence in using RUSLE as a valuable tool in tackling soil erosion issues and adopting sustainable land management practices.
Additionally, the RUSLE model provides a practical framework for estimating soil erosion using readily available data and relatively simple mathematical equations. The integration of this model with GIS technology provides a powerful synergy that facilitates comprehensive spatial analysis and visualization of soil erosion patterns across landscapes [
13].
Then it allows for customization and adaptation to diverse geographical regions and a wide spectrum of land use scenarios. It has been widely used for several decades and has demonstrated its effectiveness in various settings worldwide.
Finally, RUSLE serves as a prominent model extensively employed in the fields of agriculture, soil conservation, and land use planning. It performs an essential role in developing erosion control plans and evaluating the effectiveness of erosion control practices in mitigating soil loss [
12,
13]. The RUSLE Equation (2) is expressed as follows:
where
GSL represents the estimated annual gross soil loss in tons per hectare.
In this equation
- −
R is the rainfall erosivity factor (MJ mm ha−1 h−1 year−1),
- −
K denotes the soil erodibility factor (t ha h ha−1 MJ−1 mm−1),
- −
LS represents the topographic factor (dimensionless),
- −
C signifies the cropping and land cover factor (dimensionless), and
- −
P stands for the erosion control practice factor (dimensionless).
Indeed, each component within the equation is assigned a specific numerical value, tailored to the unique conditions and data of the particular site under consideration.
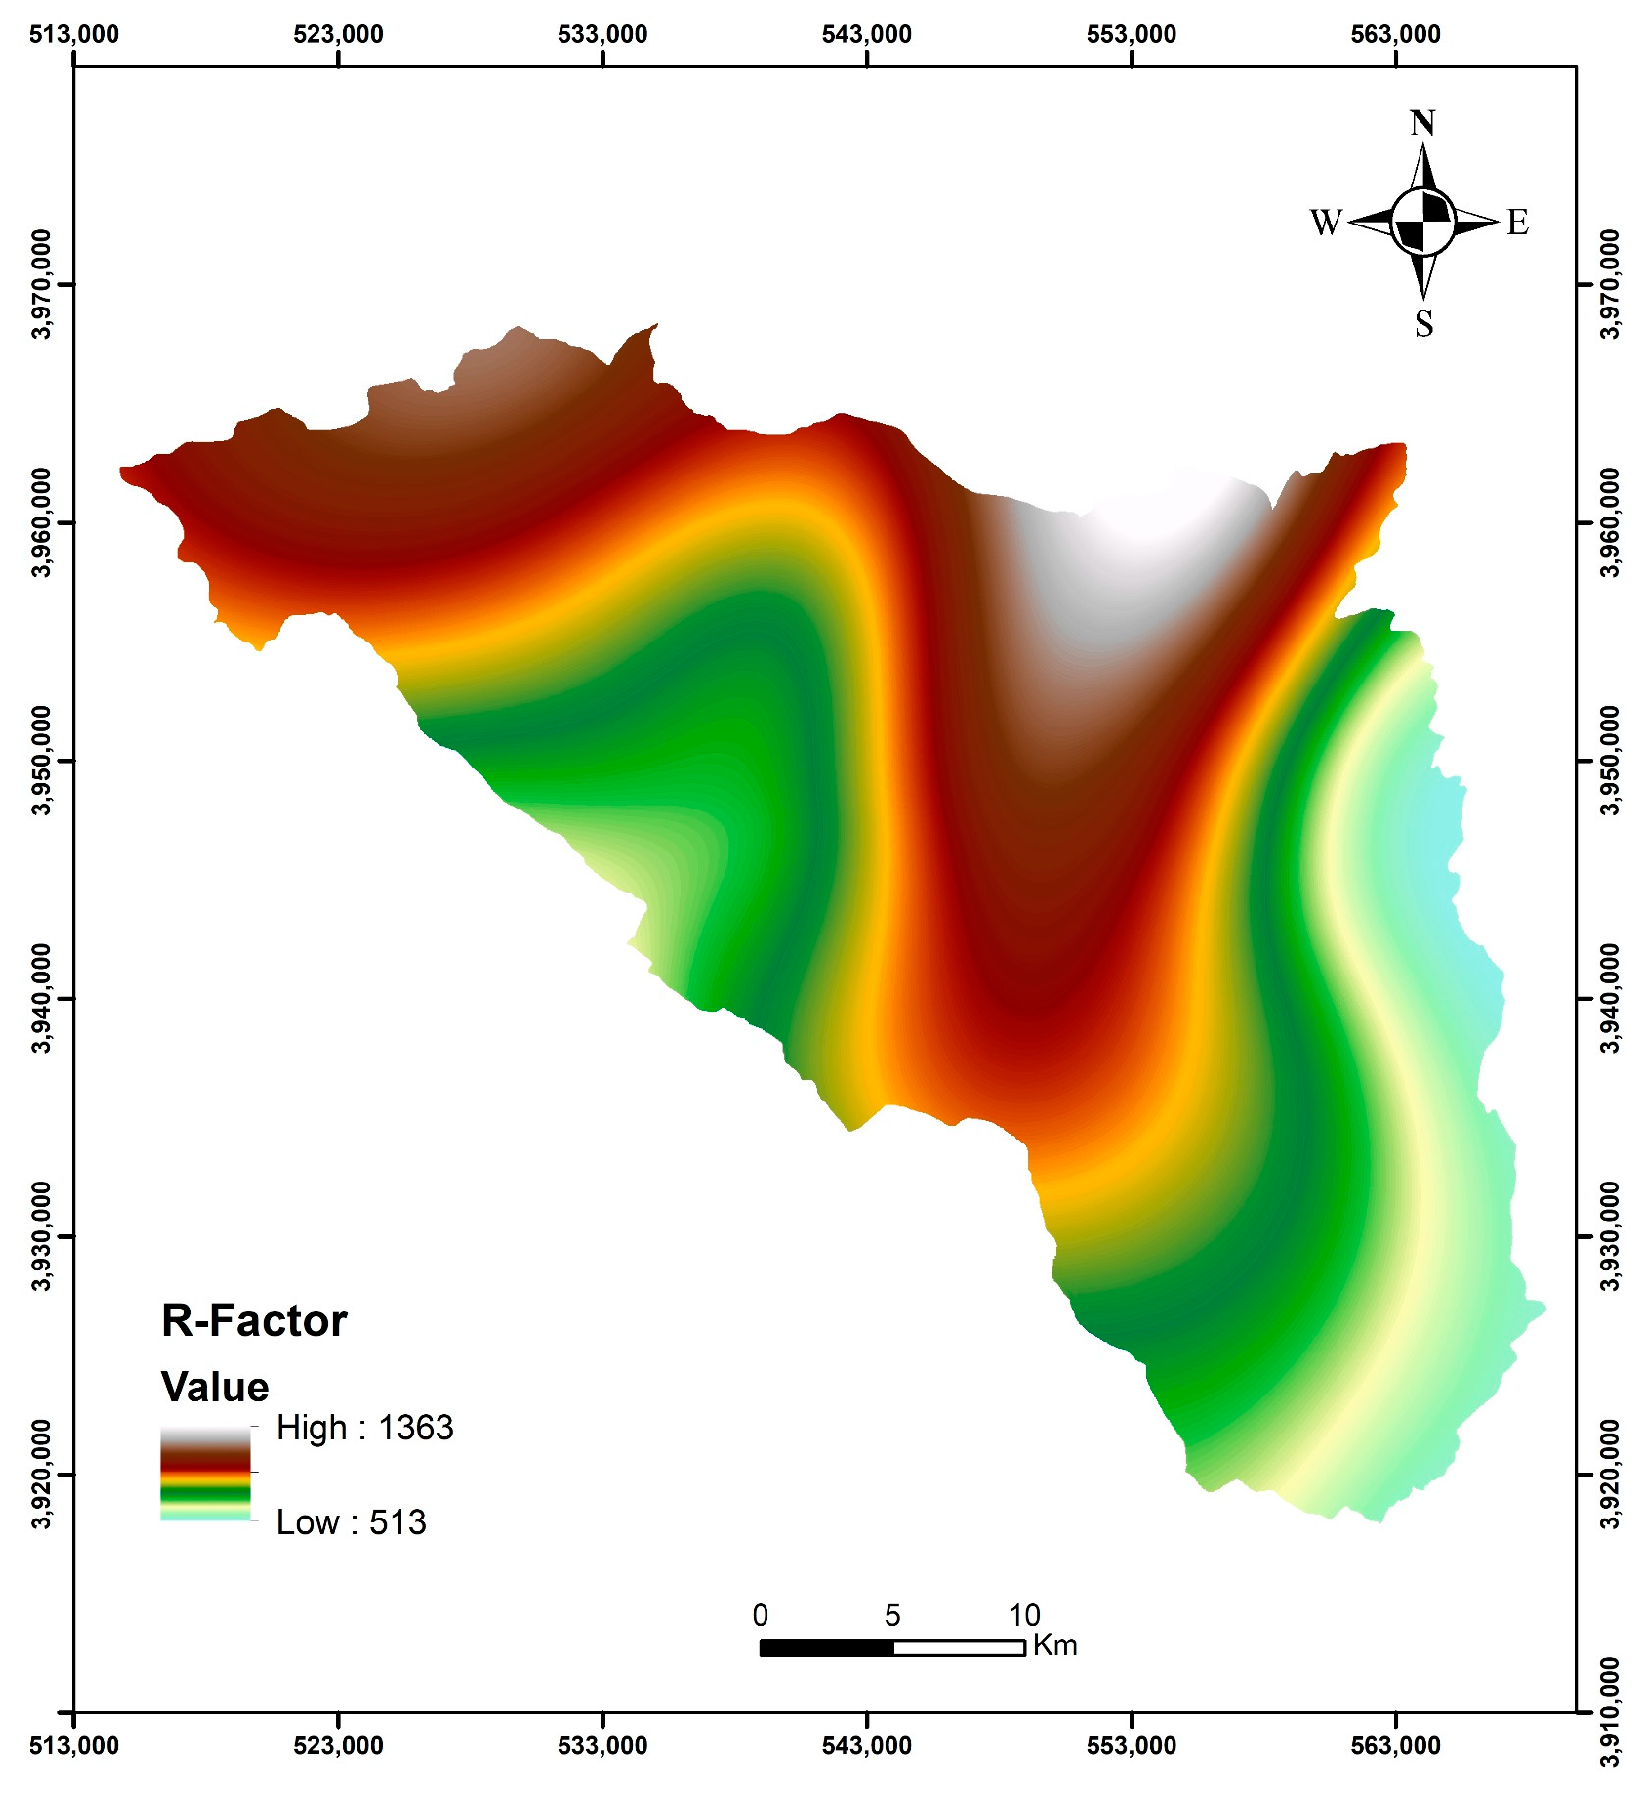
2.4.1. Rainfall Erosivity (R) Factor
The rainfall erosivity factor, which captures the erosive impact of specific rainfall events [
12], is influenced by factors such as rainfall amount, intensity, and distribution. Among these, rainfall intensity holds particular significance in determining erosion levels. The original and revised forms of the Universal Soil Loss Equation (USLE and RUSLE) traditionally utilized rainfall intensity data to represent the R factor.
In the present case, there is limited availability of rainfall intensity data. Consequently, an alternative regression empirical equation established and refined by Arnoldus [
30] was employed to compute the R factor.
The Arnoldus Formula (3) incorporates both monthly and annual precipitation data:
To achieve this, daily rainfall records spanning from 1980 to 2020 were obtained from twenty-one meteorological stations (
Figure 1) affiliated with the General Directorate of Water Resources of Tunisia. Subsequently, the calculated R factor underwent interpolation using the inverse distance weight (IDW) method, with the resultant map being transformed into a grid format with a cell size of 30 m.
2.4.2. Soil Erodibility Factor
The soil erodibility factor signifies the influence of soil characteristics on erosion [
12,
13]. The erodibility factor (K) for the various soil types in the Merguellil watershed was established using the soil map along with pedotransfer functions and values from the specialized literature [
31,
32]. These factors were obtained from soil attributes that affect soil erodibility, including soil texture, structure, depth, and organic content. By considering these crucial soil characteristics, the erodibility factor (K) was determined, enabling a more accurate assessment of the soil’s susceptibility to erosion processes within the watershed. The K factor map obtained from the soil map was transformed into a grid with a cell size of 30 m.
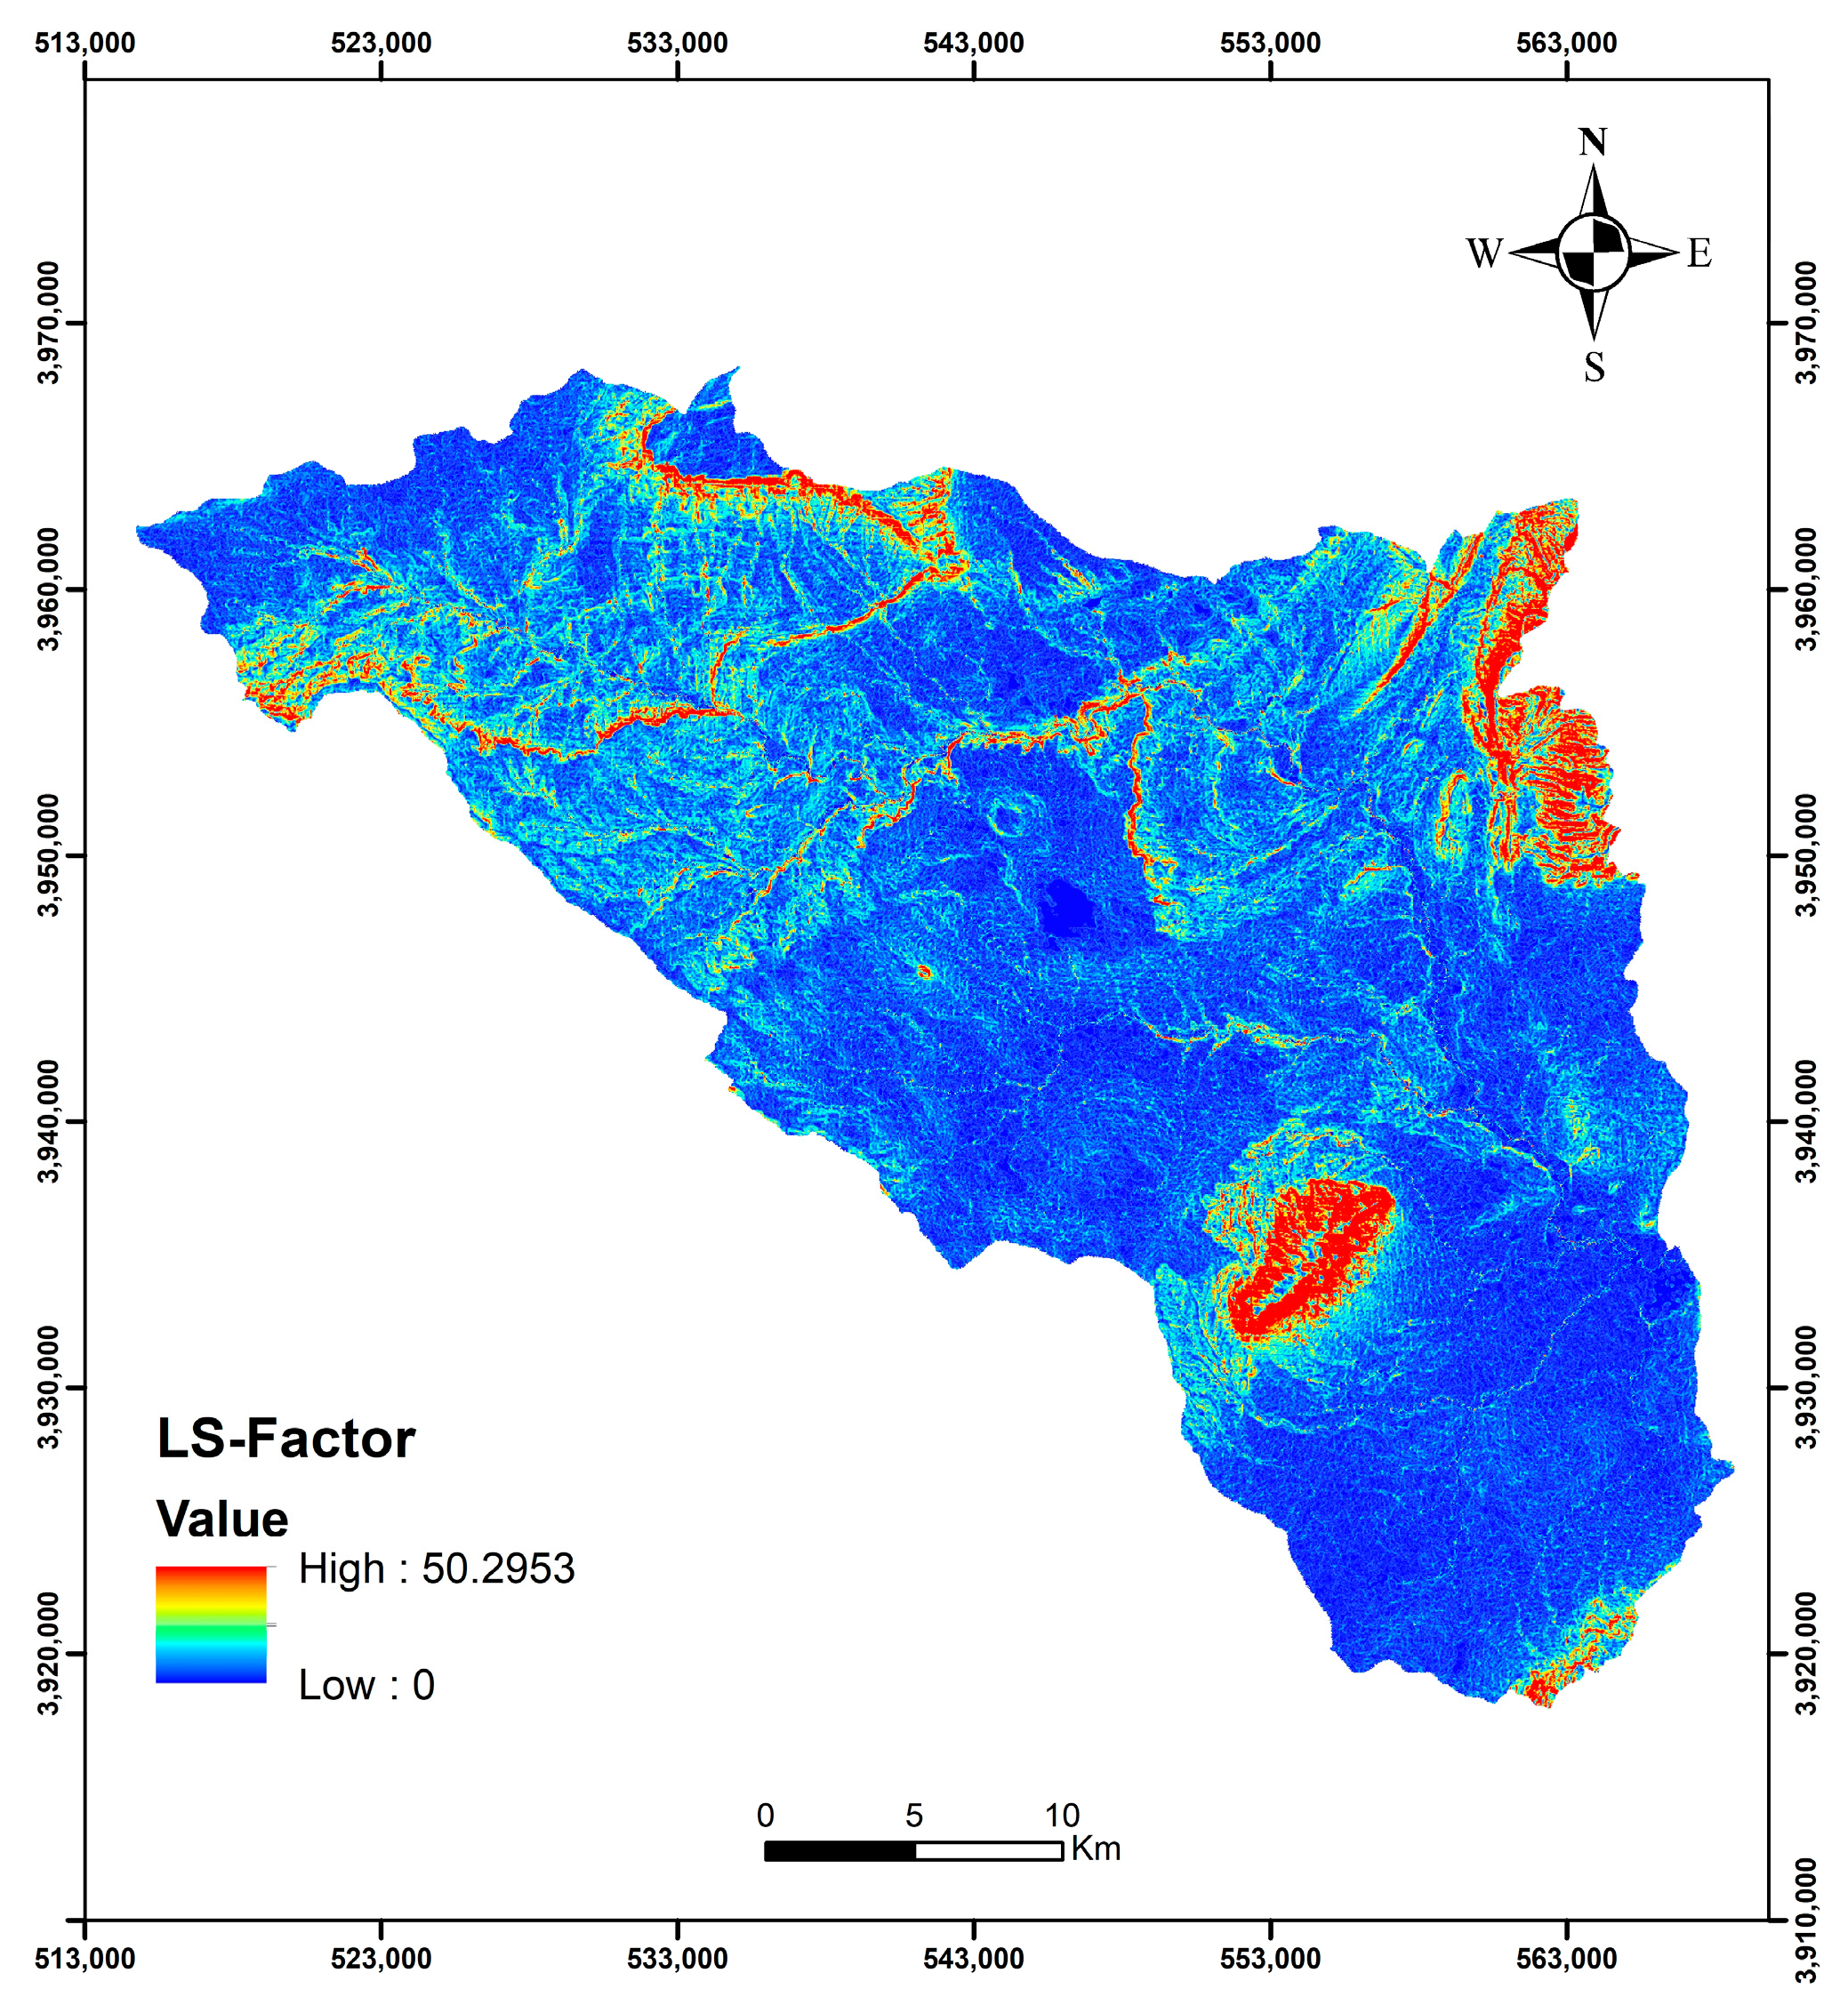
2.4.3. Topographic Factor
The topographic factor including the slope length (L) and slope steepness (S) encompasses the impact of topography on erosion [
31]. On steeper and longer slopes, the effect of topography in amplifying runoff results in greater water-induced erosion. Conversely, erosion is reduced on gentler and shorter slopes where the influence of topography on water runoff is less pronounced.
In this research, the LS factor was computed using the 30 m resolution ASTER GDEM data (
http://gdex.cr.usgs.gov/gdex/, accessed on 1 March 2021). The computation of the LS factor was carried out using the Moore equation (1991).
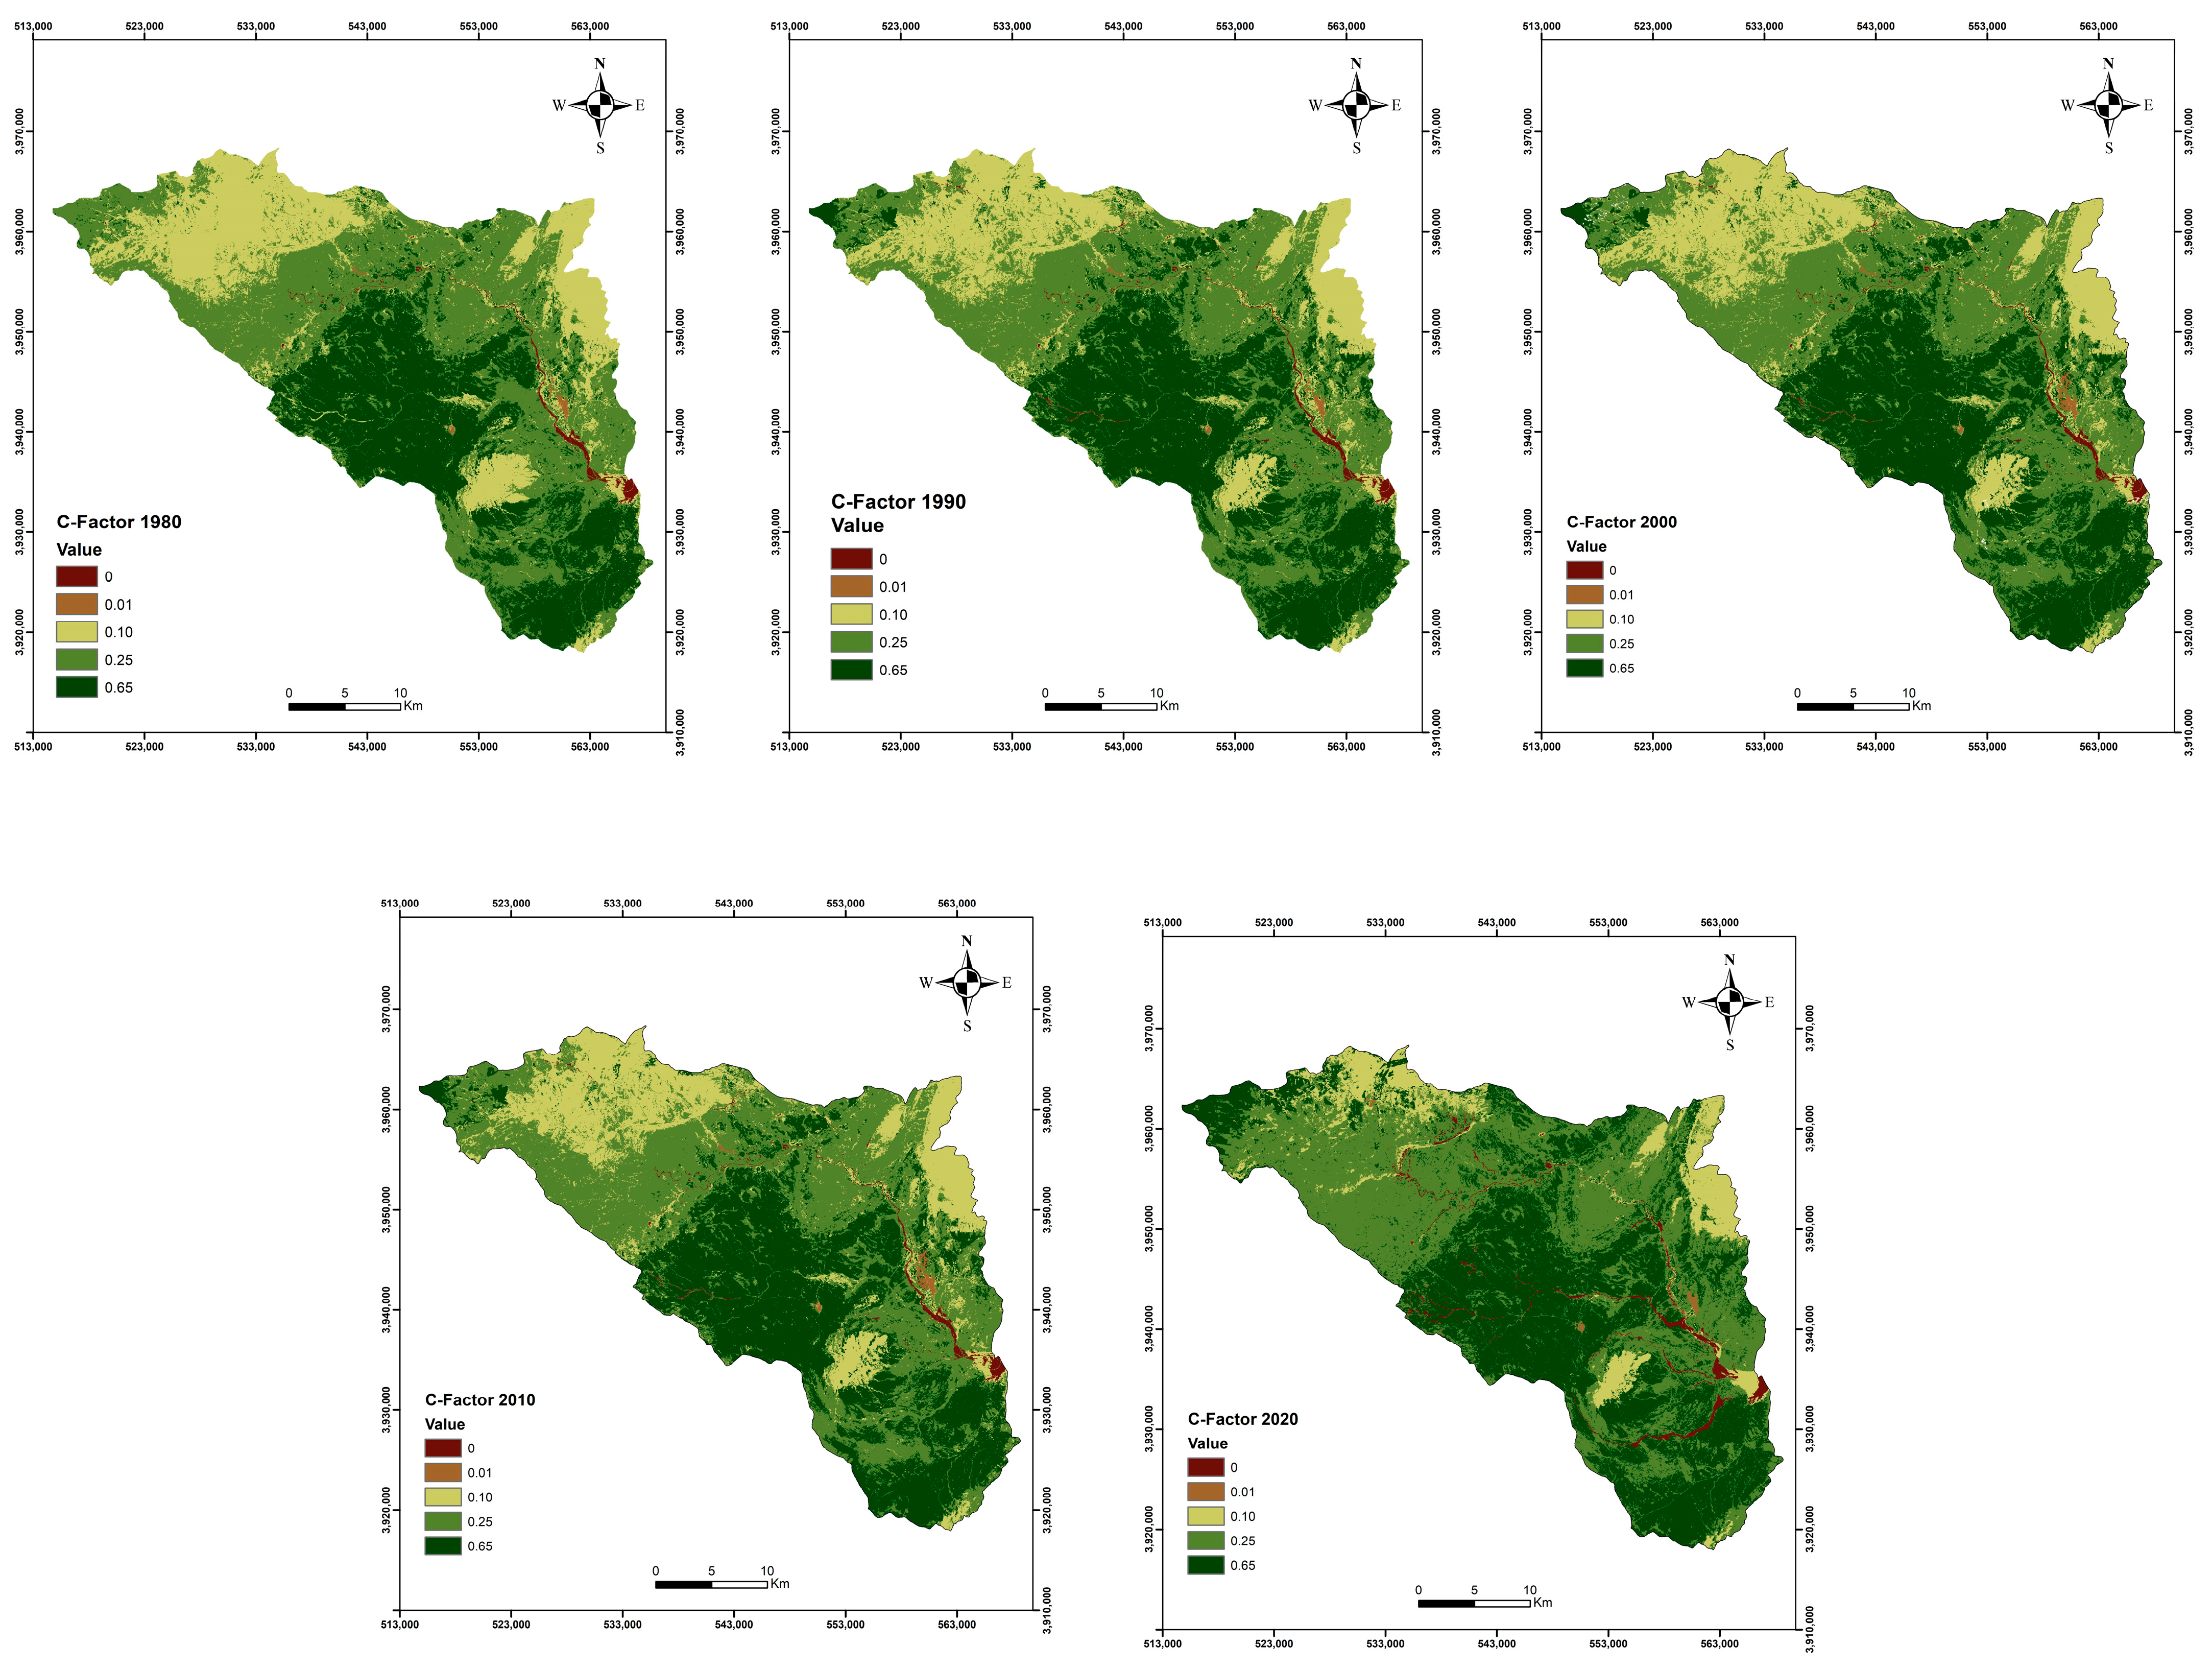
2.4.4. Cropping and Land Cover Factor
The cropping factor addresses the significance of vegetation cover in mitigating soil erosion [
12]. In areas with low vegetation cover, water erosion is more pronounced, whereas areas with substantial vegetation cover experience reduced soil erosion due to the protective effect of vegetation on the soil surface. For this factor, we have associated an annual average vegetation cover value for each type of crop which is obtained directly from land use maps and aerial photos for the study area and by referring to the work of Cormary and Masson [
32] in Tunisia and Wischmeier [
31] in the United States.
To generate C-factor maps for the study watershed, corresponding to the LULC temporal layers, specific C factors were allocated to each LULC type based on information available in the literature. These C factors were chosen to reflect the varying levels of vegetation cover and its impact on reducing or promoting water erosion in each LULC category.
2.4.5. Conservation Practice Factor
This factor signifies the effect of conservation practices in mitigating erosion [
12]. Assigned on a scale between 0 and 1, a value of 1 corresponds to areas devoid of conservation practices, while values approaching 0 characterize regions with highly effective conservation measures. Hence, the practice is effective when the value of P is lower. The effectiveness of the P factor hinges on the method of implementation and the specific slope for which it is devised [
33,
34].
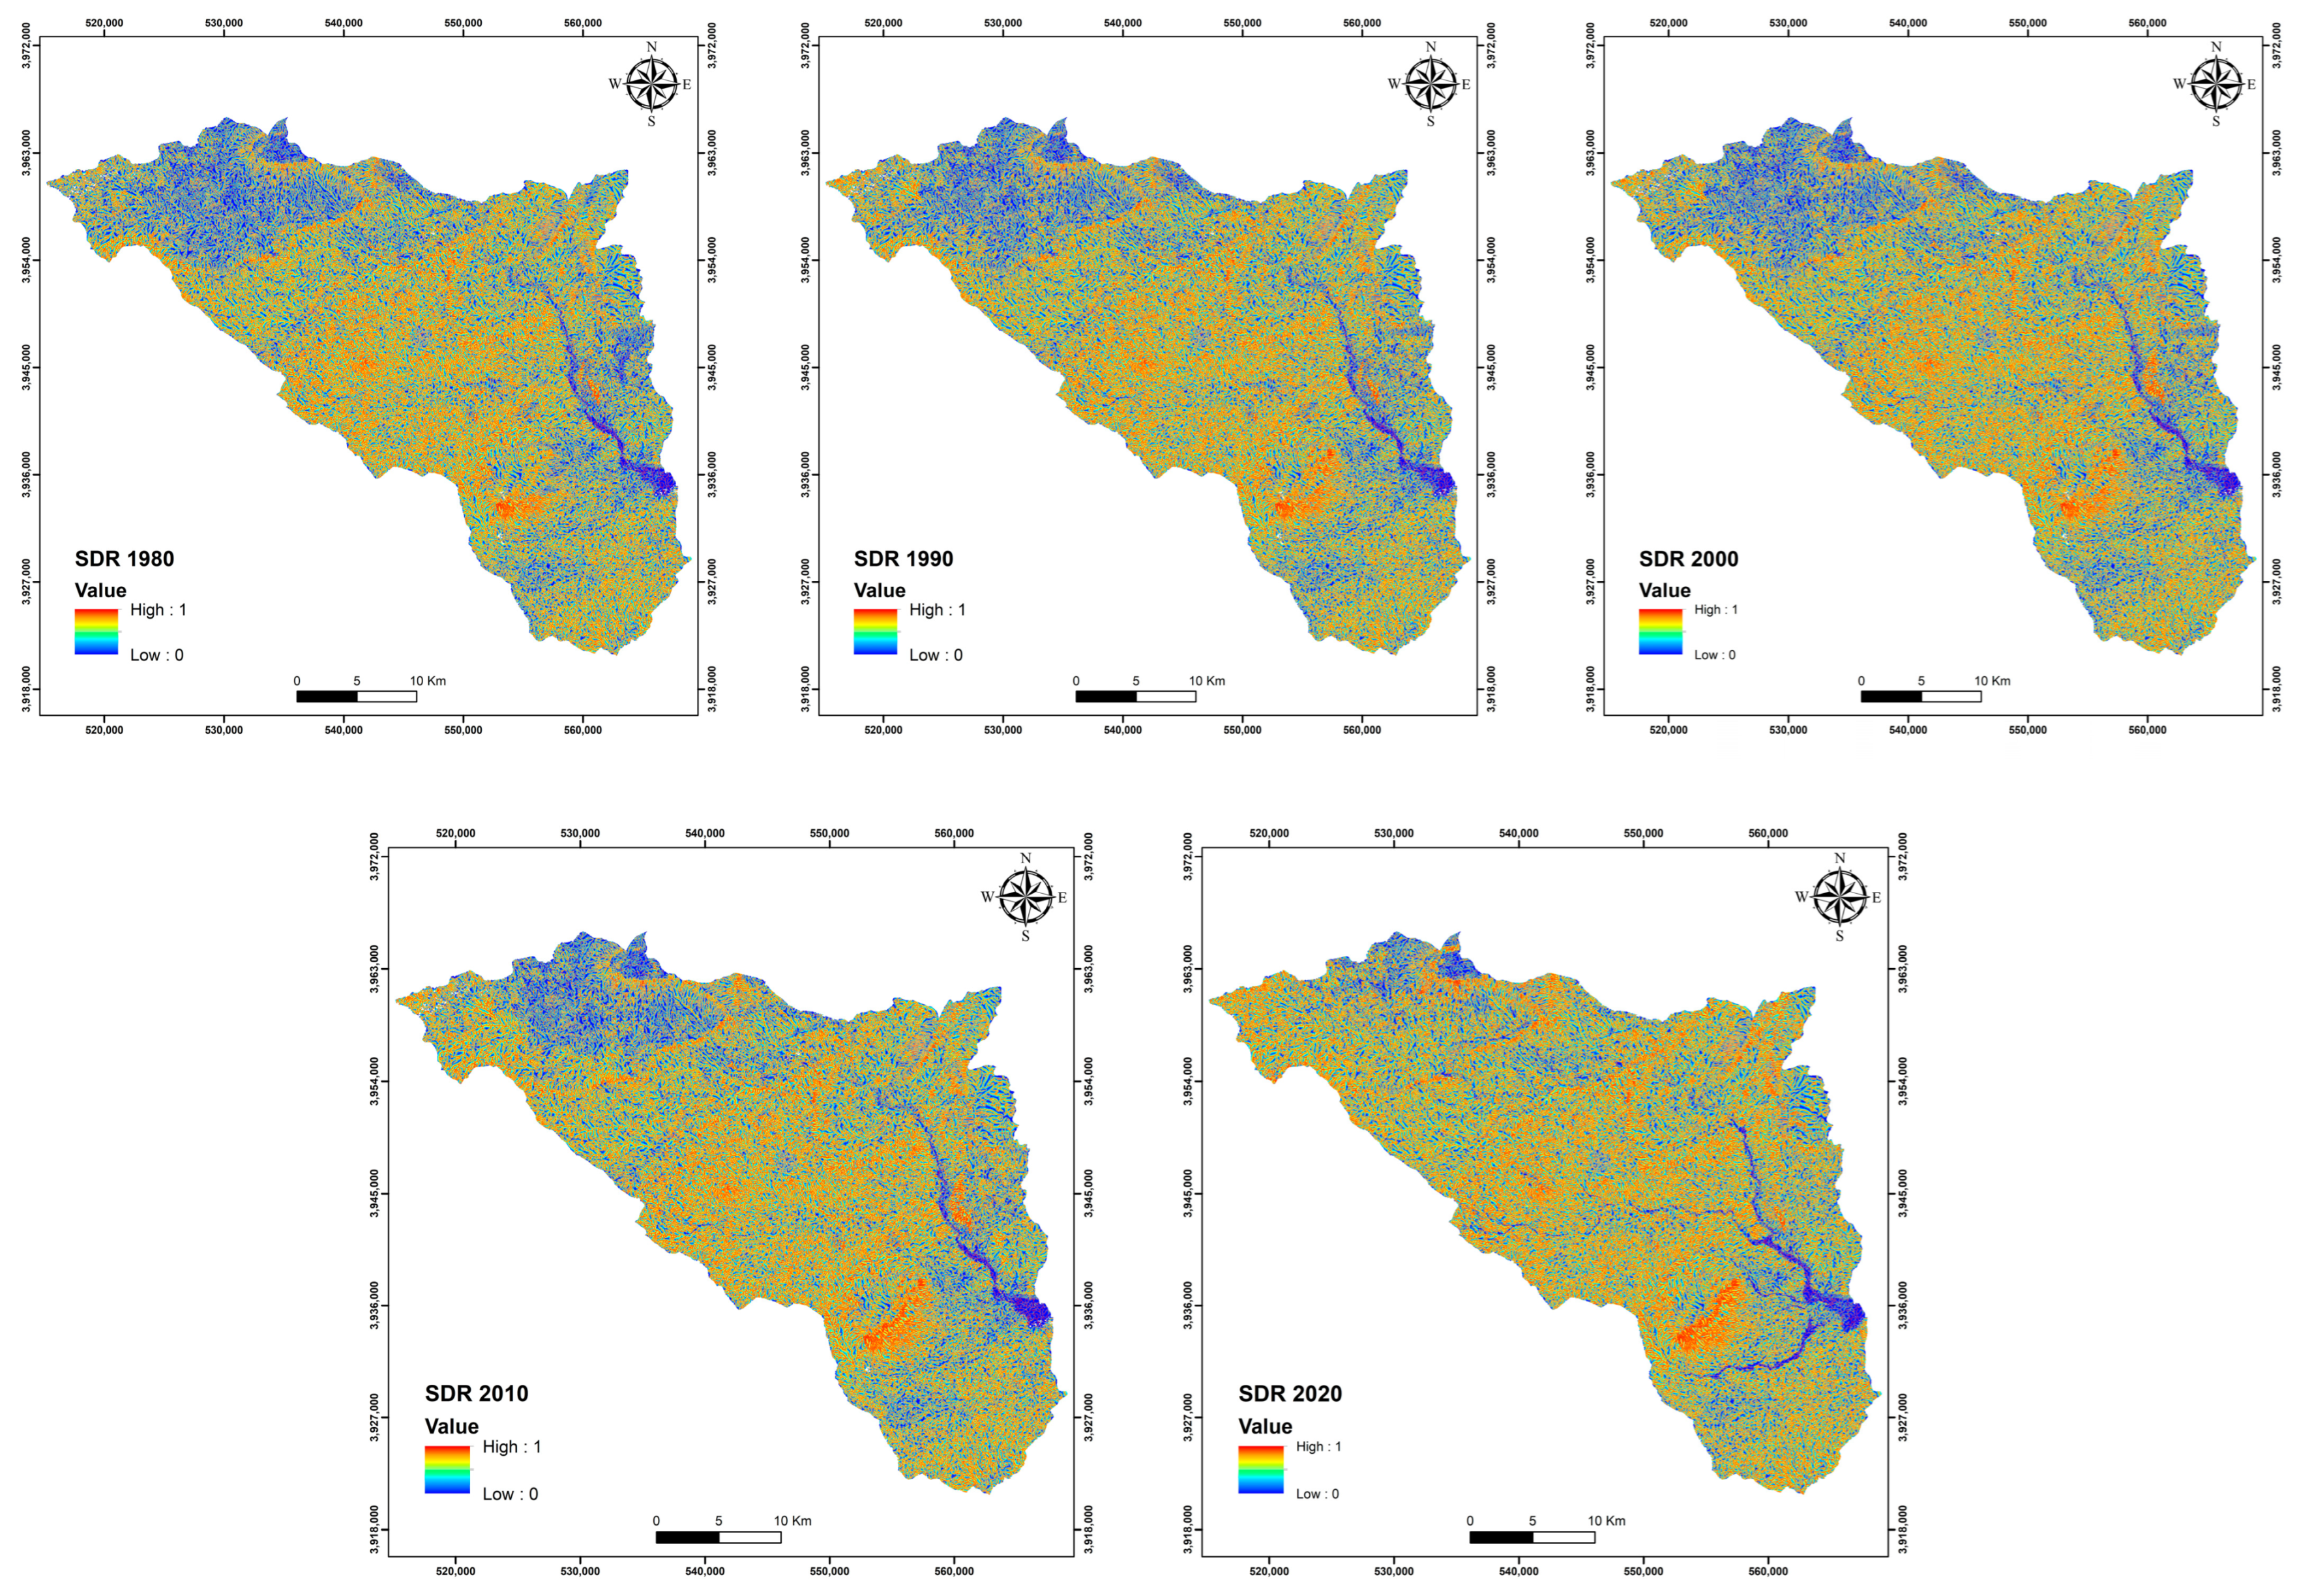
2.5. Sediment Delivery Ratio
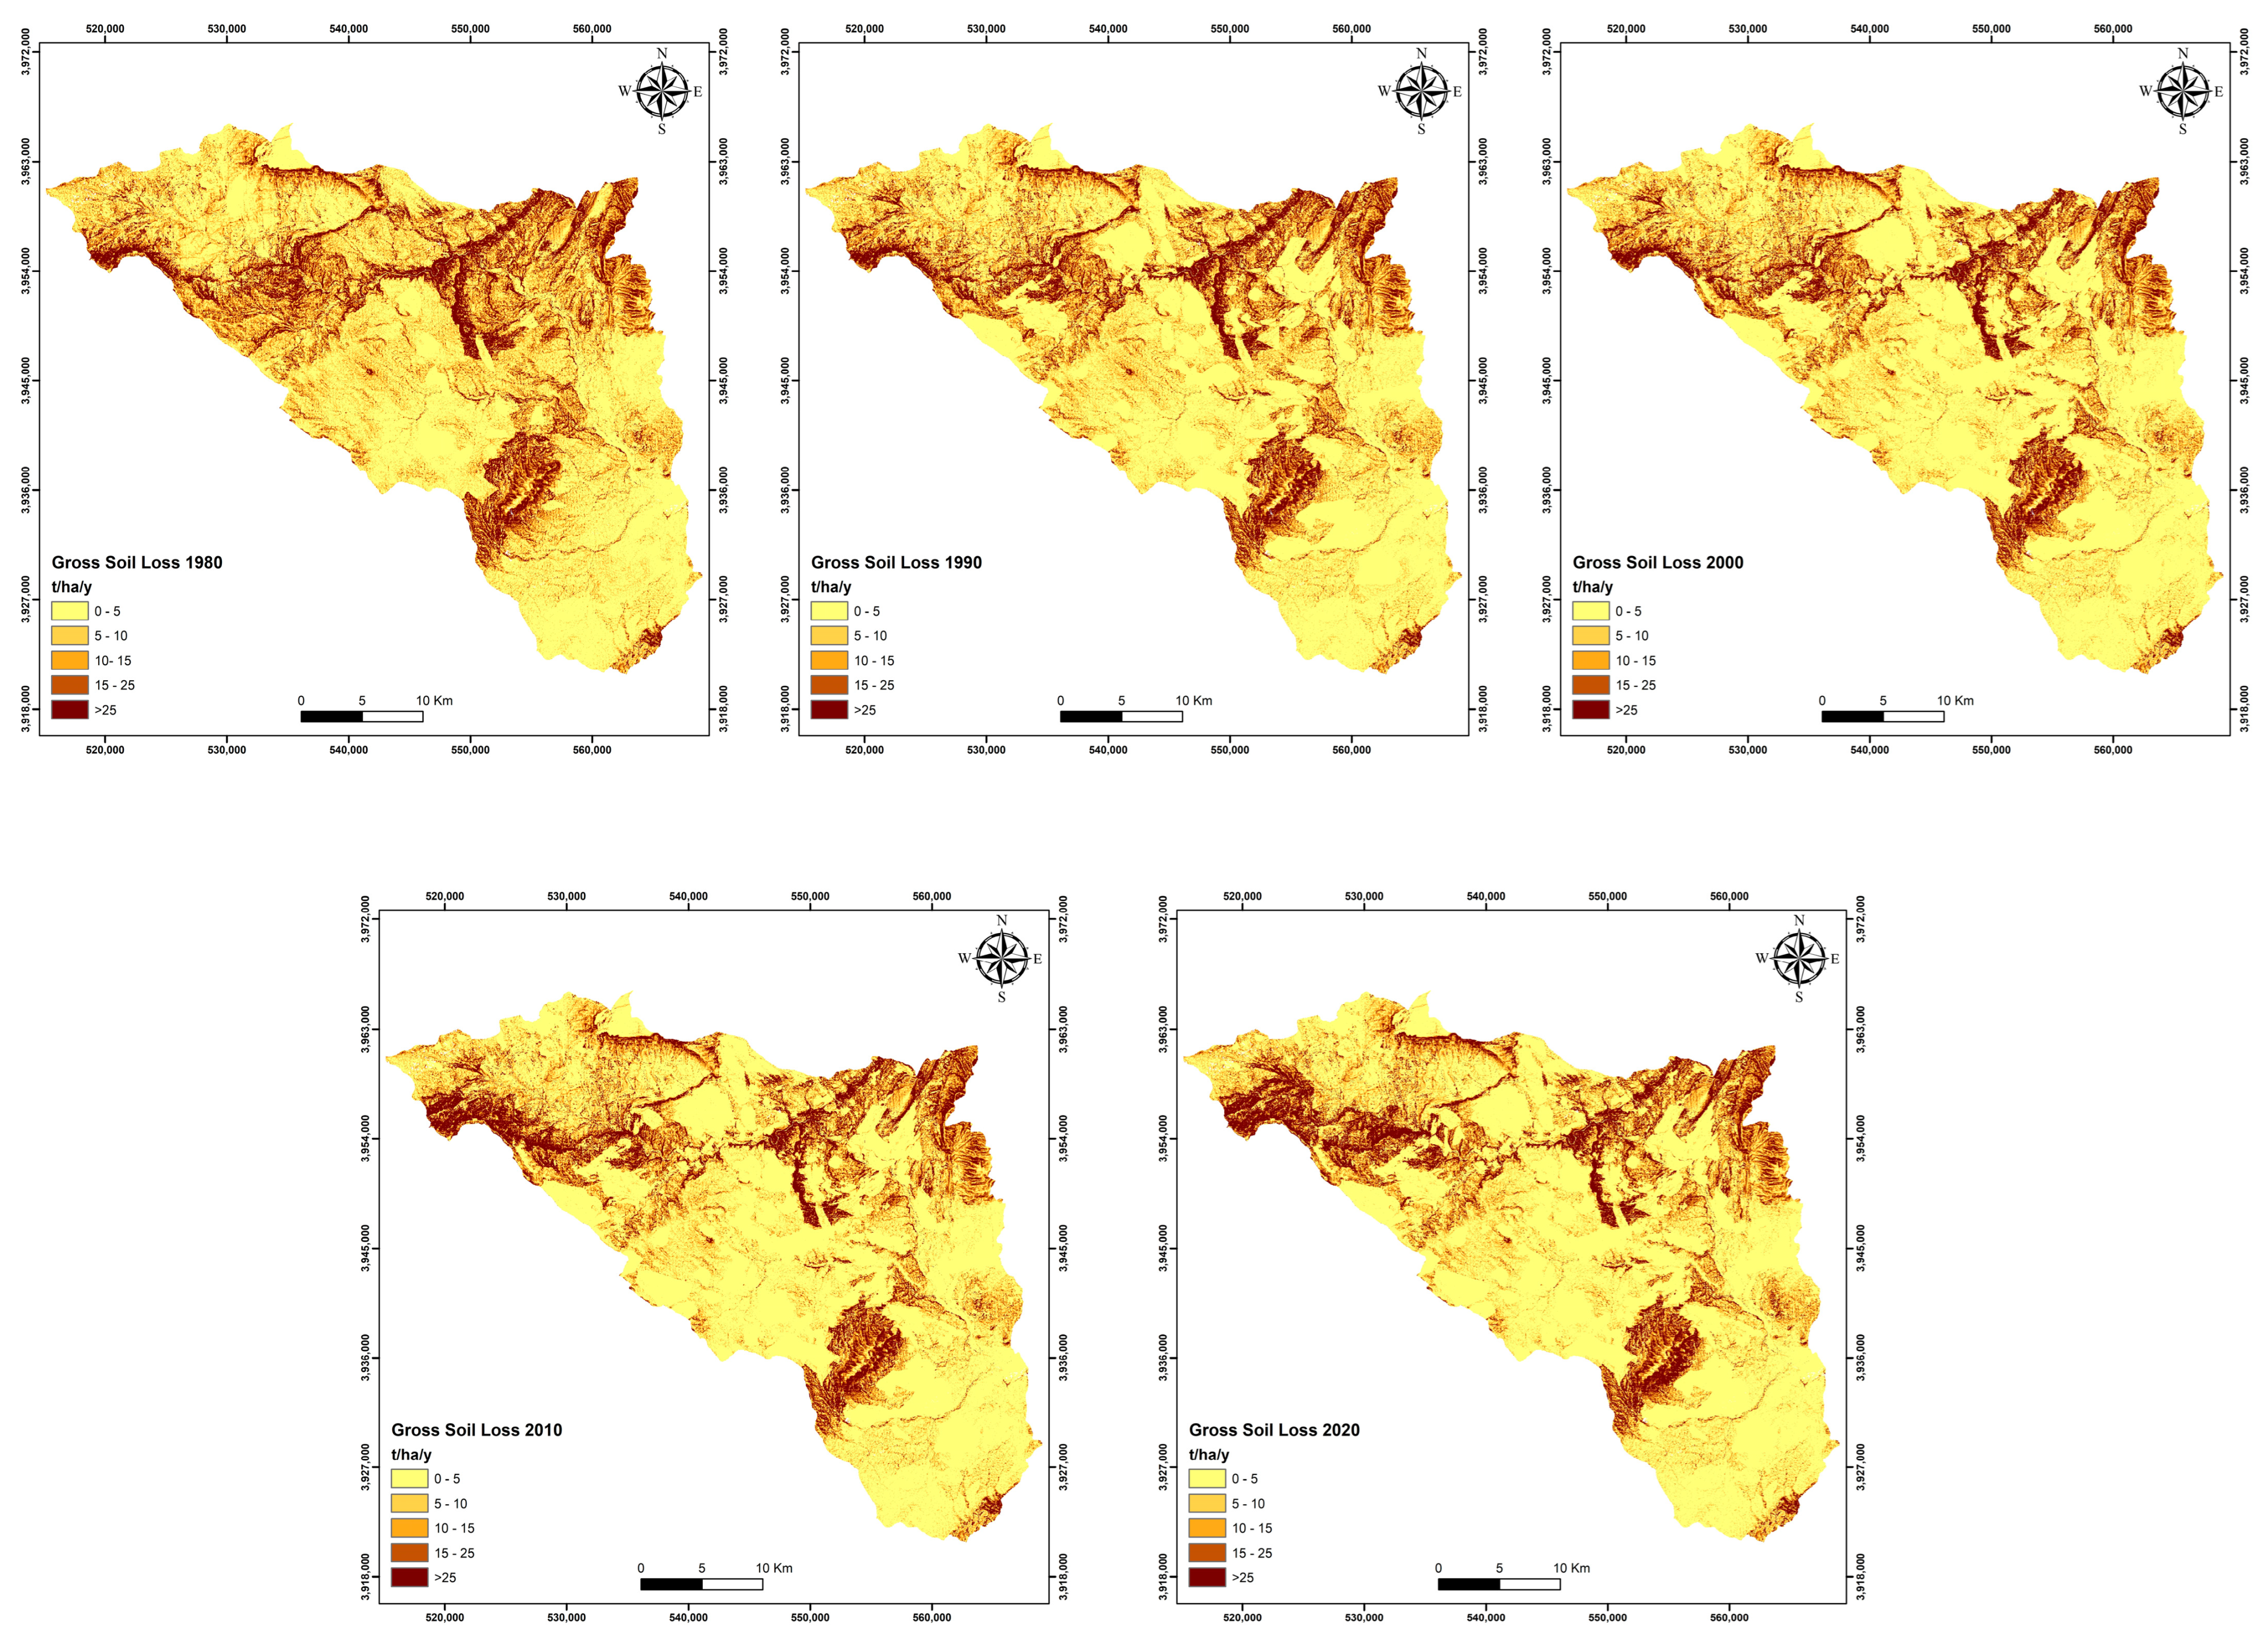
The concept of gross soil loss (GSL) proposes to identify the areas that are most susceptible to erosion, considering a combination of natural and climatic conditions, as well as the impacts of human activities on soil erosion susceptibility. By incorporating these multifaceted factors, the GSL provides a comprehensive assessment of erosion-prone regions, helping in the formulation of targeted soil conservation and erosion control strategies to safeguard the landscape’s integrity and ecological balance. However, it is important to note that the predicted GSL does not encompass the aspect of sediment deposition dimension, and it does not align with the concept of net soil loss (NSL).
The sediment delivery ratio is a metric that gauges the proportion of sediment transported to a stream or water body about the quantity of sediment eroded from a specific area. This factor takes into account the complex dynamics of sediment movement, shedding light on how eroded soil particles are transported and ultimately deposited in aquatic systems, influencing their overall health and resilience [
15,
35].
The sediment delivery ratio is a useful parameter in soil erosion modeling and sediment yield estimation. It is calculated by dividing the sediment yield leaving the erosion site by the total sediment produced by that site. The SDR value spans a scale from 0 to 1. It is influenced by many factors such as land use, slope, soil type, and vegetation cover. The SDR can be employed to estimate the quantity of sediment that reaches a specific location. This is crucial for comprehending the effects of sediment on ecosystems and for formulating management strategies aimed at reducing the silting up of reservoirs. The SDR is widely used in soil erosion and sediment transport modeling, and it is an important parameter in many soil conservation and water management programs.
In a raster GIS context, the sediment delivery ratio can serve as a model for sediment distribution, representing the likelihood that eroded particles mobilized from a given catchment cell will be carried to the nearest stream cell [
35]. This can be calculated using the following Formula (4):
where
NSLi is the net soil loss at a pixel.
GSLi and
SDRi are, respectively, the
GSLi and
SDRi at the same pixel.
SDRi can be calculated using the following Formula (5):
where
β is a routing coefficient set −0.0051.
The parameter Li represents the length of segment i in the flow path, and its value is derived from either the length of the side or the diagonal of each cell, depending on the flow direction within the cell. The length is measured in meters (m).
The map of the Li values is obtained from the ASTER GDEM using hydrological routines that calculate the “flow length”. Ri is the surface roughness coefficient (m/s) derived based on the findings of Haan et al. (1994). The parameter Si denotes the slope gradient, expressed in meters per meter (m/m). It is derived from the surface slope α, which is obtained from the GDEM (Global Digital Elevation Model). Si is calculated as follows (6):
The roughness of the soil surface plays a significant role in shaping hydrodynamic friction [
23], consequently exerting an impact on the movement of water and the transportation of sediment. Additionally, it influences the process of sediment re-deposition across the landscape [
5]. All coefficients for the various LULC classes were utilized based on the values presented in the work of Haan et al. [
17].
2.6. Statistical Analysis
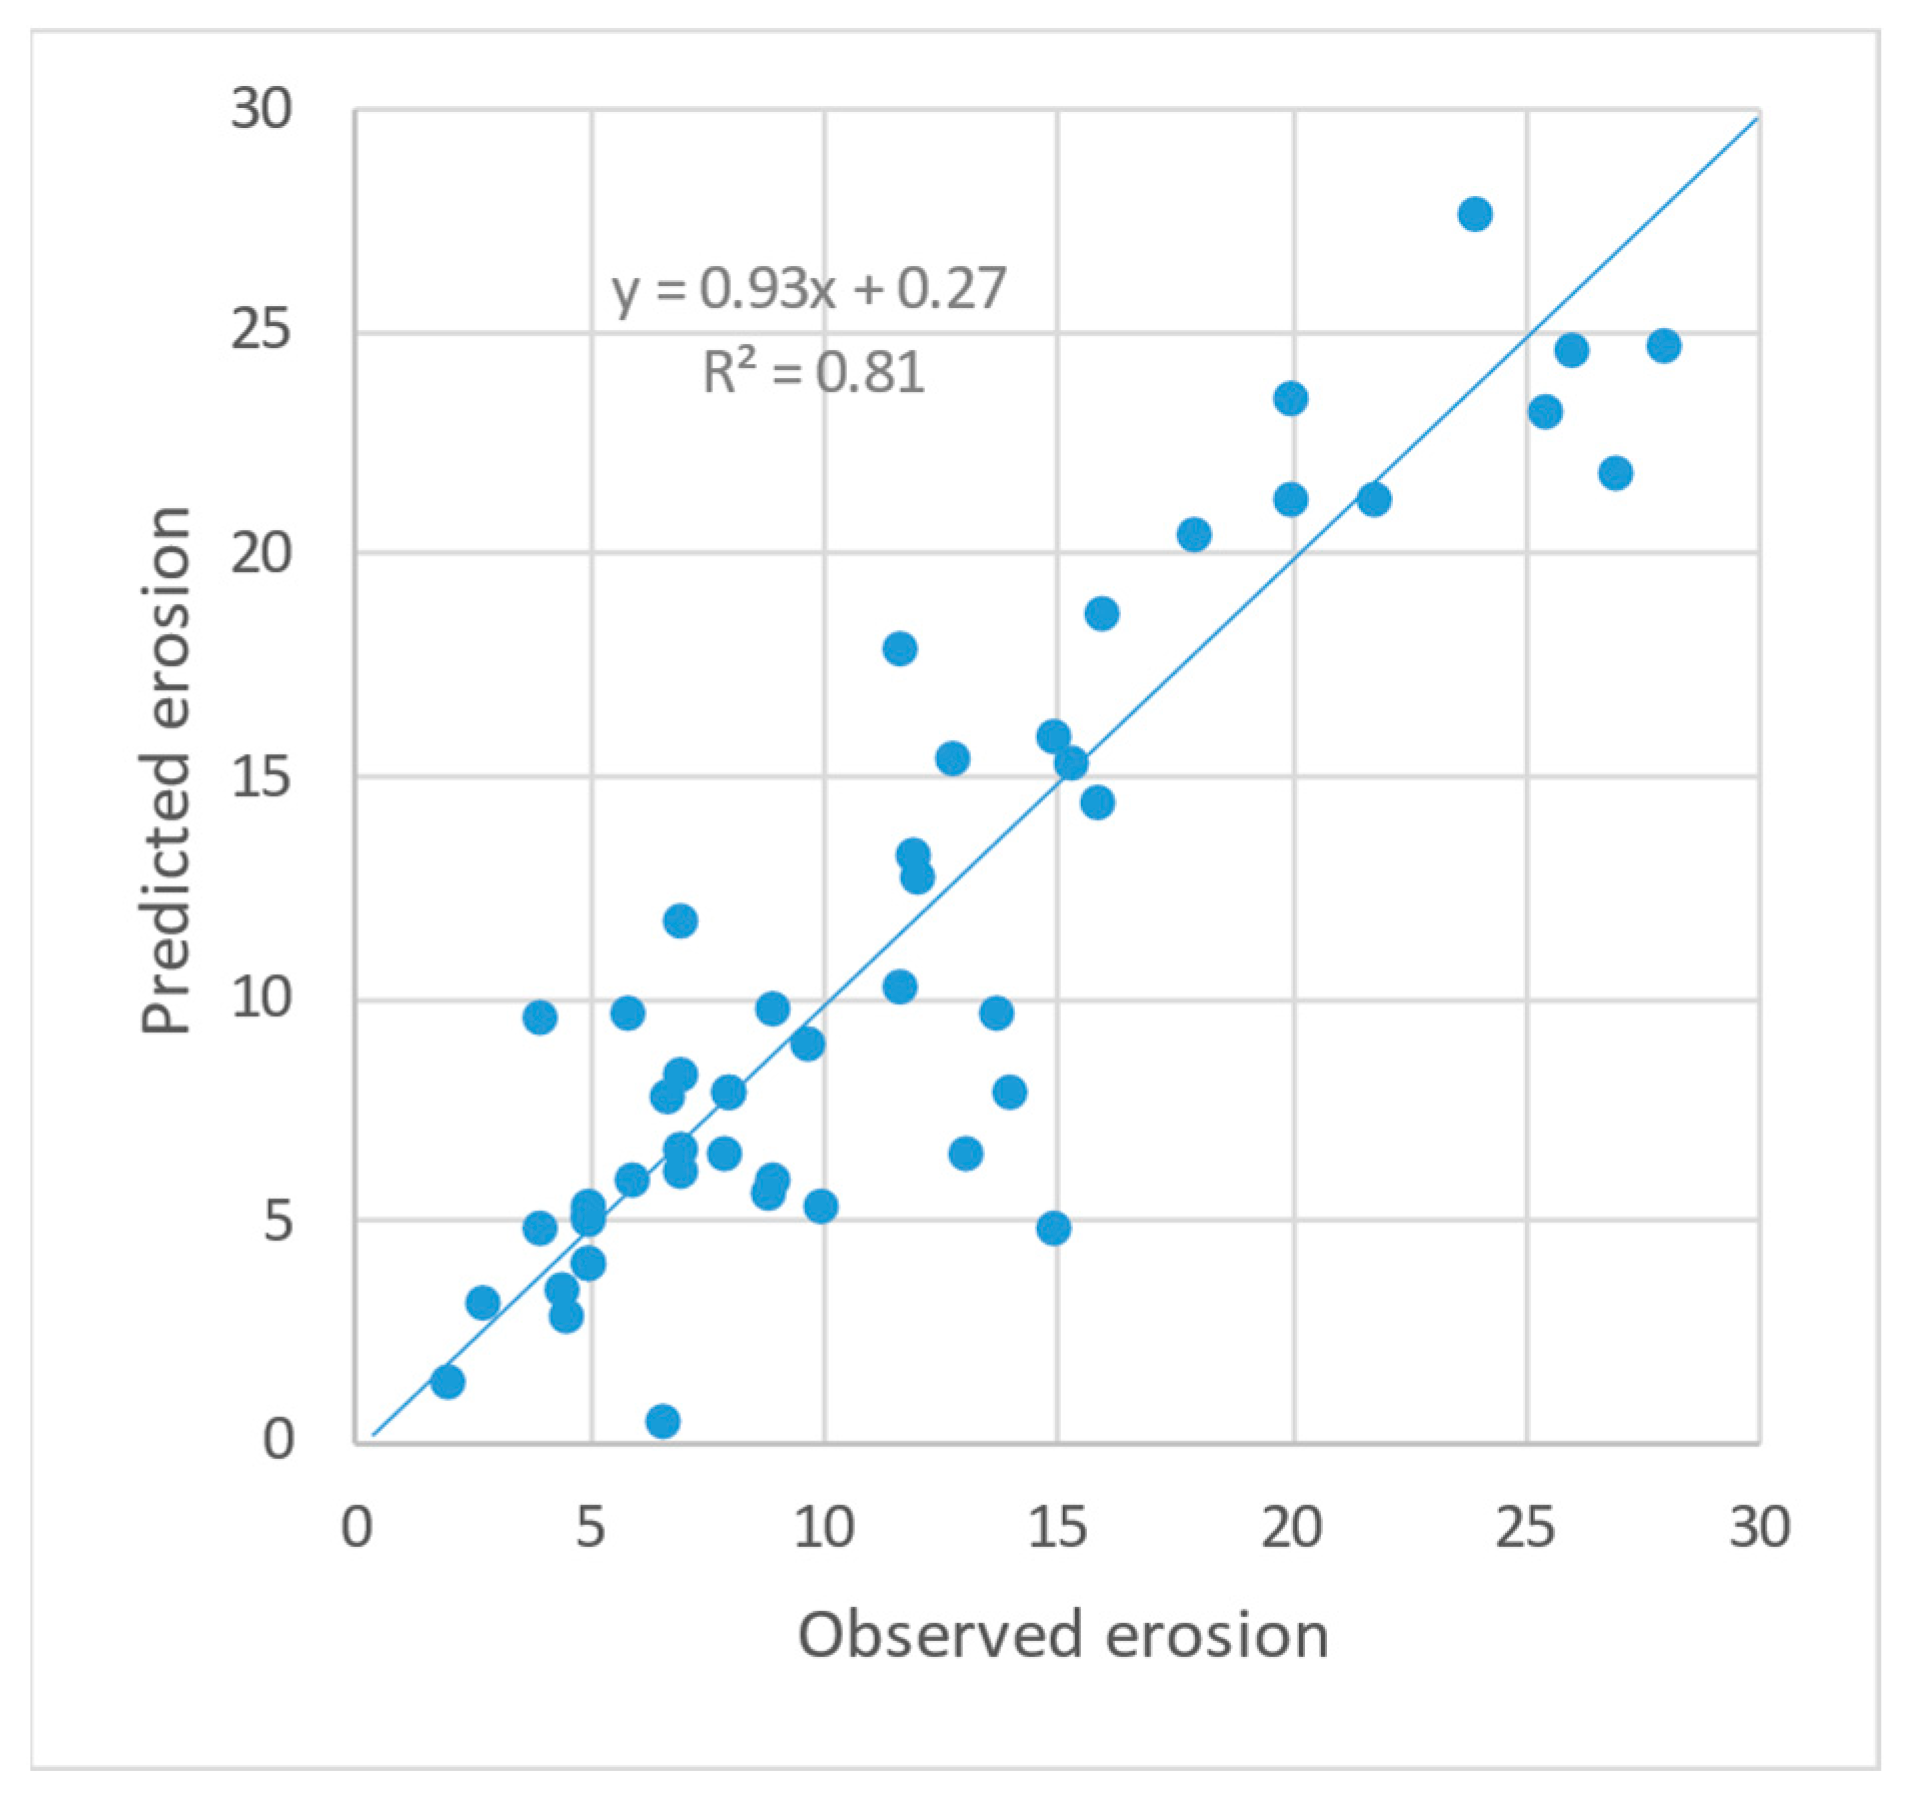
Statistical analysis is a crucial step in evaluating the accuracy and performance of a model.
The relative error, mean squared error, and coefficient of determination metrics are utilized to assess the model’s performance. Relative error serves as a metric to assess the accuracy of a prediction or estimation relative to the actual or expected value. Usually expressed as a percentage, it is calculated by taking the absolute difference between the predicted value and the actual value, dividing it by the actual value, and then multiplying by 100. This measurement provides valuable insights into the level of accuracy in various predictions or estimations, aiding in evaluating the performance of models and methodologies in different fields. The following equation represents the formula of
RE (7):
The quadratic error, also referred to as the mean squared error (MSE), is a widely employed metric that quantifies the average squared disparity between the predicted values and the actual values. By considering both the magnitude and direction of the differences, the MSE offers a means to quantify the overall deviation or error between the forecasted and real values. The following equation represents the formula of
MSE (8):
The coefficient of determination, often represented as R-squared (R
2), is a statistical metric indicating the portion of the variance between the variable being predicted and the variables used for prediction in a regression model. A high R
2 value suggests that the regression model is a good fit for the data and can explain a significant portion of the variance, while a lower value indicates that the model may not adequately account for the variability in the dependent variable. The following Equation (9) represents the formula of R
2:
In summary, the relative error provides a measure of the accuracy of a prediction in terms of percentage deviation, the quadratic error quantifies the overall deviation between predicted and actual values, and the coefficient of determination assesses the goodness of fit of a regression model by expressing the proportion of variability in the dependent variable that can be accounted for by the independent variable(s).
4. Discussion
The dynamics of LULC change and erosion can be both influenced by and contribute to climate change. These interconnected processes underscore the pressing need for the implementation of sustainable land management practices and proactive adaptation strategies. These approaches could effectively alleviate the consequences of climate change on our ecosystems and landscapes, promoting environmental resilience and long-term sustainability.
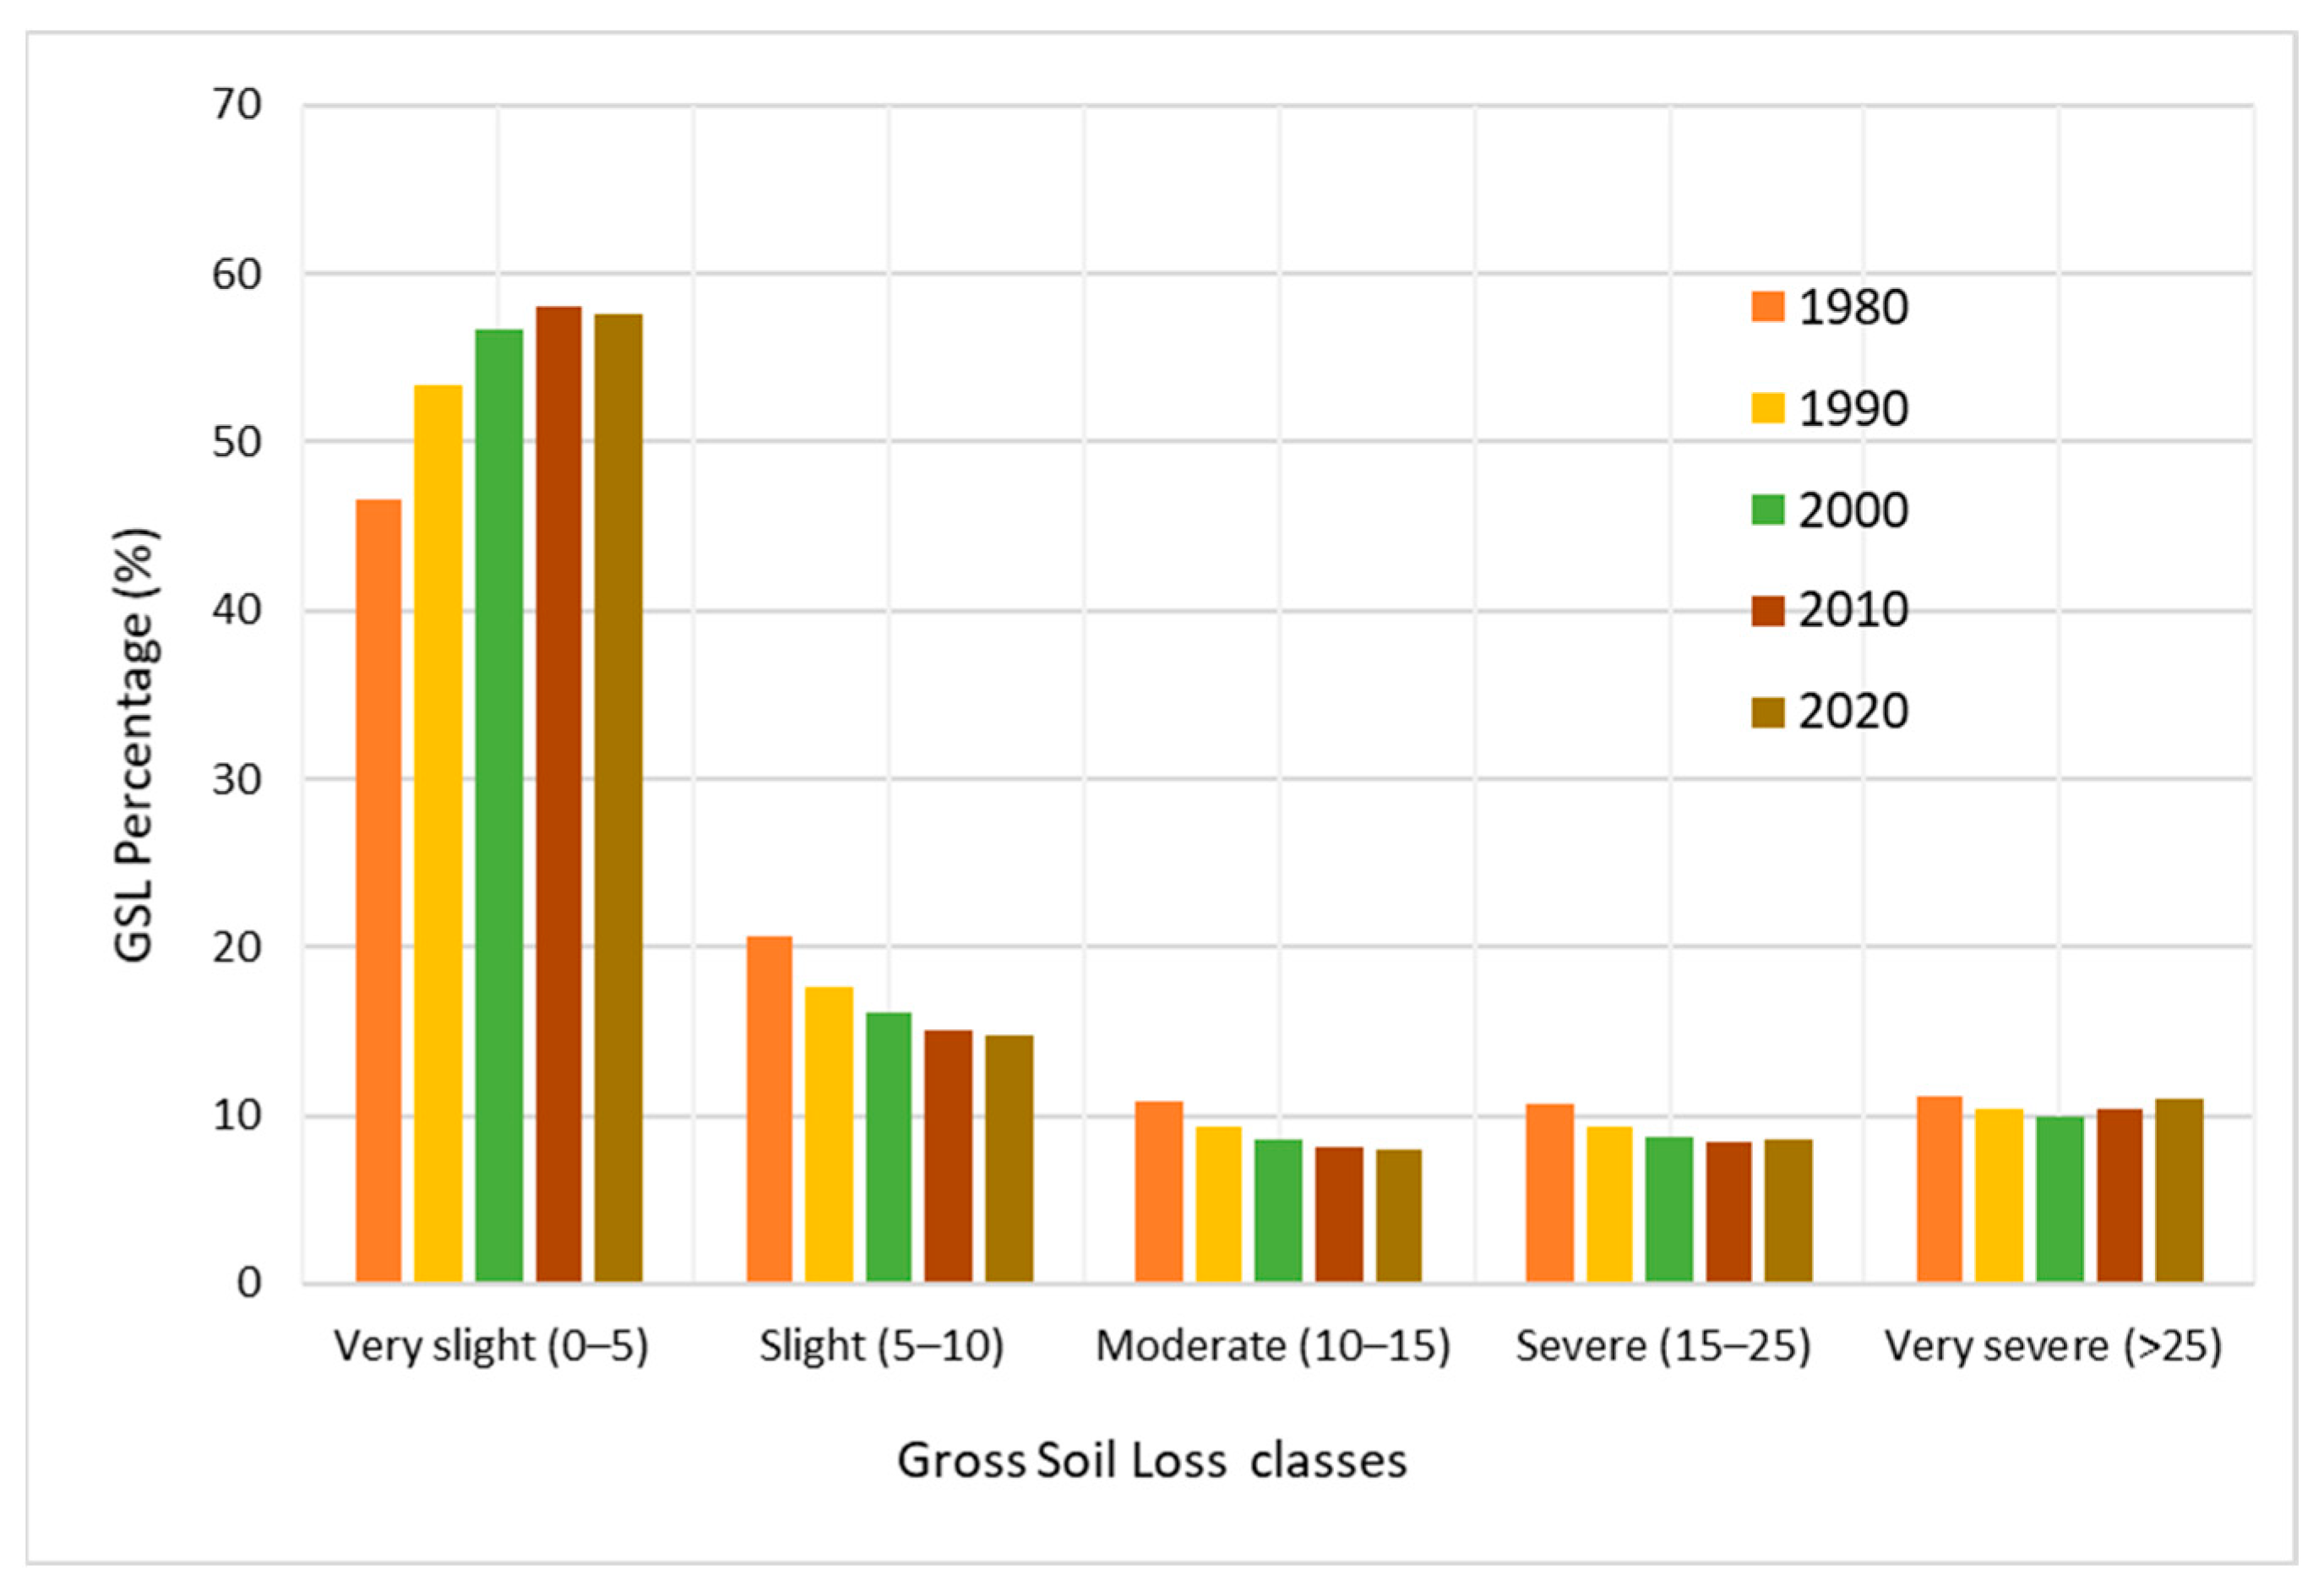
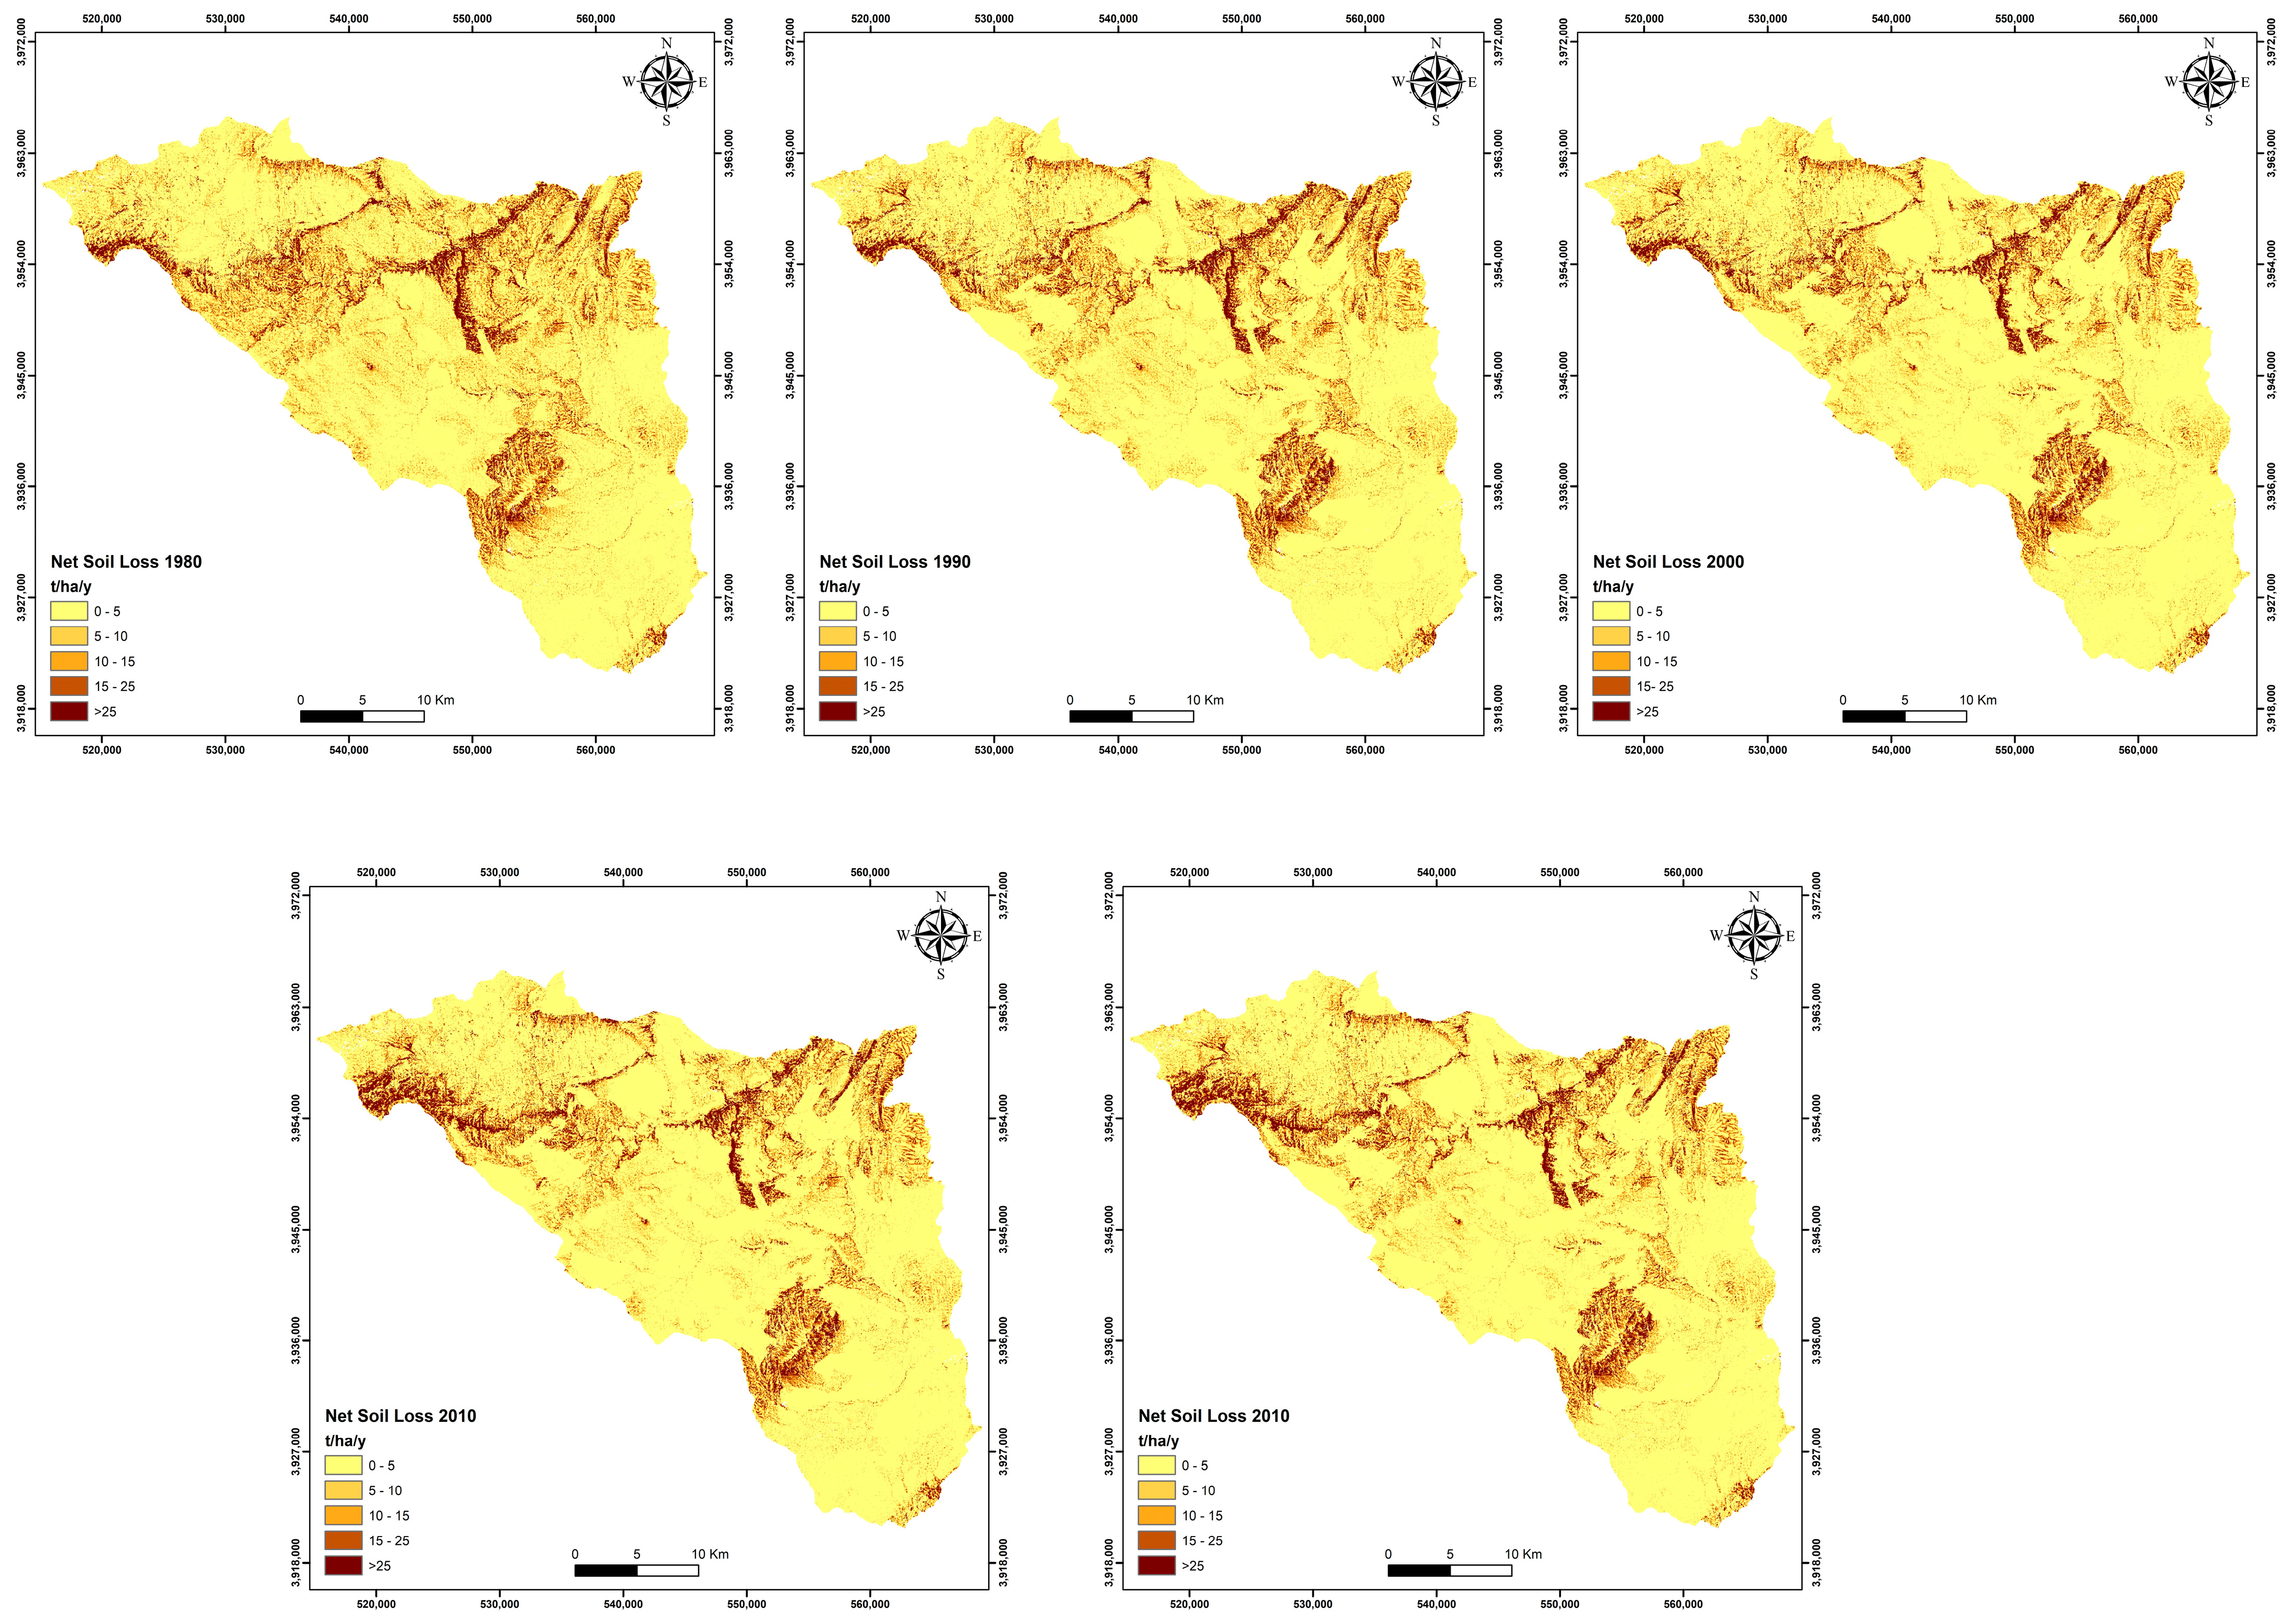
Landscape changes were identified across five specific dates within the timeframe spanning from 1980 to 2020, utilizing the available data. The forest has decreased over the 40-year period from 1980 to 2020 by about 26%, and this class has been encroached by rangeland and cropland. The SWC implementations were increased to reach almost 30% of the watershed surface. The results indicate a trend towards a higher proportion of the very slight erosion intensity class and a decrease in the other erosion classes, except for the very severe class, which remained stable in the study watershed.
This indicates a transition from more pronounced erosion intensity to the subsequent lower level of erosion classification. The regions exhibiting the greatest soil loss were identified in the steepest areas of the studied watershed, aligning with similar patterns observed in other semi-arid regions of Tunisia, like the Rmel watershed [
36,
37]. Furthermore, the calculated soil erosion rate within the study watershed closely aligns with the erosion rate derived from bathymetric data [
36] and various other studies carried out in the same region, such as Khlifi [
37]. These findings indicate that without effective management of current land use and land cover changes, and if the conservation structures’ effectiveness continues to deteriorate, certain implications could arise. Thus, it is probable that soil erosion will persist in the future.
The alteration in soil erosion rates within the study area between 1980 and 2020 was primarily due to the increase in LULC categories vulnerable to erosion (cultivated land and rangeland) and the reduction in vegetation coverage, particularly the forest, which is less susceptible to erosion. However, it seems that SWC implementations reduce the impact of LULC changes. The landscape behavior is more complex and depends on the interaction of all the watershed erosion factors.
Sediment retention pertains to the ecosystem’s ability to regulate and control the quantity of eroded sediment that enters the hydrographic network. Sediment retention quantifies the extent to which the present land use mitigates soil loss in comparison to a scenario with exposed bare soil while accounting for the SDR factor. The combined approach of the RUSLE and the SDR model is employed to assess the sediment retention capacity of individual land parcels, leveraging data on LULC. Consequently, changes in LULC degradation can lead to an increase in soil loss and a decrease in sediment retention. Notably, within the study watershed, it was observed that sediment retention rates surpassed soil loss, a trend commonly observed in semi-arid regions [
38].
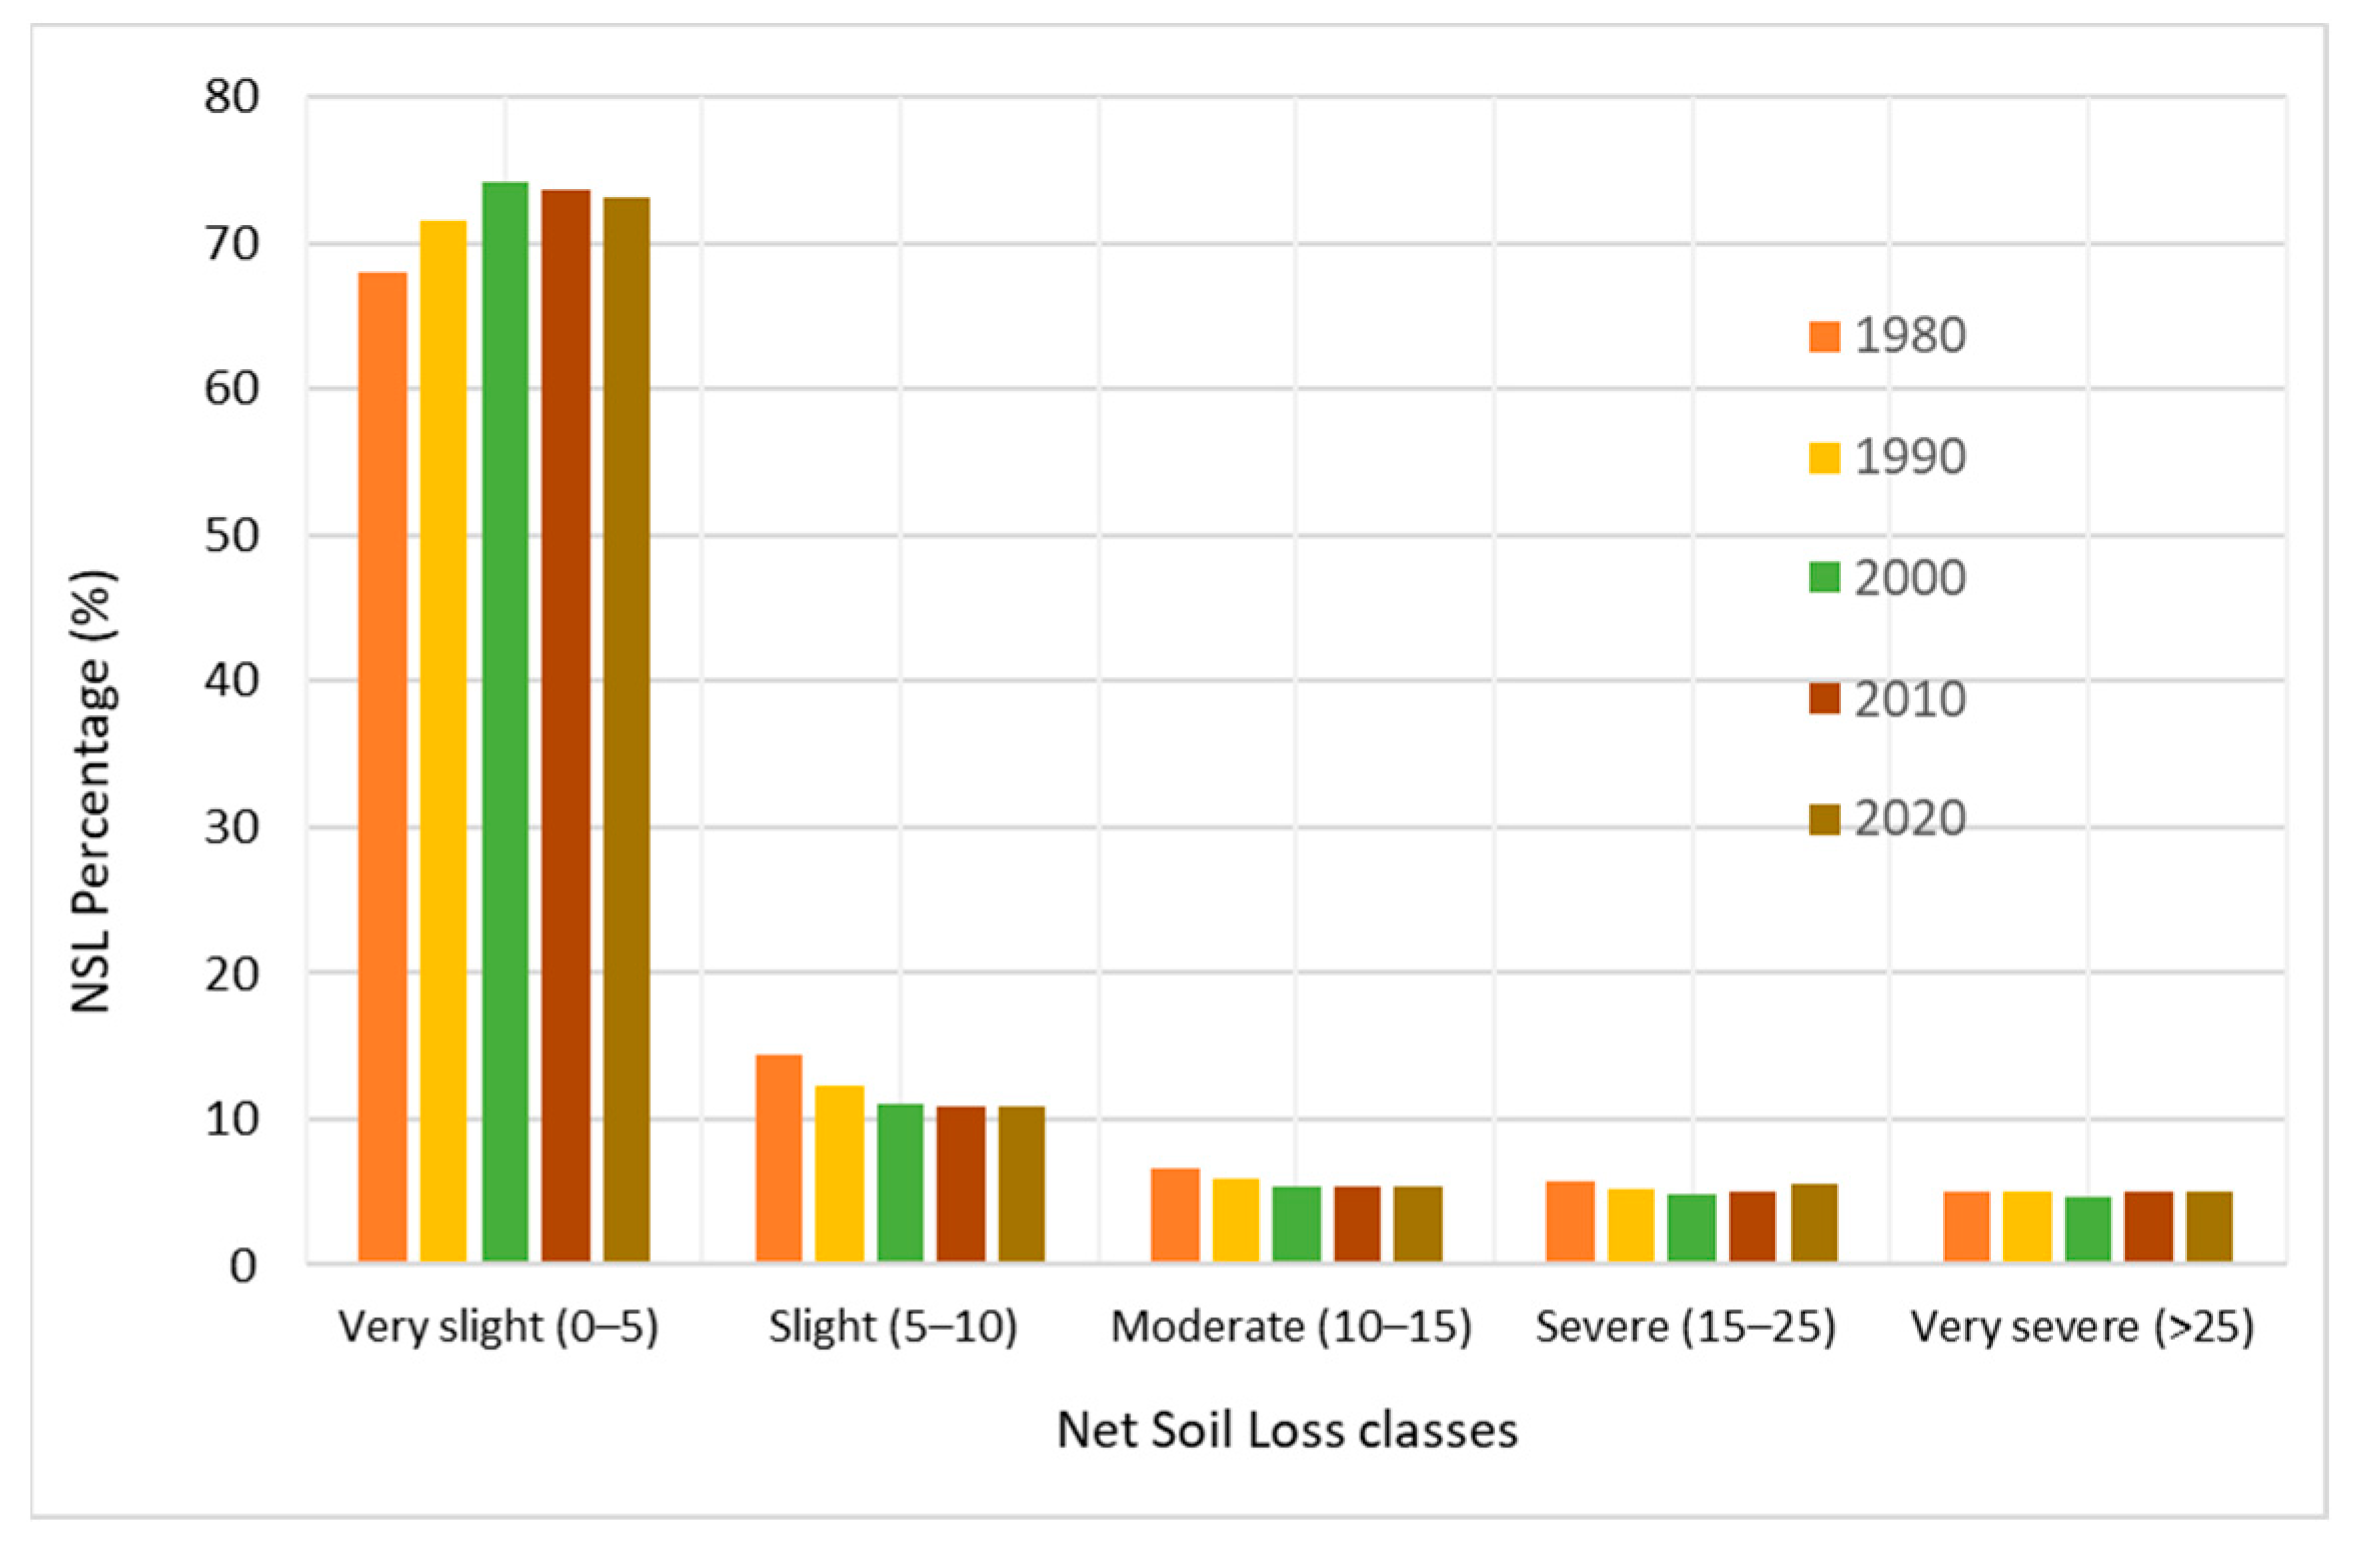
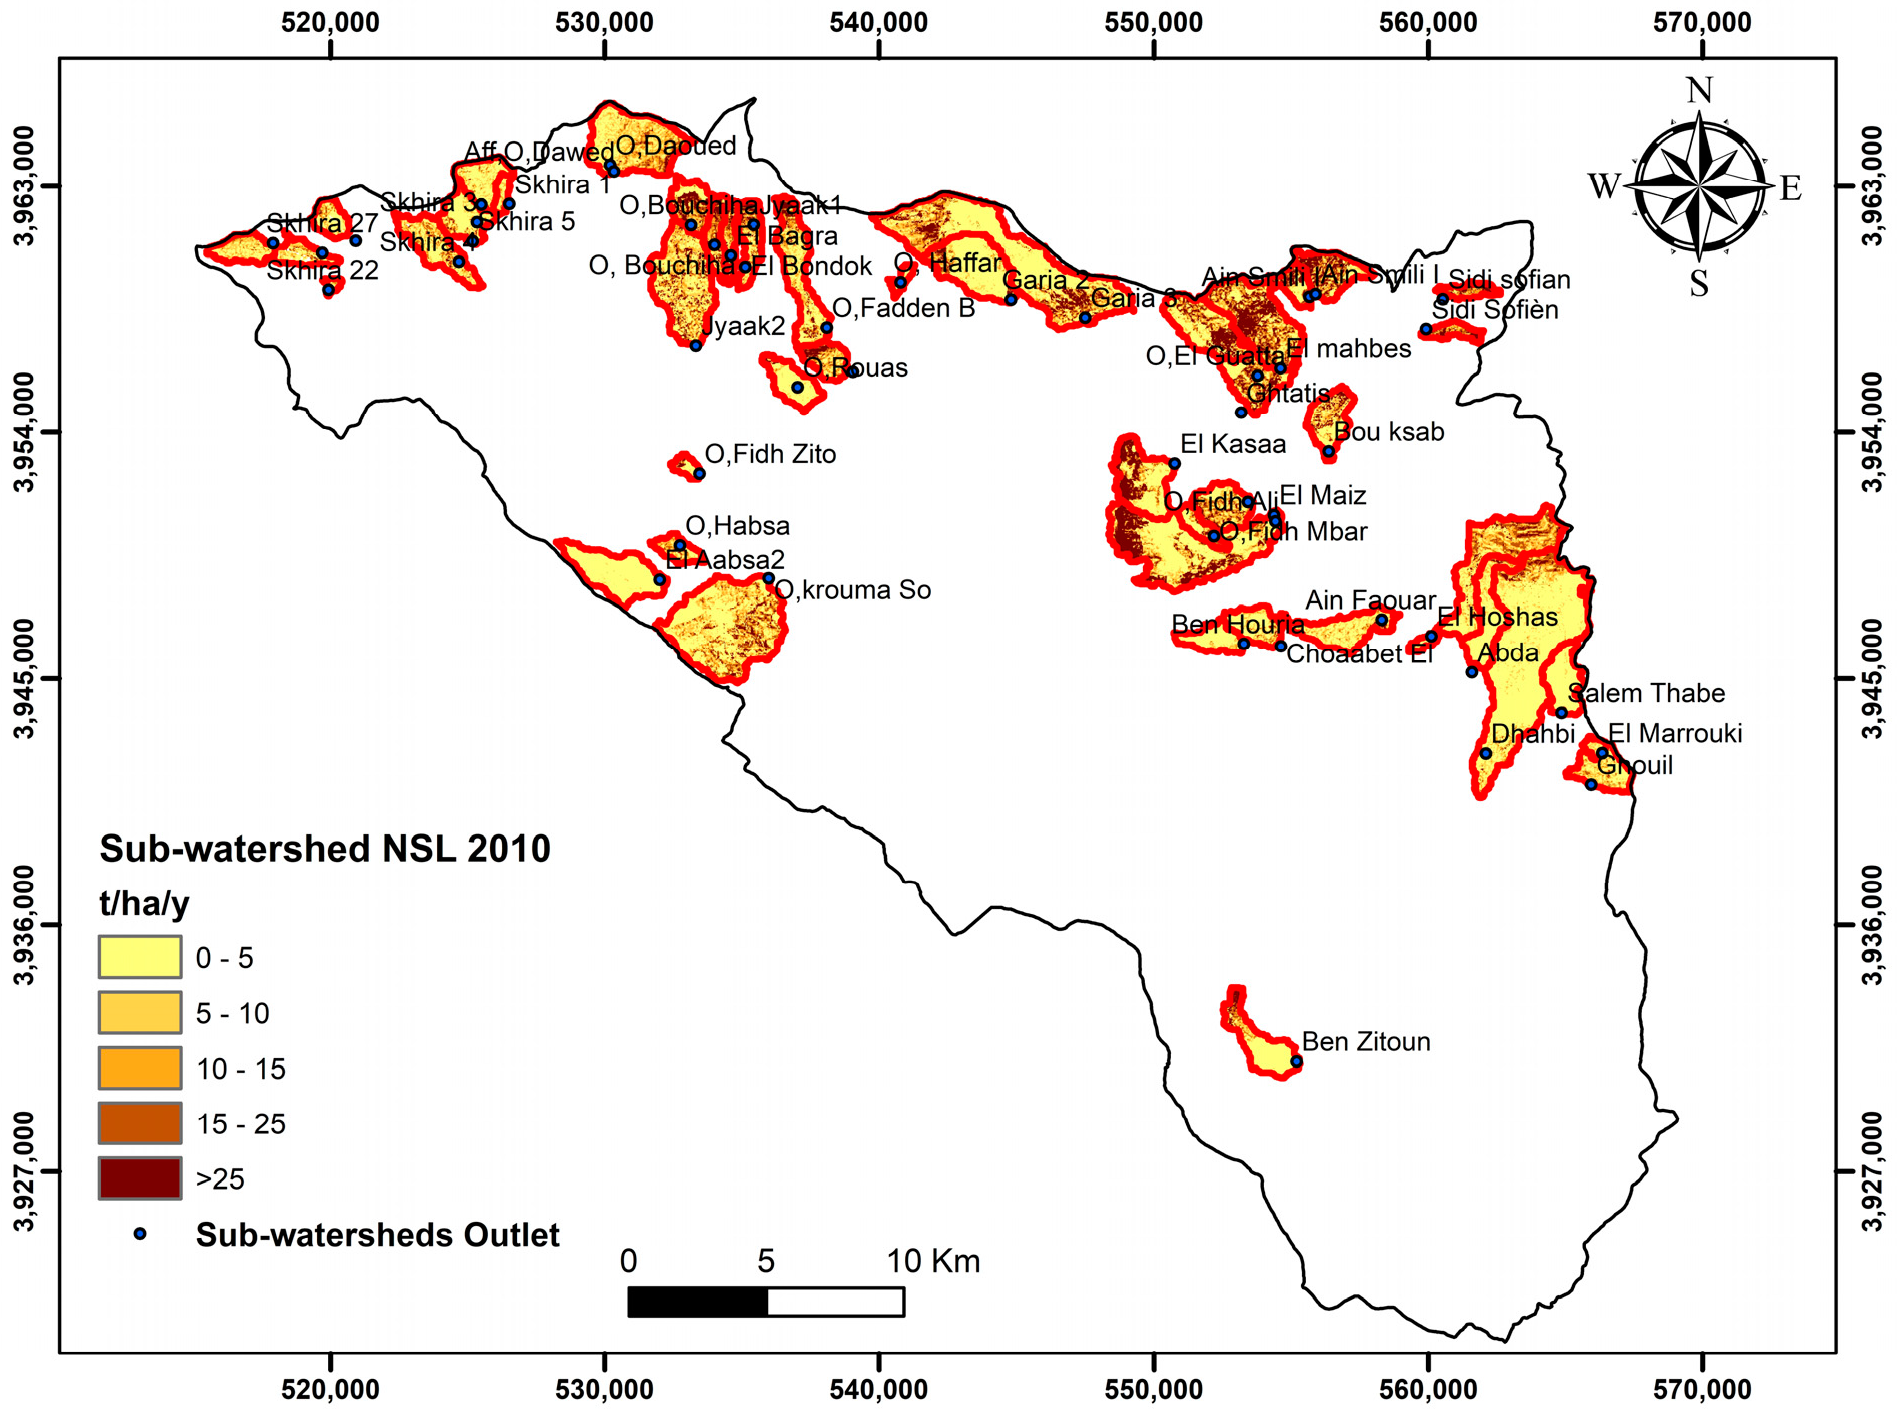
The consequences of the rise in the “very slight” category and the decline in the other categories suggest a shift of regions with substantial sediment yield to a lower sediment yield classification. The areas exhibiting the greatest sediment yield align with the locations characterized by the highest levels of soil erosion and SDR.
Taking these relationships into account, certain areas might exhibit elevated erosion rates yet have a low SDR, indicating that the sediment yield in these areas would not be considerable due to the low SDR. On the other hand, having a higher SDR alone does not necessarily lead to increased NSL unless the GSL rate is also higher.
The average annual sediment yield established through this investigation corresponds to findings from other studies conducted in the semi-arid region of Tunisia. Additionally, the calculated sediment yield aligns with the data that have been recorded. The observed decrease in sediment yield within the study watershed from 1980 to 2020 can be predominantly attributed to the increased adoption of SWC measures within the watershed.
When examining different rates of GSL and NSL intensities, the comparisons revealed that within the “very slight” intensity, the sediment yield exceeded soil erosion. Specifically, the sediment yield was recorded between 59.2% and 47.6%, while the soil erosion measured 75.6%.
As previously discussed, the regions experiencing the most significant soil erosion were located in areas with steep slopes, whereas areas with gentle slopes exhibited the lowest erosion levels. Consequently, the observation of a higher sediment yield in the “very slight” intensity level, as opposed to the soil erosion, is logically consistent. In areas with gentle slopes, deposition tends to exceed erosion, accounting for this phenomenon.
Conversely, the phenomenon of lower sediment yield in regions characterized by a “very severe” erosion intensity, when compared to soil erosion, can be rationalized. This is because, in areas with steep slopes, erosion tends to exceed deposition. Due to its varied environmental consequences, the LULC changes have become a worldwide issue [
39,
40,
41]. The fundamental environmental challenge in Tunisia is rooted in the alterations of LULC, particularly the growth of cultivated land at the expense of forested regions [
42]. The transformations in LULC have additionally influenced the rate of soil erosion and sediment yield, as evidenced by studies [
3,
43,
44,
45,
46]. They are also the primary catalysts that have significantly transformed ecosystem services [
47,
48,
49].
Numerous investigations have been conducted in Tunisia concerning changes in Land Use and Land Cover (LULC) [
21,
42] as well as sediment yield [
2]. Worldwide, there is limited research specifically dedicated to quantifying the impact of LULC changes on soil erosion and sediment yield [
50,
51,
52,
53].
The outcomes of the study align well with prior research conducted in the semi-arid climate of Tunisia. For instance, as demonstrated by Fenta et al. [
54], the expansion of croplands at the cost of natural vegetation has had detrimental effects on the region’s natural resources.
Likewise, Hermassi et al. [
55] highlighted that the intensive plowing and overgrazing aimed at fulfilling the demands of the local population within a specific Tunisian watershed have led to ongoing soil degradation. This degradation encompasses heightened erosion and sediment accumulation in reservoirs. It is important to emphasize that agriculture in Tunisia has experienced substantial transformations since the early 20th century, resulting in a significant erosion crisis.
The spatial analysis conducted in this study unveiled that the expansion of cultivated land onto soils more susceptible to erosion was the predominant factor driving the escalation of soil erosion potential within the watershed throughout the study timeframe (1980–2020).
Gaining insight into the spatial distribution of erosion is crucial for addressing soil loss issues effectively by implementing suitable SWC techniques. In the Merguellil watershed, croplands and rangelands have been equipped with bench terraces since 1990. Despite this, the natural forest coverage continues to decline, steep slopes are being cultivated, and overgrazing persists due to the fast population growth. Implementing optimal agricultural practices and employing effective tillage techniques would prove advantageous in mitigating soil erosion and reducing sediment yield.


