Article

An Investigation of Particle Motion and Energy Dissipation Mechanisms in Soil–Rock Mixtures with Varying Mixing Degrees under Vibratory Compaction

1
School of Road and Bridge Engineering, Hunan Communication Engineering Polytechnic, Changsha 410132, China
2
School of Civil Engineering, Hunan University of Science and Technology, Xiangtan 411201, China
3
Hunan Province Key Laboratory of Geotechnical Engineering Stability Control and Health Monitoring, Hunan University of Science and Technology, Xiangtan 411201, China
*
Author to whom correspondence should be addressed.
Appl. Sci. 2023, 13(20), 11359; https://doi.org/10.3390/app132011359
Submission received: 27 September 2023 / Revised: 11 October 2023 / Accepted: 14 October 2023 / Published: 16 October 2023

Abstract

:
Soil–rock mixture (S–RM) is a heterogeneous granular material commonly used in engineering applications, but achieving uniform particle mixing is challenging. This study investigated the effect of mixing homogeneity on the compaction of S–RM using the discrete element method (DEM). Specimens with varying degrees of mixing were modeled under realistic vibration loading. The results showed that a higher degree of mixing resulted in a smaller void ratio after compaction. The analysis of particle motion and energy dissipation revealed that not all particle motion during vibration compaction was aligned with the direction of the particle system. However, rotation was more prevalent and contributed to densification. Dashpot energy dissipation did not solely promote changes in the void ratio, while slip energy dissipation did lead to changes in the void ratio, but not entirely towards compaction. Rolling slip energy dissipation primarily occurred during the stage of void ratio changes and significantly promoted compaction. The change in strain energy aligned with the trend of the void ratio but did not directly contribute to its promotion.

1. Introduction

Soil–rock mixture (S–RM) is a heterogeneous geotechnical material composed of coarse particles such as rock, gravel, and sand, and fine particles such as sand, clay, and silt. It is typically formed by seismic, collapse, landslide, and other actions during the Quaternary Period, and distributed in loose accumulations on steep slopes or beside ditches [1,2,3,4]. For instance, the 2008 Wenchuan earthquake in China triggered numerous landslides and debris flows in the subsequent years due to secondary factors like aftershocks and heavy rainfall. This led to widespread S–RM slopes in the mountainous regions of southwestern China [5,6]. S–RM formed by similar causes is also common in other areas [7,8].
S–RM offers numerous advantages, including its high strength, compactness, permeability, erosion resistance, and ability to utilize local materials [9]. Consequently, it is extensively utilized as a filler in subgrade engineering projects [10]. However, S–RM is a granular material that presents challenges in achieving a uniform mixing of particles with varying sizes, shapes, and material properties. Non-uniform mixing is a common occurrence in both natural and construction processes. For instance, during road construction, the coarse aggregates in S–RM tend to settle downwards due to their higher potential energy, resulting in layers with varying degrees of mixing [11,12].
The mixing degree is a measure of the heterogeneity of particle mixtures [13]. Current definitions primarily originate from the chemical, agricultural, construction, and medical fields, where they guide industrial production and quality evaluation. However, mixing degree indices are infrequently utilized in geotechnical engineering [14]. Previous research has demonstrated the significant influence of mixing degree on the local and global properties of granular materials [15]. However, limited studies have investigated its effect on the vibratory compaction of S–RM as a subgrade filler and the resulting negative effects on long-term road performance.
Subgrade compaction involves the consolidation of soils through mechanical methods such as static pressure, dynamic compaction, or vibration compaction [16]. These methods apply external energy to the soil, causing particle movements and rearrangements. Energy is transformed and dissipated during this process, specifically in terms of particle potential energy. The compaction process is fundamentally driven by particle movements and the resulting energy conversions under loading conditions. Thus, conducting statistical analyses on particle motions and energy consumption during compaction can offer a more comprehensive understanding of the compaction mechanism of S–RM (specific road material) under vibration loads, in comparison to macro-scale observations.
This paper employed numerical simulations using the discrete element method (DEM) to investigate the vibratory compaction process of S–RM with different degrees of mixing homogeneity. This study analyzed the relationships between changes in void ratio and particle movements, as well as energy dissipation during compaction. Furthermore, the effects of various vibration parameters on energy dissipation paths were examined. The findings will contribute to a deeper understanding of the vibration compaction mechanism for S–RM as a subgrade filler. This knowledge can serve as a more rational basis for selecting fillers, ensuring the quality and bearing capacity of compacted subgrades, and conducting stability assessments.

2. Discrete Element Modeling and Energy Consumption Calculation

2.1. Discrete Element Modeling of Soil–Rock Mixtures

The Particle Flow Code 3D (PFC3D) software was employed for the numerical simulations conducted in this study. The S–RM specimens used had a fixed coarse particle content of 50%. The mixing degree index (I) values, ranging from 0.0 to 1.0, were determined using the formulation proposed by Liu et al. [17]. The brief calculation principle is as follows:
The curves in Figure 1 represent the variation of coarse and fine aggregate content Vf with the normalized depth H/HB (HB is the height of the mixture) for different particle mixes, where the Arbitrary Line (black) is the arbitrary mix curve, and the Separation Line (blue) and the Uniform mixing Line (red) are the complete segregation curve and the uniform distribution curve, respectively. When the Arbitrary Line and the Uniform mixing Line do not coincide exactly, the total area As (shaded in Figure 1) enclosed by the two curves represents the degree of coarse aggregate segregation in the graded aggregates. The area bounded by the Separation Line, the Uniform mixing Line, and Lines AB and CD is the area of complete segregation (as shown in areas Ai and Aii). The mixing degree index (I) in this paper was calculated using Equation (1):
I = 1   -   A s A i + A ii
Figure 2 illustrates the I value versus the depth of the curves for the six groups of specimens. In the figure, H represents the height from the bottom of the specimen, while HW denotes the total height. The specimens had dimensions of 800 mm × 800 mm × 600 mm and were enclosed by five rigid walls.
The sample preparation process is as follows:
(1) Divide the specimen height into 10 equal layers. Generate specific numbers of coarse and fine particles in each layer based on the initial void ratio target of 0.7 and relative coarse/fine particle proportions in Figure 2.
(2) Reset the interparticle contact forces and velocities every 5 cycles until 20,000 cycles to eliminate excessive contacts.
(3) Allow the particles to settle under gravity to produce the initial specimen. The final I values match the targets.
The top of the specimen was equipped with an 800 mm × 800 mm × 2 mm loading plate, which contains a cluster composed of 6241 sub-spheres with a radius of 1 mm. The resulting model is depicted in Figure 2. To simulate the vibrations induced by field vibratory rollers, an excitation force was applied to the plate. This force followed a cosine wave pattern, and matched the magnitude and frequency of the field vibration compaction, as described by Equation (2):
F = F 0 ( cos ( 2 π f Δ t ) + 1 )
where F presents the excitation force; F0 = 500 kN; f is the loading frequency; and Δt is the loading time. Given the focus of this study on particle motions and energy dissipation, important parameters included dashpot coefficients, sliding friction, and rolling friction. The contact stiffness and other relevant parameters were directly derived from triaxial model verifications and incorporated into the analysis [18].
Linear contact models were employed for particle interactions. Research indicates that both linear and nonlinear Hertz models can effectively represent the behaviors of granular materials [19]. The normal stiffness of a particle, kn, is expressed in Equation (3):
k n = π E c r / r 1 + r 2
where Ec is the particle effective modulus; r1 and r2 are the contacting particle radii; and r is the smaller radius. In this study, the effective contact modulus of soil particles Ecb is 1.24 × 10⁸ Pa, and the effective contact modulus of loaded plate particles Ecl is 3.31 × 10⁹ Pa. Tangential stiffness ks used a normal-to-tangential stiffness ratio k* = kn/ks between 1.0 and 1.5 for realistic materials [20,21]. Here k* = 4.0/3.0 was applied. Density was set as 2650 kg/m3, similar to actual granular geo-materials.
Dashpot was utilized to dissipate energy within the particle assembly during preparation and loading processes. Common forms of dashpot include local dashpot, which directly decreases particle velocities, and viscous dashpot, which introduces contact dashpot forces. The local dashpot coefficient, Dp, regulates the unbalanced forces, as demonstrated in Equation (4):
F i d = D p F i d sign v i
where Dp is the local dashpot coefficient; sign is the sign function; and vi (i = 1–6) is the linear and angular velocities. Viscous dashpot introduces normal and tangential contact dashpot forces, as shown in Equation (5):
F j d = 2 β j m ¯ k j δ ˙ j
where j = n, and s represents the normal and tangential directions of particle contact, respectively; βn = βs = 0.7; and m ¯ is the equivalent value of contacting particle mass (m1 and m2), m ¯ = m1m2/(m1+m2). The contact between particles follows Coulomb’s law of friction, that is fsμbfn, where fn and fs are normal and tangential contact forces. The static friction coefficient μb = 0.6. Particle shapes were incorporated via a rolling resistance model giving rotational moments, as shown in Equation (6):
M μ r R ¯ f n
where μr = 0.25 is the rolling friction and R ¯ is the effective particle radius. Key meso-parameters are listed in Table 1. Coarse to fine particle diameter ratio dc/df was 5.0. Previous studies have indicated that mechanical behavior remains relatively unchanged when the ratio exceeds 4.44, which corresponds to the situation where fine particles fill the voids between coarse particles [17,22]. Therefore, variations in particle size scales did not significantly influence the objectives of the current research.

2.2. Energy Consumption Calculation

Energy consumption values are aggregated based on PFC principles. The reliability of these values is confirmed through experiments conducted on vibrating powder beds, with simulations aligning with the experimental results [23,24]. The formulations used are as follows:
(1) Sliding strain energy Est:
Sliding strain energy (Est) is the energy resulting from the elastic forces between contact points and stored within the system as potential energy. The formula for computing the sliding strain energy (Esst) is:
E sst = i = 1 k 1 2 f n , i 2 k n + f s , i 2 k s | t
where fn,i and fs,i are the normal and tangential contact forces of the i-th contact; and t is the real time.
(2) Slip energy Eμ:
E μ = i = 1 k 1 2 f s , i 0 + f s , i Δ δ s , i μ | t
where fs,i is the tangential force of the i-th contact at the time t; and Δδsu is the relative tangential displacement increment Δδs in the sliding direction.
(3) Dashpot energy Eβ:
Dashpot energy (Eβ) denotes the overall energy dissipated by the damper, and its formula for calculation is as follows:
E β = F d δ ˙ Δ t
δ ˙ = x ˙ c i x ˙ c j
x ˙ c i = x ˙ i + ω i × ( x c x i )
where δ ˙ is the relative velocity of particles; x ˙ c i and x ˙ c j are the velocities of the two particles at the contact point c, respectively; x ˙ i and ω i are the velocity and angular velocity of the i-th particle, respectively; x c and x i are the positions of contact point c and the center of gravity of the particle i, respectively.
(4) Rolling strain energy Erst:
Rolling strain energy (Erst) signifies the energy generated from particle contact and accumulated within the rolling spring. The formula for calculating this energy is as follows:
E rst = 1 2 M r 2 k r
(5) Rolling slip energy Eμr:
Rolling slip energy (Eμr) pertains to the energy dissipation resulting from the occurrence of rolling slip between particles. The formula for calculating this energy is as follows:
E μ r = 1 2 M r 0 + M r Δ θ μ r
where Δθμr is the increment component bending Δθ in the sliding direction.
(6) Normal elastic work Wn:
W n = t = 1 t m = 1 k f fn , ij | t + Δ t p n , i | t + Δ t p n , i | t + f fn , ji | t + Δ t p n , j t + Δ t p n , j | t
where ffn,ij|tt represents the normal elastic force generated on the surface of particle i due to the contact between particle i and particle j at t+∆t; pn,i|t represents the position of the i particle at time t; and other symbols are similar.
(7) Tangential elastic work Wt:
The amount of tangential elastic work due to friction is:
W s = t = 1 t m = 1 k f fs , ij | t + Δ t δ si + f fs , ji | t + Δ t δ sj
where ffs,ij represents the tangential friction force generated on the surface of particle i; δsi represents the overall movement of the contact point on the surface of particle i due to sliding and rotation within time ∆t. Since Ws includes sliding friction work, the magnitude from tangential springs is:
W t = W s E μ

3. Compaction Effect Analysis

3.1. Void Ratio Variation

During the vibratory compaction simulations, the settlement of the load plate and the void ratio were continuously monitored. Data were recorded at intervals of 1/8 cycle. The plate displacement increments between cycles were compared, and loading was terminated when the ratio fell below 0.1% for ten consecutive cycles, indicating volume stability.
Figure 3 illustrates the settlement of the load plate over time for different samples with varying degrees of particle mixing. The results demonstrated that the sedimentation of the particle system can be divided into two main stages: a rapid change phase and a stable phase. In the initial period (t < 25T), the sedimentation of the granular system experienced a significant increase, accompanied by a sharp decrease in the void ratio. Subsequently (t > 25T), the sedimentation and the void ratio of the particle system tended to stabilize, reaching a state of relative constancy.
Figure 4 presents the variations in void ratios and final values of the samples with different mixing degrees. The findings demonstrated that the uniformity of particle mixing had a substantial influence on densification under identical vibration loads. Specifically, the settlement decreased as the mixing degree increased for the same number of load cycles. Similarly, both the change in void ratio (∆e) and the final value (ef) decreased monotonically as the homogeneity of mixing improved.

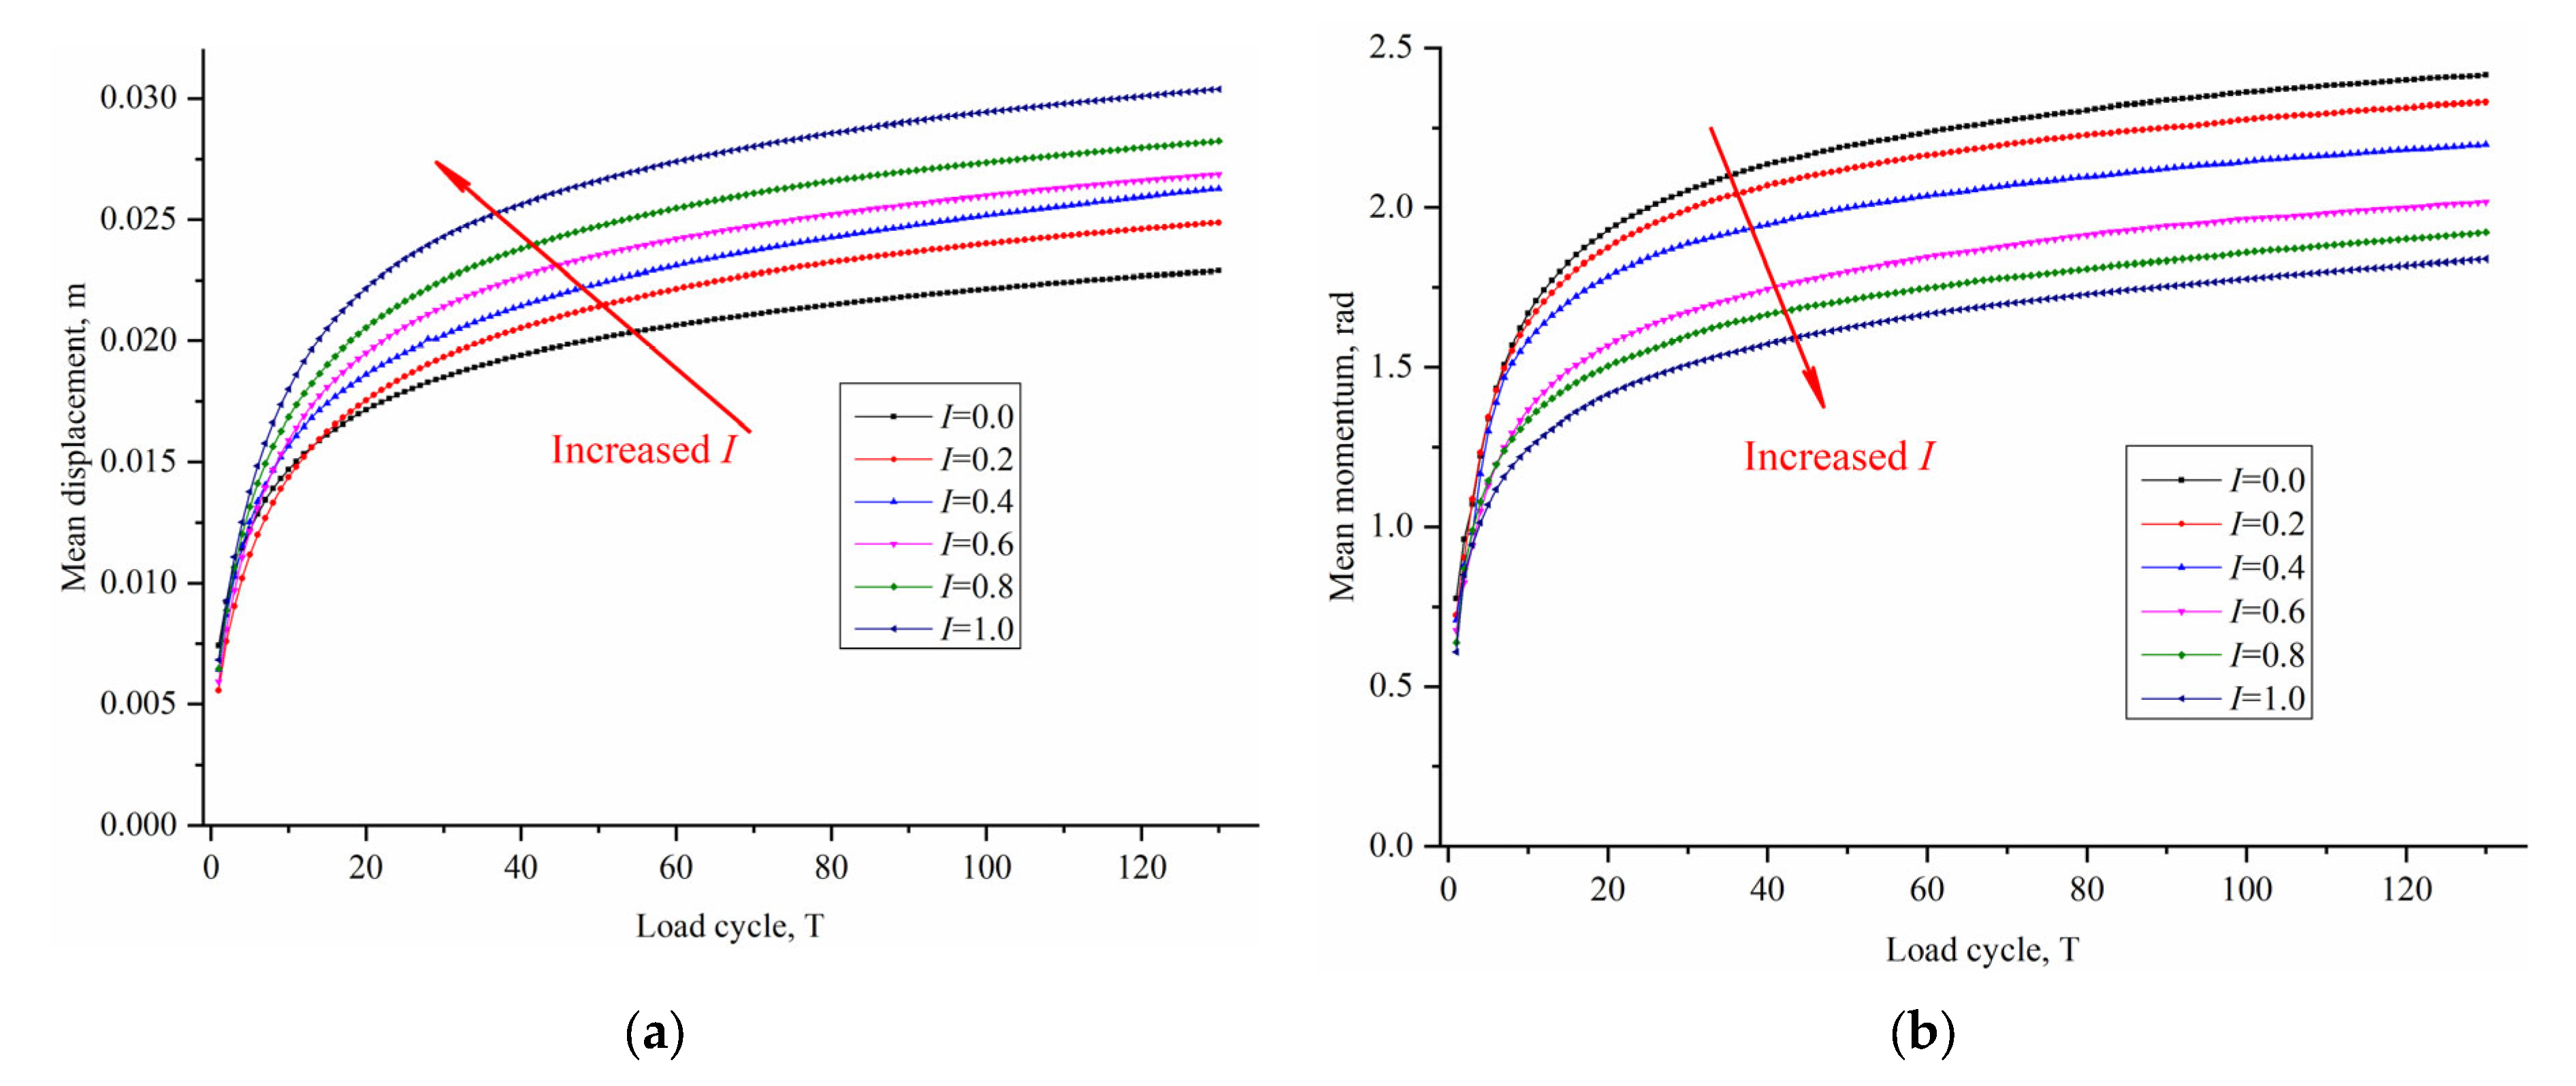
3.2. Particle Motion Statistics and Analysis

Compaction primarily involves the rearrangement of particles as they approach each other and smaller particles enter the voids of larger particles through motion [25,26]. The primary particle movements associated with deformation are sliding and rotation [27,28]. Here, the particle displacement and rotation angle represent sliding and rotation amounts, respectively.
Figure 5 illustrates the average particle displacement and rotation angle as a function of load cycles for different mixing degrees. In terms of the duration of loading, both metrics gradually increased over time and closely aligned with the settlement trend shown in Figure 3. During the rapid densification phase (t < 25T), significant increases occurred, indicating substantial particle movements. As stabilization began (t > 25T), the values plateaued, reflecting the stabilization of particle movements.
In terms of the effects of mixing degree, displacements and rotations did not exhibit clear trends during the early stages of loading (t < 10T), but divergence became apparent at the later stages (t > 10T). However, while the final void ratios systematically decreased with higher mixing degrees, displacements monotonically increased while rotations decreased. This suggested that particle movements during compaction did not necessarily promote densification. It is likely that more particles undergo reciprocal or even upward displacements, while rotations are biased towards compaction to achieve greater homogeneity.

3.3. Compactability Characterization

The previous sections have provided qualitative insights into the relationship between particle movement and compaction when considering mixing degrees. However, the strength of the correlation could not be adequately described. To address this, particle self-diffusion coefficients were introduced to quantify the association between displacements, system compactness, and mixing homogeneity.
On a microscopic level, particle rearrangements, approaching, and void-filling are a result of random motions induced by external excitation. Loading leads to random velocity fluctuations, similar to molecular thermal diffusion or eddy diffusion in turbulence. These fluctuations in velocity result in a non-uniform distribution of force chains and the continuous formation and breakage of contacts, prompting rearrangements and void filling. This particle diffusion process under vibration signifies a key mechanism of compaction.
Similar to the thermal velocities of gas molecules, the average squared magnitude of particle velocities is referred to as “granular temperature”. Campbell et al. [29] computed the self-diffusion coefficient D by analyzing the growth rate of displacement variance over time, using the following formula:
D = s ( t ) s ( 0 ) 2 2 t
where t is elapsed time; and s(t) and s(0) are particle displacements at times t and 0, respectively. In this study, t = 130T was used.
Figure 6 illustrates the values of D for different mixing degrees. A consistent decrease was observed with improved homogeneity, closely aligning with the void ratio trends shown in Figure 4. This indicated that the particle diffusion ability, which represented the range of single particle motion, decreased, and compactibility was reduced at higher mixing degrees.

4. Particle Energy Dissipation Mechanism

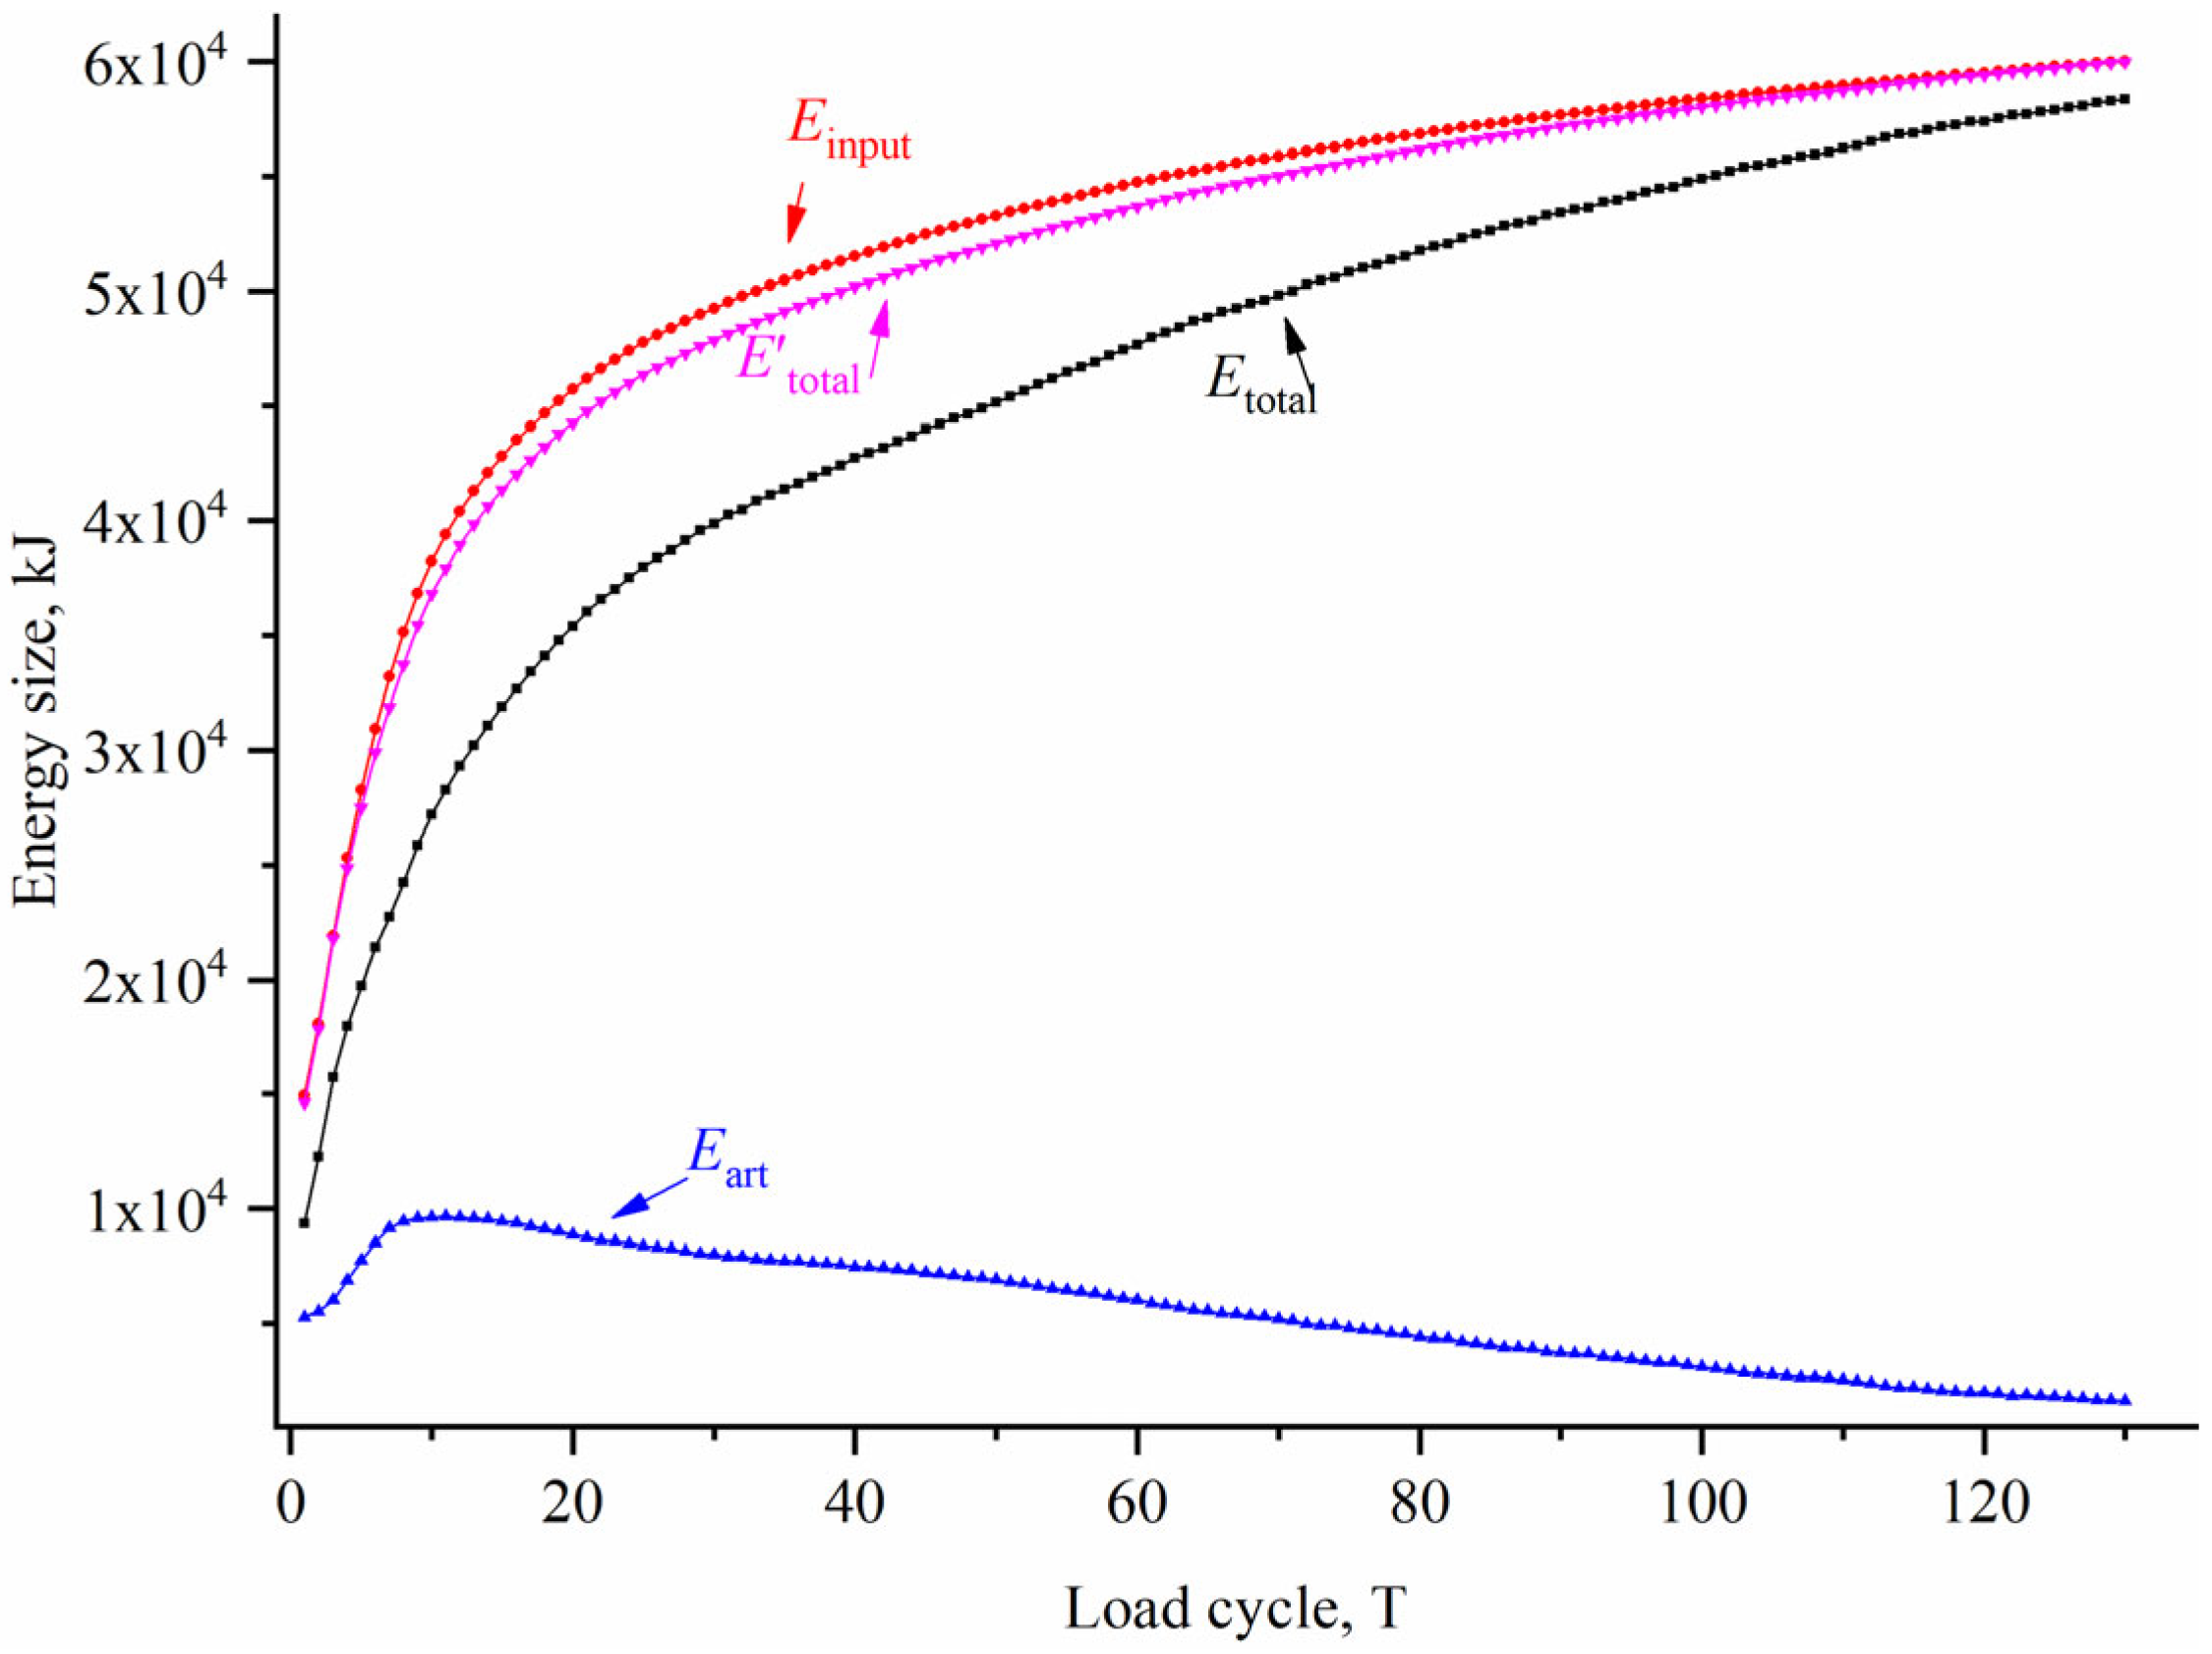
4.1. Verification of Energy Dissipation in Particle Systems

According to the law of conservation of energy, the energy input into the particle system (Einput) during vibratory compaction should equal the total energy dissipated (Etotal) within the system. This principle has been verified in cyclic shear testing simulations by Christina et al. [30]. Etotal comprises dashpot energy, slip energy, rolling slip energy, and strain energy (sliding and rolling). With the periodic cosine excitation on the load plate, Einput is calculated from the force–displacement curve:
E input = i = 1 T S Ti = i = 1 T ε O ε A F d ε
where T is the number of load cycles; F is the force magnitude; ε0 is the displacement at the start of the cycle; and εA is the maximum displacement in the cycle.
Studies by Asmar et al. [31] on input and dissipated energy relationships showed the calculated Etotal was always less than the actual Einput. This is because some energy (Eart) is neglected by artificial definitions, mainly normal and tangential elastic work, Wn and Wt, in Equations (15) and (16).
By introducing a correction and defining the total dissipated energy as Etotal = Etotal + Eart, the comparison is presented in Figure 7. It was observed that Etotal closely matched Einput, confirming the dissipation calculations by PFC criteria appropriately represent the compaction mechanism energy pathways. This monitoring approach enhanced insights into meso-scale particle interactions and enabled a better understanding of macro-scale responses. However, it is crucial to verify that the calculated meso-scale energy dissipations correspond to the physical and mechanical behaviors observed at the macro-scale, as this is critical for mechanism analysis.
Figure 8 presents the cumulative input energy over load cycles for different mixing degrees. The increments of input energy decreased over time but experienced a significant rise before t < 25T, during periods of rapid void ratio changes. Afterward, the increments slowly increased. This can be attributed to the easier structural adjustments and greater efficiency of dissipation in the initial looser states. As densification proceeded, the presence of more compact and uniform particle contacts reduced sliding contacts and tangential creep, resulting in a severe limitation of energy dissipation and input [32,33]. The consistency observed with the void ratio–time patterns in Figure 3 supports the notion that energy input leads to void ratio reductions.
Figure 9 further displays the aligned energy input and void ratio trends over mixing degrees. Their monotonic decline with improving homogeneity visually confirms void ratio changes had direct correspondence to particle system energy input and thus total dissipation. Therefore, analyzing the compaction mechanism via energy dissipation pathways is reasonable.

4.2. Analysis of Energy Dissipation Path and Its Proportion

Different modes of energy dissipation play distinct roles in the changes in void ratio during vibratory compaction. Moreover, their relative contributions to the total dissipated energy will evolve as void ratio variations occur. Figure 10 illustrates the ratio of each dissipation component to the total energy over load cycles. As specific dissipation values exhibit considerable randomness within individual cycles, average trendlines over 10-cycle intervals were presented to showcase clearer tendencies over time.
Figure 10a shows dashpot energy accounting for 6–14% initially, before rapidly decreasing in the rapid void ratio change zone and slightly rising to 3–4% during stabilization. This implied dashpot did not wholly facilitate void ratio reductions since its proportion increased again once void ratio became approximately constant.
The slip energy proportion in Figure 10b ranged from 30 to 45% initially but quickly declined with void ratio changes and later stabilized between 5 and 12%. This agrees with past findings relating particle sliding and rotations to energy dissipation during compaction [34]. A certain magnitude continued even after stabilization, indicating sliding does not completely promote densification.
Figure 10c demonstrates rolling slip energy following a similar decreasing trend from initial 12–22% portions to near 0% at stability. In contrast with sliding dissipation, rolling slip energy primarily existed during void ratio variations and played an absolute role in enabling compaction.
As shown in Figure 10d, strain energy accounted for 30–40% initially before rapidly increasing with load cycles during void ratio reductions and maintaining a high 70–80% proportion at stability. Its evolution closely matched void ratio changes but did not directly facilitate compaction.
In summary, dashpot energy does not directly cause void ratio changes, sliding provides mixed densification effects, rolling predominantly enables compaction during void ratio variations, and strain energy passively reflects void ratio trends.

5. Parametric Studies on Energy Dissipation

The preceding sections have highlighted the varying influences of energy dissipation pathways during vibratory compaction. It is important to note that external load changes play a critical role in the evolution rates and final values of void ratio. Consequently, further investigation of energy dissipation under varied loading conditions can offer additional insights into the compaction mechanism. This section analyses homogeneous specimens consisting of 50% coarse particles, which were subject to different excitation forces and frequencies.

5.1. Excitation Force Effects

Excitation forces of 10 kN, 50 kN, 100 kN, and 500 kN were applied at a constant 35 Hz frequency. Figure 11 presents void ratio–time histories under the different forces. All samples progressively compacted but the compaction degree increased with higher forces, yielding lower final void ratios.
Figure 12 illustrates the evolutions of energy dissipation components over time. It was observed that all values increased with increasing excitation, with cumulative dashpot, sliding, and rolling slip energy exhibiting a monotonous growth over time. Strain energy, on the other hand, experienced a rapid initial increase before descending to steady-state levels as the void ratio stabilized. When comparing the rate of increments, it can be noted that dashpot, sliding, and rolling slip energy exhibited greater growth in the zone of rapid void ratio change, which gradually slowed down and declined as the system approached stability. However, dashpot and sliding energies maintained small constant increases after reaching certain levels, while the convergence of rolling slip energy flattened completely.
With regard to the degree of compaction, the effectiveness and efficiency improved significantly with higher forces, up to a certain limit. While the void ratio differences gradually decreased from 50 kN to 100 kN and from 100 kN to 500 kN due to diminishing marginal returns, the energy consumption of the specimen continued to increase approximately linearly with the increase in excitation.

5.2. Excitation Frequency Effects

For a constant 50 kN excitation, frequencies of 25 Hz, 30 Hz, 35 Hz, and 40 Hz were analyzed. Figure 13 presents void ratio versus time plots for these different frequencies. It was observed that all samples underwent monotonic densification, with void ratios decreasing slightly faster at higher frequencies. However, the discrepancies in void ratio reduction were minor within identical loading durations. Therefore, the excitation frequency did not significantly affect the effectiveness or efficiency of S–RM compaction.
Figure 14 displays the evolutions of the different dissipation components. In contrast to strain energy, which remained unaffected by frequency, dashpot, sliding, and rolling slip energy progressively increased with higher frequencies under the same loading period. This can be attributed to the fact that increased frequencies result in more loading cycles, leading to greater energy consumption. However, since strain energy depends on overall deformations during the given timeframe, the differences in its evolution across frequencies are negligible.
In summary, increasing excitation forces can significantly improve the degree of compaction up to a certain limit. However, it also leads to a substantial increase in energy consumption. On the other hand, adjusting the frequency within a typical range has a mild effect on compactness, without appreciable effects on energy dissipation. These trends provide valuable guidance for achieving target densification levels while optimizing energy inputs.

6. Conclusions

This research conducted DEM simulations of the vibratory compaction process in S–RM with varying degrees of mixing homogeneity. The study analyzed the relationships between void ratio changes, particle movements, and energy dissipations during compaction. Additionally, the influences of different excitation forces and frequencies on energy dissipation trends were examined. The key conclusions are summarized as follows:
(1) The mixing uniformity of S–RM significantly affects the compaction characteristics of the filler material. More homogeneous specimens exhibit smaller void ratios after compaction.
(2) Particle motions during vibratory compaction do not necessarily promote densification, although rotations are found to be more closely associated with the compaction process than displacements.
(3) The cumulative external load input energy corresponds to the total energy dissipated by the specimen, indicating that the compaction mechanism can be effectively studied through energy dissipation pathways. The consistent correlations observed between input energy, dissipated energy, and void ratio changes over time and mixing degree support this premise.
(4) Dashpot energy does not directly cause variations in void ratio, sliding provides ambiguous effects on densification, rolling predominantly facilitates compaction during changes in void ratio, and strain energy passively reflects void ratio trends.
In summary, this work provides insights into the underlying energy dissipation mechanisms that govern the densification of S–RM under vibratory loads. These findings contribute to more effective filler selection, improved vibratory compaction procedures, and enhanced predictions of subgrade quality and performance. Further efforts may involve experimental validations through instrumented laboratory vibratory compaction tests on S–RM specimens.

Author Contributions

Conceptualization, S.L.; methodology, S.L.; software, W.W.; validation, W.W. and W.H.; data curation, S.L.; writing—original draft preparation, W.W.; writing—review and editing, S.L.; supervision, W.H.; project administration, W.H.; funding acquisition, W.H. All authors have read and agreed to the published version of the manuscript.

Funding

This research was funded by the National Natural Science Foundation of China, grant number 52178332; and the Scientific Research Project of the Hunan Provincial Education Department, grant number 22C250.

Institutional Review Board Statement

Not applicable.

Informed Consent Statement

Not applicable.

Data Availability Statement

Data are contained within this article.

Conflicts of Interest

The authors declare no conflict of interest.

References

  1. Xu, W.J.; Hu, L.M.; Gao, W. Random generation of the meso-structure of a soil-rock mixture and its application in the study of the mechanical behavior in a landslide dam. Int. J. Rock Mech. Min. Sci. 2016, 86, 166–178. [Google Scholar] [CrossRef]
  2. Fan, X.; Scaringi, G.; Korup, O.; West, A.J.; Westen, C.J.; Tanyas, H.; Hovius, N.; Hales, T.C.; Jibson, R.W.; Allstadt, K.E.; et al. Earthquake-Induced Chains of Geologic Hazards: Patterns, Mechanisms, and Impacts. Rev. Geophys. 2019, 57, 421–503. [Google Scholar] [CrossRef]
  3. Wang, F.; Fan, X.; Yunus, A.P.; Siva Subramanian, S.; Alonso-Rodriguez, A.; Dai, L.; Xu, Q.; Huang, R. Coseismic landslides triggered by the 2018 Hokkaido, Japan (Mw 6.6), earthquake: Spatial distribution, controlling factors, and possible failure mechanism. Landslides 2019, 16, 1551–1566. [Google Scholar] [CrossRef]
  4. Qi, Q.; Nie, Y.; Wang, X.; Liu, S. Exploring the effects of size ratio and fine content on vibration compaction behaviors of gap-graded granular mixtures via calibrated DEM models. Powder Technol. 2023, 415, 118156. [Google Scholar] [CrossRef]
  5. Fan, X.; Juang, C.H.; Wasowski, J.; Huang, R.; Xu, Q.; Scaringi, G.; van Westen, C.J.; Havenith, H.-B. What we have learned from the 2008 Wenchuan Earthquake and its aftermath: A decade of research and challenges. Eng. Geol. 2018, 241, 25–32. [Google Scholar] [CrossRef]
  6. Xu, Q.; Zhang, S.; Li, W.L.; van Asch, T.W.J. The 13 August 2010 catastrophic debris flows after the 2008 Wenchuan earthquake, China. Nat. Hazards Earth Syst. Sci. 2012, 12, 201–216. [Google Scholar] [CrossRef]
  7. Wen-Jie, X.; Qiang, X.; Rui-Lin, H. Study on the shear strength of soil–rock mixture by large scale direct shear test. Int. J. Rock Mech. Min. Sci. 2011, 48, 1235–1247. [Google Scholar] [CrossRef]
  8. Dong, H.; Peng, B.; Gao, Q.-F.; Hu, Y.; Jiang, X. Study of hidden factors affecting the mechanical behavior of soil–rock mixtures based on abstraction idea. Acta Geotech. 2021, 16, 595–611. [Google Scholar] [CrossRef]
  9. Li, J.; Zhang, J.; Yang, X.; Zhang, A.; Yu, M. Monte Carlo simulations of deformation behaviour of unbound granular materials based on a real aggregate library. Int. J. Pavement Eng. 2023, 24, 2165650. [Google Scholar] [CrossRef]
  10. Yao, Y.; Li, J.; Ni, J.; Liang, C.; Zhang, A. Effects of gravel content and shape on shear behaviour of soil-rock mixture: Experiment and DEM modelling. Comput. Geotech. 2022, 141, 104476. [Google Scholar] [CrossRef]
  11. Huilin, L.; Yurong, H.; Gidaspow, D.; Lidan, Y.; Yukun, Q. Size segregation of binary mixture of solids in bubbling fluidized beds. Powder Technol. 2003, 134, 86–97. [Google Scholar] [CrossRef]
  12. Combarros, M.; Feise, H.J.; Zetzener, H.; Kwade, A. Segregation of particulate solids: Experiments and DEM simulations. Particuology 2014, 12, 25–32. [Google Scholar] [CrossRef]
  13. Chang, J.; Li, J.; Hu, H.; Qian, J.; Yu, M. Numerical Investigation of Aggregate Segregation of Superpave Gyratory Compaction and Its Influence on Mechanical Properties of Asphalt Mixtures. J. Mater. Civ. Eng. 2023, 35, 04022453. [Google Scholar] [CrossRef]
  14. Dai, B.-B.; Yang, J.; Liu, F.-T.; Gu, X.-Q.; Lin, K.-R. A new index to characterize the segregation of binary mixture. Powder Technol. 2020, 363, 611–620. [Google Scholar] [CrossRef]
  15. Azema, E.; Preechawuttipong, I.; Radjai, F. Binary mixtures of disks and elongated particles: Texture and mechanical properties. Phys. Rev. E 2016, 94, 042901. [Google Scholar] [CrossRef] [PubMed]
  16. Zhang, Z.-T.; Wang, Y.-H.; Gao, W.-H.; Hu, W.; Liu, S.-K. Permanent Deformation and Its Unified Model of Coal Gangue Subgrade Filler under Traffic Cyclic Loading. Appl. Sci. 2023, 13, 4128. [Google Scholar] [CrossRef]
  17. Liu, S.; Hu, W.; Gong, J.; Nie, Z. An improved index of mixing degree and its effect on the strength of binary geotechnical mixtures. Granul. Matter 2021, 24, 6. [Google Scholar] [CrossRef]
  18. Liu, S.; Nie, Y.; Hu, W.; Ashiru, M.; Li, Z.; Zuo, J. The Influence of Mixing Degree between Coarse and Fine Particles on the Strength of Offshore and Coast Foundations. Sustainability 2022, 14, 9177. [Google Scholar] [CrossRef]
  19. Zhao, S.; Evans, T.; Zhou, X. Effects of curvature-related DEM contact model on the macro-and micro-mechanical behaviours of granular soils. Géotechnique 2018, 68, 1085–1098. [Google Scholar] [CrossRef]
  20. Goldenberg, C.; Goldhirsch, I. Friction enhances elasticity in granular solids. Nature 2005, 435, 188–191. [Google Scholar] [CrossRef]
  21. Zhu, Y.; Gong, J.; Nie, Z. Shear behaviours of cohesionless mixed soils using the DEM: The influence of coarse particle shape. Particuology 2021, 55, 151–165. [Google Scholar] [CrossRef]
  22. Zhou, W.; Xu, K.; Ma, G.; Yang, L.; Chang, X. Effects of particle size ratio on the macro- and microscopic behaviors of binary mixtures at the maximum packing efficiency state. Granul. Matter 2016, 18, 81. [Google Scholar] [CrossRef]
  23. Matchett, A.J.; Yanagida, T.; Okudaira, Y.; Kobayashi, S. Vibrating powder beds: A comparison of experimental and Distinct Element Method simulated data. Powder Technol. 2000, 107, 13–30. [Google Scholar] [CrossRef]
  24. Yanagida, T.; Matchett, A.J.; Coulthard, J.M. Energy dissipation of binary powder mixtures subject to vibration. Adv. Powder Technol. 2001, 12, 227–254. [Google Scholar] [CrossRef]
  25. Huang, M.; Yao, Z. Explicit model for cumulative strain of saturated clay subjected to cyclic loading. Chin. J. Geotech. Eng. 2011, 33, 325–331. [Google Scholar]
  26. Mo, H.; Shan, Y.; Li, H.; Liu, S.; Chen, J. Energy-based method for analyzing accumulative plastic strain growth of tailing silt. Chin. J. Geotech. Eng. 2017, 39, 1959–1966. [Google Scholar]
  27. Zhao, C.; Li, C.; Hu, L. Rolling and sliding between non-spherical particles. Phys. A 2018, 492, 181–191. [Google Scholar] [CrossRef]
  28. Wang, Y.; Alonso-Marroquin, F.; Guo, W.W. Rolling and sliding in 3-D discrete element models. Particuology 2015, 23, 49–55. [Google Scholar] [CrossRef]
  29. Campbell, C.S. Self-diffusion in granular shear flows. J. Fluid Mech. 1997, 348, 85–101. [Google Scholar] [CrossRef]
  30. Denissen, C. A Micromechanical Study of Energy Dissipation Mechanisms in Granular Soils Subjected to Cyclic Loading. Master’s Thesis, Southern Methodist University, Dallas, TX, USA, 2009. [Google Scholar]
  31. Asmar, B.N.; Langston, P.A.; Matchett, A.J.; Walters, J.K. Energy monitoring in distinct element models of particle. Adv. Powder Technol. 2003, 14, 43–69. [Google Scholar] [CrossRef]
  32. Pilbeam, C.C.; Vaišnys, J.R. Acoustic velocities and energy losses in granular aggregates. J. Geophys. Res. 1973, 78, 810–824. [Google Scholar] [CrossRef]
  33. Yu, T.; Zhang, G.-H.; Sun, Q.-C.; Zhao, X.-D.; Ma, W.-B. Dynamic effective mass and power dissipation of the granular material under vertical vibration. Acta Phys. Sin. 2015, 64, 044501. [Google Scholar]
  34. Liu, S.; Li, H.; Shan, Y.; Li, K.; Ba, L. Energy method for analyzing dynamic pore water pressure model for tailing soil. Chin. J. Geotech. Eng. 2016, 38, 2051–2058. [Google Scholar]
Figure 1. Schematic representation of the principles of calculating the indicators.
Applsci 13 11359 g001
Figure 2. Variation curve of coarse particles with normalized depth under different I value.
Applsci 13 11359 g002
Figure 3. Changes in void ratio of particle system with load period.
Applsci 13 11359 g003
Figure 4. Variations in void ratio, final void ratio, and minimum void ratio.
Applsci 13 11359 g004
Figure 5. The average displacement and rotation angle of samples with different mixing degrees vary with load period: (a) displacement; and (b) rotation angle.
Applsci 13 11359 g005
Figure 6. Self-diffusion coefficient varies with mixing degree.
Applsci 13 11359 g006
Figure 7. Comparison of the input energy with the corrected total dissipated energy.
Applsci 13 11359 g007
Figure 8. Variations in input energy with load period.
Applsci 13 11359 g008
Figure 9. Input energy and void ratio changes with mixing degree.
Applsci 13 11359 g009
Figure 10. The proportion of energy consumption to total energy dissipation during a single load period: (a) dashpot energy; (b) slip energy; (c) rolling slip energy; and (d) strain energy.
Applsci 13 11359 g010
Figure 11. Changes in void ratio with time under different excitation forces.
Applsci 13 11359 g011
Figure 12. Energy dissipation pathway under different excitation forces: (a) dashpot energy; (b) sliding energy; (c) rolling slip energy; and (d) strain energy.
Applsci 13 11359 g012
Figure 13. Changes in void ratio with time under different excitation frequencies.
Applsci 13 11359 g013
Figure 14. Energy dissipation pathway under different excitation frequencies: (a) dashpot energy; (b) sliding energy; (c) rolling slip energy; and (d) strain energy.
Applsci 13 11359 g014aApplsci 13 11359 g014b
Table 1. Mesoscopic parameters used in numerical simulations.
ParameterValue
Particle density (kg/m3)2650
Local dashpot Dp0.01
Normal viscous dashpot βn0.70
Tangential viscous dashpot βs0.70
Sliding friction μb0.60
Rolling friction μr0.25
Effective contact modulus Ecb (Pa)1.24 × 10⁸
Effective contact modulus of loaded plate Ecl (Pa)3.31 × 10⁹
Normal-to-tangential stiffness ratio k*4.0/3.0
Coarse particle diameter40–60
Fine particle diameter5–15
Disclaimer/Publisher’s Note: The statements, opinions and data contained in all publications are solely those of the individual author(s) and contributor(s) and not of MDPI and/or the editor(s). MDPI and/or the editor(s) disclaim responsibility for any injury to people or property resulting from any ideas, methods, instructions or products referred to in the content.

