Article

Heat Transfer Enhancement by Mitigating the Adverse Effects of Crossflow in a Multi-Jet Impingement Cooling System in Hexagonal Configuration by Coaxial Cylindrical Protrusion—Guide Vane Pairs

by
Ahmet Hikmet Untuç
* and
Salih Ozen Unverdi
Mechanical Engineering Department, Gebze Technical University, Kocaeli 41400, Türkiye
*
Author to whom correspondence should be addressed.
Appl. Sci. 2023, 13(20), 11260; https://doi.org/10.3390/app132011260
Submission received: 11 September 2023 / Revised: 4 October 2023 / Accepted: 9 October 2023 / Published: 13 October 2023
(This article belongs to the Topic Computational Fluid Dynamics (CFD) and Its Applications)

Abstract

:

Featured Application

Advanced cooling in gas turbines and power electronics.

Abstract

A novel compound multi-jet impingement system for enhanced cooling of a flat surface by augmenting its area with cylindrical protrusions (CPs) equipped with coaxial guide vanes (CGVs) and reducing deflection of jets by crossflow has been developed for high-heat removal applications. The cooling performance of coaxial circular jets impinging on the top faces of CPs placed in hexagonal configuration on a flat plate is evaluated by three-dimensional (3D) computational fluid dynamics (CFD) simulations. Jets impinging on the top faces of the protrusions are directed to their lateral faces and then to the base plate by the CGVs around the protrusions, resulting in up to 62.8% improvement in heat transfer rate with a minor increase in pressure drop. Effects of protrusion height and diameter on the pressure drop and cooling performance are studied for jet Reynolds ( R e number range of 5000–20,000. Due to both shortened jet impingement lengths as the height of protrusions is increased and directing the expended fluid away from the impinging jets by CGVs, adverse effects of jet–crossflow interactions on cooling performance and fluid pumping power are significantly reduced. Performance evaluation criterion ( P E C ) of the novel compound multi-jet impingement cooling system (CMJICS) can be as high as 1.52.

1. Introduction

In electronics and power electronics devices [1], personal computer central processing units [2], blades and casings of gas turbines [3,4,5,6,7,8,9,10], combustion chamber liners of gas turbine engines [11,12], and magnetically confined plasma fusion reactors [13,14] macroscale and microscale multi-jet impingement and impingement-effusion high-heat flux cooling systems are utilized. To enhance heat transfer, a very high, nearly uniform heat transfer coefficient (HTC) distribution can be obtained at the stagnation zones of immersed jets injected from multiple orifices or nozzles having a one-dimensional (1D) or two-dimensional (2D) configuration, located over a smooth or roughened impingement surface. Protrusions or dimples having various shapes can be constructed on the flat or curved surface to increase roughness. Fluid discharge ports may be located on either the orifice (or nozzle) plate or the impingement surface by interspersing them between the jets, or the edge (s) or periphery of the system (depending on the 1D or 2D configuration of the jets). The main parameters of the multi-jet impingement cooling problem for a specified jet configuration with certain cross-sections on a selected impingement surface are the positions of the jets, their orientation, Reynolds ( R e ) and Mach ( M a ) numbers, and the shape of the target surface and its position relative to the impingement surface. Rotational effects may influence the flow development and cooling performance. Enhanced heat transfer studies focus on increasing the average HTC, improving HTC uniformity, and elevating the system performance evaluation criterion ( P E C ), which is the ratio of proportional enhancement in heat transfer rate ( Q ˙ ) to the proportional increase in fluid pumping power ( W ˙ ). In the literature, the effects of various geometric or configuration changes, such as the shape and arrangement of the jets, the roughened jet or target surface, the number, location, shape, and orientation of the discharge ports interspersed on the jet or target plate or placed around the system, are investigated. For instance, the effects of corrugated jet plates, immersed nozzle lengths, variable diameter jet orifices, various crossflow schemes, target plate roughness, film hole shapes and orientations, etc. are explored. By interacting with, deflecting, reducing normal momentum of, and deforming and spreading the jets, respectively, crossflow increases fluid pressure drop, shortens the necessary distance between the jet inlet and the target surface for effective cooling, decreases cooling performance, and deteriorates cooling uniformity in the stagnation zones.
Nozzles [15,16,17], protrusions [18,19,20,21,22,23,24,25,26,27,28,29,30,31,32,33], cavities, and discharge ports [29,33,34,35,36,37] in various shapes, topologies, and configurations have been proposed for laminar or turbulent, liquid or gas multi-jet impingement cooling systems (MJICSs). Multiple jet nozzles or orifices and target surface protrusions may be arranged in an in-line, staggered, or hexagonal configuration [38,39,40,41]. Single-phase impinging jet array cooling may be enhanced by constructing macro- or microscale structures such as conical or prismatic pin fins with a triangular, rectangular, pentahedral, circular, elliptical, or hydrofoil base, or their combinations [18,19,20,21,22,23,24,42]; continuous or interrupted, monolithic or slotted ribs of various forms and inclinations [25,26,27,28,29,30] as protrusions; and/or circular, elliptical, rectangular dimple, or spiral indentations [31,32,33], or a metal porous foam [30] on the target surface. Therefore, turbulent convective heat transfer to fluid is augmented due to increased heat transfer area, interruption of boundary layer growth, elevation of turbulence intensity ( I ), and flow mixing. In systems having fountains rising from the target surface after the impingement of jets, if the crossflow R e number is high, the cooling performance can be improved by placing vortex-forming delta-shaped winglet pairs on the target surface to control boundary layers and increase the jets’ impact velocities and turbulence intensities [43,44,45,46]. Impingement cooling of a target surface by multiple, immersed, or single-phase jets in a confined space can be studied by experimental [18,19,20,21,22,23,24,25,28,30,31,33,36,37,43,45,46,47,48], computational [15,49,50,51,52], or both methods [26,27,32,38].
Experimental and computational studies on enhancing the performance of MJICSs using pin fins also exist in the literature. In an experimental and computational study, the highest Q ˙ and the average Nusselt ( N u ¯ ) number are obtained in the minimum crossflow scheme for both flat and micro cubic pin fin roughened target plates [48]. For minimum and maximum crossflow schemes compared with a flat plate, the N u ¯ number on the roughened plate decreases by 10% and 6%, respectively, the Q ˙ increases by 35% and 42%, while the pressure drop penalty is 8% and 14%. In a computational study on a high aspect ratio air jet array impingement cooling channel in a maximum crossflow scheme, compared with a uniform jet array and elongated pin fins arrangement, both the efficiency and effectiveness of the system having circular pin fins and more jets on the upstream are higher [53].
In MJICSs where fluid is discharged in either the transverse or opposite direction of the jets, the interaction of wall jets formed by impingement of neighboring immersed jets on the target plate generates fountains. Vortices formed in the shear layers between the immersed jets and fountains deteriorate convective heat transfer by reducing the normal momentum of impinging jets. The cooling performance of MJICSs with fluid discharging in the transverse direction of the jets degrades more since not only normal components of momentum of jets decrease further due to deflection, deformation, and spread of immersed jets by the crossflow, but also boundary-layer thickness increases toward the exit ports. While the cooling performance of a moderate crossflow scheme deteriorates gradually toward both side discharge ports due to increasing deflection, deformation, and spread of jets, that of a maximum crossflow system having a single side discharge port degrades significantly due to excessive crossflow accumulation near the port [34,40,54,55,56,57,58].
According to the literature cited above, the effects of the geometric parameters of protrusions and passive flow control structures having various shapes placed on a target surface on the thermal-fluid performance of CMJICS have not been extensively studied so far. Therefore, the objective of this study is to evaluate the effects of jet R e number and geometric parameters of a novel CMJICS with hexagonally arranged coaxial jet-cylindrical protrusion-guide vane (J-CP-GV) triplets on cooling performance and fluid pumping power requirement through 3D CFD simulations. In this study, first, a novel compound multi-jet impingement cooling system (CMJICS) involving multiple cylindrical protrusion–coaxial guide vane (CP-CGV) pairs placed in a hexagonal configuration on a flat target plate has been developed. In the proposed design, in a confined space, each immersed air jet emanating from a coaxial circular orifice in a flat perforated plate above the target plate impinges in the normal direction on the top face of the corresponding cylindrical protrusion (CP) equipped with a suitably shaped coaxial guide vane (CGV). Due to the smaller diameter of the orifices than that of the CPs, the stagnation zone of an impinging jet and a wall jet formed after impingement enable concentrated highly effective cooling as it spreads on the circular top face of the corresponding CP. A suitably shaped and positioned CGV around a CP directs the wall jet from its top face to its lateral face and then onto the flat target plate, both augmenting cooling with minimal flow separation and significantly mitigating crossflow and fountains’ interaction with impinging jets. Increasing the height of the CPs shortens the lengths of the impinging jets, reduces their deflection and deformation due to crossflow, and improves the flatness of their core velocity profile and steepness of their shear layer velocity gradients and, therefore, their cooling performance. As the height of a CP increases, heat transfer is further enhanced due to the enlarging lateral face area. Therefore, as the height of the CPs increases, the adverse effects of the interaction of impinging jets with crossflow and fountains on system cooling performance and pressure drop are significantly reduced, while the Q ˙ increases significantly at the expense of slightly increased W ˙ due to the CGVs. The Q ˙ can be further enhanced by increasing the diameter of the CPs due to further enlargement of their lateral face area with a minor increase in W ˙ . Therefore, the system P E C can achieve exceptionally high values. Then, the performance of the novel CMJICS, consisting of seven coaxial air jets impinging in the normal direction on the top faces of CPs equipped with CGVs placed in a hexagonal configuration on a flat target plate, was evaluated by three-dimensional (3D) computational fluid dynamics (CFD) simulations. The effects of the diameter and height of the CPs on the air flow, overall Q ˙ , N u number distribution on the cooled surfaces, N u ¯ number, W ˙ and P E C were analyzed for the jet R e number range of 5000 to 20,000. Finally, the passive flow control strategy at the target surface developed in this study can be applied to a MJICS or multi-jet impingement cooling system (MJIECS) having any configuration of coaxial J-CP-GV triplets and suitably located expended fluid outlet ports.

2. Geometry and CFD-Thermal Modeling

2.1. Governing Equations

CFD simulations were carried out by solving the incompressible Reynolds-averaged Navier–Stokes (RANS) equations with ANSYS Fluent® (version 2019R1) software [59]. Reynolds-averaged continuity, momentum, and energy equations for incompressible flow are expressed as
ρ t + ( ρ u ¯ i ) x i = 0 ,
ρ u ¯ i t + ρ u ¯ j u ¯ i x j = P ¯ x i + x j 2 μ S ¯ i j ρ u i u j ¯ ,
ρ T ¯ t + ρ u ¯ j T ¯ x j = x j λ c p T ¯ x j ρ u i T ¯ ,
where, ρ , μ , λ and c p are the density, dynamic viscosity, thermal conductivity, and specific heat at constant pressure of the fluid, respectively. The mean strain rate S ¯ i j is defined as
S ¯ i j = 1 2 u ¯ i x j + u ¯ j x i ,
Reynolds stress tensor ρ u i u j ¯ and the turbulent heat flux vector ρ u i T ¯ are modeled to close the system of governing equations. Reynolds stress tensor is expressed by the Boussinesq hypothesis as
ρ u i u j ¯ = 2 μ t S ¯ i j 2 3 ρ k δ i j ,
where eddy viscosity μ t and the turbulent kinetic energy k are calculated by a turbulence model. The turbulent heat flux vector is modeled with the simple gradient diffusion hypothesis (SGDH) as
ρ u i T ¯ = μ t P r t T ¯ x i ,
The turbulent Prandtl number ( P r t ) in the SGDH equation is assumed to be constant as 0.85. To evaluate the cooling performance on the target plate, the N u number is calculated as
N u = h D λ ,
where D denotes the orifice diameter. The convective HTC ( h ) is calculated as
h = Q ˙ A ( T ¯ w T ¯ f ) ,
where Q ˙ is the heat transfer rate from the cooled wall, A is the wall area, and T ¯ w and T ¯ f are the Reynolds-averaged cooled wall and fluid inlet temperatures, respectively.

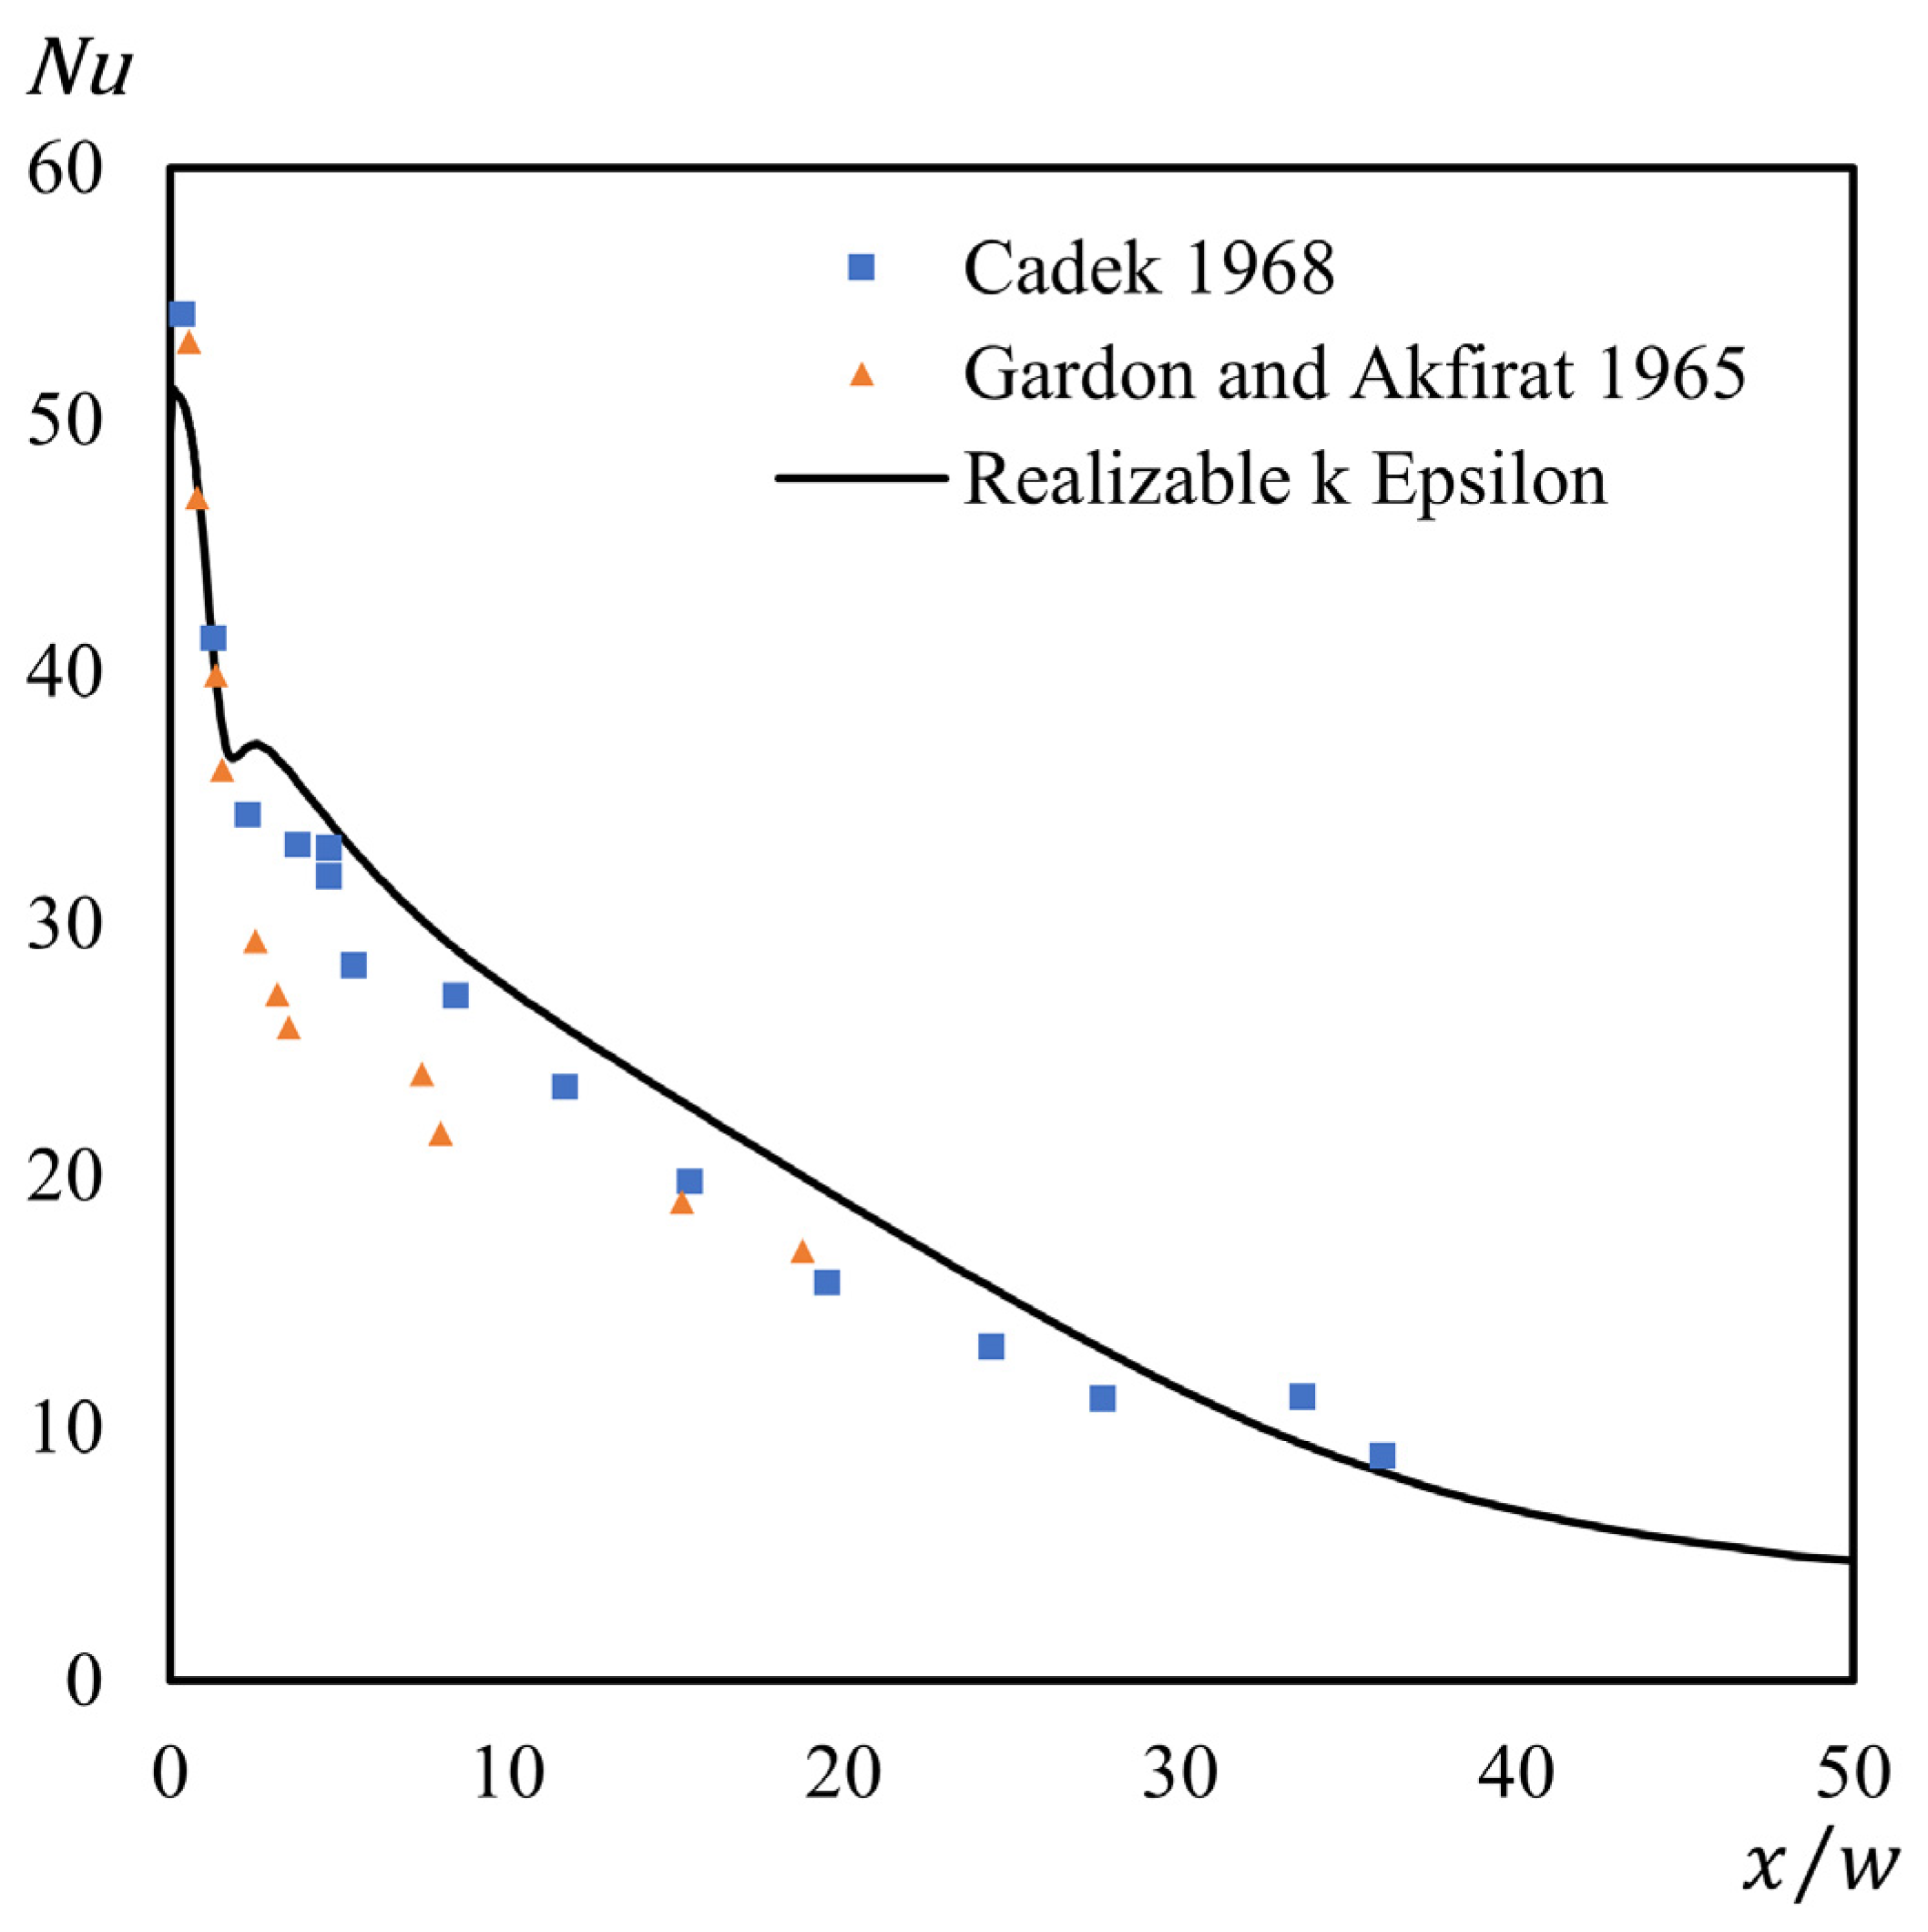
2.2. Turbulence Modelling

The accuracy of jet impingement cooling performance predictions by various RANS turbulence models against experimental data are studied by many researchers [60,61,62,63,64,65,66,67,68]. Some studies recommend the shear-stress transport (SST) k ω turbulence model for improved accuracy of results. However, in this study, the realizable k ε turbulence model [69] with enhanced wall treatment is preferred because of its numerical stability and faster convergence features compared with the SST k ω model for the 3D CFD simulations of the novel CMJICS. Moreover, the realizable k ε turbulence model has been extensively validated for free, channel, boundary layer, and separated flows and resolves the turbulent round-jet/plane-jet spreading rate anomaly. The turbulent kinetic energy ( k ) and eddy viscosity ( μ t ) are calculated by coupling the following transport equations for k and its dissipation rate ( ε ) , respectively,
t ρ k + x i ρ k u ¯ i = x j μ + μ t σ k k x j + G k ρ ε ,
t ρ ε + x i ρ ε u ¯ i = x j μ + μ t σ ε ε x j + ρ C 1 S ε ρ C 2 ε 2 k + ϑ ε ,
The turbulent kinetic energy production rate appearing in Equation (9) is defined as G k = μ t S 2 , where the modulus of the mean strain rate tensor is S = 2 S ¯ i j S ¯ i j . μ t is calculated as
μ t = ρ C μ k 2 ε ,
where
C μ = 1 A 0 + A s k U * ε ,
where A 0 = 4.04 , A s = 6 cos φ , where,
φ = 1 3 cos 1 6 W ,   W = S ¯ i j S ¯ j k S ¯ k i S ~ 3 ,   S ~ = S ¯ i j S ¯ i j ,
and
U * = S ¯ i j S ¯ i j + Ω ~ i j Ω ~ i j ,   Ω ~ i j = Ω i j 2 ϵ i j k ω k ,   Ω i j = Ω ¯ i j ϵ i j k ω k ,
where Ω ¯ i j is the Reynolds-averaged rotation rate tensor viewed in a rotating reference frame with the angular velocity ω k , and C 1 = max 0.43 ,   η η + 5 where, η = S k ε , and the model constants are specified as C 2 = 1.9 ,   σ k = 1.0 and σ ε = 1.2.
Both standard and realizable k ε turbulence models are applicable to high R e number turbulent flows. In this study, the enhanced wall treatment for the ε equation available in ANSYS Fluent® (version 2019R1) is applied, which combines a two-layer model with enhanced wall functions to accurately solve for the viscosity-dominated near-wall region. As suggested by [70], the two-layer model smoothly blends the μ t determined by Wolfstein’s algebraic model in the near-wall region affected by viscosity [71] with its high Reynolds number definition in the outer region given by Equation (11). Similarly, ε, which is determined algebraically in the viscosity-affected near-wall region and calculated by solving the transport equations in the outer region, is blended smoothly. The length scales for the μ t and ε appearing in the algebraic expressions are calculated according to the wall distance and a wall-distance-based turbulent R e number [72]. The blending function is determined as a transcendental function of the turbulent R e number [70]. Furthermore, the unified laws of the wall for velocity and temperature profiles in wall coordinates obtained by blending enhanced laminar and turbulent wall functions are applied throughout viscous sublayer, buffer, and fully turbulent regions [73].
The N u number distribution on the target plate predicted by the selected turbulence model and near-wall modeling are verified by experimental data of Cadek [74] and Gardon and Akfirat [75] for a confined, submerged 2D single turbulent air jet shown in Figure 1. Slot width w is 6.2 mm, jet to target plate distance is 6 w , and length of the target plate is 120 w . At the jet slot, the jet velocity profile is flat, the R e number is 11,000 and I is 2%. The target plate has a uniform temperature of 338 K and the air jet temperature at the slot exit is 373 K. Thermophysical properties of air are taken as constant at room temperature and 1 atm pressure. Spent fluid is discharged into the atmosphere. The no-slip boundary condition is applied on all walls. The confinement plate is assumed to be adiabatic. The pressure–velocity coupling algorithm and the pressure-based solver of ANSYS Fluent® (version 2019R1) CFD software are utilized. Pressure, momentum, energy, turbulent kinetic energy, and dissipation rate equations are discretized in space by a second-order accurate finite volumes method.
Four cartesian meshes consisting of 60 × 90, 80 × 110, 100 × 140, and 120 × 160 cells, denoted as M1, M2, M3, and M4, respectively, are generated for grid independence study as shown in Figure 1b. The target plate local N u number distributions according to the dimensionless distance from the stagnation point ( x / w ) calculated on four meshes at various resolutions are compared in Figure 2. Convergence under grid refinement is achieved for M4 due to negligibly small differences between the results obtained on grids M3 and M4. For grid M4, the highest dimensionless distance from a wall to the centroid of the adjacent grid cell in wall coordinates ( y + ) on the target plate is 1.52.
The local N u number distribution on the target plate calculated by CFD simulation on the grid M4 and experimental data are compared in Figure 3. The result obtained by the realizable k ϵ turbulence model with enhanced wall treatment satisfactorily agrees with the experimental data. The biggest differences occur in the secondary peak region of the local N u number distribution. In the remaining regions, the CFD result is in fair agreement with the experimental data. Similar discrepancies of heat transfer characteristics in the jet stagnation region due to the chosen turbulence model, turbulence production limiter, mesh type, and near-wall grid resolution can be found in the literature [61,68,76,77].

2.3. Solution Strategy

In the CFD simulations of this study, the pressure-based segregated solver of ANSYS Fluent® (version 2019R1) is applied. The semi-implicit method for pressure-linked equations (SIMPLE) algorithm is preferred for pressure–velocity coupling. Incompressible momentum, energy, turbulent kinetic energy, and dissipation rate transport equations as well as the Poisson equation for pressure are discretized by second-order finite volumes in space. Changes in both the maximum N u number in the stagnation region and the scaled residuals are recorded during the iterations until convergence is achieved. In CFD simulations, at convergence, the scaled residuals for the continuity and energy equations are 1 × 10⁻⁶ and 1 × 10⁻⁸, respectively; those for the momentum, k and ϵ transport equations are 1 × 10⁻⁴ and 1 × 10⁻⁵, respectively, for a flat target plate and for H p / D of 1. For higher H p / D values, the scaled residuals are even lower.

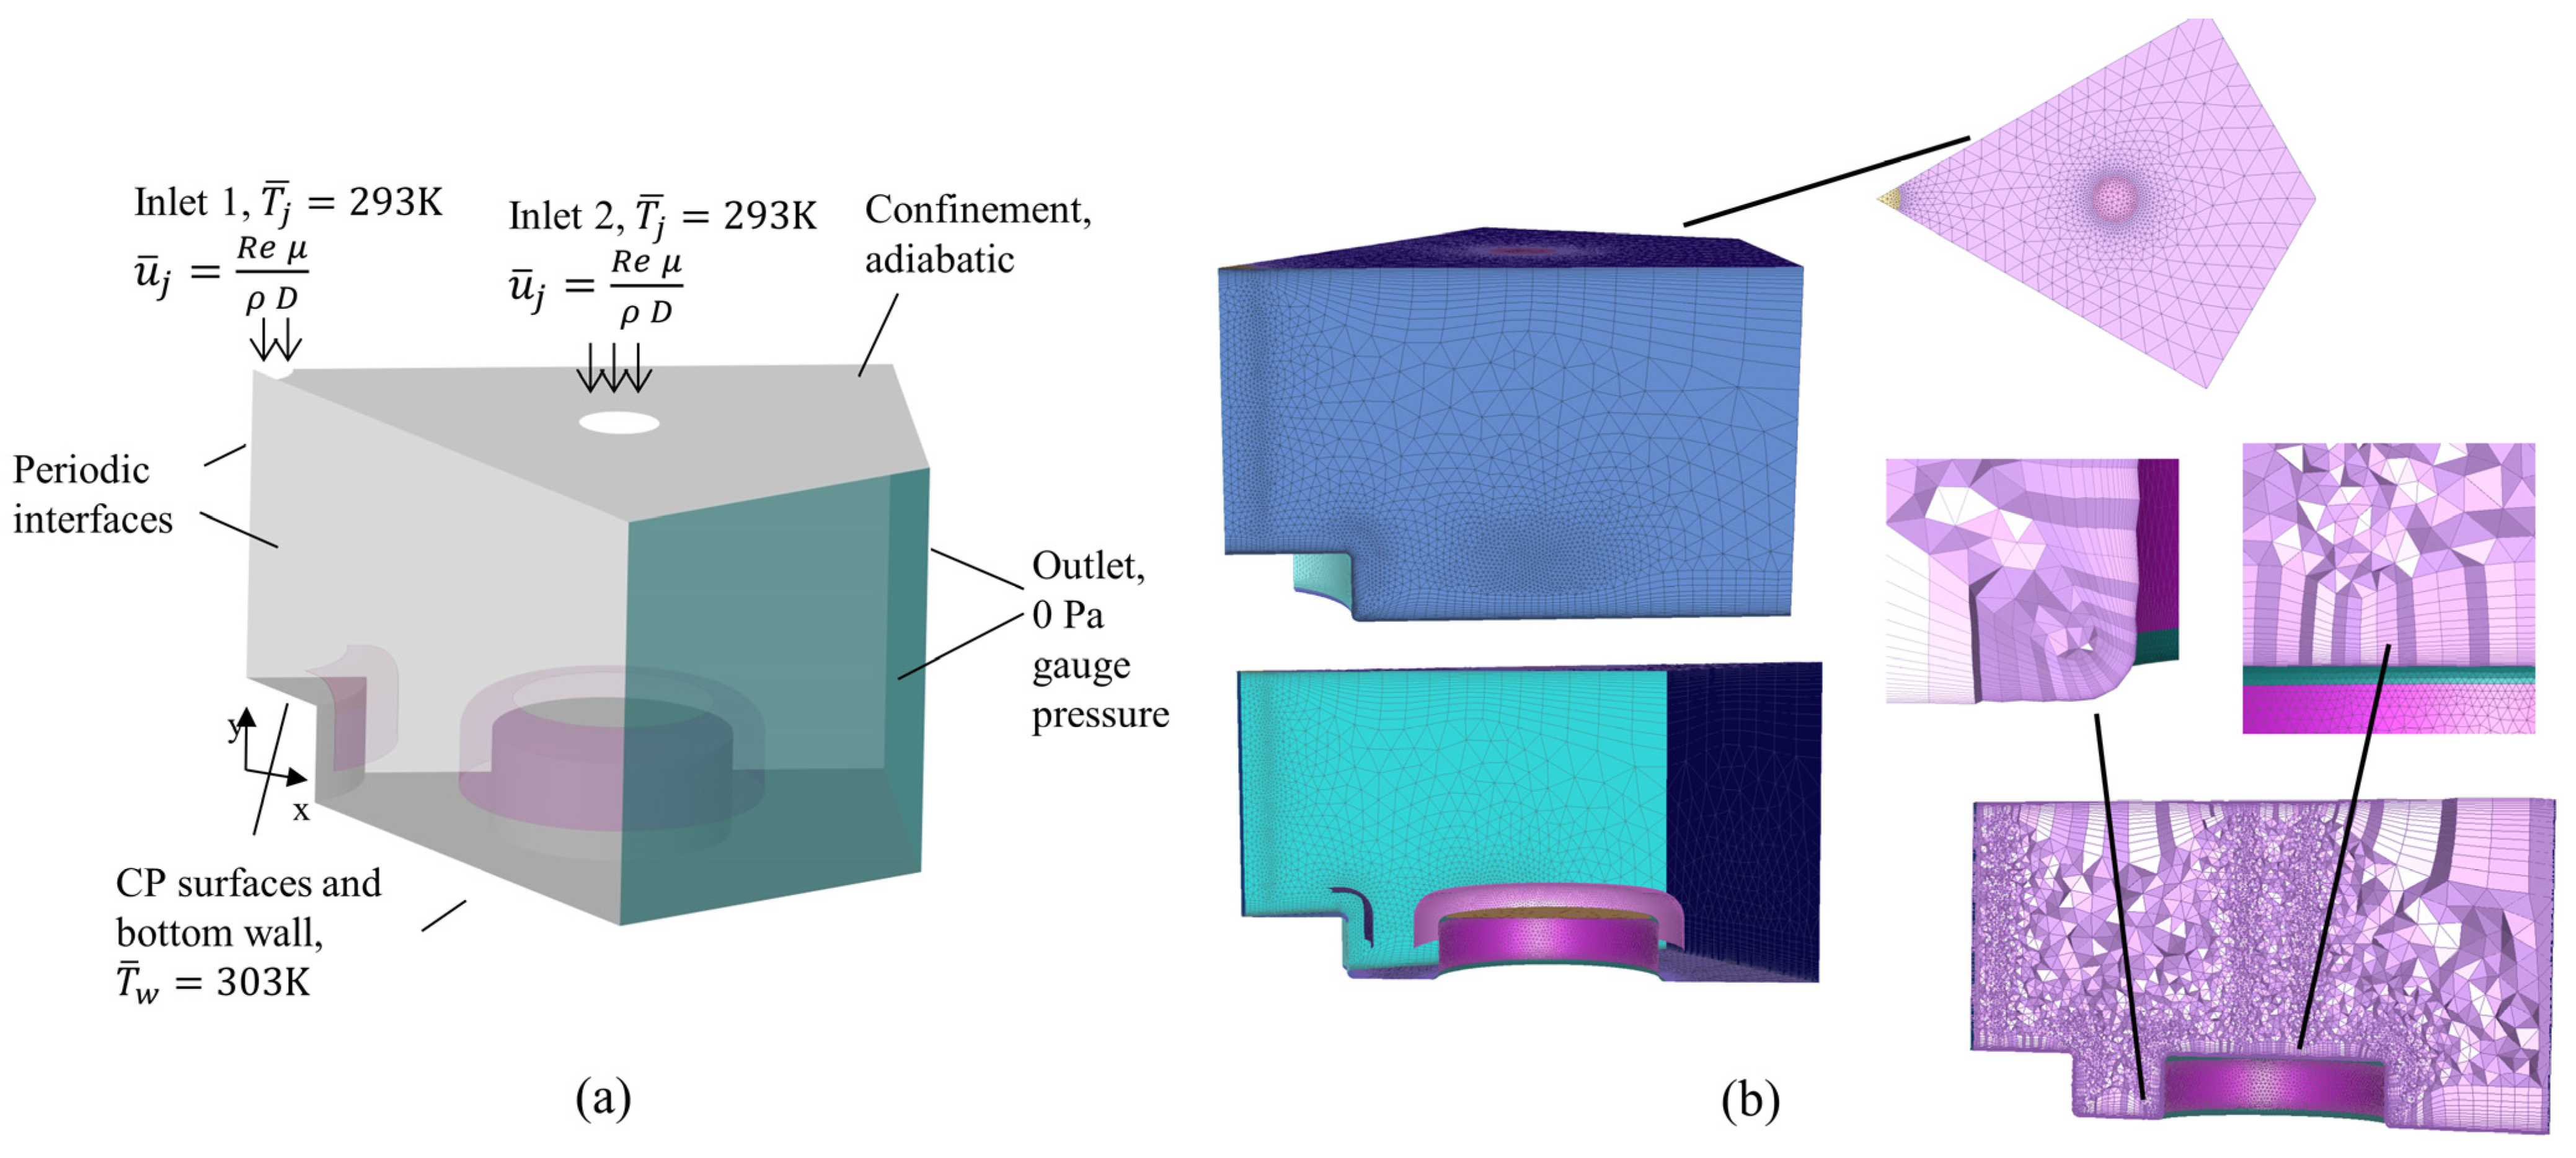
2.4. Geometry and Boundary Conditions

The enhanced CMJICS developed in this study involves CPs with axisymmetric CGVs around them, which are mounted in a hexagonal configuration on the flat base plate of a confined space. An immersed jet of air emerging from a smaller diameter concentric orifice in the confinement plate impinges on the top face of each CP. The wall jet formed on the top face of each CP is deflected toward the base plate by the properly shaped CGV to flow on the lateral face of the CP without separation. The CGV is extended toward the bottom plate to maintain cooling effectiveness by preventing flow separation from the lateral face. As the fluid reaches the base plate, it flows over it and interacts with other streams from neighboring CPs, forming upward fountains, the momentum of which varies with position depending on the strength of the interacting streams in the space between the CPs. The crossflow then interacts with the immersed impinging jets before being discharged from the exhaust ports on the flanks of the confined space. As the height of the CPs is increased, interactions of the crossflow with impinging jets weaken rapidly; thereby, their adverse effects on the jet impingement cooling system performance are effectively mitigated. The cooling performance and pressure drop of the enhanced CMJICS in a hexagonal prism shape are calculated by 3D CFD simulations and compared with those obtained for the flat target plate case. The system shown in Figure 4a consists of seven CP-CGV pairs having an interaxial distance of 5 D mounted on a hexagonal flat base plate with an inner tangent circle radius of 8 D and seven coaxial orifices with a diameter D of 4 mm drilled into a parallel confinement plate. The upper flat confinement plate is located 5 D away from the base plate, while all side faces of the system are exposed to the atmosphere. A CGV is placed around each CP that directs the wall jet formed on the top face of the CP to its lateral face. A planar section view through the axis of a CP and its CGV is presented in Figure 4b. The CGVs are modeled as zero-thickness baffles. The attachments of the CGVs to the confinement plate are not modeled to avoid complexity. As the diameter ( D p ) or height ( H p ) of a CP is varied, the position of the CGV relative to the CP is maintained. The inlet of a CGV is located far enough from the immersed impinging jet to avoid its interaction with the shear layer of the jet.
In CFD simulations, the periodicity condition is applied to the planar boundary faces normal to the azimuthal coordinate of the 60° cylindrical sector of the CMJICS shown in Figure 5a. In simulations, the orifice exit velocity profile of a jet is assumed to be flat and the jet R e number is varied between 5000 and 20,000. The Reynolds-averaged jet velocity at the orifice ( u ¯ J ) is calculated as u ¯ J = ( R e μ ) / ( ρ D ) where ρ and μ are the density and dynamic viscosity of the fluid, respectively. It is assumed that the thermophysical properties of the cooling air are constant at 1 atm pressure and the Reynolds-averaged jet inlet temperature ( T ¯ J ) is 293 K. The molecular P r number of the air is 0.71. Turbulence intensity at the orifice exit of a jet is calculated by I = 0.16 R e ( 1 / 8 ) . The no-slip boundary condition is applied to the walls. The confinement plate is modeled as an adiabatic wall. Uniform Reynolds-averaged wall temperature ( T ¯ w ) of 303 K boundary condition is applied on the top and lateral face of each CP as well as on the base plate. The expended fluid is discharged into the atmosphere at a pressure of 1 atm and a temperature of 293 K. The geometric and operating parameters of CMJICS and the thermo-physical properties of air are listed in Table 1.

2.5. Convergence under Mesh Refinement Study

A grid independence study is conducted for the highest jet R e number considered in this study. D p and H p are selected as 3.5 D and 1 D , respectively. For 3D CFD simulations, a hybrid grid consisting of triangular base prism layers and tetrahedrons was created due to the complex geometry of the CMJICS problem. Twenty layers of prisms with triangular bases (wedge-shaped finite volumes) adjacent to the walls and a gradually expanding tetrahedral mesh throughout the remainder of the solution domain are created. The total height of the prism layers and the height ratio between layers, which is kept below 1.2 for smoothness, were adjusted to accurately resolve the momentum and thermal boundary layers on the walls. Therefore, the nonuniform hybrid meshes created in this study cluster finite volumes in regions adjacent to walls. Prism layers cover the boundary layers on both the cooled surfaces and the perforated confinement plate. Since the cell size varies across the wall surfaces, the maximum aspect ratio of the first prism layer cells is limited to less than 55, thus preventing them from becoming too large, especially toward the outlet. To accurately resolve turbulent momentum and thermal boundary layers, the maximum y + value of the centroids of cells adjacent to walls is kept close to unity on cooled surfaces. Moreover, refined tetrahedral cells are generated in the immersed jet regions, above the jet stagnation zones, around the CPs and CGVs as seen in Figure 5b. The tetrahedral mesh is expanded toward the core region and the exit with a maximum growth rate of 1.2. Four meshes of various resolutions named M1, M2, M3, and M4 are created, consisting of 2.66 × 10⁵, 5.44 × 10⁵, 1.68 × 10⁶ and 2.59 × 10⁶ cells, respectively. For the M1, M2, M3, and M4 meshes, on the cooled surfaces, the calculated highest y + values are 1.80, 1.68, 1.65, and 1.29, and the N u ¯ numbers are 50.94, 51.58, 52.16 and 52.32, respectively. The simulation results obtained on M3 are presented in the following section due to only a 0.3% difference between the N u ¯ numbers calculated on M3 and M4.

3. Results

In this section, the effects of installing a larger diameter CP equipped with a CGV under each orifice of a hexagonally configured CMJICS on the overall Q ˙ , heat transfer enhancement ratio ( Q ˙ / Q ˙ o ), N u ¯ number, N u number distribution, flow structure, pressure drop, and P E C are analyzed. First, CFD simulations are performed for various dimensionless CP heights ( H p / D ) ranging between 1 and 4.5 , while keeping the dimensionless CP diameter ( D p / D ) constant at 3.5 , for jet R e numbers of 5000, 10,000, 15,000, and 20,000. Then, the effect of D p / D is analyzed by CFD simulations.

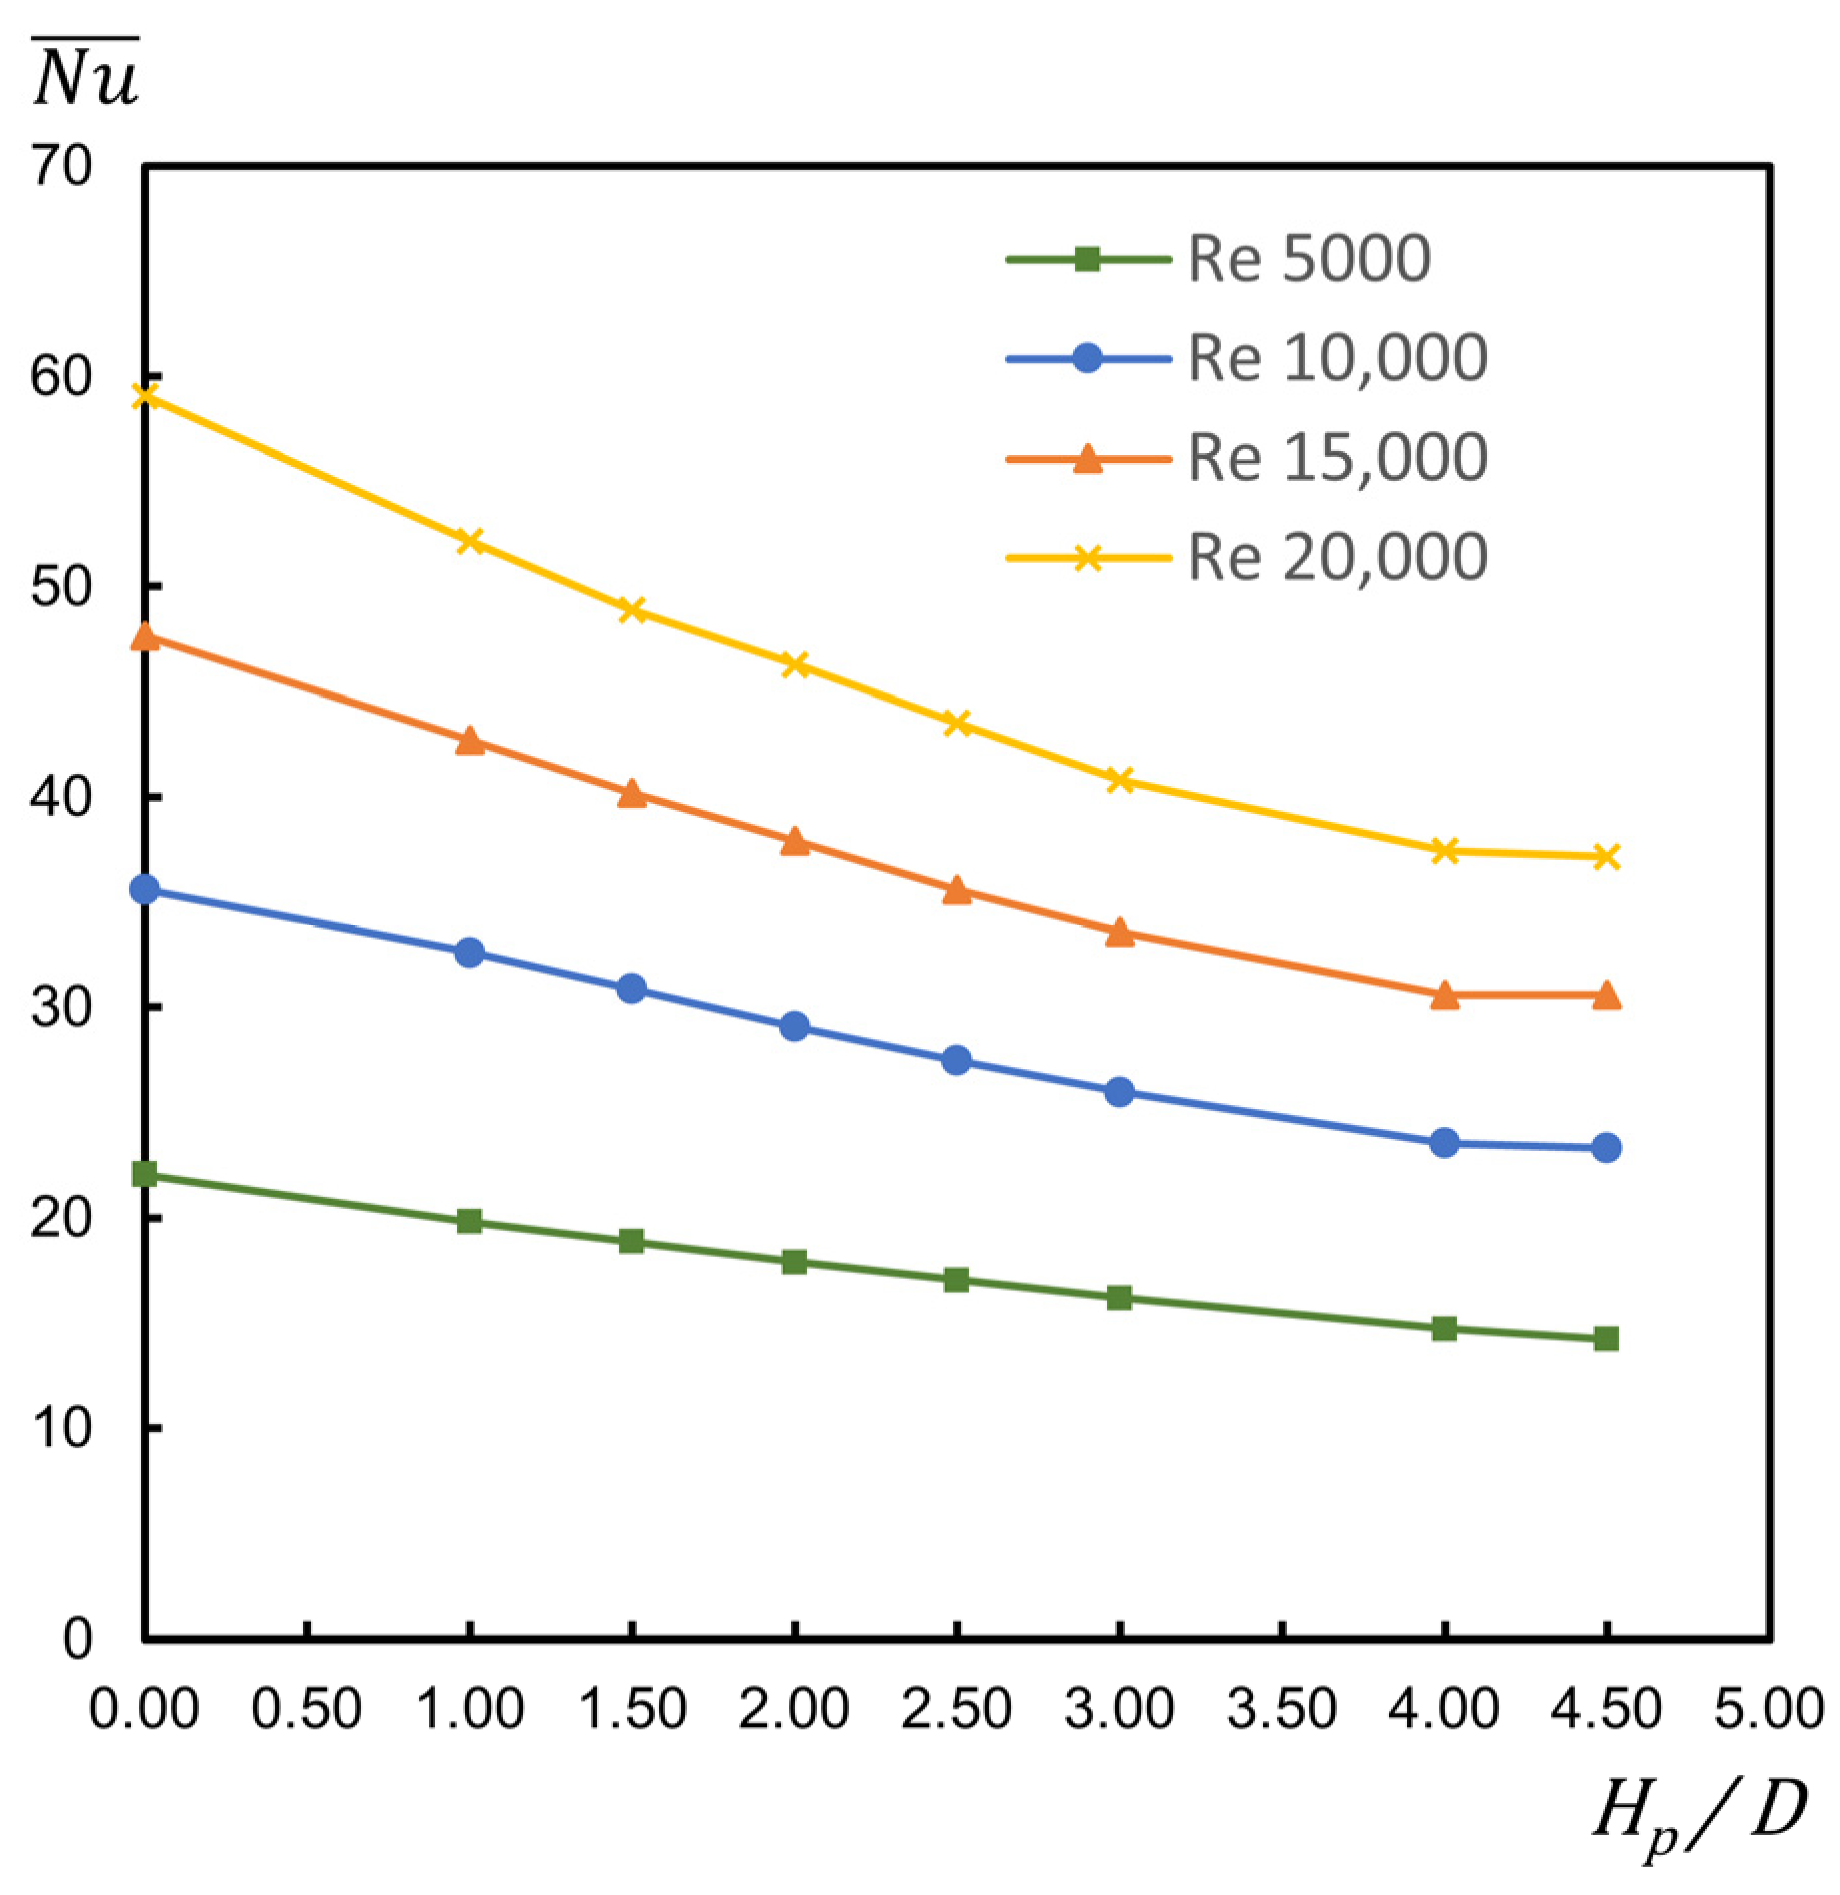
3.1. The Effect of Protrusion Height

In this study, each jet impinges on the top face of a single CP without directly interacting with the target plate. Therefore, as H p / D is increased, the concentrated effective cooling in the jet stagnation zone on the top face of the CP improves due to the higher core velocity profile coherency and shear layer velocity gradients of the jet. Furthermore, effective cooling of the lateral face of a CP by the wall jet deflected by a CGV increases due to the enlarged lateral surface area as H p / D is increased. As H p / D increases, the heat transfer enhances significantly due to the elevated core velocity profile coherence and shear layer intensity of the impinging jets, their reduced deflection and deformation due to weakened crossflow interactions, and the enlarged lateral surface areas of the CPs.

3.1.1. Enhancement of Heat Transfer

The overall Q ˙ is the sum of those from the top and lateral faces of both CPs and from the base plate to the fluid in the computational domain presented in Figure 5a. For a D p / D of 3.5 , the overall Q ˙ according to H p / D is presented for various jet R e numbers in Figure 6. In Figure 6, H p / D of 0 represents the flat target plate. The overall Q ˙ increases with H p / D for any jet R e number considered. As seen in Figure 6, the rate of change of the Q ˙ according to H p / D increases with the jet R e number. For any jet R e number, it decreases with H p / D until an H p / D of 3.0 and rapidly increases for H p / D exceeding 4.0 . For any jet R e number considered, the maximum Q ˙ is obtained for an H p / D of 4.5 where the top face of a CP is 0.5 D below the jet orifice and the CGV almost touches the confinement plate.
The ratio of the Q ˙ of the protruding surface to that of the flat target plate ( Q ˙ o ) according to H p / D for various jet R e numbers is presented in Figure 7. As seen in Figure 7, the Q ˙ / Q ˙ o increases with H p / D for all jet R e numbers considered. For a jet R e number of 5000, Q ˙ enhancement compared with the flat target plate is 18.1% at H p / D of 1 , while it is 62.9% for H p / D of 4.5 . For a jet R e number of 10,000, the overall Q ˙ is enhanced by 20.5% and 65% for H p / D of 1 and 4.5 , respectively. For a jet R e number of 15,000, the enhancement in Q ˙ is calculated as 17.9% and 62.1% for H p / D of 1 and 4.5 , respectively. Furthermore, the corresponding enhancements in Q ˙ are 16.2% and 58.8% for a jet R e number of 20,000. Therefore, the biggest improvement in Q ˙ compared with that of the flat target plate is obtained for a jet R e number of 10,000 and H p / D of 4.5 . The Q ˙ / Q ˙ o rapidly increases for H p / D values ranging between 4 and 4.5 where the upper surface of a CP is at a smaller distance away from the jet orifice than D , as seen in Figure 7. Another conclusion that can be drawn from Figure 7 is that as the jet R e number increases, Q ˙ / Q ˙ o decreases except for a few H p / D values on lower jet R e number curves. For instance, while the improvement in Q ˙ for H p / D of 3 is 47.2% at a jet R e number of 5000, it decreases to 46.3%, 41.4%, and 38.6% at jet R e numbers of 10,000, 15,000 and 20,000, respectively. In conclusion, Q ˙ is significantly improved by CPs equipped with CGVs compared with that of the flat target plate, while the Q ˙ / Q ˙ o has a decreasing trend as the jet R e number is increased.
N u ¯ number according to H p / D for various jet R e numbers is presented in Figure 8. For any considered H p / D , the N u ¯ number increases at a decreasing rate with the jet R e number. Contrary to the overall Q ˙ , the N u ¯ number decreases as H p / D is increased for all considered jet R e numbers due to the bigger contribution of the less effectively cooled lateral surface of the CP to the enhanced heat transfer. In other words, the decrease in the N u ¯ number with increasing H p / D is due to the increased contribution of ordinary convective heat transfer on the lateral faces of the CPs with smaller HTCs than the jet impingement cooling on the upper faces. It has been reported in the literature that the N u ¯ number of a MJICS decreases as the heat transfer surface is augmented by protrusions having various shapes [48,78]. Weigand and Spring stated that the N u ¯ number of a MJICS may decrease due to changes in the flow field if the target surface is augmented by modifications and emphasized that the main indicator to consider is the overall Q ˙ [54]. The highest N u ¯ numbers are obtained for the flat target plate case for all jet R e numbers considered. For jet R e numbers of 10,000 and 20,000, the N u ¯ number decreases slightly as H p / D is increased from 4 to 4.5 due to intense impingement cooling enabled by rapid deceleration of the jet in the small gap between the jet orifice and the CP top face. For a jet R e number of 15,000, the N u ¯ number remains almost constant when H p / D is increased from 4 to 4.5 . Both the rapid increase in the overall Q ˙ and the almost constant N u ¯ number of the cooled surfaces for very small impinging immersed jet lengths are due to a rapid increase in the jet stagnation zone N u number. However, for a jet R e number of 5000, as H p / D is increased from 4 to 4.5, a notable decrease in the N u ¯ number occurs due to the less effective cooling of the top faces of the CPs by the smaller vortices generated at a shorter jet impingement distance by Kelvin–Helmholtz instabilities.
Area-averaged N u number ratios, the ratio of the N u ¯ number of the protruding surface to that of the flat target surface ( N u ¯ / N u ¯ o ) according to H p / D for various jet R e numbers, are presented in Figure 9. For jet R e numbers above 10,000, at any H p / D , the N u ¯ / N u ¯ o decreases with increasing jet R e number, while for a jet R e number of 5000, its trend, compared with a jet R e number of 10,000, varies with H p / D . For any jet R e number considered, the N u ¯ / N u ¯ o decreases as H p / D is increased due to bigger contribution of the CP lateral surface to cooling. Therefore, for any jet R e number, the highest N u ¯ / N u ¯ o is obtained for H p / D of 1 , which is the smallest among all CP heights considered in this study. For H p / D of 1 , the biggest and smallest N u ¯ / N u ¯ o s of 91.7% and 88.3% are obtained for jet R e numbers of 10,000 and 20,000, respectively. For H p / D of 4.5 , for jet R e numbers of 5000, 10,000, 15,000, and 20,000, the N u ¯ / N u ¯ o s are 0.645, 0.653, 0.642, and 0.629, respectively.
For various jet R e numbers, N u number contour plots on the target plate and CP top faces as well as on unrolled lateral faces of CPs are presented in Figure 10. As the H p / D is increased, the N u ¯ number increases on the top faces of the CPs due to the flatter core velocity profiles and steeper shear layer velocity gradients of the impinging jets and their reduced deflections and deformations due to weakened crossflow interactions. On the other hand, the N u ¯ number decreases on both the lateral faces of CPs and the target plate due to increased thermal boundary layer thickness. For instance, for a jet R e number of 20,000, while the N u ¯ number on the top faces of the CPs is 94.49 for H p / D of 2 , it increases to 98.23 for H p / D of 4 . On the other hand, the N u ¯ number on the lateral faces of CPs and on the target plate, for stated CP heights, decreases from 36.66 to 28.47 and from 36.12 to 29.74, respectively. As H p / D is increased by keeping the top face area of a CP constant, its lateral face area increases. While the overall Q ˙ is significantly improved by increasing H p / D , the surface heat flux distribution is nonuniform and the N u ¯ number of all cooled surfaces decreases, although that of the top faces of the CPs increases. The effect of a distance smaller than D between an orifice and a CP top face on the local N u number distribution can be clearly seen in Figure 10. For a jet R e number of 15,000, the N u ¯ number on the top faces of CPs increases slightly from 79.39 to 81.82 as H p / D is increased from 3 to 4 . However, the N u ¯ number on the top faces of CPs rapidly rises to 94.47 for H p / D of 4.5 . The highest overall Q ˙ achieved for H p / D of 4.5 is due to the very high N u numbers in the stagnation zone of the impinging jet. On the other hand, for a smaller H p / D , as the stagnation region deforms and enlarges, the momentum in the core of the impinging jet decreases compared with its periphery. Therefore, the N u numbers in the immediate vicinity of the jet axis are lower than those in the surrounding oval or kidney-shaped region.
As presented in Figure 11, in the case of a flat target plate, the crossflow disrupts the heat transfer in the stagnation zone by significantly deflecting and deforming the impinging outer jet, reducing the coherence of its core velocity profile and steepness of its shear layer velocity gradients. As seen in Figure 10, in the case of the flat target plate, the deformation of the kidney-shaped N u number contours appearing in the impingement zone of the outer jet due to the interaction of the jet with the crossflow increases with the jet R e number. The CP-CGV pairs installed on the flat target plate to enhance heat transfer influence the crossflow as well. As H p / D increases, velocities in the core of impinging jets increase and shear layers become thinner due to less advection and diffusion of the jets in the lateral directions. Because the spent fluid is directed further away from the jets, the reduced interactions of the crossflow with the impinging jets decrease the deflection of the jets, mitigating the displacement, deformation, and enlargement of the jet stagnation zones, thereby improving impingement heat transfer. The overall Q ˙ increases even further due to the increased lateral surface area of the CPs. Stated effects are more pronounced at higher jet R e numbers. As H p / D is increased, the jet impingement region shape progressively becomes oval and then circular. Increasing H p / D shortens the impinging jets while CGVs direct the wall jets away from the stagnation region down to the lateral faces and then toward the base plate, ensuring that their momentum decreases as they move away from the CPs, thus reducing the deflection of the impinging jets due to their interaction with the crossflow.

3.1.2. Flow Structure and Pressure Drop

Velocity magnitude contour plots in the section shown in Figure 10 are presented for various H p / D and jet R e numbers in Figure 11. The CGVs direct the wall jets formed on the top faces of the CPs after the impingement of the immersed jets, first to the lateral faces and then to the base plate. By leaving a sufficient clearance of 0.4 D between both the top and lateral faces of a CP and its CGV, flow splitting by the CGV and excessive pressure drops are prevented in each case studied. The chosen values of the CGV and the CP upper edge fillet radii may have caused flow separation from the upper portion of the lateral face, thereby reducing heat transfer. The shapes and dimensions of both CGVs and filleted top edges of the CPs need to be optimized in a future study to avoid flow separation. In this study, CGVs are extended toward the target plate leaving a 0.5 D clearance between them to prevent premature flow separation from lateral faces of CPs.
In the case of a flat target plate, the outer jet is deflected and deformed by crossflow at all jet R e numbers considered, as seen in Figure 11. On the other hand, as the height of CPs is increased so that velocities in the core of impinging jets increase and shear layers become thinner and the interactions of crossflow with the jets are mitigated, deflections and deformations of the impinging jets decrease significantly. Furthermore, due to the decreased momentum of wall jets after being directed to the lateral faces of CPs by CGVs, the fountains formed by interacting neighboring streams on the target plate weaken compared with much more prominent ones in the case of a flat target plate.
The pressure drops between the jet orifices and the system outlet ( Δ P ) according to H p / D for various jet R e numbers are presented in Figure 12. For any jet R e number considered, at H p / D smaller than 4 , a minor rise in Δ P occurs compared with that of the flat target plate, the largest difference being 2%. At H p / D of 4 , for jet R e numbers of 5000, 10,000, 15,000, and 20,000, Δ P are 6.5%, 6.8%, 7.3%, and 6.8% higher than those of the flat target plate, respectively. At H p / D of 4.5 , due to the extremely high momentum of the impinging jets, Δ P significantly increases by 40.9%, 45.5%, 49.7%, and 50.1%, respectively, for the jet R e numbers of 5000, 10,000, 15,000, and 20,000.

3.1.3. PEC

Since measures to improve heat transfer may increase Δ P , an important indicator of the thermo-economic performance of an enhanced cooling system is the P E C , which is the ratio of the proportional improvement in the overall Q ˙ to the proportional increase in W ˙ . Therefore, the greater the P E C , which is calculated by dividing the ratio of the improved Q ˙ of the protruding surface to that of the flat target plate by the ratio of the corresponding W ˙ requirements, the better the thermo-economic performance of the system. The P E C is calculated as
P E C = Q ˙ Q ˙ o W ˙ W ˙ o ,
W ˙ o = P o . V ˙ ,
W ˙ = P . V ˙ ,
where Q ˙ o , W ˙ o , and P o are the overall heat transfer rate, fluid pumping power, and pressure drop, respectively, for an MJICS with a flat target plate, and Q ˙ , W ˙ , and P are those of a CMJICS with a protruding surface for the same fluid volume flow rate V ˙ . For various jet R e numbers, the P E C according to H p / D is presented in Figure 13. For any jet R e number, the P E C increases with H p / D , reaching its peak value at H p / D of 4 . For jet R e numbers exceeding 10,000, at any considered H p / D , both Q ˙ / Q ˙ o and P E C decrease with increasing jet R e number as seen in Figure 7 and Figure 13, respectively. However, as seen in Figure 7, Figure 9 and Figure 13, for lower jet R e numbers between 5000 and 10,000, due to the varying effects of the formation and advection of vortices generated by Kelvin–Helmholtz instabilities, effects of the coherence of the core velocity profile of each jet, and effects of the steepness of its adjacent shear layer velocity gradients on local HTCs and N u numbers, the trends of Q ˙ / Q ˙ o , N u ¯ / N u ¯ o and P E C vary according to H p / D . For D p / D of 3.5 , among the H p / D and jet R e numbers considered, the largest P E C of 1.47 is obtained for H p / D of 4 and a jet R e number of 5000, while the smallest P E C of 1.39 occurs for the same H p / D at the highest jet R e number of 20,000. Since the P E C is greater than unity for all H p / D and jet R e numbers studied, enlarging the target surface with CPs equipped with CGVs in a hexagonal configuration is a robust and highly effective design, given the enhanced thermo-economic performance. For an H p / D of 4.5 , where the top face of a CP is only 0.5 D away from the corresponding orifice, although the Q ˙ / Q ˙ o increases rapidly for any jet R e number, P E C decreases sharply due to excessive Δ P since the potential core of the jets prevail in the impingement zones. For H p / D of 4.5 , the highest and lowest P E C values of 1.15 and 1.05 are obtained at jet R e numbers of 5000 and 20,000, respectively. Therefore, for any jet R e number considered, the thermo-economic performance of the system having H p / D of 4.5 significantly deteriorates compared with the peak P E C values obtained at H p / D of 4 .

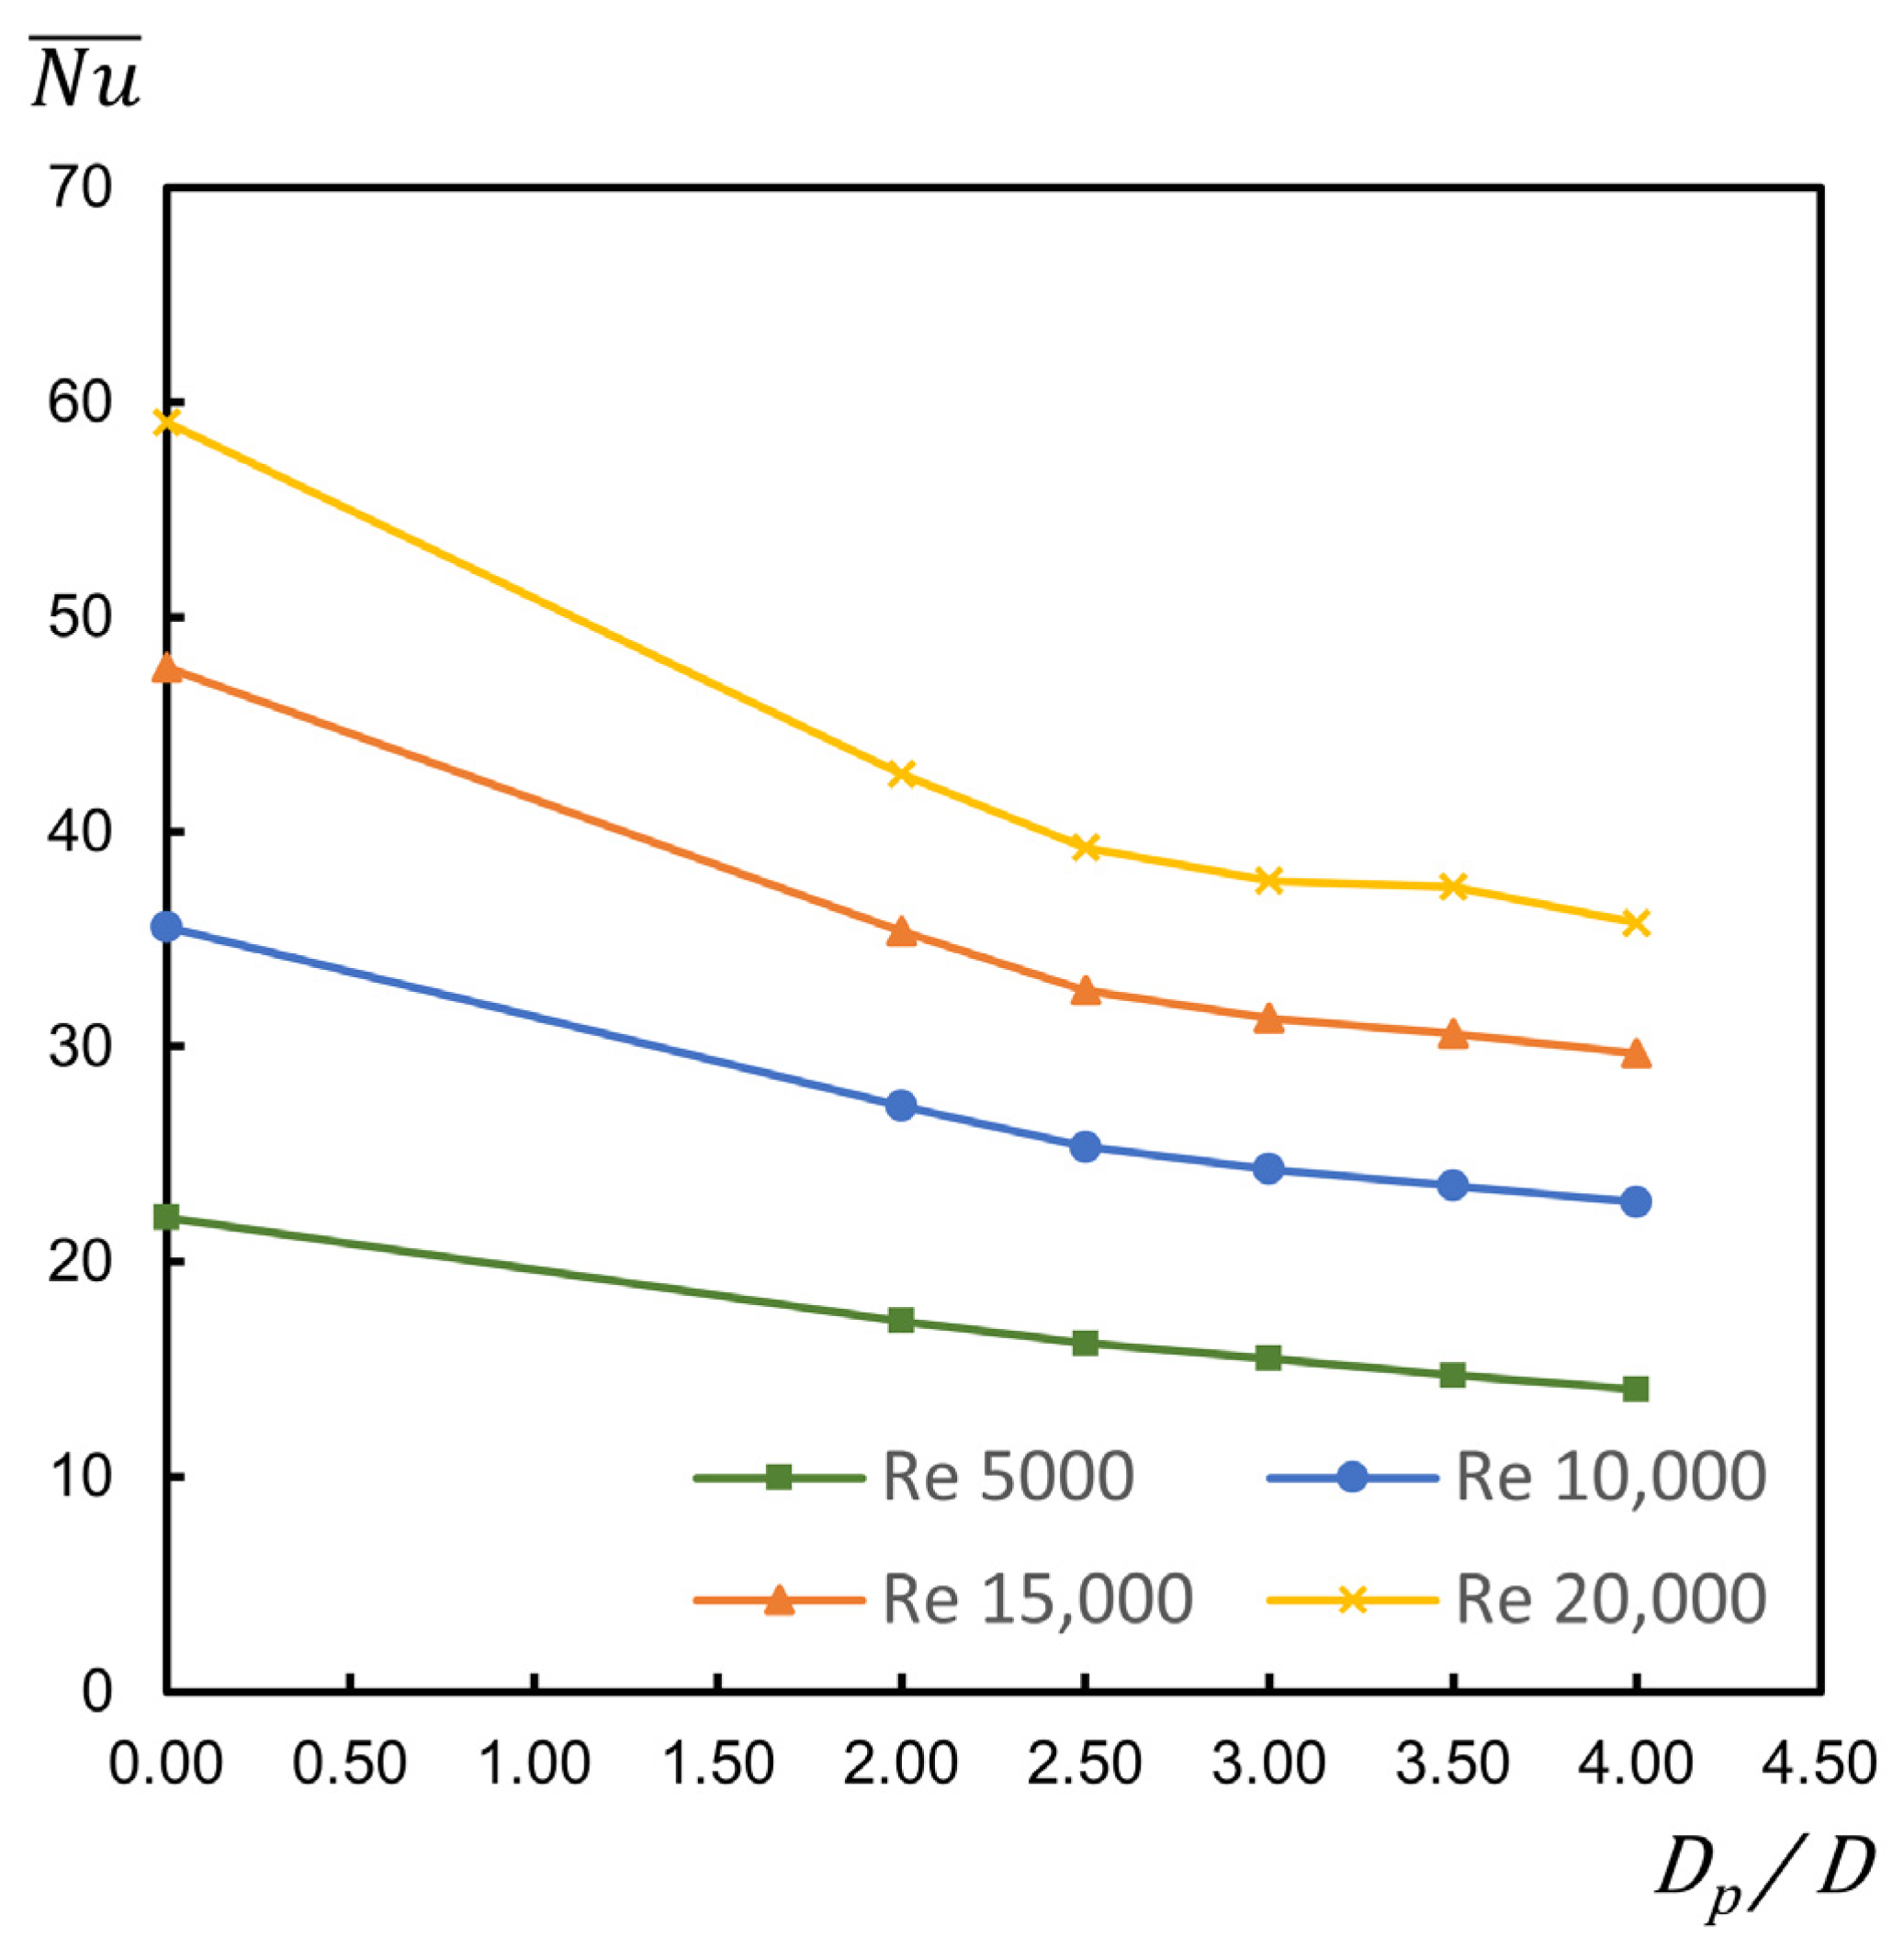
3.2. Effect of Protrusion Diameter

To analyze the effect of D p / D on multi-jet impingement cooling, for fixed H p / D of 4 where P E C peaks, the D p / D of 2 , 2.5 , 3 , 3.5 , and 4 were considered at various jet R e numbers of 5000, 10,000, 15,000, and 20,000.

3.2.1. Enhancement of Heat Transfer

For H p / D of 4 , at various jet R e numbers, the effect of five different D p / D of 2 , 2.5 , 3 , 3.5 , and 4 on the overall Q ˙ is presented in Figure 14. The flat target plate case is represented by D p / D of 0. Like H p / D , increasing D p / D enhances the overall Q ˙ for any jet R e number considered in this study. For a jet R e number of 20,000, the lowest enhancement in the overall Q ˙ of 28.3%, compared with the flat target plate case, occurs at D p / D of 2 . For the same jet R e number, at D p / D of 4 , the overall Q ˙ is enhanced by 54.3% compared with that of the flat target plate. Among all considered cases, the highest enhancement in the overall Q ˙ , 62.8%, is obtained at D p / D of 4 for a jet R e number of 10,000.
For H p / D of 4 , Q ˙ / Q ˙ o according to D p / D at various jet R e numbers are presented in Figure 15. For any jet R e number considered, the Q ˙ / Q ˙ o increases with D p / D . As seen in Figure 15, at any D p / D , for the jet R e numbers exceeding 5000, Q ˙ / Q ˙ o decreases with increasing jet R e number. At D p / D of 4 , approximately the same heat transfer enhancement with respect to that of the flat target plate, 62.8%, is obtained for the jet R e numbers of 5000 and 10,000.
For H p / D of 4 , the N u ¯ numbers according to D p / D at various jet R e numbers are presented in Figure 16. For any D p / D , the N u ¯ number increases with jet R e number. As seen in Figure 8, the N u ¯ number decreases with increasing H p / D . Similarly, as D p / D increases, the N u ¯ number decreases but at a slower pace. As D p / D increases, both top and lateral face areas of CPs increase whereas the base plate area decreases. Since the heat fluxes are highest on the top faces of the CPs, the N u ¯ number obtained by increasing their diameter, hence both the top and lateral face areas, decreases more slowly than that obtained by increasing their height, hence the lateral face areas.
For H p / D of 4 , the N u ¯ / N u ¯ o according to D p / D at various jet R e numbers are presented in Figure 17. The N u ¯ / N u ¯ o decreases with increasing D p / D and jet R e number. For D p / D of 2, 2.5, 3, 3.5, and 4, the lowest—72.3%, 66.5%, 63.9%, 63.4%, and 60.6%—and highest—78.2%, 73.5%, 70.3%, 66.7%, and 63.7%— N u ¯ / N u ¯ o s are obtained for jet R e numbers of 20,000 and 5000, respectively.
For H p / D of 4 , local N u number contour plots on the top faces of CPs and on the flat base plate, as well as on the unrolled lateral faces of the CPs, at various D p / D and jet R e numbers are presented in Figure 18. The N u ¯ numbers on the top and lateral faces of the CPs and on the flat base plate decrease with increasing D p / D . For instance, at a jet R e number of 20,000, for D p / D of 3 and 4 , the N u ¯ numbers on the top faces are 102 and 93.71, respectively; on the lateral faces, 31.29 and 25.60; and on the flat base plate, 30.21 and 26.71. For D p / D of 3 , the N u number trace of the rising fountain formed by the collision of wall jets on the flat base plate between the two CPs clearly indicates a secondary stagnation zone. As the distance between the two CPs decreases due to an increase in D p / D , the N u number contours on the lateral face of the outer CP for D p / D of 4 take on a helical shape due to the peripheral diversion of the flow directed toward the flat base plate by the intensified crossflow.

3.2.2. Fluid Flow and Pressure Drop

For H p / D of 4 , velocity magnitude contour plots in the planar section shown in Figure 10 are presented for various D p / D and jet R e numbers in Figure 19. As the spacing between them decreases due to the increase in D p / D , the fountains weaken and eventually disappear due to the reduced momentum of the wall jets on the top faces of the CPs at the inlet of CGVs, and consequently, those of the downflows on their lateral faces. While the fountain structure between the two CPs is quite prominent for D p / D values ranging between 2 and 3 , it is considerably smaller for D p / D of 3.5 and almost disappears for D p / D of 4 . For D p / D of 4 , the downflow on the lateral face of the outer CP is deflected around its circumference by the intense crossflow resulting from the smallest distance between the CPs that can be considered in this study. However, quite minor increases in Δ P occur as D p / D is increased despite quite significantly enhanced Q ˙ s, which has important ramifications in evaluating the thermo-economic performance of the system.

3.2.3. PEC

For H p / D of 4 , the P E C values according to D p / D at various jet R e numbers are presented in Figure 20. For any jet R e number considered, the overall Q ˙ increases significantly with D p / D due to enhanced heat transfer on both the top and lateral faces of the CPs thanks to controlled flow over the enlarged areas of both faces, while the P E C increases substantially due to minor increases in Δ P . The highest P E C , 1.519, is achieved for D p / D of 4 at a jet R e number of 10,000. The lowest P E C , 1.198, occurs for D p / D of 2 at a jet R e number of 20,000. As seen in Figure 16, at any jet R e number, the N u ¯ number is higher for D p / D of 2 , despite the lower overall Q ˙ and P E C , than that for D p / D of 4 . However, at any jet R e number, for D p / D of 4 , the highest overall Q ˙ and P E C are achievable at the expense of decreased N u ¯ number.
Comparison of the calculated Q ˙ / Q ˙ o , N u ¯ / N u ¯ o , and P E C of the novel flow-controlled CMJICS with those of the systems having various protrusion shapes in the literature are listed in Table 2.

4. Discussion

In this study, the flow structure, W ˙ , overall Q ˙ , and P E C characteristics of a novel, high-performance CMJICS with passive flow control that can significantly reduce the adverse effects of crossflow on heat transfer and pressure drop were analyzed through 3D CFD simulations. By deflecting the air jets impinging in the normal direction on the top faces of the hexagonally arranged CPs toward their lateral faces via CGVs, interactions of the crossflow with jets are significantly reduced, and Q ˙ is considerably enhanced compared with a flat target surface, at the expense of a small increase in W ˙ . Since the CPs have a larger diameter than the jet orifices, the impingement cooling of the jets is focused on the top faces of the CPs, and the wall jets formed thereafter are directed by CGVs to the lateral faces of the CPs, effectively cooling them and reducing the interactions of crossflow with the impinging jets. Therefore, the overall Q ˙ and P E C of the novel cooling system developed in this study are higher than of a system without flow control, in which the jets impinge on both the protrusions and the base plate or the base plate between the protrusions.
As a jet becomes shorter, its advection and diffusion in lateral directions and the entrainment of surrounding fluid decrease. Therefore, the overall Q ˙ of the novel CMJICS can be improved by heightening the CPs, both due to the increased magnitude and coherency of the core velocities of the jets and the increased steepness of the shear layer velocity gradients of the jets, as well as the enlarged lateral surface area of the CPs. Moreover, reducing the deflections and deformations of the jets by the crossflow with passive flow control improves the HTCs at the stagnation zones of the impinging jets, thus the Q ˙ on the top faces of the CPs. The P E C of the novel CMJICS improves with increasing height of the CPs due to a minor proportional increase in W ˙ compared with Q ˙ . The Q ˙ and P E C can be further enhanced by increasing the diameter of the CPs, thereby the areas of their top and lateral surfaces, without a noticeable effect on the morphology of the impinging jets.
A shape optimization study of both the top edge fillet and the CGV is needed to achieve more effective cooling without flow separation on the lateral face of a CP.
The novel CMJICS developed in this study can be adopted to a system having any configuration of coaxial J-CP-GV triplets and properly located spent fluid outlet ports, including the maximum crossflow arrangement. Moreover, MJIECSs configured as a coaxial J-CP-GV ternary array with interspersed effusion holes can be designed to enhance heat transfer in high-flux cooling applications.
Finally, effective cooling of the lateral face of a cylindrical or truncated cone-shaped protrusion can also be realized without a CGV by means of an optimally shaped Coanda-effect rounding downstream of a step at the upper edge of the protrusion. Additionally, in future studies, CMJICSs and CMJIECSs with truncated-projectile or inverted-bowl-shaped protrusions with a step between the flat top and convex lateral faces can be designed and optimized to ensure that wall jets formed on the top faces after jet impingement remain attached to the lateral faces by the Coanda effect.

5. Conclusions

The effects of CP geometric parameters and jet R e number on the cooling performance and W ˙ requirement of a novel CMJICS were analyzed by 3D RANS simulations for respectively seven and five values of CP height and diameter at jet R e numbers ranging between 5000 and 20,000. P E C values of the novel CMJICS evaluated by CFD simulations clearly indicate its excellent thermo-economic performance. Accordingly,
  • Q ˙ increases with both H p / D and jet R e number. The maximum heat transfer enhancement with respect to the flat target surface of 65% is obtained for D p / D and H p / D of 3.5 and 4.5, respectively. The Q ˙ / Q ˙ o increases with H p / D while decreasing with a jet R e number.
  • Q ˙ increases with D p / D and jet R e number. For H p / D of 4 , and a jet R e number of 20,000, Q ˙ increases by 28.3%, 30.9%, 38.1%, 48.8%, and 54.3%, respectively, for D p / D of 2 , 2.5 , 3 , 3.5 , and 4 . The Q ˙ / Q ˙ o increases with D p / D while decreasing with a jet R e number.
  • The N u ¯ number decreases with increasing H p / D , while increasing with a jet R e number. The N u ¯ / N u ¯ o decreases with increasing H p / D and jet R e number. For high R e number jets impinging on CPs with H p / D above 4 , minor changes in N u ¯ / N u ¯ o occur.
  • The N u ¯ number decreases with increasing D p / D .
  • For D p / D of 3.5 , at any jet R e number studied, the P E C increases considerably with H p / D , reaching its peak values of 1.47, 1.45, 1.41, and 1.39 for jet R e numbers of 5000, 10.000, 15,000, and 20,000 at H p / D of 4 . Greater H p / D values rapidly reduce the P E C due to the significantly increased Δ P caused by an impingement distance shorter than D .
  • P E C decreases with the increasing jet R e number for any studied H p / D , except for a jet R e number of 5000 with H p / D smaller than 2 due to transitional effects.
  • The P E C of the novel cooling system increases with D p / D , while decreasing with the increasing jet R e number. For H p / D of 4 , the highest P E C value of 1.519 is obtained at D p / D of 4 , and a jet R e number of 10,000.

Author Contributions

Conceptualization, A.H.U. and S.O.U.; methodology, A.H.U. and S.O.U.; formal analysis, A.H.U. and S.O.U.; investigation, A.H.U. and S.O.U.; resources, A.H.U. and S.O.U.; data curation, A.H.U. and S.O.U.; writing-original draft preparation, A.H.U. and S.O.U.; writing-review and editing, A.H.U. and S.O.U.; visualization, A.H.U. and S.O.U.; supervision, S.O.U.; project administration, S.O.U. All authors have read and agreed to the published version of the manuscript.

Funding

This research received no external funding.

Institutional Review Board Statement

Not applicable.

Informed Consent Statement

Not applicable.

Data Availability Statement

Not applicable.

Conflicts of Interest

The authors declare no conflict of interest.

Nomenclature

A Area (m2)
c p Specific heat at constant pressure (J kg−1 K−1)
D Orifice diameter (m)
D p Protrusion diameter (m)
G k Turbulent kinetic energy production rate per unit volume of the fluid (kg m−1 s−3)
h Convective heat transfer coefficient (W m−2 K)
H p Protrusion height (m)
I Turbulence intensity (%)
k Turbulent kinetic energy per unit mass of the fluid (m2 s−2)
M a Mach
N u Nusselt
N u ¯ Area-averaged Nusselt
P Pressure (Pa)
P E C Performance evaluation criterion (-)
P r Prandtl
Q ˙ Heat transfer rate (W)
R e Reynolds
S Modulus of the Reynolds-averaged strain rate tensor (s−1)
S ¯ i j Reynolds-averaged strain rate tensor (s−1)
T ¯ Reynolds-averaged temperature (K)
T ¯ J Reynolds-averaged temperature at an orifice (K)
T ¯ w Reynolds-averaged wall temperature (K)
T Temperature fluctuations (K)
u ¯ i A Cartesian component of the Reynolds-averaged velocity vector (m s−1)
u ¯ J Reynolds-averaged jet velocity at an orifice (m s−1)
u i A Cartesian component of the velocity fluctuation vector (m s−1)
V ˙ Volume flow rate of the fluid (m3 s−1)
W ˙ Fluid pumping power (W)
w Slot width
x / w Dimensionless distance from the stagnation point of a slot jet (-)
y + Dimensionless distance from a wall to the centroid of the adjacent grid cell in wall coordinates.
Greek Symbols:
δ i j Kronecker delta (-)
Δ P The pressure drops between the jet orifices and the system outlet.
ϵ Turbulent kinetic energy dissipation rate per unit mass of the fluid (m2 s−3)
ϵ i j k Alternating tensor or permutation symbol (-)
λ Thermal conductivity of the fluid (W m−1 K−1)
μ Dynamic viscosity of the fluid (kg m−1 s−1)
μ t Eddy viscosity of turbulent flow (kg m−1 s−1)
ρ Density of the fluid (kg m−3)
ω k Angular velocity of a rotating reference frame (s−1)
Ω ¯ i j The Reynolds-averaged rotation rate tensor viewed in a reference frame rotating with the angular velocity ω k (s−1)
ρ u i u j ¯ Reynolds stress tensor (kg m−1 s−2)
ρ u i T ¯ Turbulent heat flux vector (kg K m−2 s−1)
Subscripts:
f Fluid
j Jet at the orifice
o Flat plate
w Wall
Acronyms:
CFDComputational Fluid Dynamics
CGVCoaxial Guide Vane
CMJICSCompound Multi-Jet Impingement Cooling System
CPCylindrical Protrusion
CP-CGVCylindrical Protrusion—Coaxial Guide Vane
HTCHeat Transfer Coefficient
J-CP-GVJet-Cylindrical Protrusion-Guide Vane
MJICSMulti-Jet Impingement Cooling System
MJIECSMulti-Jet Impingement-Effusion Cooling System
RANSReynolds-Averaged Navier–Stokes
SGDHSimple Gradient Diffusion Hypothesis
SIMPLESemi-Implicit Method for Pressure-Linked Equations
SSTShear-Stress Transport
1DOne-dimensional
2DTwo-dimensional
3DThree-dimensional

References

  1. Rattner, A.S. General Characterization of Jet Impingement Array Heat Sinks with Interspersed Fluid Extraction Ports for Uniform High-Flux Cooling. J. Heat Transf. 2017, 139, 082201. [Google Scholar] [CrossRef]
  2. Naphon, P.; Wongwises, S. Investigation on the Jet Liquid Impingement Heat Transfer for the Central Processing Unit of Personal Computers. Int. Commun. Heat Mass Transf. 2010, 37, 822–826. [Google Scholar] [CrossRef]
  3. Forster, M.; Weigand, B. Experimental and Numerical Investigation of Jet Impingement Cooling onto a Concave Leading Edge of a Generic Gas Turbine Blade. Int. J. Therm. Sci. 2021, 164, 106862. [Google Scholar] [CrossRef]
  4. Singh, A.; Prasad, B.V.S.S.S. Influence of Novel Equilaterally Staggered Jet Impingement over a Concave Surface at Fixed Pumping Power. Appl. Therm. Eng. 2019, 148, 609–619. [Google Scholar] [CrossRef]
  5. Zhang, M.; Wang, N.; Han, J.-C. Internal Heat Transfer of Film-Cooled Leading Edge Model with Normal and Tangential Impinging Jets. Int. J. Heat Mass Transf. 2019, 139, 193–204. [Google Scholar] [CrossRef]
  6. Chi, Z.; Liu, H.; Zang, S. Geometrical Optimization of Nonuniform Impingement Cooling Structure with Variable-Diameter Jet Holes. Int. J. Heat Mass Transf. 2017, 108, 549–560. [Google Scholar] [CrossRef]
  7. Fechter, S.; Terzis, A.; Ott, P.; Weigand, B.; von Wolfersdorf, J.; Cochet, M. Experimental and Numerical Investigation of Narrow Impingement Cooling Channels. Int. J. Heat Mass Transf. 2013, 67, 1208–1219. [Google Scholar] [CrossRef]
  8. Taslim, M.E.; Setayeshgar, L.; Spring, S.D. An Experimental Evaluation of Advanced Leading Edge Impingement Cooling Concepts. J. Turbomach. 2000, 123, 147–153. [Google Scholar] [CrossRef]
  9. Taslim, M.E.; Rosso, N. Experimental/Numerical Study of Multiple Rows of Confined Jet Impingement Normal to a Surface at Close Distances. In ASME Turbo Expo 2012: Turbine Technical Conference and Exposition; American Society of Mechanical Engineers: New York, NY, USA, 2013. [Google Scholar] [CrossRef]
  10. Ahmed, F.B.; Weigand, B.; Meier, K. Heat Transfer and Pressure Drop Characteristics for a Turbine Casing Impingement Cooling System. In Proceedings of the 2010 14th International Heat Transfer Conference, Washington, DC, USA, 8–13 August 2011. [Google Scholar] [CrossRef]
  11. Peacock, G. Enhanced Cold-Side Cooling Techniques for Lean Burn Combustor Liners. Ph.D. Thesis, Loughborough University, Loughborough, UK, 2013. [Google Scholar]
  12. Lauffer, D.; Weigand, B.; von Wolfersdorf, J.; Dahlke, S.; Liebe, R. Heat Transfer Enhancement by Impingement Cooling in a Combustor Liner Heat Shield. In ASME Turbo Expo 2007: Power for Land, Sea, and Air; American Society of Mechanical Engineers: New York, NY, USA, 2009. [Google Scholar] [CrossRef]
  13. Crosatti, L.; Weathers, J.B.; Sadowski, D.L.; Abdel-Khalik, S.I.; Yoda, M.; Kruessmann, R.; Norajitra, P. Experimental and Numerical Investigation of Prototypical Multi-Jet Impingement (HEMJ) Helium-Cooled Divertor Modules. Fusion Sci. Technol. 2009, 56, 70–74. [Google Scholar] [CrossRef]
  14. Rader, J.D.; Mills, B.H.; Sadowski, D.L.; Yoda, M.; Abdel-Khalik, S.I. Verification of Thermal Performance Predictions of Prototypical Multi-Jet Impingement Helium-Cooled Divertor Module. Fusion Sci. Technol. 2013, 64, 282–287. [Google Scholar] [CrossRef]
  15. Wen, Z.-X.; He, Y.-L.; Cao, X.-W.; Yan, C. Numerical Study of Impinging Jets Heat Transfer with Different Nozzle Geometries and Arrangements for a Ground Fast Cooling Simulation Device. Int. J. Heat Mass Transf. 2016, 95, 321–335. [Google Scholar] [CrossRef]
  16. Wannassi, M.; Monnoyer, F. Fluid Flow and Convective Heat Transfer of Combined Swirling and Straight Impinging Jet Arrays. Appl. Therm. Eng. 2015, 78, 62–73. [Google Scholar] [CrossRef]
  17. Ianiro, A.; Cardone, G. Heat Transfer Rate and Uniformity in Multichannel Swirling Impinging Jets. Appl. Therm. Eng. 2012, 49, 89–98. [Google Scholar] [CrossRef]
  18. Lu, X.; Li, W.; Li, X.; Ren, J.; Jiang, H.; Ligrani, P. Flow and Heat Transfer Characteristics of Micro Pin-Fins under Jet Impingement Arrays. Int. J. Heat Mass Transf. 2019, 143, 118416. [Google Scholar] [CrossRef]
  19. McInturff, P.; Suzuki, M.; Ligrani, P.; Nakamata, C.; Lee, D.H. Effects of Hole Shape on Impingement Jet Array Heat Transfer with Small-Scale, Target Surface Triangle Roughness. Int. J. Heat Mass Transf. 2018, 127, 585–597. [Google Scholar] [CrossRef]
  20. Yeom, T.; Simon, T.; Zhang, T.; Zhang, M.; North, M.; Cui, T. Enhanced Heat Transfer of Heat Sink Channels with Micro Pin Fin Roughened Walls. Int. J. Heat Mass Transf. 2016, 92, 617–627. [Google Scholar] [CrossRef]
  21. Ren, Z.; Buzzard, W.C.; Ligrani, P.M.; Nakamata, C.; Ueguchi, S. Impingement Jet Array Heat Transfer: Target Surface Roughness Shape, Reynolds Number Effects. J. Thermophys. Heat Transf. 2017, 31, 346–357. [Google Scholar] [CrossRef]
  22. Ndao, S.; Peles, Y.; Jensen, M.K. Effects of Pin Fin Shape and Configuration on the Single-Phase Heat Transfer Characteristics of Jet Impingement on Micro Pin Fins. Int. J. Heat Mass Transf. 2014, 70, 856–863. [Google Scholar] [CrossRef]
  23. Ndao, S.; Lee, H.J.; Peles, Y.; Jensen, M.K. Heat Transfer Enhancement from Micro Pin Fins Subjected to an Impinging Jet. Int. J. Heat Mass Transfer 2012, 55, 413–421. [Google Scholar] [CrossRef]
  24. Chakroun, W.M.; Abdel-Rahman, A.A.; Al-Fahed, S.F. Heat Transfer Augmentation for Air Jet Impinged on a Rough Surface. Appl. Therm. Eng. 1998, 18, 1225–1241. [Google Scholar] [CrossRef]
  25. Chen, L.; Brakmann, R.G.; Weigand, B.; Poser, R. An Experimental Heat Transfer Investigation of an Impingement Jet Array with Turbulators on Both Target Plate and Impingement Plate. Appl. Therm. Eng. 2020, 166, 114661. [Google Scholar] [CrossRef]
  26. Brakmann, R.; Chen, L.; Poser, R.; Rodriguez, J.; Crawford, M.; Weigand, B. Heat Transfer Investigation of an Array of Jets Impinging on a Target Plate with Detached Ribs. Int. J. Heat Fluid Flow 2019, 78, 108420. [Google Scholar] [CrossRef]
  27. Rao, Y.; Chen, P.; Wan, C. Experimental and Numerical Investigation of Impingement Heat Transfer on the Surface with Micro W-Shaped Ribs. Int. J. Heat Mass Transf. 2016, 93, 683–694. [Google Scholar] [CrossRef]
  28. Caliskan, S. Flow and Heat Transfer Characteristics of Transverse Perforated Ribs under Impingement Jets. Int. J. Heat Mass Transf. 2013, 66, 244–260. [Google Scholar] [CrossRef]
  29. Xing, Y.; Spring, S.; Weigand, B. Experimental and Numerical Investigation of Impingement Heat Transfer on a Flat and Micro-Rib Roughened Plate with Different Crossflow Schemes. Int. J. Therm. Sci. 2011, 50, 1293–1307. [Google Scholar] [CrossRef]
  30. Rallabandi, A.P.; Rhee, D.-H.; Gao, Z.; Han, J.-C. Heat Transfer Enhancement in Rectangular Channels with Axial Ribs or Porous Foam under through Flow and Impinging Jet Conditions. Int. J. Heat Mass Transf. 2010, 53, 4663–4671. [Google Scholar] [CrossRef]
  31. Vinze, R.; Khade, A.; Kuntikana, P.; Ravitej, M.; Suresh, B.; Kesavan, V.; Prabhu, S.V. Effect of Dimple Pitch and Depth on Jet Impingement Heat Transfer over Dimpled Surface Impinged by Multiple Jets. Int. J. Therm. Sci. 2019, 145, 105974. [Google Scholar] [CrossRef]
  32. Rao, Y.; Li, B.; Feng, Y. Heat Transfer of Turbulent Flow over Surfaces with Spherical Dimples and Teardrop Dimples. Exp. Therm. Fluid Sci. 2015, 61, 201–209. [Google Scholar] [CrossRef]
  33. Xing, Y.; Weigand, B. Experimental Investigation of Impingement Heat Transfer on a Flat and Dimpled Plate with Different Crossflow Schemes. Int. J. Heat Mass Transf. 2010, 53, 3874–3886. [Google Scholar] [CrossRef]
  34. Singh, P.; Ekkad, S.V. Effects of Spent Air Removal Scheme on Internal-Side Heat Transfer in an Impingement-Effusion System at Low Jet-To-Target Plate Spacing. Int. J. Heat Mass Transf. 2017, 108, 998–1010. [Google Scholar] [CrossRef]
  35. Xing, Y.; Weigand, B. Optimum Jet-to-Plate Spacing of Inline Impingement Heat Transfer for Different Crossflow Schemes. J. Heat Transf. 2013, 135, 072201. [Google Scholar] [CrossRef]
  36. Florschuetz, L.W.; Truman, C.R.; Metzger, D.E. Streamwise Flow and Heat Transfer Distributions for Jet Array Impingement with Crossflow. In ASME 1981 International Gas Turbine Conference and Products Show; American Society of Mechanical Engineers: New York, NY, USA, 2015. [Google Scholar] [CrossRef]
  37. Florschuetz, L.W.; Berry, R.A.; Metzger, D.E. Periodic Streamwise Variations of Heat Transfer Coefficients for Inline and Staggered Arrays of Circular Jets with Crossflow of Spent Air. J. Heat Transf. 1980, 102, 132–137. [Google Scholar] [CrossRef]
  38. Xing, Y.; Spring, S.; Weigand, B. Experimental and Numerical Investigation of Heat Transfer Characteristics of Inline and Staggered Arrays of Impinging Jets. J. Heat Transf. 2010, 132, 092201. [Google Scholar] [CrossRef]
  39. Draksler, M.; Končar, B.; Cizelj, L.; Ničeno, B. Large Eddy Simulation of Multiple Impinging Jets in Hexagonal Configuration—Flow Dynamics and Heat Transfer Characteristics. Int. J. Heat Mass Transf. 2017, 109, 16–27. [Google Scholar] [CrossRef]
  40. Geers, L.F.G.; Hanjalić, K.; Tummers, M.J. Wall Imprint of Turbulent Structures and Heat Transfer in Multiple Impinging Jet Arrays. J. Fluid Mech. 2006, 546, 255–284. [Google Scholar] [CrossRef]
  41. Geers, L.F.G.; Tummers, M.J.; Hanjalić, K. Particle Imaging Velocimetry-Based Identification of Coherent Structures in Normally Impinging Multiple Jets. Phys. Fluids 2005, 17, 055105. [Google Scholar] [CrossRef]
  42. Tang, Z.; Liu, Q.; Li, H.; Min, X. Numerical Simulation of Heat Transfer Characteristics of Jet Impingement with a Novel Single Cone Heat Sink. Appl. Therm. Eng. 2017, 127, 906–914. [Google Scholar] [CrossRef]
  43. Wang, C.; Wang, Z.; Wang, L.; Luo, L.; Sundén, B. Experimental Study of Fluid Flow and Heat Transfer of Jet Impingement in Cross-Flow with a Vortex Generator Pair. Int. J. Heat Mass Transf. 2019, 135, 935–949. [Google Scholar] [CrossRef]
  44. Ortega-Casanova, J.; Molina-Gonzalez, F. Axisymmetric Numerical Investigation of the Heat Transfer Enhancement from a Heated Plate to an Impinging Turbulent Axial Jet via Small Vortex Generators. Int. J. Heat Mass Transf. 2017, 106, 183–194. [Google Scholar] [CrossRef]
  45. Wang, C.; Luo, L.; Wang, L.; Sundén, B. Effects of Vortex Generators on the Jet Impingement Heat Transfer at Different Cross-Flow Reynolds Numbers. Int. J. Heat Mass Transf. 2016, 96, 278–286. [Google Scholar] [CrossRef]
  46. Wang, C.; Wang, L.; Sundén, B. A Novel Control of Jet Impingement Heat Transfer in Cross-Flow by a Vortex Generator Pair. Int. J. Heat Mass Transf. 2015, 88, 82–90. [Google Scholar] [CrossRef]
  47. Nakod, P.M.; Prabhu, S.V.; Vedula, R.P. Heat Transfer Augmentation between Impinging Circular Air Jet and Flat Plate Using Finned Surfaces and Vortex Generators. Exp. Therm. Fluid Sci. 2008, 32, 1168–1187. [Google Scholar] [CrossRef]
  48. Brakmann, R.; Chen, L.; Weigand, B.; Crawford, M. Experimental and Numerical Heat Transfer Investigation of an Impinging Jet Array on a Target Plate Roughened by Cubic Micro Pin Fins. J. Turbomach. 2016, 138, 111010. [Google Scholar] [CrossRef]
  49. Luo, L.; Wen, F.; Wang, L.; Sundén, B.; Wang, S. Thermal Enhancement by Using Grooves and Ribs Combined with Delta-Winglet Vortex Generator in a Solar Receiver Heat Exchanger. Appl. Energy 2016, 183, 1317–1332. [Google Scholar] [CrossRef]
  50. Allauddin, U.; Uddin, N.; Weigand, B. Heat Transfer Enhancement by Jet Impingement on a Flat Surface with Detached-Ribs under Cross-Flow Conditions. Numer. Heat Transf. Part A Appl. 2013, 63, 921–940. [Google Scholar] [CrossRef]
  51. Wan, C.; Rao, Y.; Chen, P. Numerical Predictions of Jet Impingement Heat Transfer on Square Pin-Fin Roughened Plates. Appl. Therm. Eng. 2015, 80, 301–309. [Google Scholar] [CrossRef]
  52. Wan, C.; Rao, Y.; Zhang, X. Numerical Investigation of Impingement Heat Transfer on a Flat and Square Pin-Fin Roughened Plates. In ASME Turbo Expo 2013: Turbine Technical Conference and Exposition; American Society of Mechanical Engineers: New York, NY, USA, 2013. [Google Scholar] [CrossRef]
  53. Kan, R.; Tian, S. Numerical Investigation of Heat Transfer in a High Aspect Ratio Double Wall Channel with Pin Fin and Jet Array Impingement. In ASME Turbo Expo 2016: Turbomachinery Technical Conference and Exposition; American Society of Mechanical Engineers: New York, NY, USA, 2016. [Google Scholar] [CrossRef]
  54. Weigand, B.; Spring, S. Multiple Jet Impingement—A Review. Heat Transf. Res. 2011, 42, 101–142. [Google Scholar] [CrossRef]
  55. Zuckerman, N.; Lior, N. Jet Impingement Heat Transfer: Physics, Correlations, and Numerical Modeling. Adv. Heat Transf. 2006, 39, 565–631. [Google Scholar] [CrossRef]
  56. Barata, J.M.M.; Durão, D.F.G. Laser-Doppler Measurements of Impinging Jet Flows through a Crossflow. Exp. Fluids 2004, 36, 665–674. [Google Scholar] [CrossRef]
  57. Geers, L.F.G. Multiple Impinging Jet Arrays: An Experimental Study on Flow and Heat Transfer. Ph.D. Thesis, Delft Technical University, Delft, The Netherlands, 2004. [Google Scholar]
  58. Obot, N.T.; Trabold, T.A. Impingement Heat Transfer within Arrays of Circular Jets: Part 1—Effects of Minimum, Intermediate, and Complete Crossflow for Small and Large Spacings. J. Heat Transf. 1987, 109, 872–879. [Google Scholar] [CrossRef]
  59. ANSYS Fluent Fluid Simulation Software. Available online: https://www.ansys.com/products/fluids/ansys-fluent (accessed on 25 November 2022).
  60. Huang, H.; Sun, T.; Zhang, G.; Li, D.; Wei, H. Evaluation of a Developed SST K-ω Turbulence Model for the Prediction of Turbulent Slot Jet Impingement Heat Transfer. Int. J. Heat Mass Transf. 2019, 139, 700–712. [Google Scholar] [CrossRef]
  61. Wienand, J.; Riedelsheimer, A.; Weigand, B. Numerical Study of a Turbulent Impinging Jet for Different Jet-To-Plate Distances Using Two-Equation Turbulence Models. Eur. J. Mech. B/Fluids 2017, 61, 210–217. [Google Scholar] [CrossRef]
  62. Li, W.; Ren, J.; Hongde, J.; Ligrani, P. Assessment of Six Turbulence Models for Modeling and Predicting Narrow Passage Flows, Part 1: Impingement Jets. Numer. Heat Transf. Part A Appl. 2015, 69, 109–127. [Google Scholar] [CrossRef]
  63. Dutta, R.; Dewan, A.; Srinivasan, B. Comparison of Various Integration to Wall (ITW) RANS Models for Predicting Turbulent Slot Jet Impingement Heat Transfer. Int. J. Heat Mass Transf. 2013, 65, 750–764. [Google Scholar] [CrossRef]
  64. Jaramillo, J.E.; Pérez-Segarra, C.D.; Rodriguez, I.; Oliva, A. Numerical Study of Plane and Round Impinging Jets Using RANS Models. Numer. Heat Transf. Part B Fundam. 2008, 54, 213–237. [Google Scholar] [CrossRef]
  65. Hofmann, H.M.; Kaiser, R.; Kind, M.; Martin, H. Calculations of Steady and Pulsating Impinging Jets—An Assessment of 13 Widely Used Turbulence Models. Numer. Heat Transf. Part B Fundam. 2007, 51, 565–583. [Google Scholar] [CrossRef]
  66. Wang, S.J.; Mujumdar, A.S. A Comparative Study of Five Low Reynolds Number K–ε Models for Impingement Heat Transfer. Appl. Therm. Eng. 2005, 25, 31–44. [Google Scholar] [CrossRef]
  67. Behnia, M.; Parneix, S.; Durbin, P.A. Prediction of Heat Transfer in an Axisymmetric Turbulent Jet Impinging on a Flat Plate. Int. J. Heat Mass Transf. 1998, 41, 1845–1855. [Google Scholar] [CrossRef]
  68. Craft, T.J.; Graham, L.J.W.; Launder, B.E. Impinging Jet Studies for Turbulence Model Assessment—II. An Examination of the Performance of Four Turbulence Models. Int. J. Heat Mass Transf. 1993, 36, 2685–2697. [Google Scholar] [CrossRef]
  69. Shih, T.-H.; Liou, W.W.; Shabbir, A.; Yang, Z.; Zhu, J. A New k-ϵ Eddy Viscosity Model for High Reynolds Number Turbulent Flows—Model Development and Validation. Comput. Fluids 1995, 24, 227–238. [Google Scholar] [CrossRef]
  70. Jongen, T. Simulation and Modeling of Turbulent Incompressible Flows. Ph.D. Thesis, EPF Lausanne, Lausanne, Switzerland, 1992. [Google Scholar]
  71. Wolfshtein, M. The Velocity and Temperature Distribution in One-Dimensional Flow with Turbulence Augmentation and Pressure Gradient. Int. J. Heat Mass Transf. 1969, 12, 301–318. [Google Scholar] [CrossRef]
  72. Chen, H.C.; Patel, V.C. Near-Wall Turbulence Models for Complex Flows Including Separation. AIAA J. 1988, 26, 641–648. [Google Scholar] [CrossRef]
  73. Kader, B. Temperature and Concentration Profiles in Fully Turbulent Boundary Layers. Int. J. Heat Mass Transfer 1981, 24, 1541–1544. [Google Scholar] [CrossRef]
  74. Cadek, F.F. Fundamental Investigation of Jet Impingement Heat Transfer. Ph.D. Thesis, University of Cincinnati, Cincinnati, OH, USA, 1968. [Google Scholar]
  75. Gardon, R.; Akfirat, J.C. The Role of Turbulence in Determining the Heat-Transfer Characteristics of Impinging Jets. Int. J. Heat Mass Transf. 1965, 8, 1261–1272. [Google Scholar] [CrossRef]
  76. Merci, B.; Vierendeels, J.; De Langhe, C.; Dick, E. Numerical simulation of heat transfer of turbulent impinging jets with two-equation turbulence models. Int. J. Numer. Methods Heat Fluid 2003, 13, 110–132. [Google Scholar] [CrossRef]
  77. Coussirat, M.; van Beeck, J.; Mestres, M.; Egusguiza, E.; Buchlin, J.-M.; Escaler, X. Computational fluid dynamics modeling of impinging gas-jet systems: I. Assessment of eddy viscosity models. J. Fluids Eng. 2005, 127, 691–703. [Google Scholar] [CrossRef]
  78. Tepe, A.Ü.; Uysal, Ü.; Yetişken, Y.; Arslan, K. Jet Impingement Cooling on a Rib-roughened Surface Using Extended Jet Holes. Appl. Therm. Eng. 2020, 178, 115601. [Google Scholar] [CrossRef]
  79. Taslim, M.E.; Bakhtari, K.; Liu, H. Experimental and Numerical Investigation of Impingement on a Rib-Roughened Leading-Edge Wall. In Proceedings of the ASME Turbo Expo, Atlanta, GA, USA, 16–19 June 2003. [Google Scholar] [CrossRef]
  80. Rao, Y. Jet Impingement Heat Transfer in Narrow Channels with Different Pin Fin Configurations on Target Surfaces. J. Heat Transf. 2018, 140, 7. [Google Scholar] [CrossRef]
Figure 1. Confined, submerged 2D single air jet impingement problem: (a) solution domain; (b) Cartesian mesh.
Applsci 13 11260 g001
Figure 2. Local Nu number distributions on the target plate calculated on four meshes with various resolutions.
Applsci 13 11260 g002
Figure 3. Comparison of the local Nu number distribution on the target plate predicted by CFD on grid M4 with experimental data [74,75].
Applsci 13 11260 g003
Figure 4. Novel CMJICS design: (a) seven CP-CGV pairs in hexagonal configuration; (b) section view of a CP-CGV pair.
Applsci 13 11260 g004
Figure 5. Solution domain and grid: (a) solution domain and boundary conditions; (b) grid with triangular prism layers near walls and tetrahedra in the bulk of the solution domain.
Applsci 13 11260 g005
Figure 6. For a Dp/D of 3.5, overall Q ˙ according to Hp/D at various jet Re numbers.
Applsci 13 11260 g006
Figure 7. For D p / D of 3.5 , Q ˙ / Q ˙ o according to H p / D at various jet R e numbers.
Applsci 13 11260 g007
Figure 8. For D p / D of 3.5 , N u ¯ number according to H p / D at various jet R e numbers.
Applsci 13 11260 g008
Figure 9. For D p / D of 3.5 , the N u ¯ / N u ¯ o according to H p / D at various jet R e numbers.
Applsci 13 11260 g009
Figure 10. For Dp/D of 3.5, Nu number contour plots in the top view and unrolled views of the lateral faces of the CPs, at various jet Re numbers, for Hp/D of (a) 4.5; (b) 4; (c) 3; (d) 2.5; (e) 2; (f) 1.5; (g) 1; (h) flat target plate.
Applsci 13 11260 g010
Figure 11. For Dp/D of 3.5, velocity magnitude contour plots in a planar section through the axes of the CPs at various jet Re numbers, for Hp/D of (a) 4.5; (b) 4; (c) 3; (d) 2.5; (e) 2; (f) 1.5; (g) 1; (h) flat target plate.
Applsci 13 11260 g011
Figure 12. For Dp/D of 3.5, ΔP according to Hp/D at various jet Re numbers.
Applsci 13 11260 g012
Figure 13. For Dp/D of 3.5, the PEC according to Hp/D at various jet Re numbers.
Applsci 13 11260 g013
Figure 14. For Hp/D of 4, the effect of Dp/D on the overall Q ˙ at various jet Re numbers.
Applsci 13 11260 g014
Figure 15. For H p / D of 4 , Q ˙ / Q ˙ o according to D p / D at various jet R e numbers.
Applsci 13 11260 g015
Figure 16. For H p / D of 4 , N u ¯ number according to D p / D at various jet R e numbers.
Applsci 13 11260 g016
Figure 17. For H p / D of 4 , the N u ¯ / N u ¯ o according to D p / D at various jet R e numbers.
Applsci 13 11260 g017
Figure 18. For Hp/D of 4, Nu number contour plots in the top view of the system and in the unrolled views of the lateral faces of the CPs, at various jet Re numbers, for Dp/D of (a) 2; (b) 2.5; (c) 3; (d) 3.5; (e) 4.
Applsci 13 11260 g018
Figure 19. For Hp/D of 4, velocity magnitude contour plots in a planar section through the axes of the CPs at various jet Re numbers, for Dp/D of (a) 2; (b) 2.5; (c) 3; (d) 3.5; (e) 4.
Applsci 13 11260 g019
Figure 20. For Hp/D of 4, the PEC according to Dp/D at various jet Re numbers.
Applsci 13 11260 g020
Table 1. The geometric and operating parameters of CMJICS and the thermo-physical properties of air.
ParameterDescriptionValue
D Jet diameter at the orifice exit4 mm
R e Jet Reynolds number at the orifice exit5000, 10,000, 15,000, 20,000
H p / D Dimensionless protrusion height1, 1.5, 2, 2.5, 3, 4, 4.5
D p / D Dimensionless protrusion diameter2, 2.5, 3, 3.5, 4
P r Prandtl number of air0.71
T ¯ J Jet temperature at the orifice exit293 K
T ¯ w Target plate temperature303 K
ρ Air density1.204 k g / m 3
u ¯ J Jet velocity at the orifice exit u ¯ J = ( R e μ ) / ( ρ D )
I Jet turbulence intensity at the orifice exit I = 0.16   R e ( 1 / 8 )
μ Dynamic viscosity of air1.813 × 10−5  k g / m s
Q ˙ Overall heat transfer rate (W)
Q ˙ o Heat transfer rate of the flat plate (W)
Q ˙ / Q ˙ o Heat transfer ratio
N u ¯ Area-averaged Nusselt number
N u ¯ o Area-averaged Nusselt number of the flat target plate
N u ¯ / N u ¯ o Ratio of the area-averaged Nusselt numbers
P E C Performance evaluation criterion
Table 2. Performance comparison of various CMJICSs.
LiteratureProtrusion Type Q ˙ / Q ˙ o N u ¯ / N u ¯ o P E C
Present studyCylindrical protrusion with guide vanes1.650.606–0.9171.05–1.519
Brakmann et al. [26]Detached ribs11.04-
Brakmann et al. [48] Cubic micro pin fins1.34–1.420.89–0.94-
Wan et al. [51]Square pin fins1.25–1.350.784–0.82-
Taslim et al. [79]Horseshoe shaped ribs1.27--
Rao [80]Full-height pin fins-1.323-
Mini pin fins-1.747-
Disclaimer/Publisher’s Note: The statements, opinions and data contained in all publications are solely those of the individual author(s) and contributor(s) and not of MDPI and/or the editor(s). MDPI and/or the editor(s) disclaim responsibility for any injury to people or property resulting from any ideas, methods, instructions or products referred to in the content.

