Article

Determining the Macrostructural Stability of Compacted Wyoming Bentonites by a Disaggregation Method

by
José Manuel Moreno-Maroto
1,*,
Óscar Merlo
2,
Joel Torres-Serra
2,
Jacinto Alonso-Azcárate
3,
Mark Tyrer
4 and
Vicente Navarro
2
1
Department of Geology and Geochemistry, Faculty of Sciences, Autonomous University of Madrid, Cantoblanco, 28049 Madrid, Spain
2
Geoenvironmental Group, Universidad de Castilla-La Mancha, Avda. Camilo José Cela 2, 13071 Ciudad Real, Spain
3
Department of Physical Chemistry, Faculty of Environmental Sciences and Biochemistry, Universidad de Castilla-La Mancha, Avenida Carlos III, s/n, 45071 Toledo, Spain
4
Collegium Basilea (Institute of Advanced Study), Hochstrasse, 51, 4053 Basel, Switzerland
*
Author to whom correspondence should be addressed.
Appl. Sci. 2023, 13(20), 11159; https://doi.org/10.3390/app132011159
Submission received: 10 September 2023 / Revised: 7 October 2023 / Accepted: 9 October 2023 / Published: 11 October 2023
(This article belongs to the Special Issue Mechanical Properties and Engineering Applications of Special Soils)

Abstract

:
The use of compacted bentonites in radioactive waste repository barriers is a relevant application of geoenvironmental engineering. The on-site structural characteristics of the bentonites determine the performance and integrity of the barrier. The present work addresses the adaptation of the standardized sand equivalent shaking method for the controlled disaggregation of Wyoming bentonite specimens prepared at low, medium, and high compaction. The evolution of the macrostructural units’ size distribution was determined by sieving at different shaking times. The stability of the compacted material increases with dry density. However, if enough energy is applied in the disaggregation process, the size distribution of the macrostructural units after disaggregation has the same characteristics as that of the uncompacted starting material, regardless of the applied degree of compaction. Since the disaggregation rate is a function of the aggregation level (compaction), it follows that compaction energy is not only spent on reducing porosity but also on generating more stable macrostructural units. These findings pave the way for future research with different materials and test conditions (compaction, moisture, etc.). In addition, the proposed shaking method is adaptable and could also be used in other sectors, such as agriculture, to determine the structural stability of natural soils.

1. Introduction

The word “bentonite” was first applied by Knight [1] to refer to Cretaceous clay deposits with highly plastic properties. The term was later redefined by Ross and Shannon [2] to designate those clays produced by in situ alteration of volcanic ashes, with smectite as the main component. Subsequently, Grim [3] defined bentonite as that clay with a significant smectite content (specifically montmorillonite), regardless of its origin; this is the most widely adopted definition, especially in the radioactive waste management community.
The problem of radioactive waste storage leads to the need to find safe containment systems that prevent the release and diffusion of radionuclides from inside the containers to the surrounding environment. In this sense, due to their physicochemical properties, such as low hydraulic conductivity, high specific surface, remarkable ion exchange capacity, swelling behavior, and high sorption capacity [4], the use of an Engineered Barrier System (EBS) integrating compacted bentonite has aroused a strong interest in the last decades as a sealing element [5]. Thus, the main function of the bentonite barrier is to protect and isolate the canister containing the residues from any type of geochemical or physical stress to maintain its integrity. In addition, the bentonite works as a hydraulic barrier that limits the mobilization of radioactive contaminants that could be released if the metallic container fails. These functions can be enhanced through blending with other materials, such as sand-bentonite mixtures [4].
Among the different types of bentonites, the application of MX-80 or Wyoming bentonites (in honor of their origin) has been the object of study in several countries in EBS for radioactive repositories [6]. Particularly well known are the studies being carried out to use this type of bentonite as a barrier in KBS-3-type repositories, a deposition concept considered in Sweden and Finland. The waste is sealed inside metal canisters, which are deposited in vertical holes constructed at great depth, surrounded by compacted MX-80 bentonite, which, either alone or mixed with other filler materials, is also used to seal the access tunnel [5].
Although the properties of EBS-bentonites have been extensively studied, no systematic procedure has been proposed to characterize the stability of their macrostructure. Stability is considered to critically affect the long-term integrity of the compacted bentonite, which has motivated its experimental characterization by in situ tests such as the BeLLT (Bentonite Large Scale Load Test) and the BLL (Bentonite Long-Term Load Test), both within the framework of the full-scale emplacement experiment [7,8]. These studies show a growing interest in defining a laboratory-scale protocol that ensures repeatability and contributes quantitative data toward the assessment of the effect of compaction on macrostructural stability.
Several methods are currently in use, the suitability of which depends on the processes to be studied, since each methodology can provide different information [9,10]. The most common methods are based on measuring the size distribution of the fragments or, more generally, macrostructural units (MU) generated after the application of a disaggregation effort. Such effort can be applied internally (e.g., by wetting) and also externally (mechanical agitation, tillage, etc.), resulting in the fracturing of the MU. Accordingly, the failure areas provide relevant information about the voids, pores, and solid phases of the soil and its MU [11].
Most of these fragmentation procedures are performed in two stages. First, the MU are generated, and subsequently, a sieving measurement is performed. Two different methods of sieving are considered: dry sieving (the process is carried out in the air) and wet sieving (the process is carried out in water or another liquid) [12,13]. In general, stability is determined by the relationship between the particle size distribution obtained between a short and long sieving time, so that the main source of disaggregation energy is that provided during the sieving process itself, particularly in dry methods [12]. This last procedure has a negative effect on the reproducibility and repeatability of the tests since, in most cases, it is not possible to know the disaggregation energy applied, to which should be added the fact that neither the equipment nor the protocol itself is subject to any standardization.
In the present study, a novel method is proposed using a standardized mechanical shaker, widely adopted in geotechnical laboratories, to perform a controlled disaggregation of the bentonite macrostructure. The MU size distribution (MUSD) generated for each shaking time is determined by dry sieving analysis, allowing the evolution of the disaggregation pattern of a soil to be studied as the disaggregation energy increases. Therefore, from a practical point of view, the objective is to develop a method and parameters that can be easily implemented to better understand the compaction and dis/aggregation processes in soils, which have a strong impact on their technological properties.

2. Materials and Methods

2.1. Basic Characterization of the Wyoming Bentonite

The same Wyoming bentonite used by Navarro et al. [14] was used in this work, which has similar properties to the material identified as Be-Wy-BT007-1-Sa-R by Kiviranta and Kumpulainen [15]; see Table 1. The plastic limit (PL) was determined by the standard thread-rolling method, while the liquid limit (LL) was obtained by the Multipoint Method of the Casagrande cup percussion test [16]. The plasticity index (PI) and LL data were used to classify the material according to the USCS [17,18]. Moreover, the Moreno-Maroto and Alonso-Azcaráte [19,20] classification systems [21] were applied to estimate its maximum toughness, Tmax.

2.2. New Method of Controlled Disaggregation

The objective of the present study is to compare how compaction affects the particle size distribution of the MU after shaking, in this case using compacted Wyoming bentonite specimens. However, the purpose is not only to develop a method applicable to this kind of clay but to any soil. For this reason, the protocol is based on basic equipment in geotechnical and materials laboratories, such as the mechanical shaker included in the sand equivalent test UNE-EN 933-8:2012+A1:2015/1M [22]. The procedure for the new disaggregation method is explained below.
Duplicate samples of height 17 mm and diameter 49.5 mm, with a water content of 10%, were prepared with target dry density values of 1.40 g/cm3, 1.60 g/cm3, and 1.80 g/cm3. The compliance of the target density was checked by accurately determining the weight and dimensions of each specimen once prepared. Similarly, part of the excess material was used to check its moisture content by oven drying at 105 ± 5 °C.
Then, each cylindrical specimen (Figure 1a) was cut radially in successive subdivisions into 8 portions (Figure 1b). These portions were placed inside a plastic test tube presenting standardized dimensions of 430 mm in height and 32 mm in inner diameter [22] and closed with a rubber stopper. Next, the test tube containing the sample was coupled to the mechanical shaker (Figure 1c) and put into operation to start the agitation process. According to the sand equivalent test standard, the device used exerted a horizontal, periodic, and sinusoidal rectilinear motion of 200 ± 10 mm amplitude with a period of 1/3 s. To know the gradual evolution in the size of the MU, the process was interrupted after 5 s, 10 s, 20 s, 30 s, 1 min, 2 min, 5 min, and 10 min. For those specimens in which relatively large pieces were still observed, additional shaking times were applied, up to 50 min. At each shaking time, the material was extracted from the test tube and passed through sieves with apertures (in mm) of 10, 5, 2, 1.25, 0.63, 0.40, 0.16, and 0.080 (Figure 1d). Once the weights of each fraction were recorded, their particle size distribution was determined to analyze the change in the size of the MU as the shaking time increased and thus determine the disaggregation pattern.

3. Results and Discussion

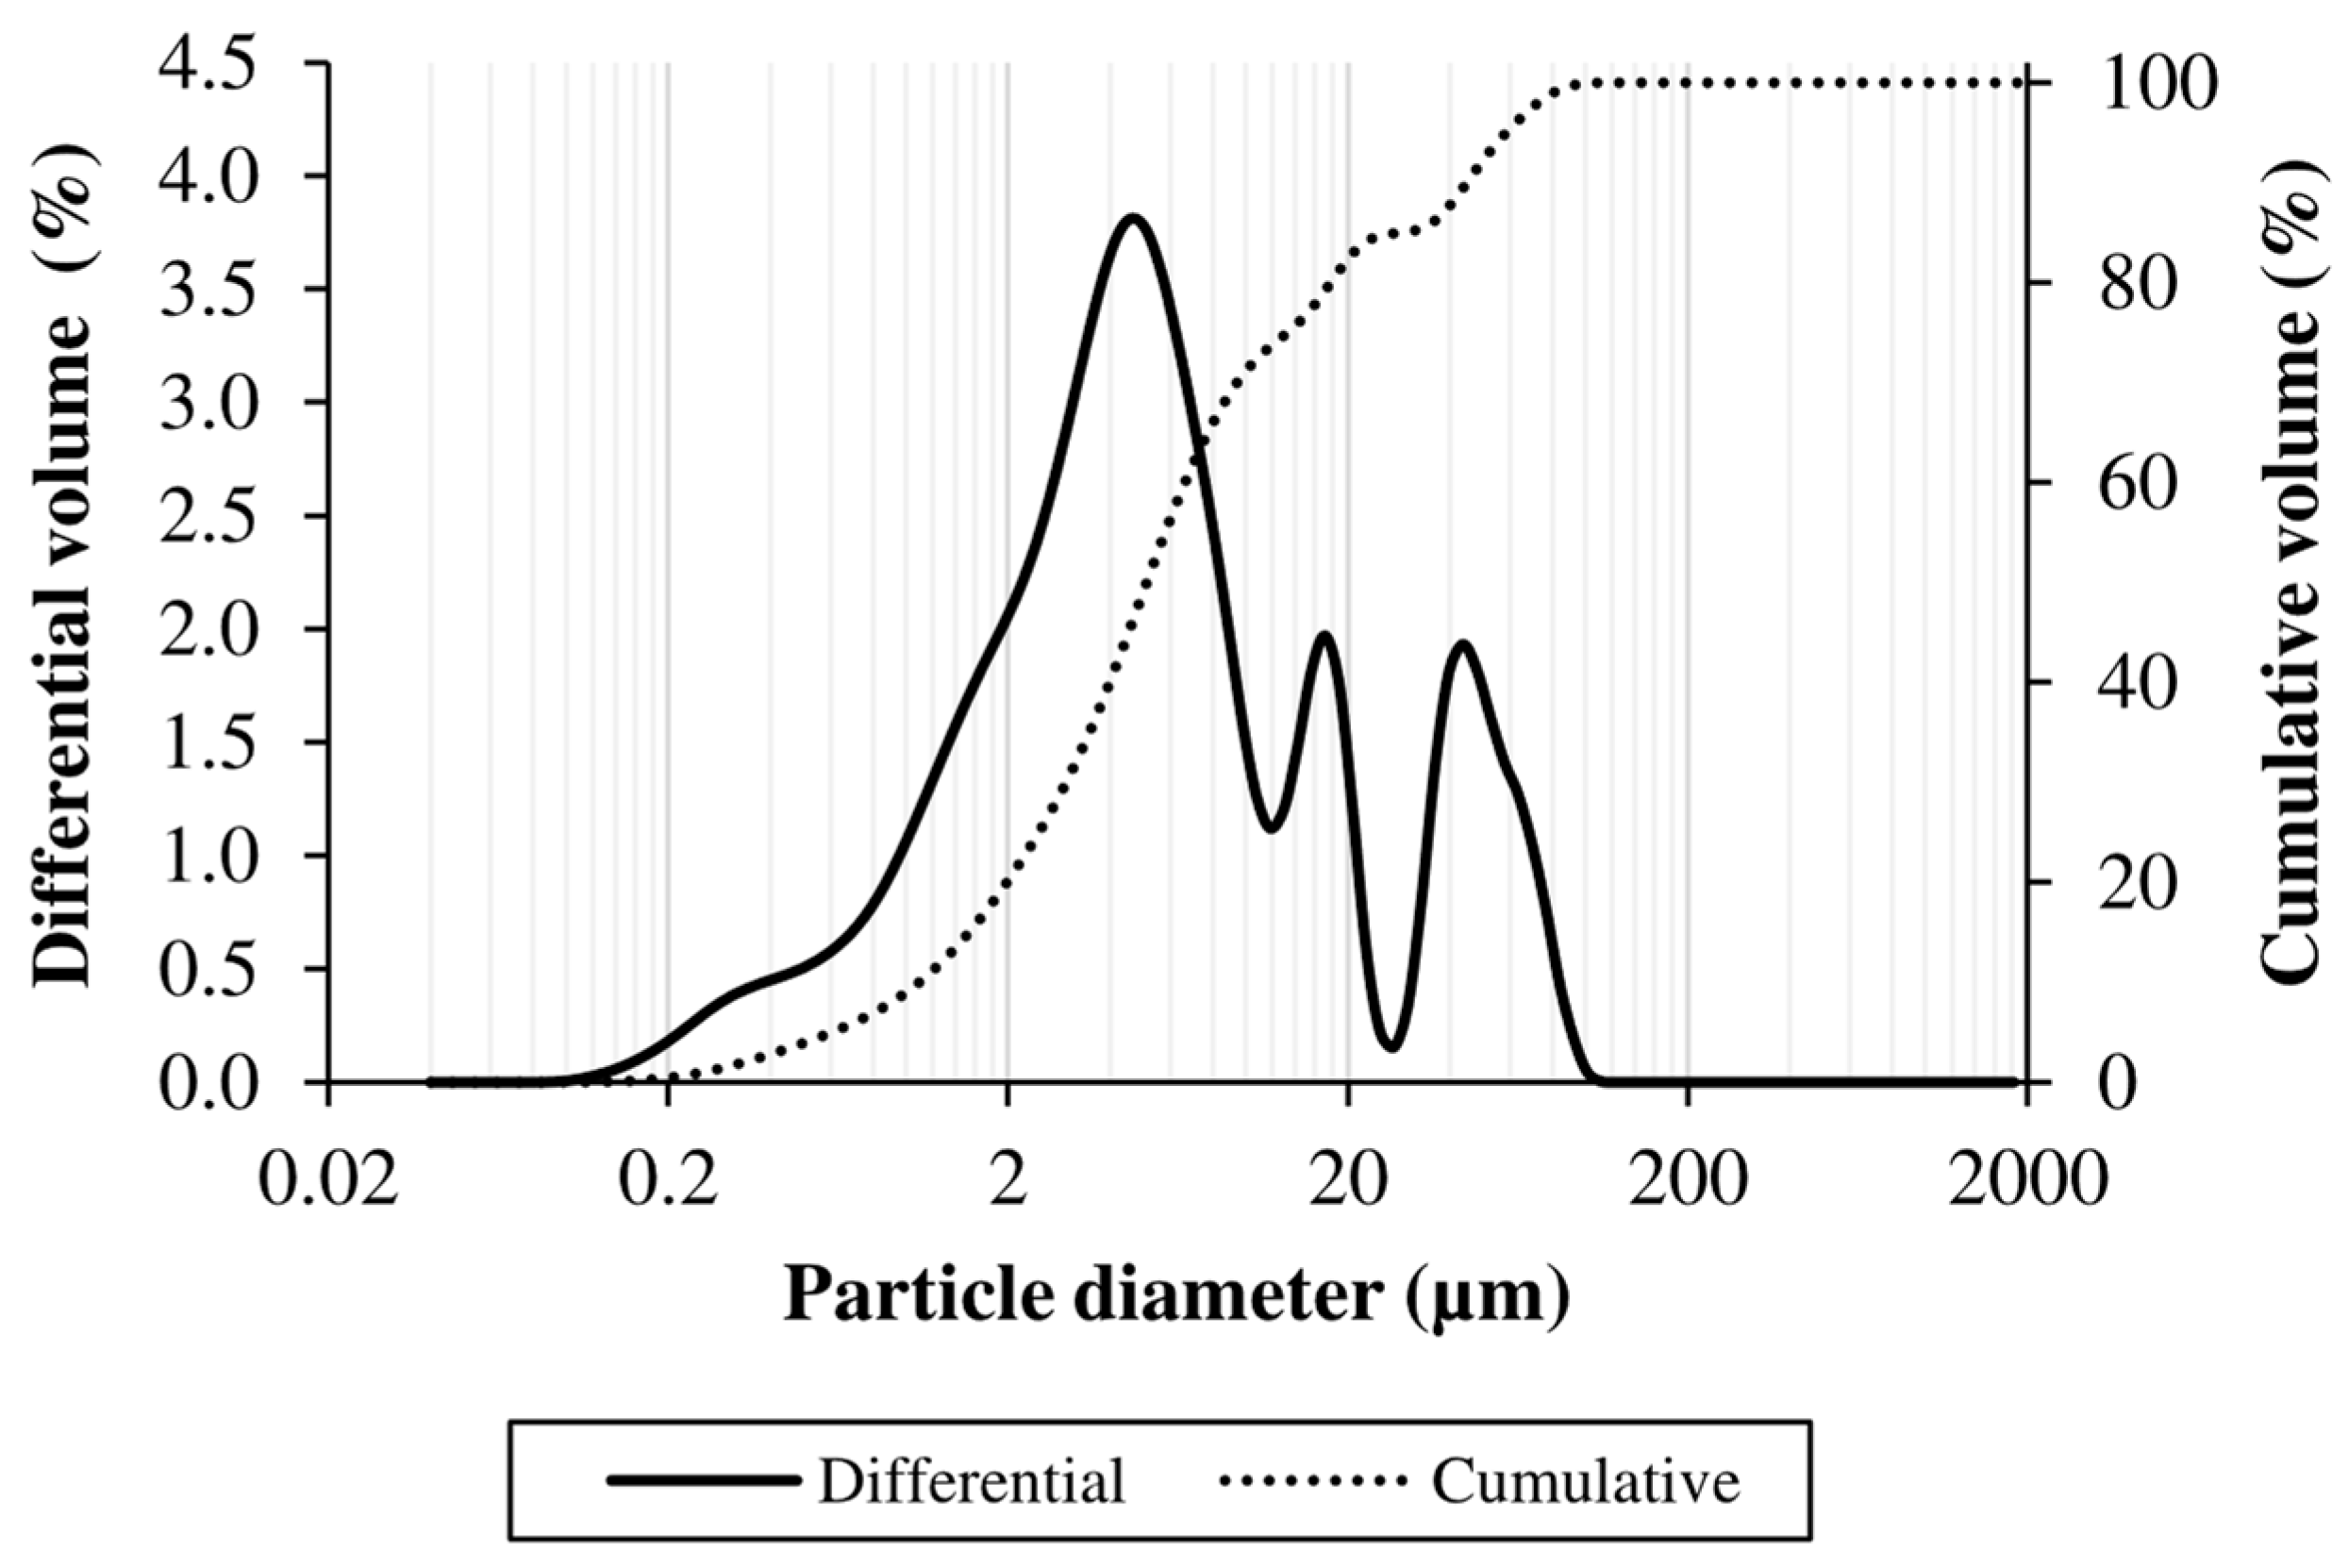
3.1. Characterization of the Bentonite under Study

The particle size distribution of the total sample after disaggregation shows a trimodal differential curve (Figure 2), having a main peak with its maximum at approximately 5 µm, together with two secondary peaks with maxima at around 17 µm and 44 µm. The fineness of the bentonite studied is evident from the data in Table 2, with a d50 (the particle size below which 50% of the material is contained) of 5 µm and an average particle size of 13 µm.
The water content of the Wyoming bentonite as received was w = 4.5%. The results of the Atterberg limits (Table 2) show the high plasticity of the material, which would be in accordance with its fineness (Figure 2 and Table 2), mineralogy, and exchange cations since the sample is predominantly sodic montmorillonite (see Table 1). The LL around 460 is consistent with the value of 400 usually found in the literature [23]. The PL value of 43.4 is also in the same order as those reported in the literature [24]. Although the PL has a relatively high value, the large difference with respect to the LL is evidenced by a very high PI value of 416.3. This causes a PI/LL ratio above 0.9, typical of materials with exceptional plastic and toughness properties, showing a Tmax > 70 kJ/m3 when values for ordinary clays are usually around 20–30 kJ/m3 [20]. Therefore, as expected, the material studied is classified as CH according to both USCS [17,18] and Moreno-Maroto and Alonso-Azcárate [20] criteria, with a “clay” type texture.
The high toughness mentioned above is also demonstrated in the flow index of the LL test, the value of the slope obtained in the flow line after plotting the water content (w) versus the number of blows (NB) required to close the groove. According to Casagrande [25], soils with high toughness (especially those rich in very active minerals, such as montmorillonite) have lower flow index values than most “normal” soils. In the case of the Wyoming bentonite studied, the flow line (Ln w = Ln 487.21 − 0.018·Ln NB; coefficient of determination R2 = 0.911) presented a flow index of −0.018, much lower than the average values reported in the literature based on the statistical study of a large number of soil samples. Thus, the ASTM D 4318-17e1 standard [16] considers that the most probable flow index is −0.121, while Spanish standard UNE 103103:1994 [26], based on the determinations of Eden [27], gave a value of −0.117. Therefore, the differences observed with respect to the Wyoming bentonite investigated here, together with the PI/LL ratio, demonstrate its high toughness.

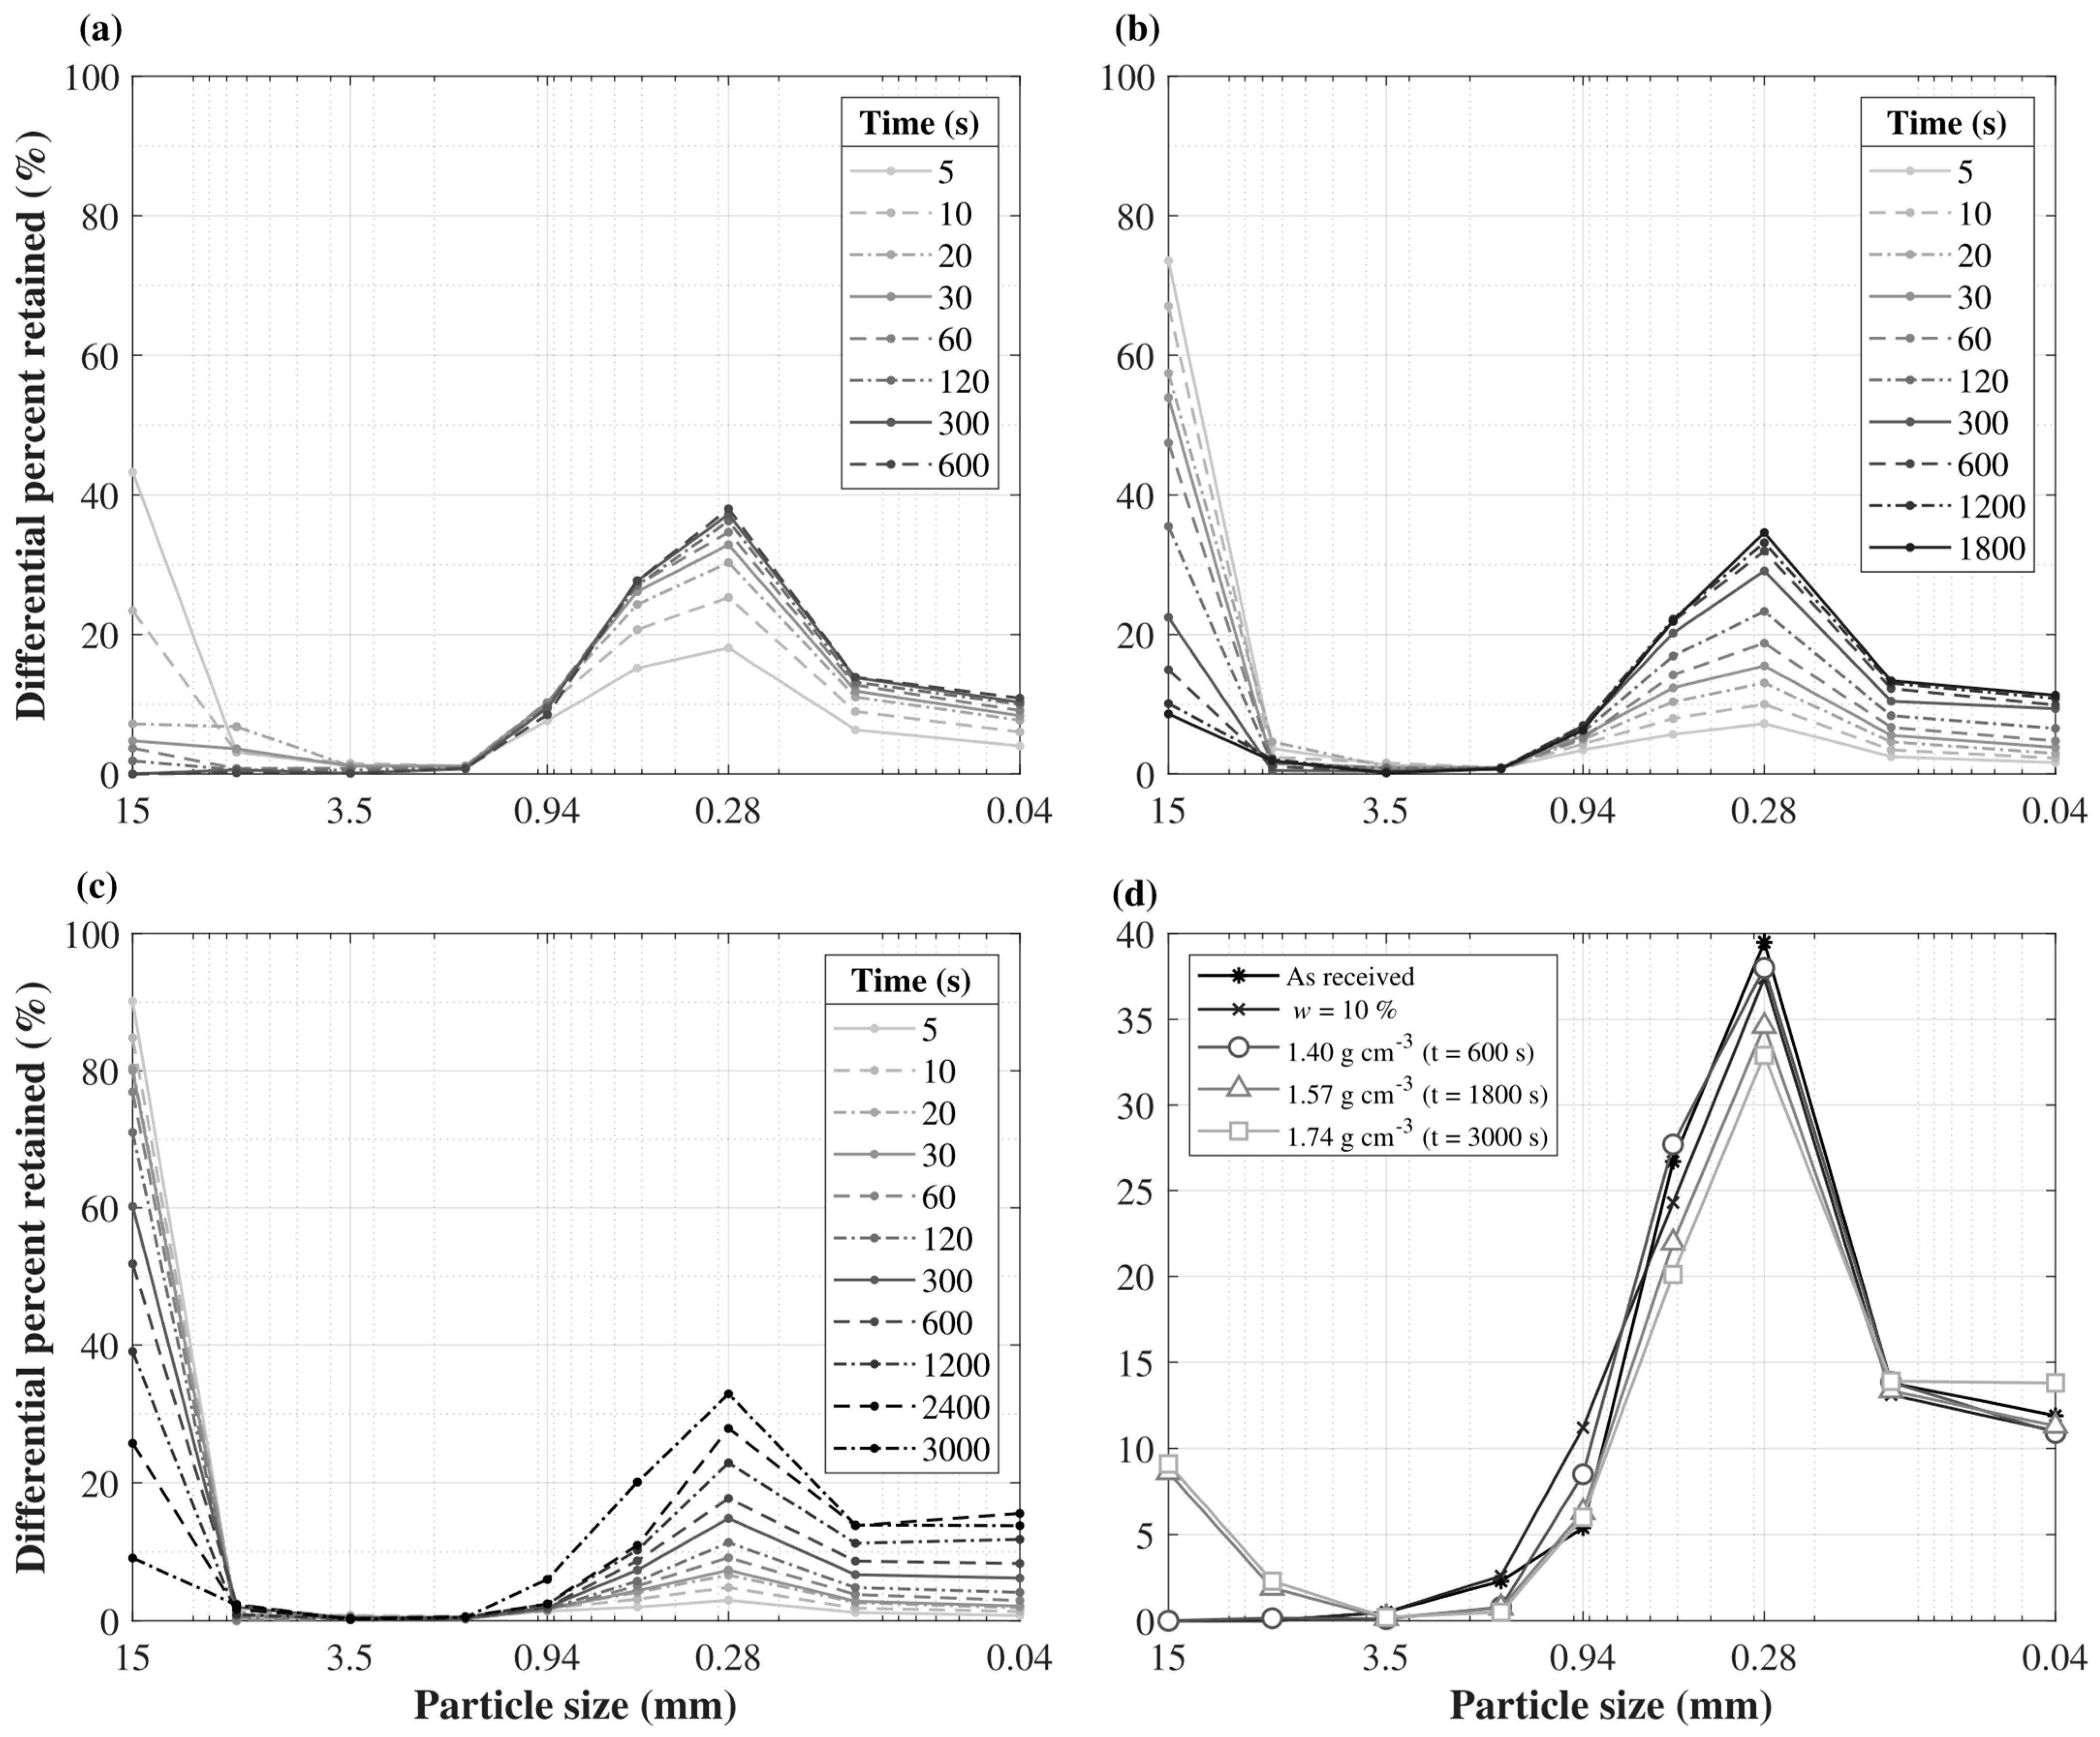
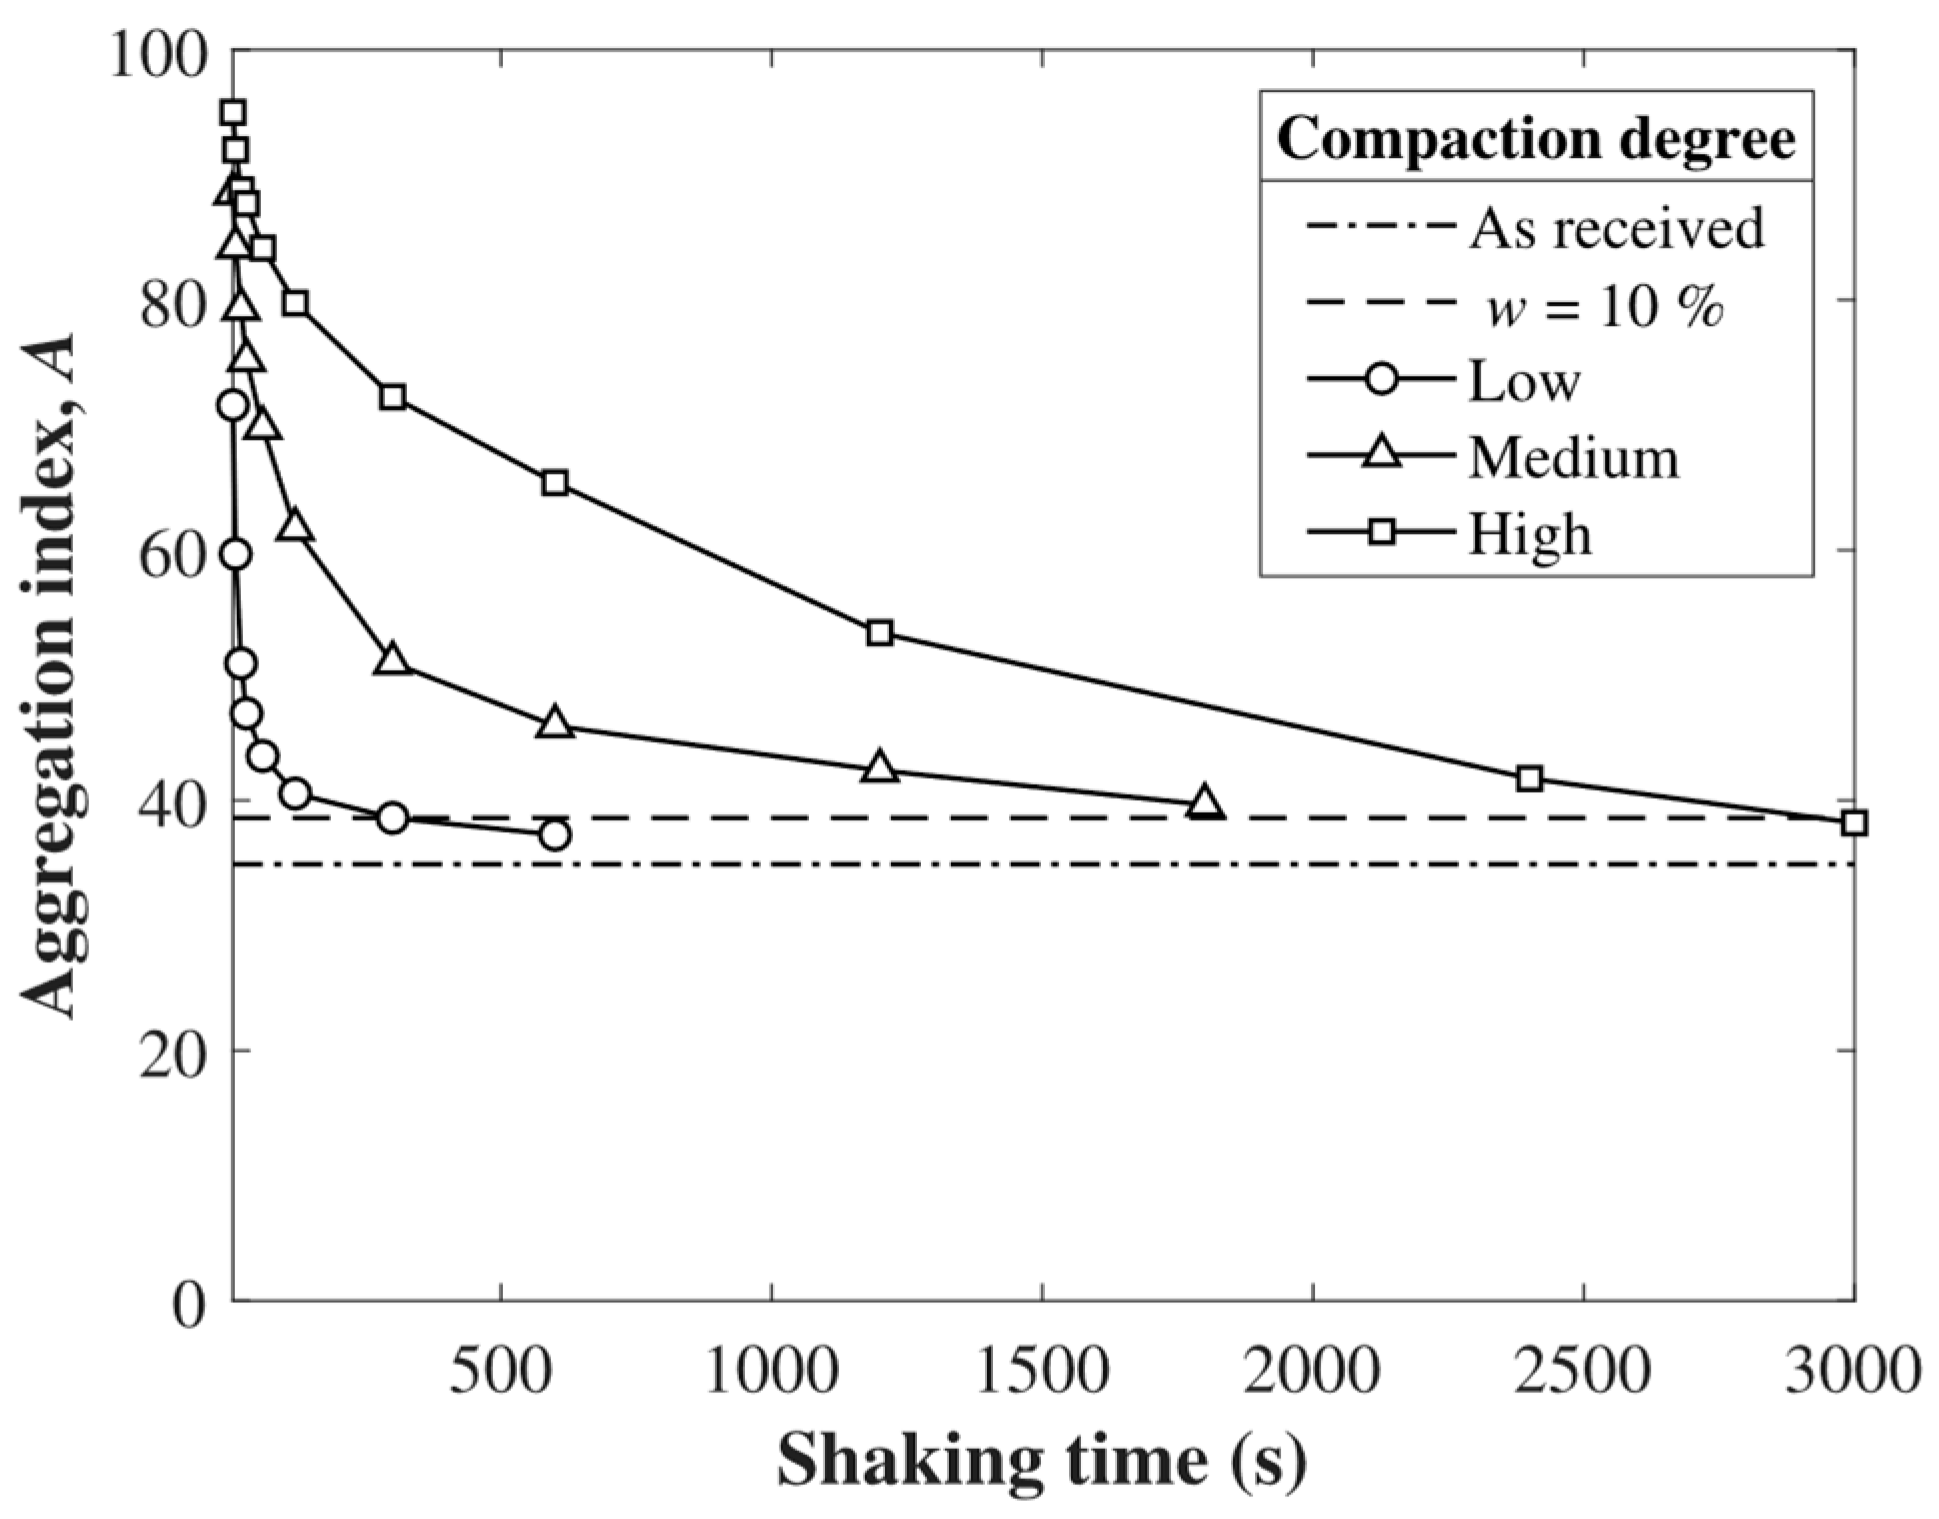
3.2. Stability of the Macrostructure

The particle size distributions of the uncompacted bentonite, both as received (w = 4.5%) and with a water content of w = 10%, are presented in Table 3. The data are displayed in differential terms, whereby each numerical value represents the percentage by weight of MU with a size between the sieve aperture interval (class interval) indicated in each case. Nine class intervals and class marks are defined for the aggregate size ranges according to the sieve apertures where the different MU fractions are retained.
The evolution of MU size distribution (MUSD) as a function of shaking time and degree of compaction (dry density) is depicted in Figure 3 and detailed as Supplementary Material in Table S1.
Taking as reference the target dry densities for each degree of compaction, i.e., 1.40 g/cm3 (low compaction), 1.60 g/cm3 (medium compaction), and 1.80 g/cm3 (high compaction), similar dry densities were obtained for the low and medium compaction energies for which the target density was reached (Table S1). In the case of the highest compaction, one specimen presented a dry density of 1.72 g/cm3 and another of 1.75 g/cm3, and it was not possible to obtain higher density values because the compressive capacity of the press was exceeded. However, both samples showed similar disaggregation behavior. Although more tests with different types of soils are advisable, the results in Table S1 point to the satisfactory repeatability of the shaking process. Taking this into account, to avoid redundancies in the discussion of the results, the average results for each pair of compaction conditions are analyzed, considering an average density of 1.74 g/cm3 for the high compaction test.
The first aspect to be addressed is the analysis of how disaggregation of the samples evolves. The testing time is a first indicator of this parameter; therefore, in the less compacted specimens, it was 600 s (10 min), while in the medium and highly compacted samples, it was extended to 1800 s (30 min) and 3000 s (50 min), respectively. An appropriate and simple way to study the disaggregation evolution in quantitative terms is to focus on the fraction in class interval 1 (wt.% retained by the 10 mm sieve), which includes the original pieces prepared as shown in Figure 1d. Structural stability at low compaction (ρd = 1.40 g/cm3) is relatively poor (fast disaggregation), since MU with a diameter equal to or greater than 10 mm crumbled completely before 5 min of shaking (Figure 3a). Conversely, when the compaction energy increases, the structural stability (slow disaggregation) increases as well. Specimens with a dry density of 1.57 g/cm3 still had around 10 wt.% in class interval 1 after 30 min of shaking (Figure 3b). In the case of the dry density of 1.74 g/cm3, after 40 min of shaking, there was still about 25 wt.% of MU with a size equal to or larger than 10 mm (Figure 3c), which demonstrates the outstanding mechanical stability of the highly compacted specimens. Shaking times over 3000 s (50 min) were required in this case for the disaggregation patterns to exhibit a stationary distribution of the MU sizes.
The differential MU size distribution curves (dMUSD) at the analyzed shaking times also explain the disaggregation evolution; see Figure 4, where frequencies are associated with the class marks defined in Table 3. With respect to dMUSD in uncompacted conditions, specimens with a higher degree of compaction showed slower time evolution of their dMUSD, as expected. Interestingly, as shown in Figure 4d, the dMUSD of all compacted specimens tended to conform to the uncompacted bentonite curves (both as received and with w = 10%) as shaking time increased.
Figure 5 at t = 5 s compares for the nine class intervals the associated frequencies to the dry uncompacted material and the three dry densities. MUSD evolved during the compaction process. Even though initially the main class interval was number 7 (0.40 mm–0.16 mm), its predominance decreased as the compaction loading (and dry density) increased. Class intervals 6 to 9 (between 0.63 mm and <0.08 mm) showed analogous behavior, whereas number 1 (>10 mm) became progressively dominant. For the bentonite considered, compaction developed for growing MU sizes larger than 0.40 mm, the maximum size of interval 7, which prevailed in uncompacted conditions.
Therefore, an aggregation index A is defined
A = i = 1 n F i f i
where n = 9 are the class intervals considered, Fi is the frequency associated with the i-th class, and fi is a function defined by
f i = { 1 , if d min , i d REF 0 , otherwise
where dmin,i is the minimum size of the i-th size interval (respectively equal to 10, 5, 2, 1.25, 0.63, and 0.40 mm) for class intervals 1 to 6, with classes with a minimum size larger or equal to dREF = 0.40 mm taken as the reference size. The ability of index A to summarize the increase in aggregation with compaction is illustrated in Figure 6.
A is also a good estimator of the disaggregation process. This process, illustrated in Figure 3, is described in more detail in Figure 5, which shows for each dry density the evolution of the frequencies associated with the size intervals considered. The frequency of larger aggregates was reduced as shaking time advanced, eventually reaching a steady state. Remarkably, classes 2 to 5 (between 10 mm and 0.63 mm) showed low frequencies throughout the disaggregation process, which may be interpreted as metastable transition MU sizes.
The tendency of dMUSD to reach a stationary state around the initial size distribution in uncompacted conditions is depicted in Figure 7. The evolution of A during the shaking test is represented for each dry density, and the values of A for the uncompacted samples, dry and wet, are shown for reference. As the shaking progressed, A decreased.
For higher dry densities (when a higher amount of compaction energy is applied to the system), the aggregates formed seem to be more stable, resulting in a lower rate of disaggregation. The compaction process not only appears to involve the closure of the original interaggregate voids; however, the exerted energy is increasingly translated into the formation of structural elements with greater stability.
Based on all these results and the aggregation index, A, it is demonstrated that the proposed method is easily executable, standardizable, and useful to better understand the compaction and aggregation processes in soils, which ultimately generate a strong impact on their technological properties.

4. Conclusions

The present work has addressed the investigation of the macrostructural characteristics of compacted bentonites by means of a new method based on the adaptation of the equipment used in the standardized sand equivalent test. According to the results reflected in the previous sections, the following conclusions can be drawn:
-
The characterization tests carried out not only confirmed the extraordinary plasticity but also demonstrated the toughness of the Wyoming bentonite.
-
The use of the shaking method on specimens prepared at different degrees of compaction, ρd = 1.40 g/cm3 (low compaction), ρd = 1.57 g/cm3 (medium compaction), and ρd = 1.74 g/cm3 (high compaction) has shown that there is a direct relationship between the dry density and the stability of the compacted bentonite, so that the higher the density, the longer the shaking time required to disaggregate the material.
-
Although the required shaking times are different, regardless of the initial dry density, the final differential MU size distribution (dMUSD) obtained after disaggregation is equal to that of the initial uncompacted material.
-
Although the same final dMUSDs are obtained, as the disaggregation rate is a function of the level of aggregation (compaction), it becomes clear that the compaction energy is not only spent on reducing porosity but also on generating more stable MU.
-
An aggregation index, A, has been defined in Equations (1) and (2) to synthesize the aggregation information, favoring the comparison of states and the characterization of the soil disaggregation process.
-
The satisfactory repeatability suggests that the new disaggregation method could potentially be standardized, especially considering that the equipment is very common in geotechnical laboratories.
-
Although the disaggregation method developed in this work has been applied to compacted bentonite specimens, its use on other types of samples, such as natural or agricultural soils, could also be investigated in the future. Likewise, the method presents certain flexibility, being able to adapt the energy and/or the disintegration medium according to convenience.
Considering all the above points, this work paves the way for future research not only in the field of geotechnical engineering in bentonites and/or compacted soils but also in other fields where the proposed method may be beneficial.

Supplementary Materials

The following supporting information can be downloaded at: https://www.mdpi.com/article/10.3390/app132011159/s1. Table S1. Differential aggregate size distribution (wt.% retained on sieve) for each shaking time and for each degree of compaction used in the Wyoming bentonite studied.

Author Contributions

Conceptualization: J.M.M.-M. and V.N.; methodology: J.M.M.-M., Ó.M. and V.N.; validation, J.M.M.-M. and V.N.; formal analysis: J.M.M.-M. and V.N.; investigation: J.M.M.-M. and Ó.M.; resources: V.N.; writing—original draft preparation: J.M.M.-M. and V.N.; writing—review and editing: J.M.M.-M., J.T.-S., J.A.-A., M.T. and V.N.; visualization: J.M.M.-M., J.T.-S. and V.N.; supervision: J.M.M.-M. and V.N.; project administration: V.N.; funding acquisition: V.N. All authors have read and agreed to the published version of the manuscript.

Funding

This study was funded by the Junta de Comunidades de Castilla-La Mancha and the European Regional Development Fund (European Union) through project SBPLY/19/180501/000222.

Data Availability Statement

The data and material of this research will be made available to anyone who requests them by e-mail to the corresponding author.

Conflicts of Interest

The authors declare no conflict of interest.

References

  1. Knight, W.C. Bentonite. Eng. Min. J. 1898, 66, 491. [Google Scholar]
  2. Ross, C.S.; Shannon, E.V. The minerals of bentonite and related clays and their physical properties. J. Am. Ceram. Soc. 1926, 9, 77–96. [Google Scholar] [CrossRef]
  3. Grim, R.E. Clay Mineralogy, 2nd ed.; International Series in the Earth and Planetary Sciences; McGraw-Hill Book Company: New York, NY, USA, 1968. [Google Scholar]
  4. Wilson, J.; Savage, D.; Bond, A.; Watson, S.; Pusch, R.; Bennett, D. Bentonite–A Review of Key Properties, Processes and Issues for Consideration in the UK Context; Report QRS-1378ZG-1.1 for the Nuclear Decommissioning Authority; Quintessa Limited: Harwell, UK, 2011. Available online: https://rwm.nda.gov.uk/publication/bentonite-a-review-of-key-properties-processes-and-issues-for-consideration-in-the-uk-context/ (accessed on 20 October 2021).
  5. Sellin, P.; Leupin, O.X. The use of clay as an engineered barrier in radioactive waste management—A review. Clay Clay Miner. 2013, 61, 477–498. [Google Scholar] [CrossRef]
  6. Liu, L. Permeability and expansibility of sodium bentonite in dilute solutions. Colloids Surf. A Physicochem. Eng. Asp. 2010, 358, 68–78. [Google Scholar] [CrossRef]
  7. Garitte, B.; Kober, F.; Müller, H.R.; Köhler, S.; Weber, H.; Blechschmidt, I. Stability of compacted bentonite blocks and block pedestals under changing climatic conditions in tunnels and long-term loads. In Proceedings of the 6th International Conference on Clays in Natural and Engineered Barriers for Radioactive Waste Confinement, Brussels, Belgium, 23–26 March 2015. [Google Scholar] [CrossRef]
  8. Papafotiou, A.; Senger, R.; Li, C.; Singh, A.; Garitte, B.; Müller, H.; Marschall, P. A prediction-evaluation approach to the full-scale emplacement experiment (FE) in Mont Terri. In Multiple Roles of Clays in Radioactive Waste Confinement; Norris, S., Neeft, E.A.C., Van Geet, M., Eds.; Geological Society: London, UK, 2018; p. 482. [Google Scholar] [CrossRef]
  9. Dexter, A.R. Physical properties of tilled soils. Soil Till. Res. 1997, 43, 41–63. [Google Scholar] [CrossRef]
  10. Elliott, E.T.; Heil, J.W.; Kelly, E.F.; Monger, H.C. Soil structure and other physical properties. In Standard Soil Methods for Long-term Ecological Research; Robertson, G.P., Coleman, D.C., Bledsoe, C.S., Sollins, P., Eds.; Oxford University Press, Inc.: New York, NY, USA, 1999; pp. 74–88. [Google Scholar]
  11. Kay, B.D.; Angers, D.A. Soil structure. In Handbook of Soil Science; Summer, M.E., Ed.; CRC Press: Boca Raton, FL, USA, 1999; pp. 229–276. [Google Scholar]
  12. Díaz-Zorita, M.; Perfect, E.; Grove, J.H. Disruptive methods for assessing soil structure. Soil Till. Res. 2002, 64, 3–22. [Google Scholar] [CrossRef]
  13. Moncada, M.P.; Gabriels, D.; Cornelis, W.; Lobo, D. Comparing aggregate stability tests for soil physical quality indicators. Land Degrad. Develop. 2013, 26, 843–852. [Google Scholar] [CrossRef]
  14. Navarro, V.; Yustres, Á.; Asensio, L.; De la Morena, G.; González-Arteaga, J.; Laurila, T.; Pintado, X. Modelling of compacted bentonite swelling accounting for salinity effects. Eng. Geol. 2017, 223, 48–58. [Google Scholar] [CrossRef]
  15. Kiviranta, L.; Kumpulainen, S. Quality Control and Characterization of Bentonite Materials; Posiva Oy, Working Report 2011-84. 2011. Available online: https://inis.iaea.org/collection/NCLCollectionStore/_Public/43/108/43108887.pdf (accessed on 20 October 2021).
  16. ASTM D 4318-17e1; Standard Test Methods for Liquid Limit, Plastic Limit, and Plasticity Index of Soils. ASTM International: West Conshohocken, PA, USA, 2017. [CrossRef]
  17. Casagrande, A. Classification and identification of soils. ASCE Trans. 1948, 113, 901–930. [Google Scholar] [CrossRef]
  18. ASTM D2487-17e1; Standard Practice for Classification of Soils for Engineering Purposes (Unified Soil Classification System). ASTM International: West Conshohocken, PA, USA, 2017. [CrossRef]
  19. Moreno-Maroto, J.M.; Alonso-Azcárate, J. Plastic Limit and Other Consistency Parameters by a Bending Method and Interpretation of Plasticity Classification in Soils. Geotech. Test. J. 2017, 40, 467–482. [Google Scholar] [CrossRef]
  20. Moreno-Maroto, J.M.; Alonso-Azcárate, J. What is clay? A new definition of “clay” based on plasticity and its impact on the most widespread soil classification systems. Appl. Clay Sci. 2018, 161, 57–63. [Google Scholar] [CrossRef]
  21. Moreno-Maroto, J.M.; Alonso-Azcárate, J.; O’Kelly, B.C. Review and critical examination of fine-grained soil classification systems based on plasticity. Appl. Clay Sci. 2021, 200, 105955. [Google Scholar] [CrossRef]
  22. UNE-EN 933-8:2012+A1:2015/1M; Ensayos para Determinar las Propiedades Geométricas de los Áridos. Parte 8: Evaluación de los Finos. Ensayo del Equivalente de Arena. Asociación Española de Normalización y Certificación: Madrid, Spain, 2016.
  23. Lajudie, A.; Raynal, J.; Petit, J.C.; Toulhoat, P. Clay-based materials for engineered barriers: A review. MRS Online Proc. Libr. 1996, 353, 221–230. [Google Scholar] [CrossRef]
  24. Gómez-Espina, R.; Villar, M.V. Geochemical and mineralogical changes in compacted MX-80 bentonite submitted to heat and water gradients. Appl. Clay Sci. 2010, 47, 400–408. [Google Scholar] [CrossRef]
  25. Casagrande, A. Research on the Atterberg limits of soils. Public Roads 1932, 13, 121–136. [Google Scholar]
  26. UNE103103:1994; Determinación del Límite Líquido de un Suelo por el Método del Aparato de Casagrande. Asociación Española de Normalización y Certificación: Madrid, Spain, 1994.
  27. Eden, W.J. Use of a One-Point Liquid Limit Procedure. In Papers on Soils 1959 Meetings; ASTM International: West Conshohocken, PA, USA, 1960. [Google Scholar] [CrossRef]
Figure 1. Method proposed in this study of controlled soil disaggregation from a compacted specimen: (a) initial compacted Wyoming bentonite specimen; (b) specimen cut into eight portions; (c) standardized shaking machine and test tube with the material inside; (d) passing through sieves after shaking.
Applsci 13 11159 g001
Figure 2. Particle size distribution of the Wyoming bentonite studied.
Applsci 13 11159 g002
Figure 3. Evolution of the frequencies associated with the nine size intervals defined in Table 3 with respect to shaking time for average dry densities of: (a) 1.40 g/cm3; (b) 1.57 g/cm3; and (c) 1.74 g/cm3.
Applsci 13 11159 g003
Figure 4. Differential aggregate size distribution, dMUSD (wt.% retained on sieve), for each shaking time and for each degree of compaction (average values) used in the bentonite studied: (a) 1.40 g/cm3; (b) 1.57 g/cm3; (c) 1.74 g/cm3. Graph (d) compares the dMUSD for the maximum shaking time employed in each case with respect to the dMUSD of the samples before compaction, both as received and at moisture content w = 10 wt.%.
Applsci 13 11159 g004
Figure 5. Associated frequencies to the dry uncompacted material and the three dry densities in the nine class intervals considered in this study as a function of shaking time, see Table 3.
Applsci 13 11159 g005
Figure 6. Evolution of the aggregation index, A, with the degree of compaction. The value of A at 1.10 g/cm3 corresponds to the average dry density of the undisturbed sample.
Applsci 13 11159 g006
Figure 7. Evolution of the aggregation index, A, for each compaction degree during the shaking tests.
Applsci 13 11159 g007
Table 1. Properties of the tested bentonite [15].
Mineralogical Compositionwt.%
Smectite87.6
Plagioclase4.2
Quartz4.1
K-feldspar1.8
Rutile0.9
Calcite0.6
Pyrite0.6
Illite0.1
Other Propertieseq/kg
Cation Exchange Capacity0.84
Na+ (eq/kg)0.58
Ca2+ (eq/kg)0.25
Mg2+ (eq/kg)0.08
K+ (eq/kg)0.02
Table 2. Characterization results of the Wyoming bentonite under study.
Particle Size Distribution (µm)Plasticity
d10d50 d90Mean>63 µm (%)LLPLPIPI/LLTmax (kJ/m3)Class. Plasticity/Texture
1.15.144.913.13.8459.743.4416.30.9173.5CH/Clay
Table 3. Differential aggregate size distribution for the Wyoming bentonite studied both as received and at moisture content w = 10% prior to compaction.
Aggregate SizeClassClass MarksBentonite (wt.%)
(mm)Intervals(mm)As Receivedw = 10%
>101150.00.0
5–1027.50.00.0
2–533.50.50.5
1.25–241.632.32.6
0.63–1.2550.945.411.2
0.40–0.6360.5226.724.3
0.16–0.4070.2839.537.4
0.08–0.1680.1213.813.1
<0.0890.0411.911.0
Disclaimer/Publisher’s Note: The statements, opinions and data contained in all publications are solely those of the individual author(s) and contributor(s) and not of MDPI and/or the editor(s). MDPI and/or the editor(s) disclaim responsibility for any injury to people or property resulting from any ideas, methods, instructions or products referred to in the content.

