Article

Development of a Spatial Heterodyne Terahertz Raman Spectrometer with Echelle Gratings

1
Changchun Institute of Optics, Fine Mechanics and Physics, Chinese Academy of Sciences, Changchun 130033, China
2
University of Chinese Academy of Sciences, Beijing 100049, China
*
Authors to whom correspondence should be addressed.
Appl. Sci. 2023, 13(2), 967; https://doi.org/10.3390/app13020967
Submission received: 18 December 2022 / Revised: 2 January 2023 / Accepted: 4 January 2023 / Published: 11 January 2023

Abstract

:
This paper introduces an echelle grating spatial heterodyne terahertz Raman spectrometer (E-SHTRS) that combines echelle gratings with spatial heterodyne terahertz Raman spectroscopy technology by replacing the gratings on the interference arms with 36 gr/mm echelle gratings. Echelle gratings are characterized by high diffraction levels and multi-level simultaneous diffraction capability, giving the E-SHTRS higher spectral resolution and a wider detection band range than the conventional spectrometer. The system’s resolution can reach 1.37 cm−1. The spectral detection range of a single level of the proposed system is 701.61 cm−1. A total of nine levels are used in the system, giving a total spectral detection range of 6314 cm−1. Using this system, terahertz Raman spectroscopy of organic acid samples was performed, some food additives and medicines were measured, and a salicylic acid aqueous solution was measured with a minimum measurable concentration of 0.01 mol/L. In addition, the samples were detected over a wide band (10–5131 cm−1) to acquire more complete spectral information. These experiments verify that the E-SHTRS offers good detection performance and has a wide range of possible applications, including a theoretical support role in food safety, biomedicine, environmental protection, and other fields.

1. Introduction

Terahertz Raman signals, which are also known as low-wavenumber Raman signals, are Raman signals within the frequency range of 10–333 cm−1 (0.3–10 THz). Unlike traditional Raman signals, signals in the terahertz Raman frequency band can characterize interactions between molecules [1], the resolution of isomers [2], and other information. Therefore, the study of terahertz Raman spectroscopy can play a role that complements traditional Raman spectroscopy detection. The strong absorption of terahertz waves by water means that it is difficult for traditional terahertz spectroscopy to realize the detection of aqueous environments and aqueous solution samples [3]. Terahertz Raman spectroscopy can solve this problem without the need for expensive terahertz sources and detectors [4]. The range of light sources and detectors available for the proposed system is broader and less expensive than that used in traditional systems. Previously, we proposed the use of a spatial heterodyne structure for terahertz Raman band signal detection of materials (SHTRS) [5], which offered the advantages of no requirement for an incident slit, no moving parts, high optical flux, good stability, and a strong anti-interference capability. However, the spatial heterodyne spectrometer suffers from a problem whereby its spectral resolution and detection range are mutually restrictive; therefore, our next research goal is to solve the contradiction between the two.
Since the initial proposal of the echelle grating [6], it has been used in spectral instruments numerous times because of advantages including lower groove density, finer groove shapes, higher diffraction levels, high dispersion, high resolution, and high diffraction efficiency when compared with traditional gratings. Harrison designed the echelle grating spectrometer by using the echelle grating as the main dispersion element. The resolution of this spectrometer was twice as high as that of the concave grating spectrometer that offered the highest resolution at that time, and the spectral detection speed was five times higher [7]. Harlander et al. replaced the diffraction grating in the common optical path structure of a spatial heterodyne spectrometer (SHS) with an 18 gr/mm echelle grating. The spectral resolution of the resulting system was 2.4 cm−1, and the spectral detection width was four times greater than that of the original system. Lawler et al. [8] designed a wide-band, high-resolution Mark 1 SHS system that could realize a spectral detection range of five times the number of waves and a spectral resolution power of approximately 700,000. Their system used a double echelle grating mode. Qiu et al. proposed the use of a combination of echelle grating and plane mirror in spatial heterodyne Raman spectroscopy (EMSHRS) to detect organic liquids, inorganic solids, and mixtures. Ultimately, the spectral detection range of a single level can reach approximately 1100 cm−1, with a spectral resolution of 1.051 cm−1 [9].
We combined the echelle gratings with spatial heterodyne terahertz Raman spectroscope technology. Because of the high diffraction level of the echelle grating, the system has a strong spectral resolution ability. In addition, the echelle grating has a large number of diffraction levels, which means that the system’s spectral detection band is wide. Therefore, the echelle grating spatial heterodyne terahertz Raman spectrometer (E-SHTRS) will have both high spectral resolution and wide spectral detection band characteristics.

2. Principles

2.1. Basic Principles

A schematic diagram of the E-SHTRS is shown in Figure 1. When compared with the spatial heterodyne terahertz Raman spectrometer, the original 150 gr/mm gratings on the two interference arms were replaced with 36 gr/mm echelle gratings. The excitation light source used was a 532 nm laser, and the output beam was adjusted using a linear variable filter with a power range from 0 to 400 mW. Beam prism 1 divides the beam into two beams with a ratio of 9:1, where 10% of the beam is used for path adjustment of the instrument, and 90% of the laser light is purified by the bandpass filter (BPF) group. Next, beam collimation is carried out by the collimation lens group. The collimated beam is then reflected toward the objective lens by the Bragg notch filter (BNF) and reflector 3. The sample is placed at the focus of the objective lens. The beam that is incident on the sample will then excite Raman scattering light. The intensity of Raman scattering light can be expressed as:
I R = K P σ I L
where K is the proportional coefficient related to the temperature and other conditions; P is the number of scattering molecules; σ is the wavenumber of the incident light; and IL is the intensity of the incident light. The Raman scattering light is reflected by reflector 3 and then passes through the BNF filter and the collimation lens group. During this process, a 550 nm short-pass filter is used to filter out light at wavelengths of less than 550 nm; the BNF filter is set to be tilted at a specific angle to the optical axis and is used to weaken the intensity of the Rayleigh scattering light, and the pinhole appendix is used to filter any superfluous stray light. After filtering and purification, the Raman scattering light is incident on beam prism 2, and is then divided into two light beams of equal intensity. These two light beams are incident on prism 1 and 2 on the two interference arms at a minimum deviation angle θ P .
θ P = a r c s i n n s i n 2 / α
Here, α is the angle of the prism and n is the refractive index of the prism. Subsequently, the two beams incident on two echelle gratings with a Littrow angle θ L to the optical axis.
For the same incident wavefront, after being bundled through beam splitter 2, the angle between the two emitted wavefronts is 2 γ ; then, the grating equation for the two interference arms is:
d sin θ L + sin θ L γ = m λ
where m is the grating diffraction level, d is the grating constant, and λ is the incident wavelength. The resulting interference light is received by a charge-coupled device (CCD) detector after passing through the stop. When the incident light wavelength happens to be the Littrow wavelength, the diffracted light passing through the grating will return along its original path, the angle of the outgoing wavefronts of the two beams is zero, and the spatial frequency can be expressed as:
f x = 2 σ s i n γ 4 σ σ L t a n θ L
To suppress ghost lines, the grating on one interference arm can be rotated around the X-axis by ε / 2 , and then, in the grating diffraction direction (i.e., the Z-axis direction), the intensity of the two-dimensional interference fringe can be expressed as:
I x = 0 B σ 1 + c o s 8 π σ σ L x t a n θ L + σ y ε d σ
The optical path difference (OPD) between the two diffraction wavefronts is:
O P D = 4 x t a n θ L  
O P D m a x = 4 x m a x t a n θ L = 2 W s i n θ L  
Here, W is the grating width. The spectral resolution can be expressed as:
δ σ = 1 2 O P D m a x = 1 4 W s i n θ L
According to the Nyquist sampling theorem, the spectral detection range is dependent on the number of sampling points N of the interferogram:
Δ σ = N 2 δ σ
It can be seen from the above that the spectral resolution is inversely proportional to the spectral detection range. The proposed development direction of the SHS is to solve the restriction problem between these properties. Therefore, this paper proposes the use of the echelle grating, which can improve the spectral resolution and increase the spectral detection range by using its multi-level diffraction characteristics. At the same time, a mutually limiting relationship also exists between the spectral resolution and the maximum field angle:
Ω m a x = 2 π λ δ σ
In this work, prisms are used to widen the field of view, so as to increase the light flux while obtaining high spectral resolution [10].

2.2. Calibration Theory

During actual experimental operation, system errors and certain external error factors mean that the actual spectral resolution and the spectral detection range of the system differ from the theory. Therefore, it is necessary to use a calibration light source to calibrate the system. Unlike the traditional grating spatial heterodyne terahertz Raman spectrometer, the echelle grating has multi-level diffraction characteristics, and each level has its own shining angle; therefore, when calibrating the system, the different levels must be calibrated separately. In this work, we selected a standard mercury lamp as the light source. Based on the known characteristic wavelength and the number of corresponding fringes, the Littrow wavelength of the instrument can be obtained as:
λ L , j = f 2 f 1 f 2 / λ 1 f 1 / λ 2 , j = m , m 1 , m 2 , j 1
where λ L , j are the corresponding Littrow wavelengths of the different levels, λ 1 and λ 2 are the characteristic wavelengths of the known calibration light source, and f 1 and f 2 are the corresponding fringe numbers of these two known wavelengths. Accordingly, the Littrow angle can be determined using:
θ L = a r c s i n j λ L , j 2 d , j = m , m 1 , m 2 , j 1
In this case, the system resolution can be expressed as:
δ σ = 1 / λ 1 1 / λ 2 f 1 f 2
The spectral detection range of the system is expressed as:
Δ σ M = M Δ σ = M N 8 W s i n θ L
The formula used to calculate the signal-to-noise ratio (SNR) of the instrument system is as follows:
S N R = η A Ω 2 N I δ σ T
Among these parameters, η is the optical efficiency, A is the effective system area, Ω is the field of view of the system, and I is the photon intensity per unit area per unit wavelength per unit angle, and is proportional to the laser power. T is the total integration time.

3. Experiment

To verify the performance of the optical path system, a variety of samples were measured experimentally in this work. These materials included samples of organic acids, food additives, medicines, and aqueous solutions. Some of the samples were also measured over a wide band.

3.1. Calibration

First, a standard mercury lamp was used to perform spectral calibration and thus obtain the spectral resolution and the spectral detection range of the system. Figure 2a presents the obtained interferogram of mercury lamp, and Figure 2b presents the positions of the characteristic wavelengths of mercury lamp in two-dimensional spatial frequency. Since the characteristic wavelengths of 576.961 nm and 579.067 nm are close to each other and on the same level (m = 14), these two wavelengths are taken as known wavelengths. Figure 2c presents the fringe diagram corresponding to the characteristic wavelengths of mercury lamp at the spatial frequency after Fourier transform, from which the fringe numbers corresponding to the characteristic wavelengths can be found. The resolution of the system can be calculated according to Equation (13) as being equal to 1.37 cm−1, and the spectral detection range of a single level is 701.61 cm−1. Nine diffraction levels are used in this work, and the total spectral detection range reaches 6314 cm−1.

3.2. Organic Acids Measurement Results

We measured the terahertz Raman bands of four organic acid samples. Figure 3a,b compare the spectral curves for salicylic acid and benzoic acid samples when using the 36 gr/mm echelle gratings (red curve) and 150 gr/mm gratings (green curve). When the 36 gr/mm echelle gratings are used, the characteristic peaks are steeper, the full width at half maximum (FWHM) is narrower, and the resolution is significantly better than the corresponding properties of the spatial heterodyne terahertz Raman spectrometer using the 150 gr/mm gratings.
Gallic acid, which is also known as 3,4,5-trihydroxybenzoic acid and has the chemical formula C7H6O5, has anti-inflammatory, anti-mutation, and anti-oxidation biological activities [11,12], and is often used in anti-cancer, antibacterial, and other drug types. Figure 3c shows the terahertz Raman spectrum of gallic acid, and the characteristic peaks observed at 97 cm−1 (2.91 THz) and 105.6 cm−1 (3.168 THz) are characterized as the conjugated cycles of the molecules. Figure 3d shows the terahertz Raman spectrum of p-aminobenzoic acid, which is a cyclic amino acid that becomes a compound after position 4 of the benzene ring of benzoic acid is replaced with an amino group [13], and it can be used in dyes, sunscreens [14], and medicines. When compared with benzoic acid, it can be seen that it has a similar structure, but the characteristic peaks of the terahertz Raman spectra of the two materials differ significantly.

3.3. Food Additives Measurement Results

Figure 4 shows the test results from terahertz Raman spectroscopy of a variety of food additives obtained in this work. Leucine is the basic unit for protein synthesis [15], and DL-leucine is often used as a nutritional additive [16]. Figure 4a shows the terahertz Raman spectrum of DL-leucine, in which the characteristic peaks of the samples can be identified clearly at 48.67 cm−1 (1.46 THz), 56.67 cm−1 (1.7 THz), 72.33 cm−1 (2.17 THz), and 86.7 cm−1 (2.6 THz). The two characteristic peaks at 72.33 cm−1 (2.17 THz) and 86.7 cm−1 (2.6 THz) mainly represent the rotation and vibration of the hydrogen bonds in the molecular structure [17]. Figure 4b shows the terahertz Raman spectrum of DL-tartaric acid, which is commonly used as a food acid flavor agent. The characteristic peak at 40 cm−1 (1.2 THz) was generated by the interactions between the molecules, and the characteristic peak at 60.3 cm−1 (1.81 THz) represents the collective vibration of the C-C bonds and the carboxyl torsional vibration [18]. Dl-threonine is an essential amino acid used in nutritional supplements, and its terahertz Raman response is shown in Figure 4c. L-malic acid is an essential organic acid for the human body that can be obtained by extraction from fruit and represents a new generation of food souring agents. During the red wine fermentation process, the transformation from L-malic acid into L-lactic acid also determines the quality of the red wine [19]. Figure 4d shows the terahertz Raman spectrum of L-malic acid. As an unsaturated binary carboxylic acid, fumaric acid is widely used as an acidity regulator in meat processing. Figure 4e shows the terahertz Raman spectrum of fumaric acid. Glycine is one of the simplest amino acids, with chemical properties that allow it to be used in food flavorings and food preservatives. Figure 4f shows the terahertz Raman spectrum of glycine, where the characteristic peaks observed at 80 cm−1 (2.4 THz) and 84.3 cm−1 (2.53 THz) correspond to molecular vibrations [20].
Analysis of the samples’ test results, described above, verifies that the system demonstrates a high spectral resolution performance; the samples’ test results are more accurate, almost all the characteristic peaks of the samples in the terahertz Raman band can be measured, and the results can provide some theoretical support for the detection and screening of food additives.

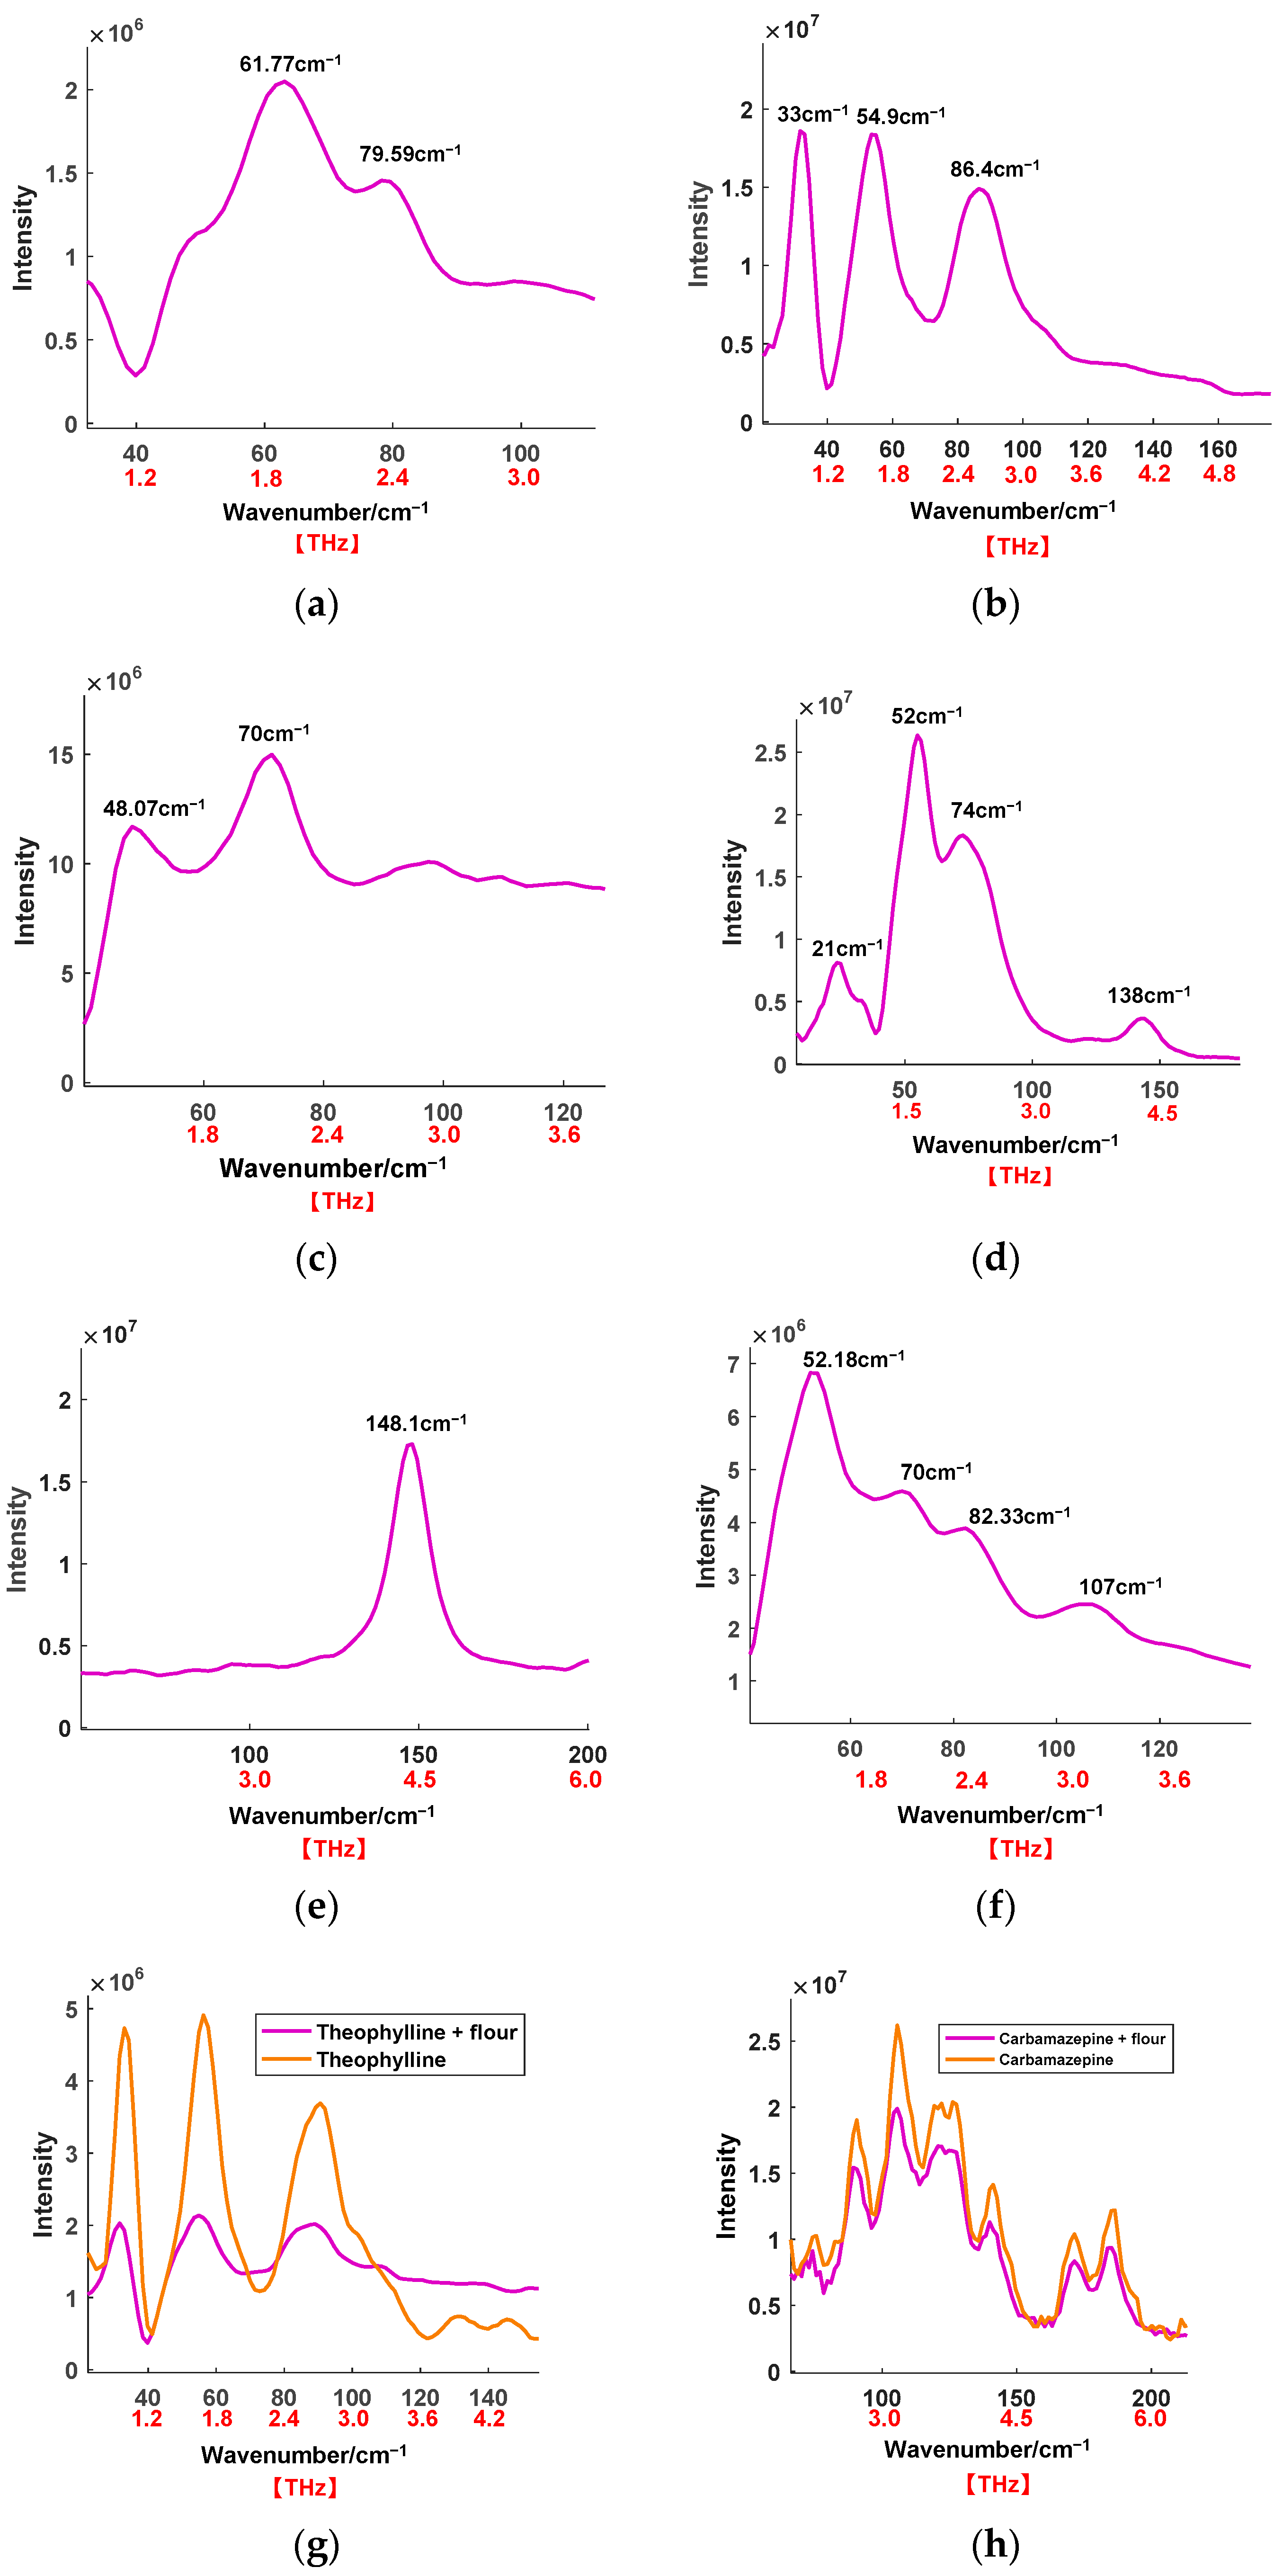
3.4. Medicines Measurement Results

In addition to food additives, we also tested medicines. Figure 5a shows the terahertz Raman spectrum of furantoin, in which the characteristic peaks of the sample at 61.77 cm−1 (1.85 THz) and 79.59 cm−1 (2.3877 THz) can be identified clearly. The sample is a class II biological agent and is mainly used to treat urinary system infections. Tylenol is used to treat colds, fevers, and postoperative analgesia, and Figure 5b shows the terahertz Raman spectrum of Tylenol, where the measured results are almost entirely consistent with the theoretical values [21]. Indomethacin is used for the treatment of arthritis and soft tissue injuries. Detection of the terahertz Raman band of indomethacin can help to determine the crystallinity of the sample [22], and its terahertz Raman spectrum is shown in Figure 5c. Ibuprofen is an antipyretic and analgesic nonsteroidal anti-inflammatory drug, and its terahertz Raman spectrum is shown in Figure 5d. We measured the characteristic peaks of this spectrum at 21 cm−1 (0.63 THz), 52 cm−1 (1.56 THz), 74 cm−1 (2.22 THz), and 138 cm−1 (4.14 THz). Detection of the terahertz Raman band of ibuprofen samples can enable characterization of the internal vibration mode of these molecules [23].
We also acquired terahertz Raman spectra for some other tablets; for example, Figure 5e shows the terahertz Raman spectrum of a cold medicine tablet, and Figure 5f shows the terahertz Raman spectrum of a painkiller tablet.
After that, we mixed samples with flour with a 1:1 ratio. Figure 5g,h show the results for theophylline and carbamazepine when mixed with flour, respectively. The figures show that the intensities of the characteristic peaks in the spectral curves for the mixed samples (pink curves) have been weakened to a certain extent, but the locations of these characteristic peaks can still be identified clearly. In addition, the sample composition can be determined based on these characteristic peaks. This indicates that when observed under the same objective conditions, the sample purity is positively correlated with the spectral intensity, in line with the Lambert–Beer law [24].

3.5. Aqueous Solution Measurement Results

Because terahertz waves are strongly absorbed by water, it is difficult to use traditional terahertz detection methods to measure aqueous solution. In this article, the spatial heterodyne terahertz Raman spectroscopy technique based on the echelle gratings is used to detect the samples of aqueous solution. Figure 6a shows the results of terahertz Raman spectroscopy detection of salicylic acid aqueous solution. It can be seen from the figure that the lowest concentration that can be measured this time can reach 0.01 mol/L, and the location of characteristic peak is consistent with the reference [25]. Figure 6b,c show the measurement results of 0.1 mol/L gallic acid aqueous solution and 0.1 mol/L indomethacin aqueous solution, respectively. The measurement results of both are consistent with the characteristic peak locations of the results measured in this article when the samples were in solid state.
To verify that the proposed system has wide spectrum detection characteristics, in addition to signal detection within the low frequency range, we also measured the wide band spectra of the samples. Figure 7a,b show the wide band spectra of benzoic acid and sulfur samples, respectively, with measured spectral detection ranges from 10 cm−1 to 5131 cm−1 (0.3–153.93 THz). The figures show that when the wide spectrum information of the sample is obtained, the low-wavenumber part of the signal is still obvious, and the locations of the characteristic peaks remain unchanged. We also performed wide band spectral detection for organic solutions, with results as shown in Figure 7c. Methanol, ethanol, and acetone were measured, and the characteristic peak positions of their respective spectral curves were all consistent with the theory. It is precisely because of the multi-level simultaneous diffraction characteristics of the echelle grating that the wide band spectra of these samples can be measured rapidly. In this case, we used the 7th to 15th levels. In fact, wider bands can be measured by simply increasing the number of levels.
We measured the SNRs of sulfur under various laser power and integration time conditions. As shown in Figure 8, under the same laser power conditions, the SNR value increased rapidly when the integration time ranged from 0 to 5 s, before subsequently entering a slow rising stage. When the integration time reached 13 s, the SNR value gradually stabilized. The SNR curve is a square root function curve, which is consistent with the theoretical SNR formula. When the laser power was 60 mW and the integration time was 31 s, the highest SNR reached 837.

4. Conclusions

In this work, echelle gratings were introduced into the spatial heterodyne terahertz Raman spectroscopy technique. Two echelle gratings with a groove density of 36 gr/mm were used, and two prisms with a top angle of 2.665° were used to broaden the field of view.
Based on the characteristics of a single level of the echelle grating with extremely high resolution and multi-level simultaneous diffraction, the system can meet the requirements for high spectral resolution and a wide spectral detection range simultaneously. In this work, samples of organic acids, food additives, medicines, and aqueous solutions were tested in the terahertz Raman band, and the terahertz Raman spectra of the samples were measured successfully. In addition, wide band spectra of organic solutions and other samples were also measured. The experiments described above prove that the system shows good performance in terms of both high spectral resolution and a wide detection band. Through experimental calculations, the spectral resolution of the system was determined to be 1.37 cm−1, which is 3.8 times that of the SHTRS (shown in Table 1), and the spectral detection range for a single level is 701.61 cm−1. Nine levels were used in this paper, and the total spectral detection range reached 6314 cm−1, which is 2.5 times that of the SHTRS. The maximum SNR of the system can reach 837.
Based on the results above, E-SHTRS demonstrates a good spectral detection performance, and can realize spectral detection for many types of samples, thus giving the method relatively wide application prospects. This method can provide theoretical support for measurements in fields including biomedicine, environmental science, and food safety. The system is expected to broaden the development and application of terahertz Raman spectroscopy in a variety of important fields.

Author Contributions

Conceptualization, X.L., Y.S. and N.S.; methodology, Y.S.; software, Q.C. and N.S.; validation, Y.S. and X.L.; formal analysis, F.L.; investigation, Q.N. and J.G.; resources, X.L. and N.S.; data curation, J.C.; writing—original draft preparation, Y.S.; writing—review and editing, Y.S.; visualization, G.W.; supervision, X.L. All authors have read and agreed to the published version of the manuscript.

Funding

National Natural Science Foundation of China (61975255, 52227810, U2006209, 62075216), Jilin Province Research Projects in China (20220201083GX).

Institutional Review Board Statement

Not applicable.

Conflicts of Interest

The authors declare no conflict of interest.

References

  1. Jin, Z.; Peng, Y.; Fang, Y.; Ye, Z.; Fan, Z.; Liu, Z.; Bao, X.; Gao, H.; Ren, W.; Wu, J.; et al. Photoinduced large polaron transport and dynamics in organic–inorganic hybrid lead halide perovskite with terahertz probes. Light Sci. Appl. 2022, 11, 209. [Google Scholar] [CrossRef]
  2. Mehboob, S.; Mehmood, M.; Ahmed, M.; Ahmad, J.; Tanvir, M.T.; Ahmad, I.; Hassan, S.M.U. Terahertz time domain spectroscopy of amorphous and crystalline aluminum oxide nanostructures synthesized by thermal decomposition of AACH. Mater. Chem. Phys. 2017, 191, 62–69. [Google Scholar] [CrossRef]
  3. Woutersen, S.; Bakker, H.J. Resonant intermolecular transfer of vibrational energy in liquid water. Nature 1999, 402, 507–509. [Google Scholar] [CrossRef]
  4. Roussel, E.; Szwaj, C.; Evain, C.; Steffen, B.; Gerth, C.; Jalali, B.; Bielawski, S. Phase Diversity Electro-optic Sampling: A new approach to single-shot terahertz waveform recording. Light. Sci. Appl. 2022, 11, 14. [Google Scholar] [CrossRef]
  5. Sun, Y.; Li, X.; Galantu, J.; Chu, Q.; Chen, J.; Liu, Z.; Mi, X.; Yao, X.; Li, P. Terahertz Raman Measurements Using a Spatial Heterodyne Raman Spectrometer. Appl. Sci. 2021, 11, 8094. [Google Scholar] [CrossRef]
  6. Harrison, G.R. The Production of Diffraction Gratings: II. The Design of Echelle Gratings and Spectrographs1. J. Opt. Soc. Am. 1949, 39, 522–528. [Google Scholar] [CrossRef]
  7. Harrison, G.R.; Archer, J.E.; Camus, J. A Fixed-Focus Broad-Range Echelle Spectrograph of High Speed and Resolving Power. J. Opt. Soc. Am. 1952, 42, 706–709. [Google Scholar] [CrossRef]
  8. Lawler, J.E.; Labby, Z.E.; Harlander, J.M.; Roesler, F.L. Broadband, high-resolution spatial heterodyne spectrometer. Appl. Opt. 2008, 47, 6371–6384. [Google Scholar] [CrossRef]
  9. Qiu, J.; Qi, X.; Li, X.; Ma, Z.; Jirigalantu; Tang, Y.; Mi, X.; Zheng, X.; Zhang, R. Bayanheshig Development of a spatial heterodyne Raman spectrometer with echelle-mirror structure. Opt. Express 2018, 26, 11994–12006. [Google Scholar] [CrossRef]
  10. Roesler, F.L.; Harlander, J.M. Spatial Heterodyne Spectroscopy: Interferometric Performance at any Wavelength Without Scanning; SPIE: Bellingham, WA, USA, 1991. [Google Scholar]
  11. Bolzani, V.; Soares, C.; Morais, M.; Petronio, M.; Regasini, L.; Silva, D.; Pezzuto, J.; Kondratyuk, T.; Luqman, S. Suppression of TNF-α induced NFκB activity by gallic acid and its semi-synthetic alkyl-gallates: Possible role in cancer chemoprevention. Nat. Preced. 2012. [Google Scholar] [CrossRef]
  12. AL Zahrani, N.A.; El-Shishtawy, R.M.; Asiri, A.M. Recent developments of gallic acid derivatives and their hybrids in medicinal chemistry: A review. Eur. J. Med. Chem. 2020, 204, 112609. [Google Scholar] [CrossRef] [PubMed]
  13. Akberova, S.I. New Biological Properties of p-Aminobenzoic Acid. Biol. Bull. Russ. Acad. Sci. 2002, 29, 390–393. [Google Scholar] [CrossRef]
  14. Zhou, L.; Ji, Y.; Zeng, C.; Zhang, Y.; Wang, Z.; Yang, X. Aquatic photodegradation of sunscreen agent p-aminobenzoic acid in the presence of dissolved organic matter. Water Res. 2013, 47, 153–162. [Google Scholar] [CrossRef] [PubMed]
  15. Taylor, M.; Alessi, D.R. Advances in elucidating the function of leucine-rich repeat protein kinase-2 in normal cells and Parkinson’s disease. Curr. Opin. Cell Biol. 2020, 63, 102–113. [Google Scholar] [CrossRef]
  16. Martínez-Arnau, F.M.; Fonfría-Vivas, R.; Cauli, O. Beneficial Effects of Leucine Supplementation on Criteria for Sarcopenia: A Systematic Review. Nutrients 2019, 11, 2504. [Google Scholar] [CrossRef] [PubMed] [Green Version]
  17. Wang, F.; Sun, X.; Zan, J.; Li, M.; Liu, Y.; Chen, J. Terahertz spectra and weak intermolecular interactions of nucleosides or nucleoside drugs. Spectrochim. Acta Part A Mol. Biomol. Spectrosc. 2022, 265, 120344. [Google Scholar] [CrossRef] [PubMed]
  18. Chen, T.; Li, Z.; Zhang, H.; Hu, F. Terahertz spectroscopic investigation of D- and DL-tartaric acid. Chem. Phys. Lett. 2019, 731, 136579. [Google Scholar] [CrossRef]
  19. Giménez-Gómez, P.; Gutiérrez-Capitán, M.; Capdevila, F.; Puig-Pujol, A.; Jiménez-Jorquera, C.; Fernández-Sánchez, C. Compact analytical flow system for the simultaneous determination of l-lactic and l-malic in red wines. Sci. Rep. 2020, 10, 19404. [Google Scholar] [CrossRef]
  20. Bian, Y.; Zhang, X.; Zhu, Z.; Wu, X.; Li, X.; Yang, B. Investigation of the Correlations between Amino Acids, Amino Acid Mixtures and Dipeptides by Terahertz Spectroscopy. J. Infrared Millim. Terahertz Waves 2021, 42, 64–75. [Google Scholar] [CrossRef]
  21. Moser, C.; Havermeyer, F. Compact Raman spectrometer system for low frequency spectroscopy. In Proceedings of the SPIE OPTO, San Francisco, CA, USA, 2–4 August 2010; SPIE: Bellingham, WA, USA, 2010; Volume 7598. [Google Scholar]
  22. Hédoux, A.; Paccou, L.; Guinet, Y.; Willart, J.-F.; Descamps, M. Using the low-frequency Raman spectroscopy to analyze the crystallization of amorphous indomethacin. Eur. J. Pharm. Sci. 2009, 38, 156–164. [Google Scholar] [CrossRef]
  23. Lazarević, J.; Uskoković-Marković, S.; Jelikić-Stankov, M.; Radonjić, M.; Tanasković, D.; Lazarević, N.; Popović, Z. Intermolecular and low-frequency intramolecular Raman scattering study of racemic ibuprofen. Spectrochim. Acta Part A Mol. Biomol. Spectrosc. 2014, 126, 301–305. [Google Scholar] [CrossRef] [PubMed]
  24. Swinehart, D.F. The Beer-Lambert Law. J. Chem. Educ. 1962, 39, 333. [Google Scholar] [CrossRef]
  25. Kutuvantavida, Y.; Williams, G.V.M.; Pogson, E.M.; Bhuiyan, M.D.H.; Radhanpura, K.; Lewis, R.A. Material characterization at low frequencies using THz and Raman spectroscopy. In Proceedings of the 2012 37th International Conference on Infrared, Millimeter, and Terahertz Waves, Wollongong, NSW, Australia, 23–28 September 2012. [Google Scholar]
Figure 1. Schematic diagram of the echelle grating spatial heterodyne terahertz Raman spectrometer.
Applsci 13 00967 g001
Figure 2. (a) Interferogram of the mercury lamp; (b) mercury lamp level chart; (c) spectral spatial frequency of the mercury lamp.
Applsci 13 00967 g002
Figure 3. (a) Comparison of terahertz Raman spectra of salicylic acid; (b) comparison of terahertz Raman spectra of benzoic acid; (c) terahertz Raman spectrum of gallic acid; (d) terahertz Raman spectrum of p-aminobenzoic acid.
Applsci 13 00967 g003
Figure 4. (a) Terahertz Raman spectrum of DL-leucine; (b) terahertz Raman spectrum of DL-tartaric acid; (c) terahertz Raman spectrum of DL-threonine; (d) terahertz Raman spectrum of L-malic acid; (e) terahertz Raman spectrum of fumaric acid; and (f) terahertz Raman spectrum of glycine.
Applsci 13 00967 g004aApplsci 13 00967 g004b
Figure 5. (a) Terahertz Raman spectrum of furantoin; (b) terahertz Raman spectrum of Tylenol; (c) terahertz Raman spectrum of indomethacin; (d) terahertz Raman spectrum of ibuprofen; (e) terahertz Raman spectrum of cold medicine tablet; (f) terahertz Raman spectrum of painkiller tablet; (g) comparison of terahertz Raman spectra of theophylline; (h) comparison of Terahertz Raman spectra of carbamazepine.
Applsci 13 00967 g005
Figure 6. (a) Terahertz Raman spectra of salicylic acid aqueous solutions; (b) terahertz Raman spectrum of gallic acid aqueous solution; (c) terahertz Raman spectrum of indomethacin aqueous solution 3.6. Wide band terahertz Raman spectroscopy experiment.
Applsci 13 00967 g006
Figure 7. (a) Wide band spectrum of benzoic acid; (b) wide band spectrogram of sulfur; (c) wide band spectra of three organic solutions (methanol, ethanol, and acetone).
Applsci 13 00967 g007aApplsci 13 00967 g007b
Figure 8. Sulfur SNR curves.
Applsci 13 00967 g008
Table 1. Performance comparison of various SHS.
StructureSpectral ResolutionSpectral Detection Range
SHTRS4.945 cm−12532 cm−1
EMSHRS1.051 cm−14287 cm−1
E-SHTRS1.37 cm−16314 cm−1
Disclaimer/Publisher’s Note: The statements, opinions and data contained in all publications are solely those of the individual author(s) and contributor(s) and not of MDPI and/or the editor(s). MDPI and/or the editor(s) disclaim responsibility for any injury to people or property resulting from any ideas, methods, instructions or products referred to in the content.

