Article

Tree Seedlings Detection and Counting Using a Deep Learning Algorithm

College of Information and Computer Engineering, Northeast Forestry University, Harbin 150040, China
*
Author to whom correspondence should be addressed.
Appl. Sci. 2023, 13(2), 895; https://doi.org/10.3390/app13020895
Submission received: 10 December 2022 / Revised: 1 January 2023 / Accepted: 5 January 2023 / Published: 9 January 2023
(This article belongs to the Special Issue Deep Learning in Object Detection and Tracking)

Abstract

:
Tree-counting methods based on computer vision technologies are low-cost and efficient in contrast to the traditional tree counting methods, which are time-consuming, laborious, and humanly infeasible. This study presents a method for detecting and counting tree seedlings in images using a deep learning algorithm with a high economic value and broad application prospects in detecting the type and quantity of tree seedlings. The dataset was built with three types of tree seedlings: dragon spruce, black chokeberries, and Scots pine. The data were augmented via several data augmentation methods to improve the accuracy of the detection model and prevent overfitting. Then a YOLOv5 object detection network was built and trained with three types of tree seedlings to obtain the training weights. The results of the experiments showed that our proposed method could effectively identify and count the tree seedlings in an image. Specifically, the MAP of the dragon spruce, black chokeberries, and Scots pine tree seedlings were 89.8%, 89.1%, and 95.6%, respectively. The accuracy of the detection model reached 95.10% on average (98.58% for dragon spruce, 91.62% for black chokeberries, and 95.11% for Scots pine). The proposed method can provide technical support for the statistical tasks of counting trees.

1. Introduction

Woods play a vital role in our lives as they are an essential source of oxygen and food for all living organisms on earth. Moreover, they provide various ecosystem services, combat global warming, and keep the air clean and healthy by taking carbon dioxide (CO2) out of the air and releasing oxygen [1]. Hence, tree counting can have numerous benefits, and it plays a vital role in many environmental protection applications, forest resource management, crop yield estimation, and agricultural planning. Thus, keeping track of the number of trees in an area could be required for effective management and quantitative analysis [2]. The traditional tree counting methods, which depend on human visual inspection, require expensive feature engineering and are considered time-consuming and labor-intensive. Recently, the development of “precision forestry” [3] has required high technologies and analytical tools to support forest management and leverage conservation and use of forest resources [4]. Owing to the increasing evolution of model structure and the continuous updating of GPU hardware, deep learning has been vigorously developed and has shown significant advantages, recommending it as the mainstream method in the object detection field [3]. Recently, deep learning algorithms have been widely used to determine the height and the number of trees, demonstrating its outstanding potential for counting trees [5,6]. Yuan et al. used a binocular camera combined with YOLOv4 to count and measure the height of tree saplings [7]. Wu et al. [8] proposed a large-scale, real-time, and cross-regional oil palm tree detection (CROPTD) method containing a local and a global domain discriminator generated by adversarial learning. To highlight more transferable regions, they proposed the local attention that tells the neural network where are there more transferable regions. The CROPTD approach was evaluated on two large-scale high-resolution satellite images in Peninsular Malaysia. The CROPTD approach improves the detection accuracy by 8.69% in terms of the average F1-score compared with Faster R-CNN. Moreover, CROPTD performs 4.99–2.21% better than the other two domain adaptive object detection approaches.
Alburshaid et al. [9] also used high-resolution satellite images as a primary data source and presented an MRCNN model to recognize, count, and categorize date palm trees in the Kingdom of Bahrain. The model was tested on the entire land region of Bahrain’s Northern Governorate, which encompassed around 175 square kilometers. As a result, the precise positions and quantities of palm trees across the Northern governance were detected and kept in the agricultural geodatabase; the obtained result can assist in estimating the yearly yield for date palm trees in the Kingdom of Bahrain. Htet et al. [10] presented palm tree classification and counting using remote sensing drone video and the mask R-CNN algorithm with a retuning hyperparameter strategy. The tested area was comprised of the upper and delta coastal area of Myanmar, and over 12,000 aerial images were taken by drone for three types of palm trees (toddy palm, coconut palm, and palm oil); the research result exhibited 80–95% validation accuracy on each palm class. It is deduced that tuning learning will improve the performance of the local palm tree classification approach and can accurately detect and count toddy palm trees.
Recently, many researchers have been focusing on using remote sensing in agriculture due to the benefits of unmanned aerial vehicles (UAVs) [11], which can obtain high-resolution images that are less expensive than other satellites and aircraft that require high altitudes and other capabilities. In contrast, UAVs can fly at lower altitudes, facilitating the easy acquisition of clear images [12]. Csillik et al. [13] proposed a method to detect citrus trees from UAV images by a simple convolutional neural network algorithm. The classification approach, which was improved by superpixels that were derived from a simple linear iterative clustering algorithm, has achieved an accuracy of 94.59% and a recall of 97.94%. Osco et al. [14] presented a convolutional neural network approach to estimate the number of citrus trees in highly dense orchards from UAV multispectral images. The dataset was comprised of 2389 images that were acquired using a multispectral camera with four bands; green, red, red-edge, and near-infrared bands. The result showed high precision (0.95) and low MAE (2.05) compared with Faster R-CNN and RetinaNet algorithm, proposing this approach as a satisfactory and effective strategy to replace the traditional visual inspection method for counting the trees. Zheng et al. [15] used computer vision technology to process and analyze visible light images that were obtained by the UAVs in a citrus planting area in Xinhui District of Jiangmen City- China. Their research aims to detect citrus trees in the study area and count the mature trees and saplings. The obtained accuracy rate of the experiment reached more than 95%, which can meet the requirements of fast and accurate counting and planting situation of citrus trees in a planting area at low cost.
Furthermore, due to the economic value and ecological impacts of coconut trees, it is vital to detect and monitor them. Thus, many research papers reported on detecting and counting coconut trees [16,17,18]. Zheng et al. presented a method to detect and count the coconut trees from high-resolution satellite images that were acquired in Tenarunga island in the Pacific Ocean from Google Earth Map [19]. There were three major procedures that were applied: a multi-level region proposal network (RPN), feature extraction, and a large-scale detection workflow. The results showed a high average F1-score of 77.14% that outperformed pure Faster R-CNN with +1.33% in the average F1-score.
In summary, it is more practical to use deep learning algorithms to determine the number of trees because it is a fast, low cost, and effective tool [20]. Due to the increase in world population, there is an increasing demand for food and an urgent need to increase tree planting, which is required globally to maintain the water cycle, sequestrate carbon, conserve soils, and protect the continued existence of humans and animals. Moreover, the depletion of forestry resources dramatically is also increasing. Thus, in the agriculture sector, intelligent farming techniques and automated tree-counting approaches play an essential role in the crop management system, achieving rapid and accurate management of forestry resources and empowering the development of many economies worldwide [21]. Moreover, counting tree seedlings helps monitor natural succession and support conservation efforts of forestry resources.
This paper presents a new tree seedlings detection method using YOLOv5 with a dataset containing 660 images of three different types of tree seedlings. The dataset images were taken via drone and mobile phone. Then, data augmentation was used to obtain a large amount of data to train the detection model. Finally, the manual counting results are compared with the system. The correctness is evaluated by comparing the manual count results with the system count results. Our detection approach result is satisfactory and is an effective method to replace the traditional human visual inspection method to determine the number of tree seedlings in an area. The proposed method overcame the difficulties of the traditional tree seedlings quantity survey that needs staff to work in the field to obtain information and data, is humanly infeasible, requires high labor costs, and has small effective coverage.

2. Materials and Methods

2.1. Dataset

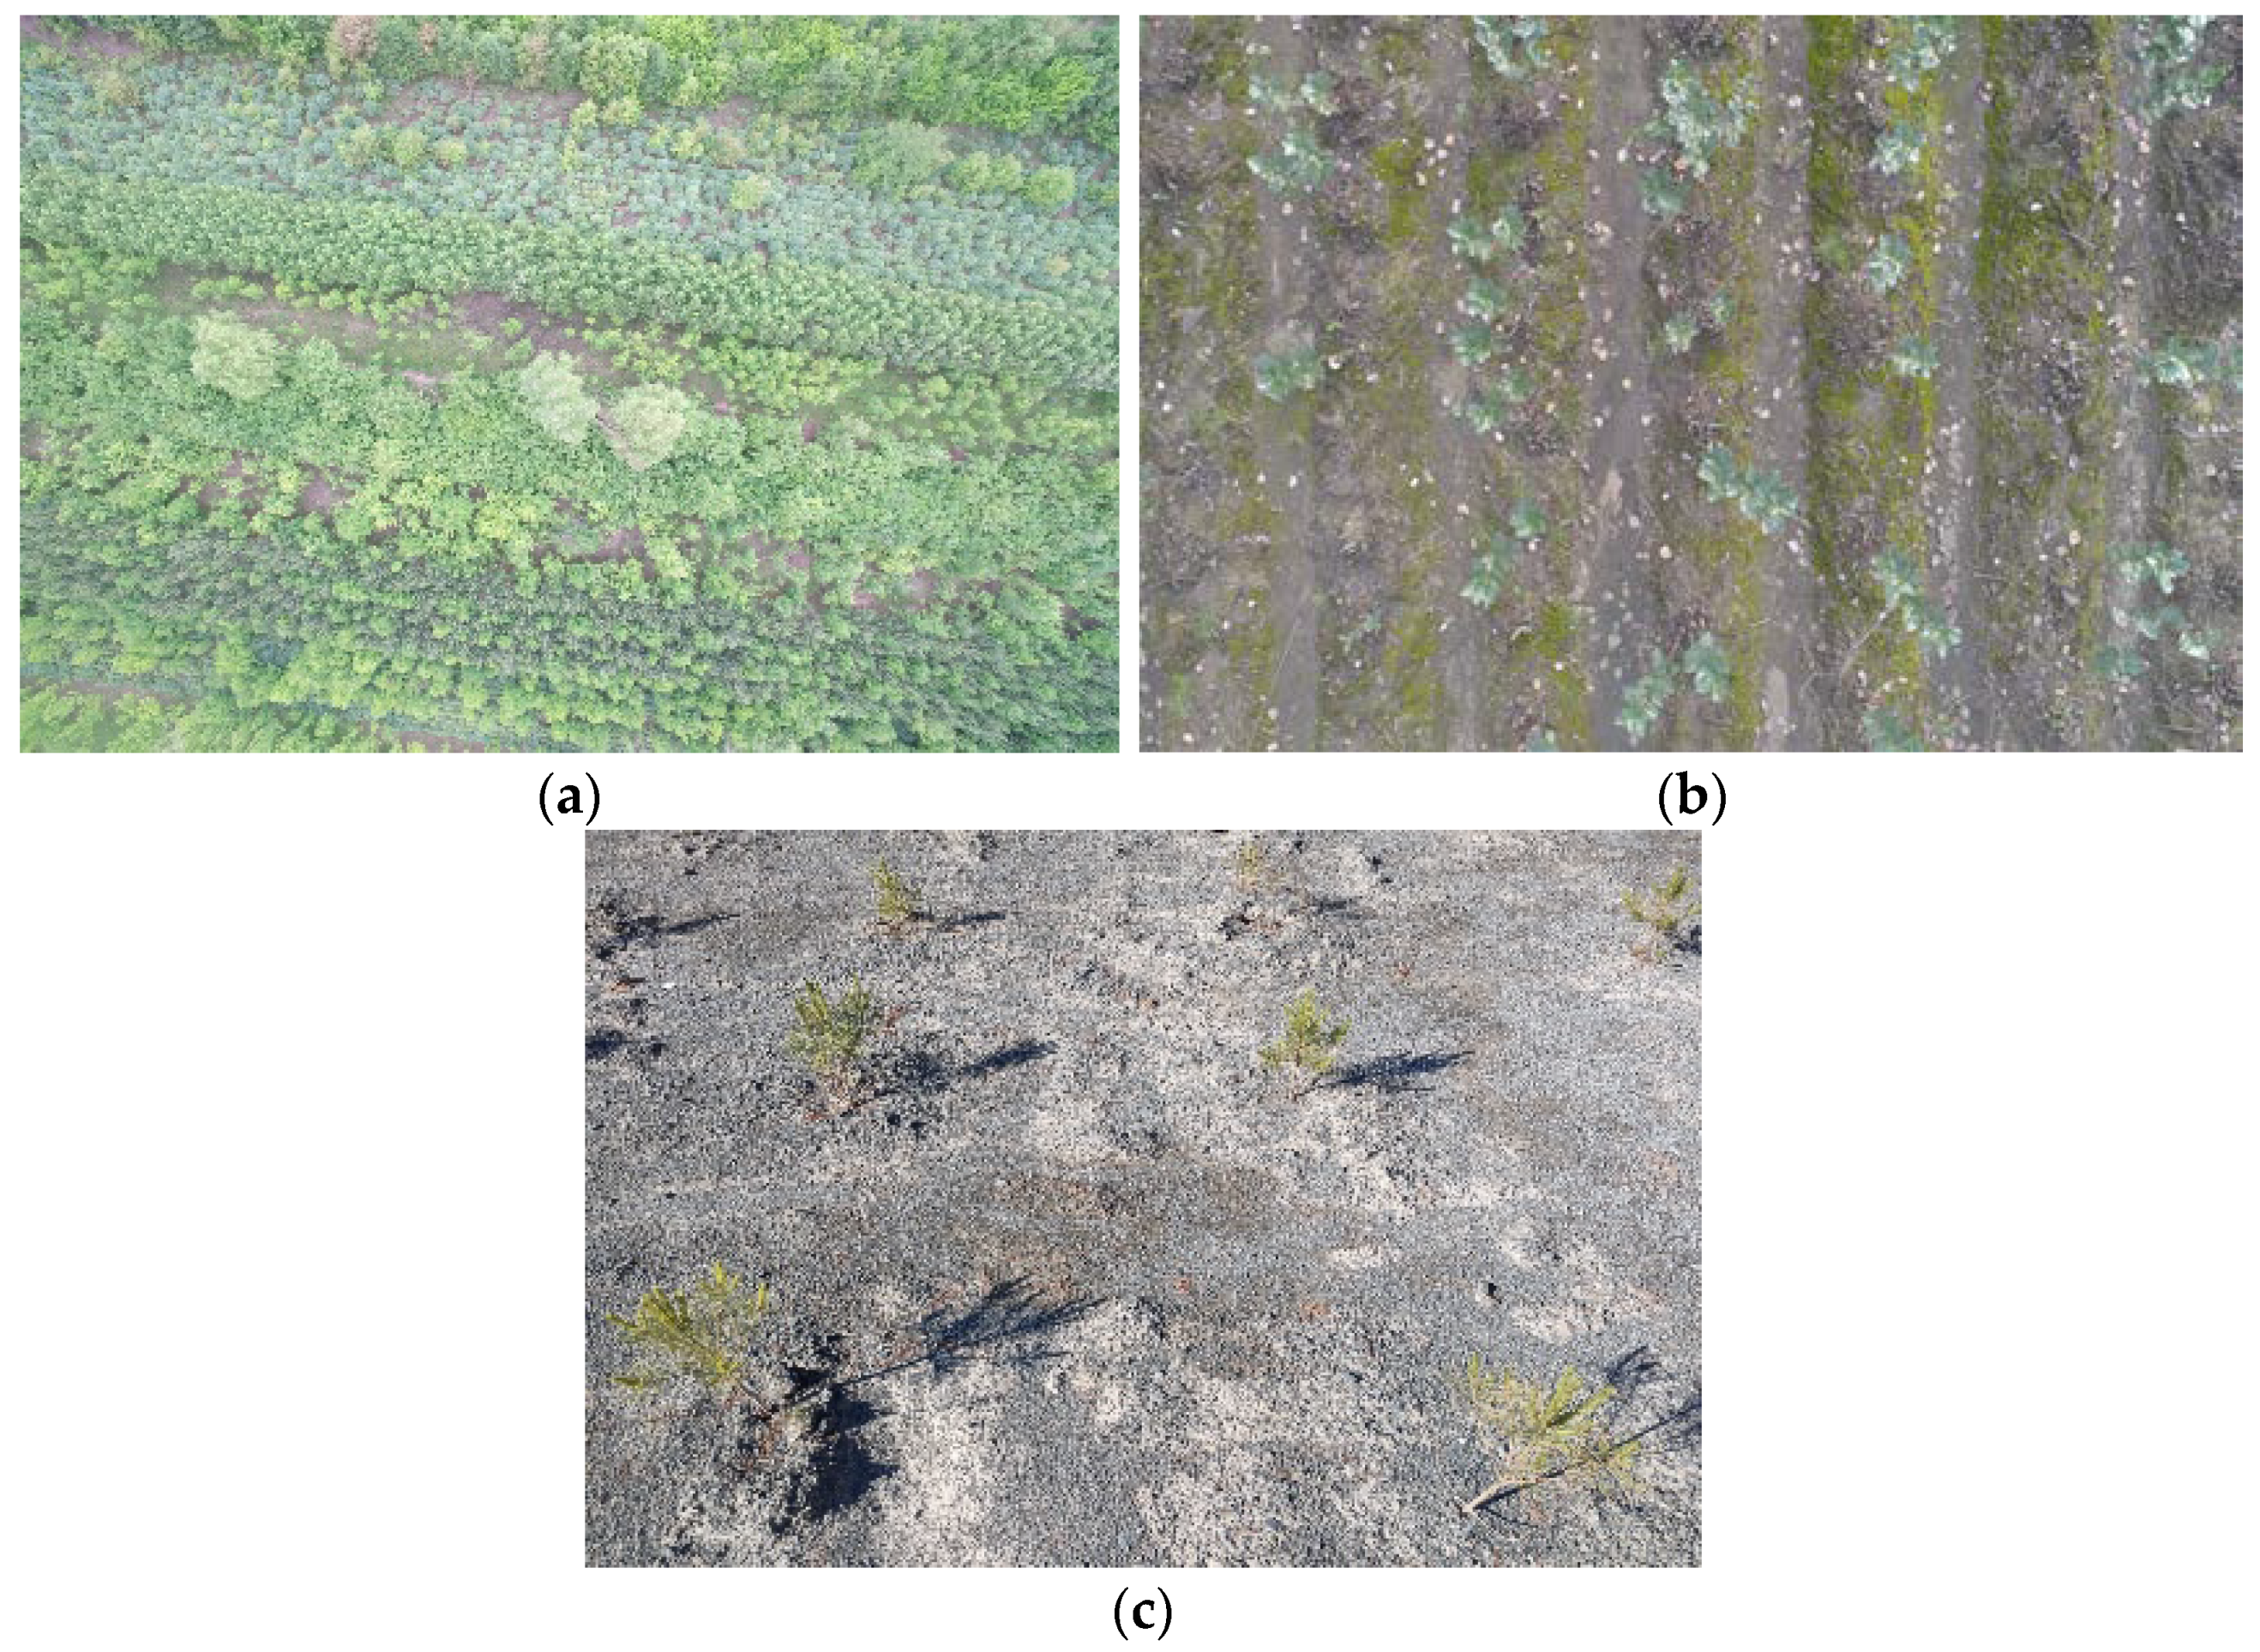
2.1.1. Data Collection

In this study, images of three types of tree seedlings (dragon spruce (Picea asperata), black chokeberries (Aronia melanocarpa), and Scots pine (Pinus sylvestris)) were collected and analyzed. The images were captured with various angles that were selected at different shooting distances. In total, the original images were 660, including 60 for dragon spruce, 300 for black chokeberries, and 300 for Scots pine. Furthermore, the outdoor environment factors were also considered during the image capture. The image shooting was done on a sunny day with natural light to ensure the precision of shooting images. The RGB images of the three types of tree seedlings are shown in Figure 1. The data were augmented via 13 methods of the major data augmentation methods. The details of the tree seedling dataset are shown in Table 1.
The dataset was acquired from different places, as follows. Dragon spruce images and black chokeberries images were captured in Tian Heng Mountain Harbin city, Heilongjiang Province-China, and Scots pine images were captured in the Acheng district, Harbin city, Heilongjiang Province-China.
The dataset was acquired in two ways. First, dragon spruce images were taken by DJI Inspire1 professional drone with a wheelbase of 559–581 mm and a maximum flight time of 18 min. Its weight is slightly less than 7 lbs (2935 g), and it flies at a speed of 72 feet (22 m) per second. The UAV has a 12.4 million FC350 camera and SONY EXMOR 1/2.3 sensor, which can take a single shot, multiple continuous shooting, and a maximum 4096 × 2160 p resolution HD video recording. The tilt photography scheme is performed in one ortho and four oblique directions. Second, black chokeberries and Scots pine images were taken by a Huawei Enjoy 20 Pro mobile phone equipped with an Octa-core CPU (4 × 2.0 GHz Cortex-A76 & 4 × 2.0 GHz Cortex-A55) and a triple main camera (48 MP, f/1.8, 26 mm (wide), 1/2.0”, 0.8µm, PDAF), (8 MP, f/2.4, 120° (ultra-wide)), (2 MP, f/2.4, (macro)) and 4000 × 1080 p resolution video recording.

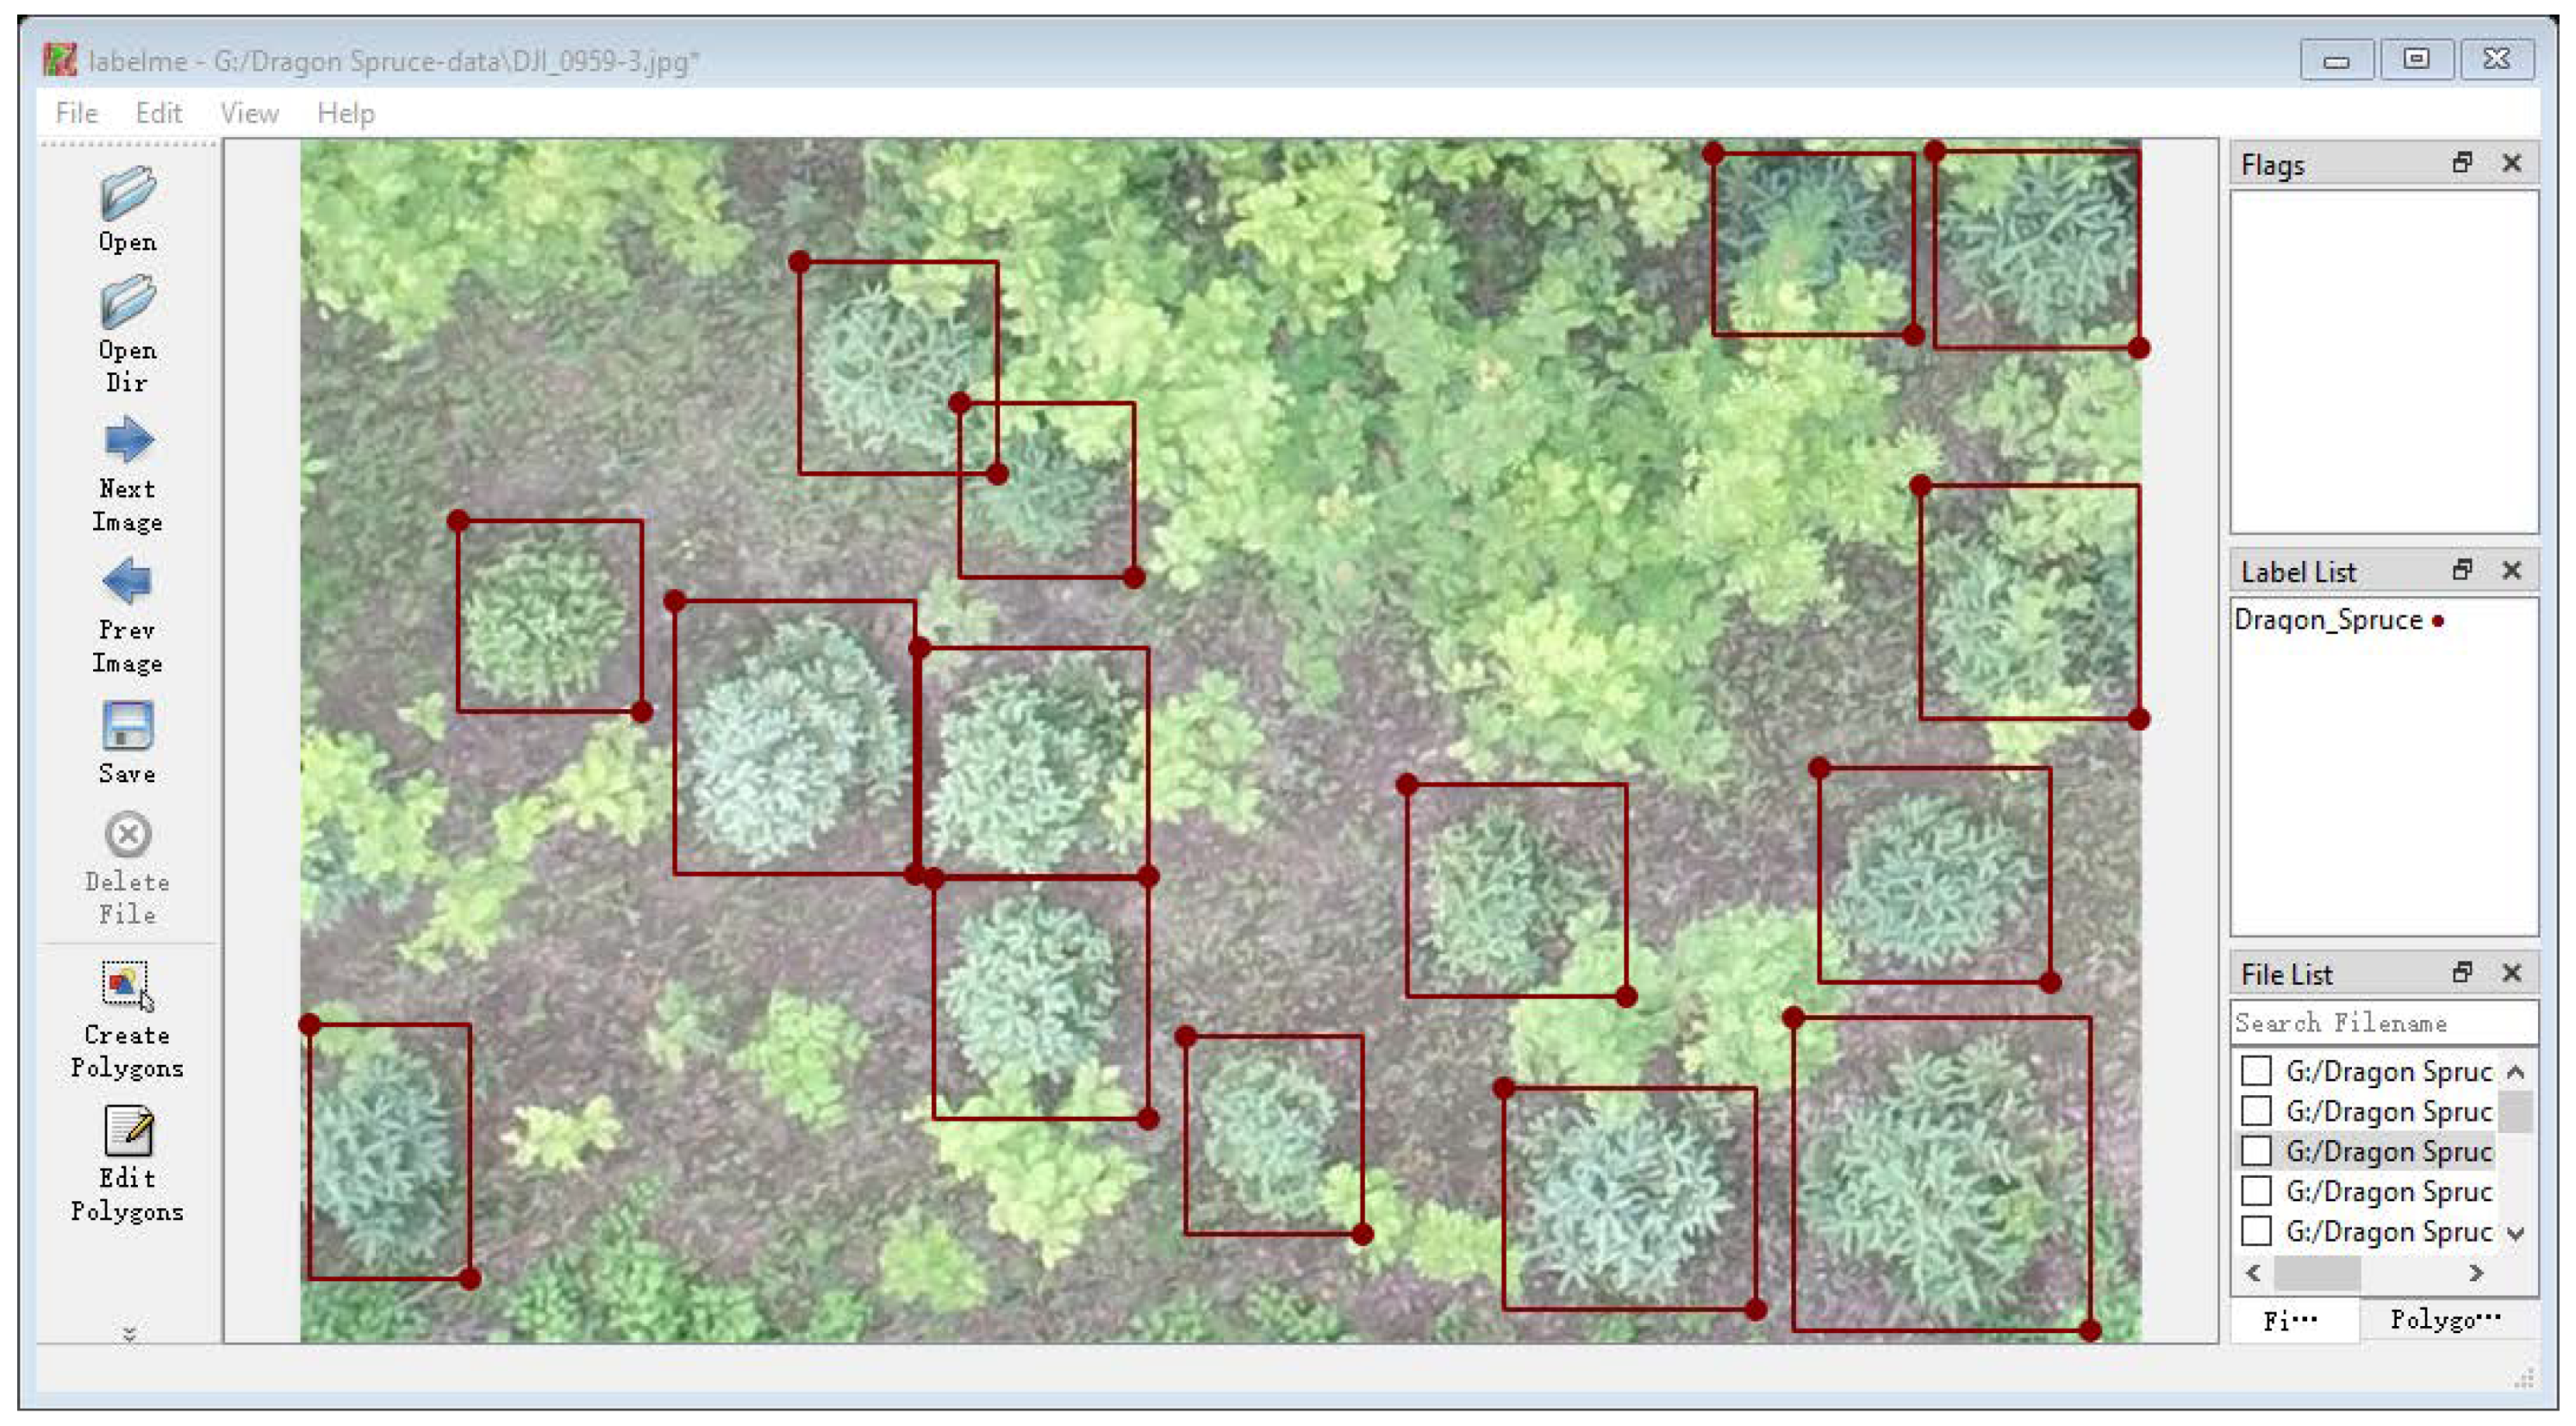
2.1.2. Data Preprocessing

After the data collection, the obtained data were pre-processed as follows. Firstly, we selected the images with the best shooting angle and cut their useless edges. Secondly, we modified the resolution and the brightness of the images. Thirdly, we delineated the bounding boxes of the seedling targets in the images and classified the categories to enable manual annotation of the seedlings. Then, 660 images were labeled using the image annotation software ‘LabelImg’ tool based on the smallest surrounding rectangle of a tree seedling to ensure the rectangle covers as small of a background area as possible. After data labeling, the position and classification of the tree seedlings were marked, resulting in JSON annotation files, and then they converted to txt files. Txt files contain information on object class, object coordinates, and the height and width of the labeling frame. Figure 2 shows the manual annotation of the tree seedlings using the ‘LabelImg’ tool, and Figure 3 shows the three types of tree seedlings after preprocessing.

2.1.3. Data Augmentation

Data augmentation is a technique of increasing the limited data to be significant, meaningful, and more diverse. Data augmentation prevents overfitting and improves the accuracy of the detection model [22]. To further enhance the model’s performance, it is necessary to use data augmentation methods to expand the sapling dataset. Referring to related literature work, the data in this study were augmented via 13 strategies of the major data augmentation methods, such as flipping, rotating, flipping and rotating at the same time, adjusting brightness, and flipping and adjusting brightness at the same time. Examples of the applied data augmentation are shown in Figure 4. The data augmentation process was applied after the data labeling process. Thus, images were augmented simultaneously with the label files. Therefore, the dataset was divided into two datasets in the ratio of (8:2): the training dataset and the validation dataset. The augmented training dataset contained 7000 images, and the augmented validation dataset contained 2000 images.

2.2. Methods

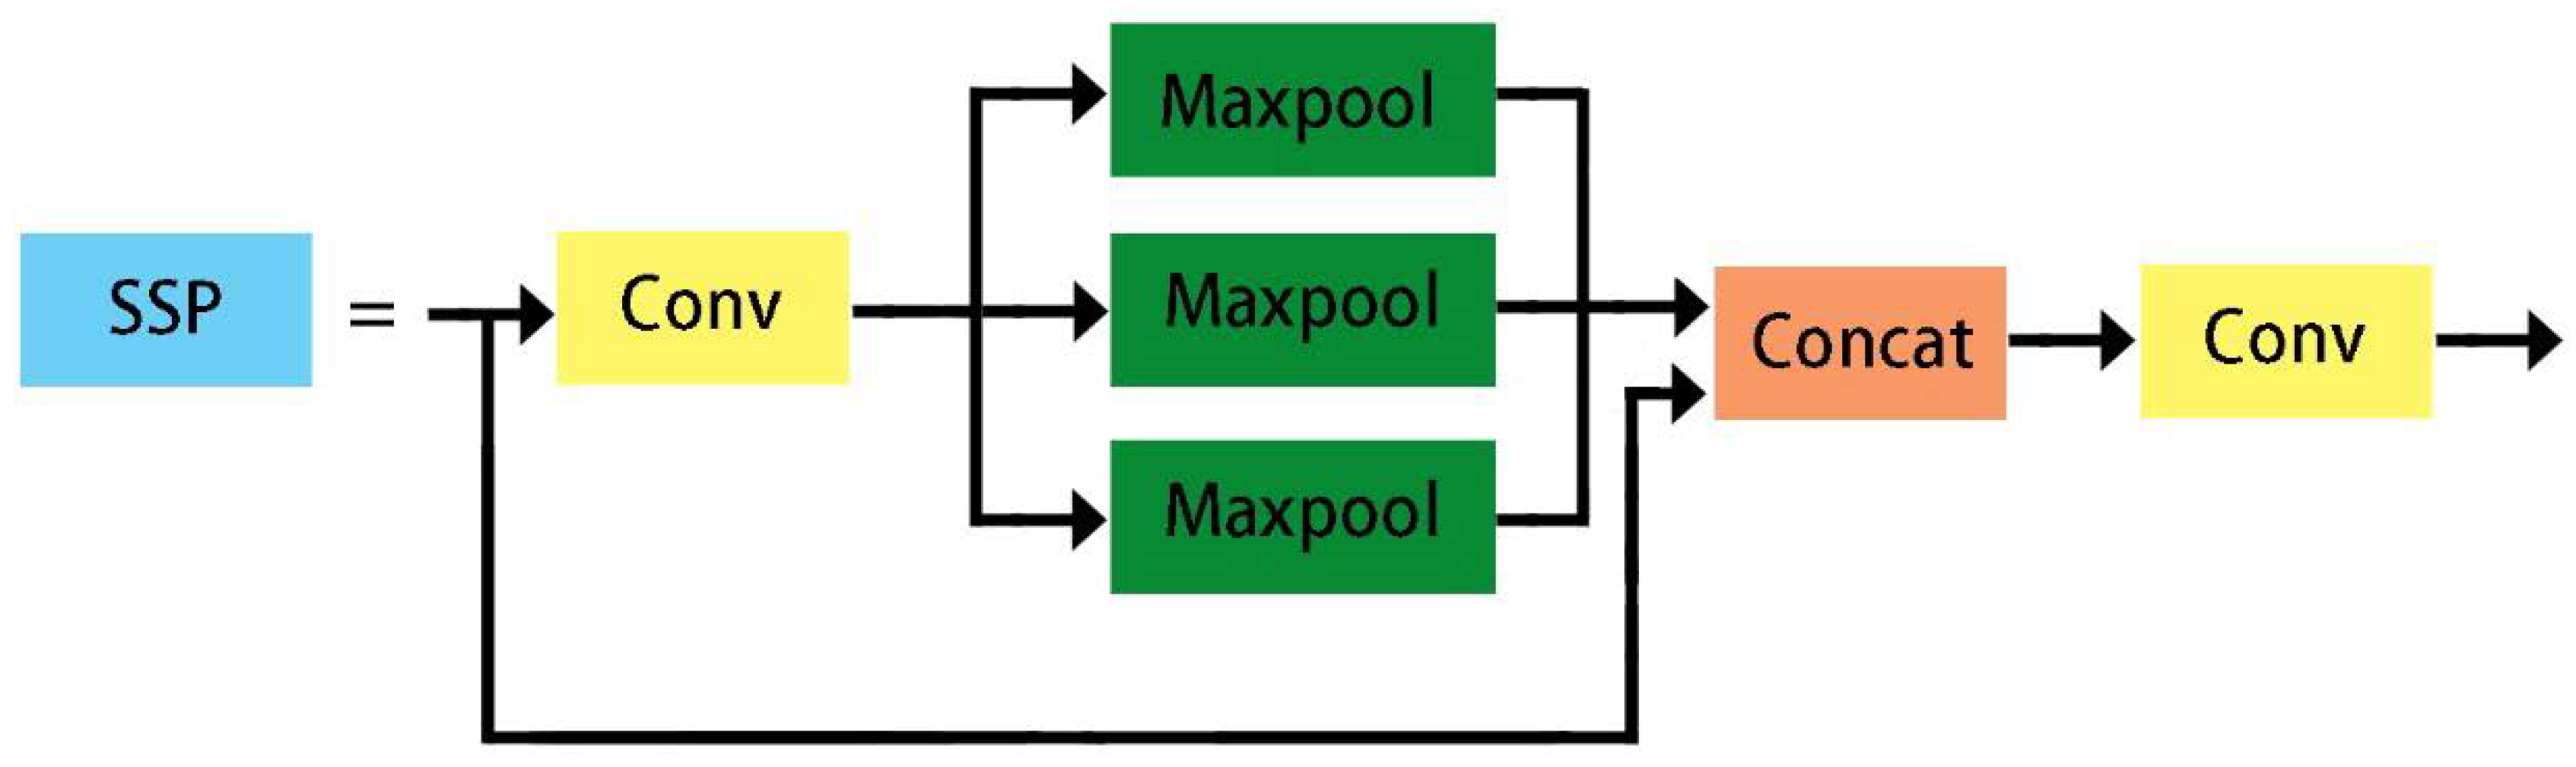
2.2.1. YOLOv5 Network Architecture

YOLOv5 is a single-stage object detector with four versions: YOLOv5s, YOLOv5m, YOLOv5l, and YOLOv5x [23,24]. YOLOv5x has the highest detection accuracy and the largest width and depth, whereas YOLOv5s is considered the fastest and smallest width and depth model among other models. All versions of the YOLOv5 network have the same network architecture, but the difference is in model widths and depths. The main architecture of YOLOv5’s four versions consist of three main parts: model backbone, model neck, and model head. YOLOv5 was designed to extract high-level features, reduce the processing time of the models, and preserve high accuracy [25].
In this paper, YOLOv5s was selected for tree seedlings detection not only due to its eligibility and fitness to effectively realize the requirements of tree seedlings detection task but also because it can be well deployed in agriculture and forest fields. YOLOv5s uses feature pyramids, which help the model to identify and match different sizes and scales of the same type of object [26]. Thus, YOLOv5s can detect different sizes of tree seedlings. Moreover, the feature map at the top layer of the pyramid can also have the advantage of the rich location information that is brought by the bottom layer and accordingly improves the model’s accuracy [27]. Figure 5 shows the structure of the YOLOv5s.
The model backbone of YOLOv5s is mainly used to extract essential features of the input image. It primarily consists of a focus module (Focus), standard convolution module (Conv), cross stage partial network module (C3), and spatial pyramid pooling module (SPP). The input RGB image is divided into four parts and concatenated by the focus module for better extracting the features during down-sampling. Then, the four parts of data are spliced in the channel dimension by the Concat module and then convolved to obtain the down-sampling feature map. The focus module increases the channel dimension and reduces the width and height of the feature map, improving the network’s performance by lowering FLOPS (floating point operations per second) and increasing speed. Figure 6 shows the slicing operation of the Focus module. The Conv is the basic convolution module of YOLOv5s that performs convolution operation, normalization, and activation operations for feature extraction. The C3 module is a designed module based on cross stage partial network, which is used to enhance the gradient values of backpropagation between layers and improve the learning ability of the model. Figure 7 shows the structure of the C3 module. The SPP module improves the receptive field of the network by converting the arbitrary feature map into a fixed-size feature vector. It mixes and pools spatial features through three parallel max pooling layers and then concatenates them [28]. Figure 8 shows the structure of the SSP module.
The model neck of YOLOv5s is composed of a series of path aggregation networks (PANets) [29], which can obtain FPN (feature pyramid networks) by assembling feature maps from different stages of the model backbone. The critical role of FPN is to enhance the semantic information by performing continuous down-sampling, which transfers the strong semantic features from the top feature maps into the lower feature maps. Whereas the PANets improve the accuracy of localization signals in lower layers by moving strong localization features from lower feature maps into higher feature maps, producing a noticeable enhancement of the location accuracy of the object [30]. The PAN and the FPN jointly strengthen the feature fusion capability and help the model to identify and match the different sizes and scales of the same target object.
The model head of YOLOv5s is the final detection part of the model. It is composed of three detection layers that have different size feature maps. Moreover, it has been designed based on PANet, which is same as that of YOLOv3 and YOLOv4. Finally, the corresponding anchor boxes are applied on the final feature maps of the three scales to generate the final output vectors with the position of the predicted bounding boxes and the categories of the target objects in the original image and label them.

2.2.2. Experiment Environment

In this research, the Ubuntu 20.04 operating system was the environment for this experiment. The training and testing processes of the model were run under PyCharm 2020.2.3 framework with built-in Python version 3.6.5 using a server with an Intel(R) Xeon(R) Gold 6128 CPU at basic frequency 3.40 GHz; 64 GB RAM and three NVIDIA GeForce GTX 1080 Ti 12 G GPU. All the codes and other required libraries that were utilized in this experiment were in Python language. The hardware and software parameters of the experiment environment are shown in Table 2. The specific training parameter configurations of the tree seedlings detection model are shown in Table 3.

2.2.3. Evaluation Indicators

To evaluate the performance of the tree seedlings detection model, we used the following evaluation indicators: precision (P), average precision (AP), recall (R), F1_score, accuracy and the mean average precision (mAP), which are defined in the Equations (1)–(6), respectively.
Precision = T P T P + F P
Recall = T P T P + F N
Accuracy = T P + T N T P + F N + F P + T N
F 1 _ score = 2 P R P + R
AP = 0 1 P ( R ) d R
mAP = 1 N i = 1 N A P i
where TP (true positive) refers to the number of correctly identified tree seedlings, FP (false positive) refers to the number of incorrectly identified tree seedlings, and FN (false negative) refers to the number of unidentified tree seedlings. The precision represents the ratio of correctly identified tree seedlings to all identified tree seedlings, which are correctly and incorrectly identified. In contrast, the recall represents the ratio of correctly identified tree seedlings to ground-truth tree seedlings in the dataset.

3. Results

The model was tested with 30 images of dragon spruce tree seedlings, 50 images of black chokeberries tree seedlings, and 50 images of Scots pine tree seedlings. The specific detection results of the model before data augmentation are shown in Table 4. The particular detection results of the model after data augmentation are shown in Table 5. Examples of the detection results are shown in Figure 9. As expected, after data augmentation, the model performance was more reliable, and the accuracy of the detection model was improved.
For the dragon spruce tree seedlings, their morphological characteristics with a pyramidal shape and dense branches led to high detection accuracy. However, some detection is still missed, mainly concentrated in the places where the dragon spruce tree seedlings are relatively dense. In addition, the case of two overlapping tree seedlings will be regarded as one, and the tree seedlings that overlap with another type of tree could be missed from detection. In the case of black chokeberries tree seedlings, the missed detection is mainly concentrated in the places where the difference in color and shape of the target and the background is relatively slight, making the model recognize the target as the background. Moreover, the tree seedlings on the edge of the image could be missed from detection. For Scots pine tree seedlings, the more complex crown shape and structure made it challenging to separate the crown of the tree seedlings. Therefore, the model could not estimate tree seedling structure correctly. Moreover, the textured and cluttered backgrounds majorly affect the model’s performance. The undetected tree seedlings are labeled by a red ellipse in Figure 10.

4. Conclusions

This study presents a method for detecting and counting three types of tree seedlings based on the YOLOv5 object detection network. The data were augmented via 13 data augmentation methods to improve the accuracy of the detection model and prevent overfitting. The detection model was trained with 7000 images and validated with 2000 images. The optimal model was obtained at 400 epochs and the average detection time of dragon spruce, black chokeberries, and Scots pine tree seedlings was 0.695, 0.713, and 0.728 s, respectively. The detection of dragon spruce tree seedlings exhibited the highest accuracy value, whereas the detection of black chokeberries tree seedlings exhibited the lowest accuracy value. The accuracy of the detection model reached 95.10% on average (98.58% for dragon spruce tree seedlings, 91.62% for black chokeberries tree seedlings, and 95.11% for Scots pine tree seedlings). Moreover, this study has demonstrated the great significance of incorporating deep learning techniques into agriculture and forestry to aid in the statistical tasks of the number of trees, yield estimation of seedlings, and plant breeding in nurseries. Experimental results demonstrated that the YOLOv5 model could achieve accurate results and satisfactory performance for detecting and counting tree seedlings. In addition, the Yolov5 model can detect small, medium, and big objects due to the capability of its model head to achieve multi-scale prediction by generating three different sizes of feature maps. These advantages made YOLOv5 more suitable and eligible for the detection of tree seedlings.

Author Contributions

Methodology, D.M. and D.L.; resources, D.M. and X.Y.; software, D.M. and X.Y.; writing, D.M.; format calibration, D.M. All authors have read and agreed to the published version of the manuscript.

Funding

This research received no external funding.

Institutional Review Board Statement

Not applicable.

Informed Consent Statement

Not applicable.

Data Availability Statement

The data that are presented in this study are available on request from the corresponding author. The data are not publicly available due to them being necessary for future works and graduation thesis.

Conflicts of Interest

The authors declare no conflict of interest.

References

  1. Crowther, T.W.; Glick, H.B.; Covey, K.R.; Bettigole, C.; Maynard, D.S.; Thomas, S.M.; Smith, J.R.; Hintler, G.; Duguid, M.C.; Amatulli, G. Mapping tree density at a global scale. Nature 2015, 525, 201–205. [Google Scholar] [CrossRef] [PubMed]
  2. Khan, S.; Gupta, P.K. Comparitive study of tree counting algorithms in dense and sparse vegetative regions. In International Archives of the Photogrammetry, Remote Sensing & Spatial Information Sciences, Proceedings of the ISPRS TC V Mid-Term Symposium “Geospatial Technology–Pixel to People”, Dehradun, India, 20–23 November 2018; ISPRS: Dehradun, India, 2018. [Google Scholar]
  3. Ha, D.; Tang, Y. Collective intelligence for deep learning: A survey of recent developments. Collect. Intell. 2022, 1, 114874. [Google Scholar] [CrossRef]
  4. Tucker, J.D.; Azimi-Sadjadi, M.R. Coherence-based underwater target detection from multiple disparate sonar platforms. IEEE J. Ocean. Eng. 2011, 36, 37–51. [Google Scholar] [CrossRef]
  5. Song, K.K.; Zhao, M.; Liao, X.; Tian, X.; Zhu, Y.; Xiao, J.; Peng, C. An Improved Bearing Defect Detection Algorithm Based on Yolo. In Proceedings of the 2022 International Symposium on Control Engineering and Robotics (ISCER), Changsha, China, 18–20 February 2022; pp. 184–187. [Google Scholar]
  6. Baghdasaryan, V.H. Eye Pupil Localisation and Labeling Using a Small Size Database and YOLOv4 Object Detection Algorithm. Int. J. Sci. Adv. 2022, 3, 2708–7972. [Google Scholar] [CrossRef]
  7. Yuan, X.; Li, D.; Sun, P.; Wang, G.; Ma, Y. Real-Time Counting and Height Measurement of Nursery Seedlings Based on Ghostnet–YoloV4 Network and Binocular Vision Technology. Forests 2022, 13, 1459. [Google Scholar] [CrossRef]
  8. Wu, W.; Zheng, J.; Fu, H.; Li, W.; Yu, L. Cross-regional oil palm tree detection. In Proceedings of the IEEE/CVF Conference on Computer Vision and Pattern Recognition Workshops, Seattle, WA, USA, 14–19 June 2020; pp. 56–57. [Google Scholar]
  9. Alburshaid, E.; Mangoud, M. Developing Date Palm Tree Inventory from Satellite Remote Sensed Imagery using Deep Learning. In Proceedings of the 2021 3rd IEEE Middle East and North Africa Communications Conference (MENACOMM), Agadir, Morocco, 3–5 December 2021; pp. 54–59. [Google Scholar]
  10. Htet, K.S.; Sein, M.M. Toddy Palm Trees Classification and Counting Using Drone Video: Retuning Hyperparameter Mask-RCNN. In Proceedings of the 2021 7th International Conference on Control, Automation and Robotics (ICCAR), Singapore, 23–26 April 2021; pp. 196–200. [Google Scholar]
  11. Budnik, K.; Byrtek, J.; Kapusta, A. Counting trees-methods of automatic analysis of photogrammetric data in forests of the continental region. In Proceedings of the IOP Conference Series: Earth and Environmental Science, Wroclaw, Poland, 23–25 June 2021; p. 012030. [Google Scholar]
  12. Kim, J.; Kim, S.; Ju, C.; Son, H.I. Unmanned aerial vehicles in agriculture: A review of perspective of platform, control, and applications. IEEE Access 2019, 7, 105100–105115. [Google Scholar] [CrossRef]
  13. Csillik, O.; Cherbini, J.; Johnson, R.; Lyons, A.; Kelly, M. Identification of citrus trees from unmanned aerial vehicle imagery using convolutional neural networks. Drones 2018, 2, 39. [Google Scholar] [CrossRef] [Green Version]
  14. Osco, L.P.; De Arruda, M.d.S.; Junior, J.M.; Da Silva, N.B.; Ramos, A.P.M.; Moryia, É.A.S.; Imai, N.N.; Pereira, D.R.; Creste, J.E.; Matsubara, E.T. A convolutional neural network approach for counting and geolocating citrus-trees in UAV multispectral imagery. ISPRS J. Photogramm. Remote Sens. 2020, 160, 97–106. [Google Scholar] [CrossRef]
  15. Zheng, S.; Luo, D. Recognition and Counting of Citrus Trees Based on UAV Images. In Proceedings of the 2021 4th International Conference on Advanced Electronic Materials, Computers and Software Engineering (AEMCSE), Changsha, China, 26–28 March 2021; pp. 703–706. [Google Scholar]
  16. Mohan, M.; de Mendonça, B.A.F.; Silva, C.A.; Klauberg, C.; de Saboya Ribeiro, A.S.; de Araújo, E.J.G.; Monte, M.A.; Cardil, A. Optimizing individual tree detection accuracy and measuring forest uniformity in coconut (Cocos nucifera L.) plantations using airborne laser scanning. Ecol. Model. 2019, 409, 108736. [Google Scholar] [CrossRef]
  17. Iqbal, M.S.; Ali, H.; Tran, S.N.; Iqbal, T. Coconut trees detection and segmentation in aerial imagery using mask region-based convolution neural network. IET Comput. Vis. 2021, 15, 428–439. [Google Scholar] [CrossRef]
  18. Vermote, E.F.; Skakun, S.; Becker-Reshef, I.; Saito, K. Remote sensing of coconut trees in Tonga using very high spatial resolution worldview-3 data. Remote Sens. 2020, 12, 3113. [Google Scholar] [CrossRef]
  19. Zheng, J.; Wu, W.; Yu, L.; Fu, H. Coconut Trees Detection on the Tenarunga Using High-Resolution Satellite Images and Deep Learning. In Proceedings of the 2021 IEEE International Geoscience and Remote Sensing Symposium IGARSS, Brussels, Belgium, 11–16 July 2021; pp. 6512–6515. [Google Scholar]
  20. Dorj, U.-O.; Lee, M.; Han, S. A comparative study on tangerine detection, counting and yield estimation algorithm. Int. J. Secur. Its Appl. 2013, 7, 405–412. [Google Scholar]
  21. Butte, S.; Vakanski, A.; Duellman, K.; Wang, H.; Mirkouei, A. Potato crop stress identification in aerial images using deep learning-based object detection. Agron. J. 2021, 113, 3991–4002. [Google Scholar] [CrossRef]
  22. Shorten, C.; Khoshgoftaar, T.M. A survey on image data augmentation for deep learning. J. Big Data 2019, 6, 60. [Google Scholar] [CrossRef]
  23. Jocher, G.; Chaurasia, A.; Stoken, A.; Borovec, J.; NanoCode012; Kwon, Y.; TaoXie; Michael, K.; Fang, J.; imyhxy; et al. ultralytics/yolov5: v6.2-YOLOv5 Classification Models, Apple M1, Reproducibility, ClearML and Deci.ai Integrations, version 6.2; Zenodo: Geneva, Switzerland, 2022. [CrossRef]
  24. Redmon, J.; Divvala, S.; Girshick, R.; Farhadi, A. You only look once: Unified, real-time object detection. In Proceedings of the IEEE Conference on Computer Vision and Pattern Recognition, Las Vegas, NV, USA, 27–30 June 2016; pp. 779–788. [Google Scholar]
  25. Jintasuttisak, T.; Edirisinghe, E.; Elbattay, A. Deep neural network based date palm tree detection in drone imagery. Comput. Electron. Agric. 2022, 192, 106560. [Google Scholar] [CrossRef]
  26. Dong, X.; Yan, S.; Duan, C. A lightweight vehicles detection network model based on YOLOv5. Eng. Appl. Artif. Intell. 2022, 113, 104914. [Google Scholar] [CrossRef]
  27. Zhou, Z. Detection and Counting Method of Pigs Based on YOLOV5_Plus: A Combination of YOLOV5 and Attention Mechanism. Math. Probl. Eng. 2022. [Google Scholar] [CrossRef]
  28. He, K.; Zhang, X.; Ren, S.; Sun, J. Spatial pyramid pooling in deep convolutional networks for visual recognition. IEEE Trans. Pattern Anal. Mach. Intell. 2015, 37, 1904–1916. [Google Scholar] [CrossRef] [PubMed] [Green Version]
  29. Liu, S.; Qi, L.; Qin, H.; Shi, J.; Jia, J. Path aggregation network for instance segmentation. In Proceedings of the IEEE Conference on Computer Vision and Pattern Recognition, Salt Lake City, UT, USA, 18–23 June 2018; pp. 8759–8768. [Google Scholar]
  30. Xu, R.; Lin, H.; Lu, K.; Cao, L.; Liu, Y. A forest fire detection system based on ensemble learning. Forests 2021, 12, 217. [Google Scholar] [CrossRef]
Figure 1. The original RGB images of the three types of seedlings, (a) dragon spruce, (b) black chokeberries, and (c) Scots pine.
Applsci 13 00895 g001
Figure 2. The manual annotation of the seedlings using the ‘LabelImg’ tool.
Applsci 13 00895 g002
Figure 3. Images of the three types of seedlings after preprocessing, (a) dragon spruce, (b) black chokeberries, and (c) Scots pine.
Applsci 13 00895 g003
Figure 4. Examples of the data augmentation dataset.
Applsci 13 00895 g004
Figure 5. The structure of YOLOv5s.
Applsci 13 00895 g005
Figure 6. The slicing operation of the Focus module.
Applsci 13 00895 g006
Figure 7. The structure of the C3 module.
Applsci 13 00895 g007
Figure 8. The structure of the SSP module.
Applsci 13 00895 g008
Figure 9. Examples of the detection results for (a,d) dragon spruce, (b,e) black chokeberries, and (c,f) Scots pine.
Applsci 13 00895 g009
Figure 10. Examples of the missed detection of tree seedlings for (a) dragon spruce, (b) black chokeberries, and (c) Scots pine.
Applsci 13 00895 g010
Table 1. Information about the collected dataset.
PlantCaptured Images AreaCaptured Images WayNumber of Captured
Images
Dragon spruceTianheng mountain DJI Inspire1 UVA60
Black
Chokeberries
Tianheng mountainMobile phone300
Scots pineAcheng districtMobile phone300
Total 660
Table 2. Information about Hardware and Software experimental environment.
NameParameter
Experimental environmentserver
Operating systemUbuntu 20.04
CPUIntel(R) Xeon(R) Gold 6128
GPUNVIDIA GeForce GTX 1080 Ti
Deep learning frameworkPyTorch 1.7.0
LanguagePython 3.6.5
Deep Learning modelYOLOv5s model
Table 3. Training parameter values.
ParametersOptimization AlgorithmLearning RateEpochBatch SizeImage Size
ValueSGD 0.0014002416 × 416
Table 4. The detection results of the model before augmentation.
PlantTPFNFPP (%)R (%)F1_Score (%)Accuracy (%)mAP
Dragon spruce319170299.3865.2478.7764.9787.48%
Black
Chokeberries
88622411388.6979.8284.0272.4488.37%
Scots pine329292094.2791.9093.0787.0493.24%
Table 5. The detection results of the model after augmentation.
PlantTPFNFPP (%)R (%)F1_Score (%)Accuracy (%)mAP
Dragon spruce4854399.1899.1899.2898.5889.87%
Black
chokeberries
1050603696.6994.5995.6391.6289.19%
Scots pine35081097.2297.7797.4995.1195.68%
Disclaimer/Publisher’s Note: The statements, opinions and data contained in all publications are solely those of the individual author(s) and contributor(s) and not of MDPI and/or the editor(s). MDPI and/or the editor(s) disclaim responsibility for any injury to people or property resulting from any ideas, methods, instructions or products referred to in the content.

