


Experiments on the State Boundary Surface of Aeolian Sand for Road Building in the Tengger Desert
Abstract
:1. Introduction
2. Test Method
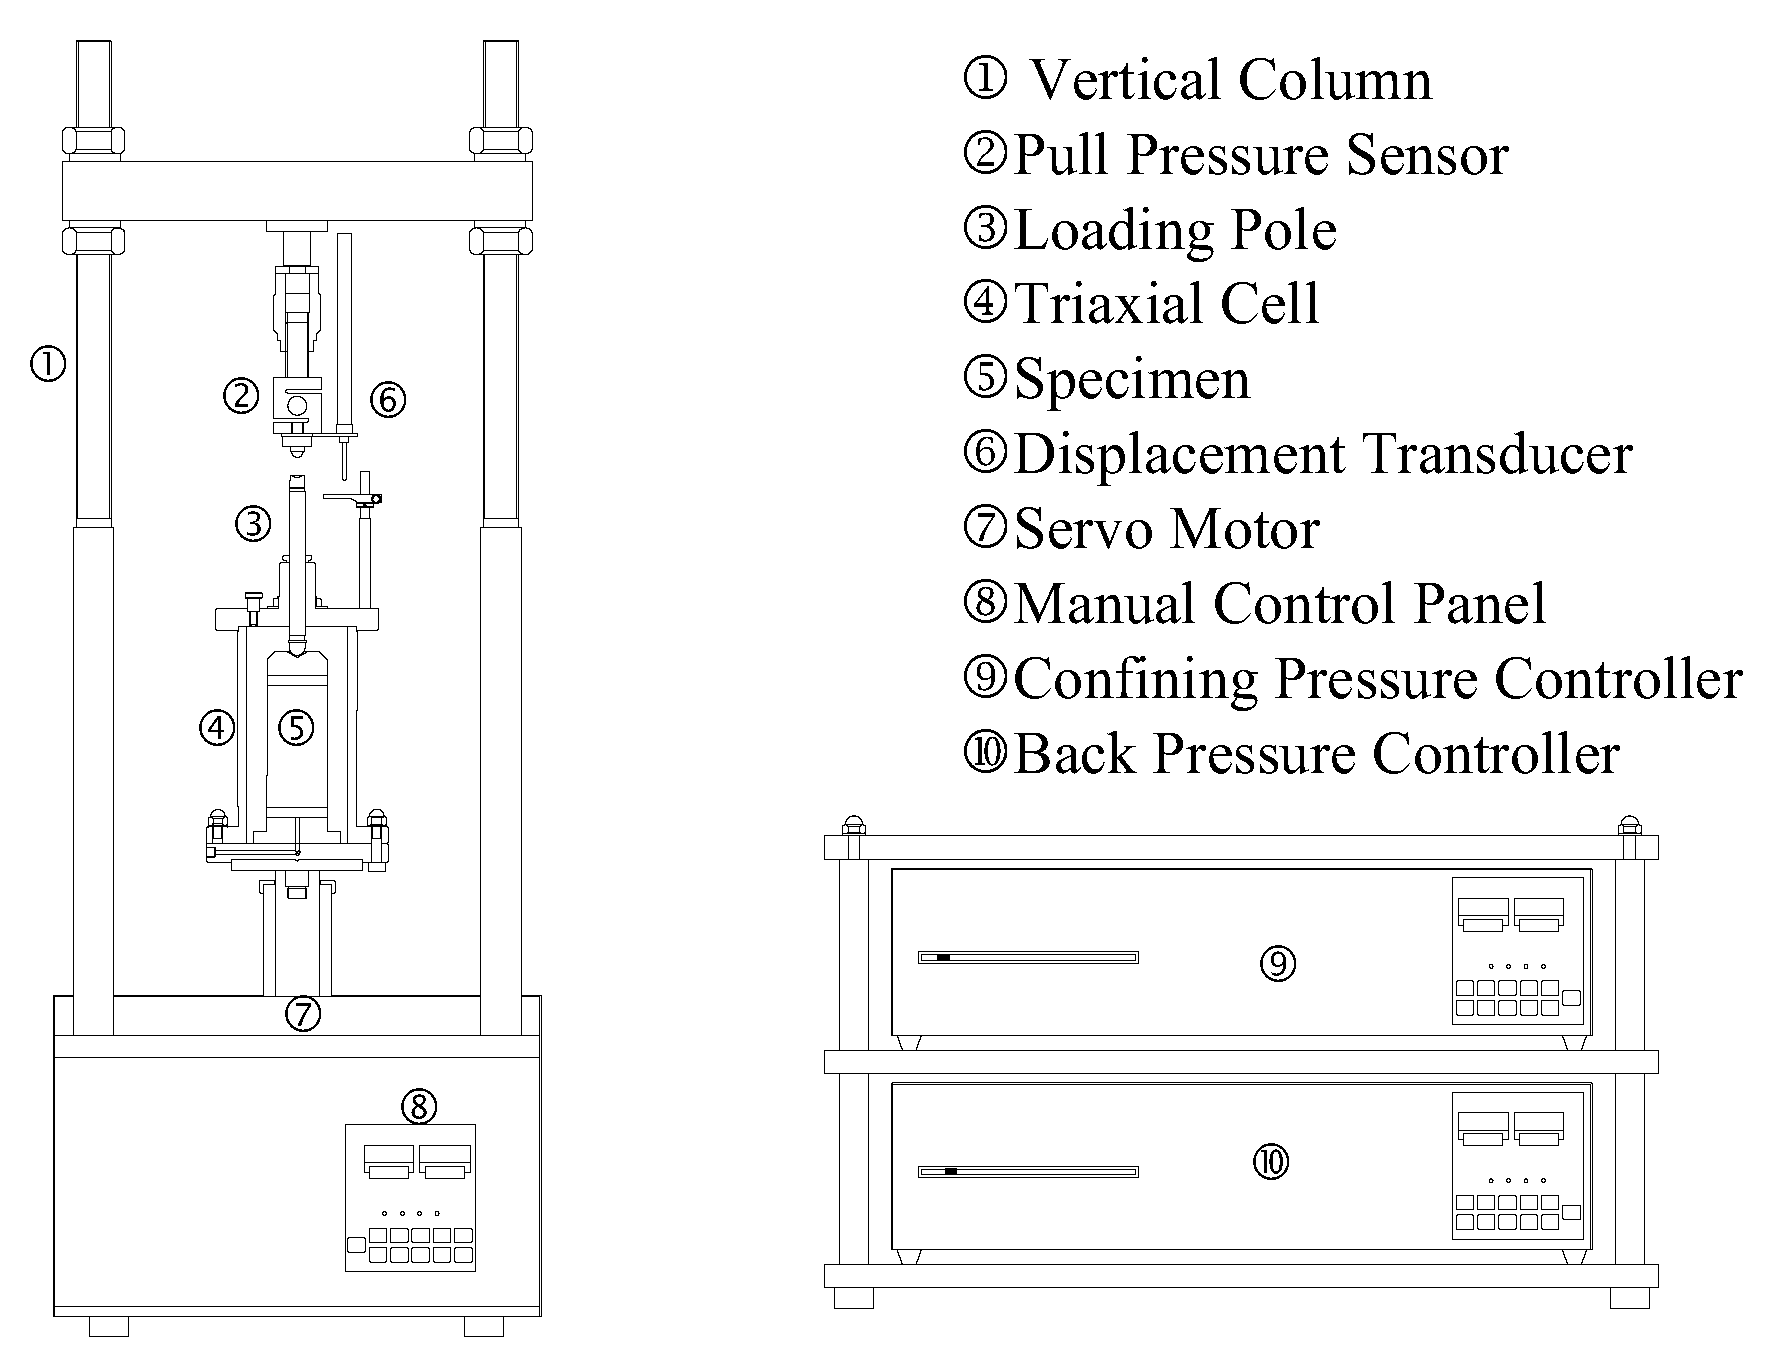
2.1. Test Apparatus
2.2. Test Material
2.3. Test Process and Scheme
3. Test Results
3.1. Stress-Strain Relationships
3.2. State Boundary Surface
4. Conclusions
- (1)
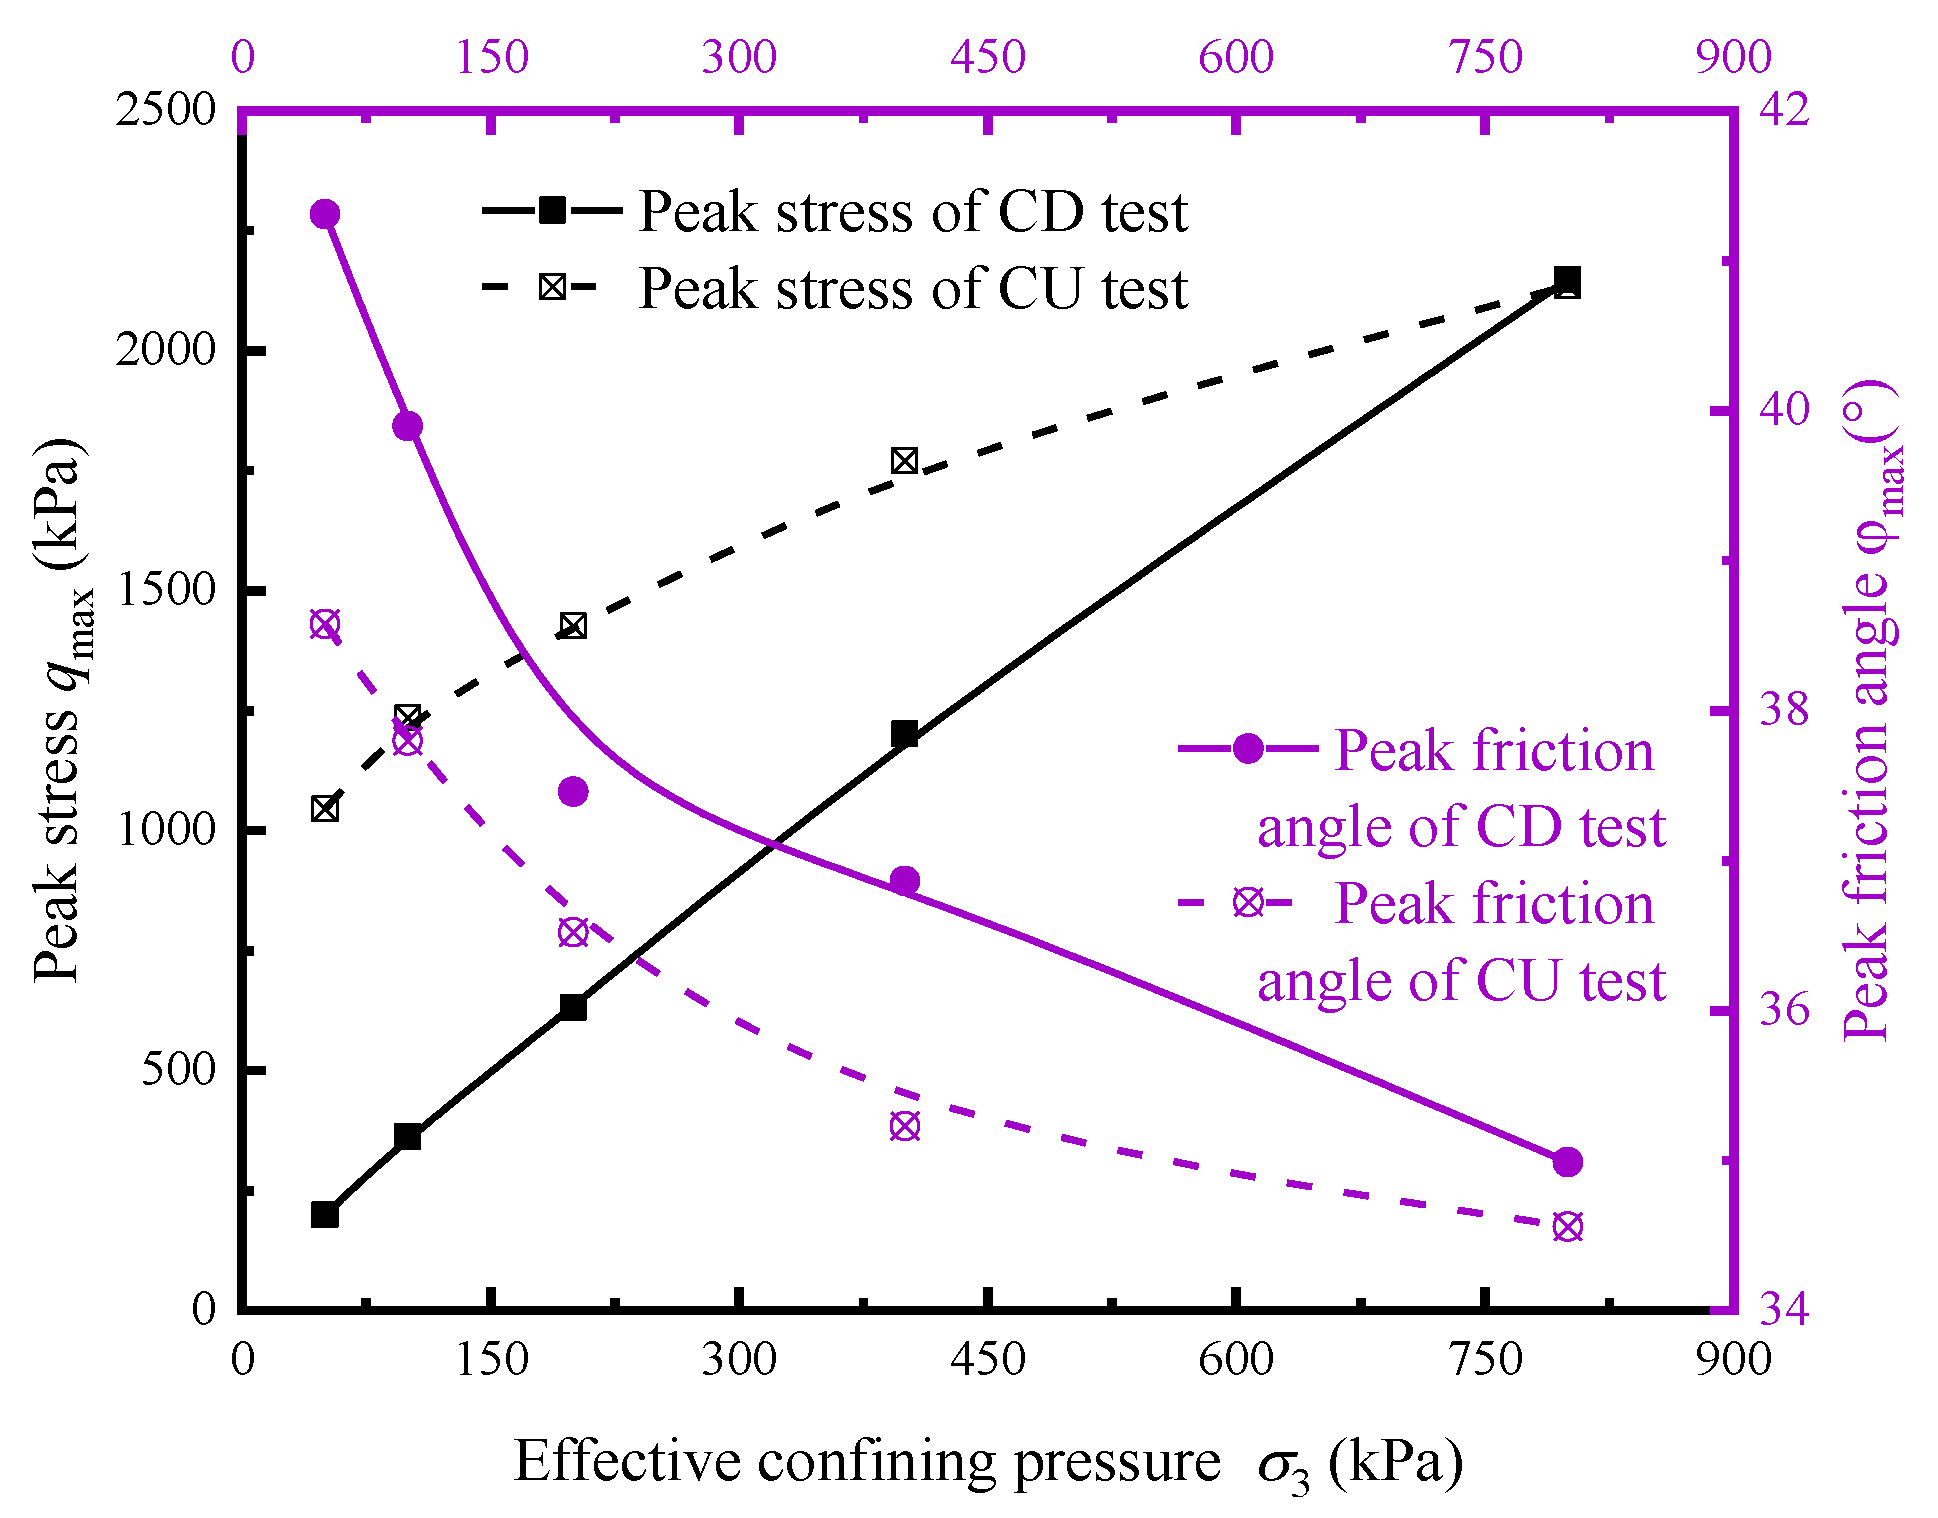
- The generalized peak shear stress of aeolian sand increases linearly with the increase of effective confining pressure under drained and undrained conditions; the undrained strength is greater than the drained strength at low effective confining pressure, and the strength is close to the same with the increase of effective confining pressure. The peak friction angle decreases nonlinearly with the increase of effective confining pressure. The peak friction angle of the two test conditions is quite different at low effective confining pressure and is close to the same at high effective confining pressure.
- (2)
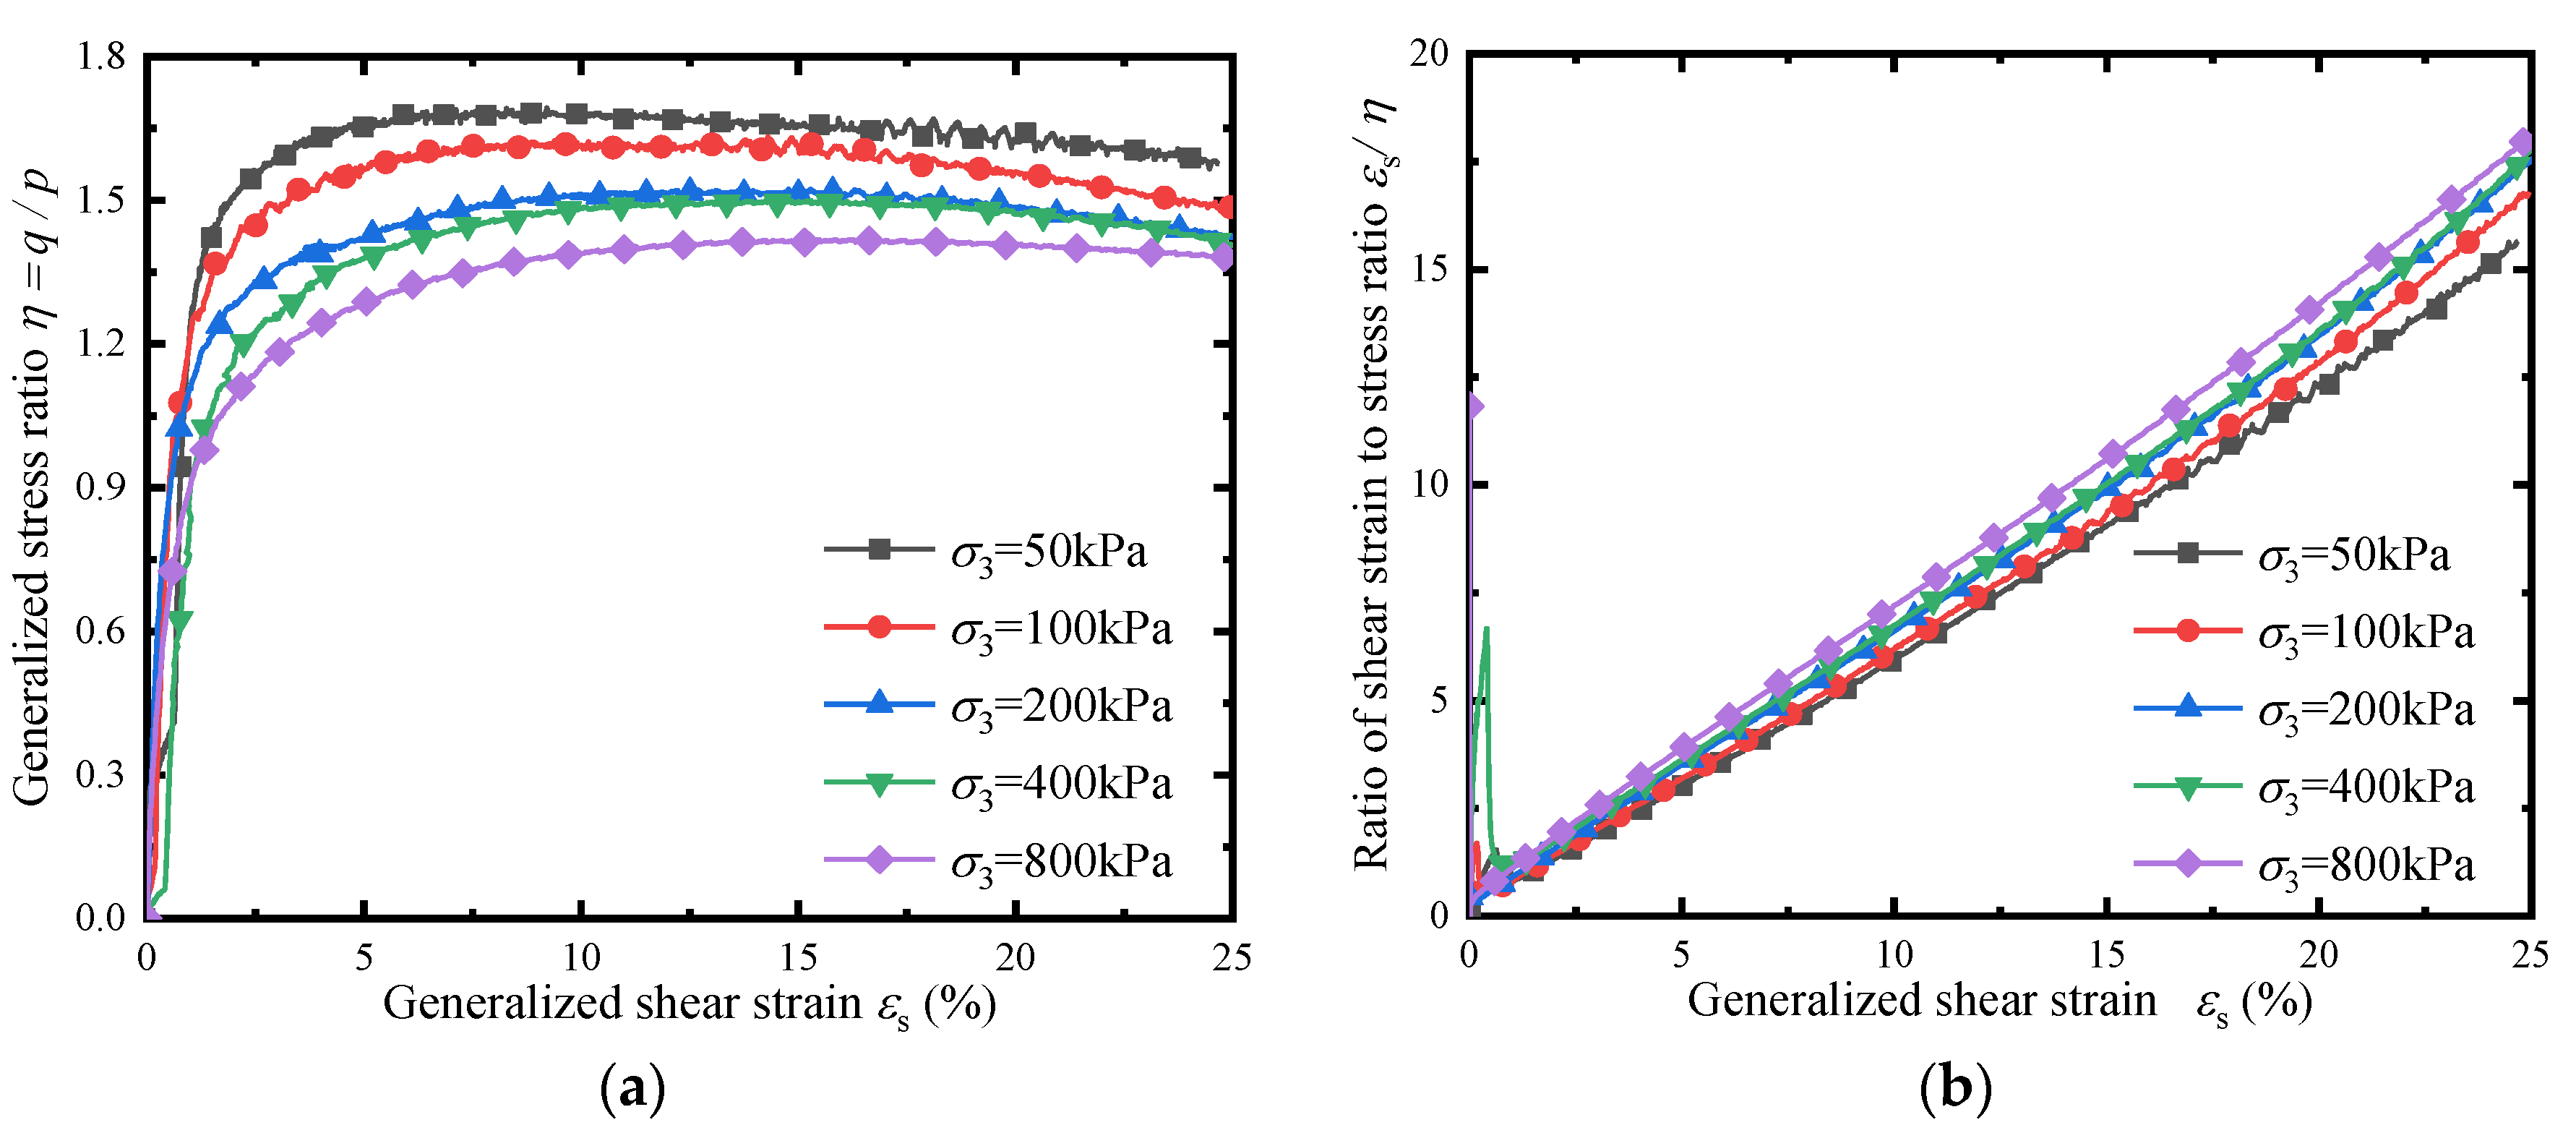
- At low and medium effective confining pressures, the dilatancy is obvious. With the increase of effective confining pressures, the dilatancy develops to contraction. At high effective confining pressures, it only contracts. The development of pore pressure under undrained conditions also reflects a similar law.
- (3)
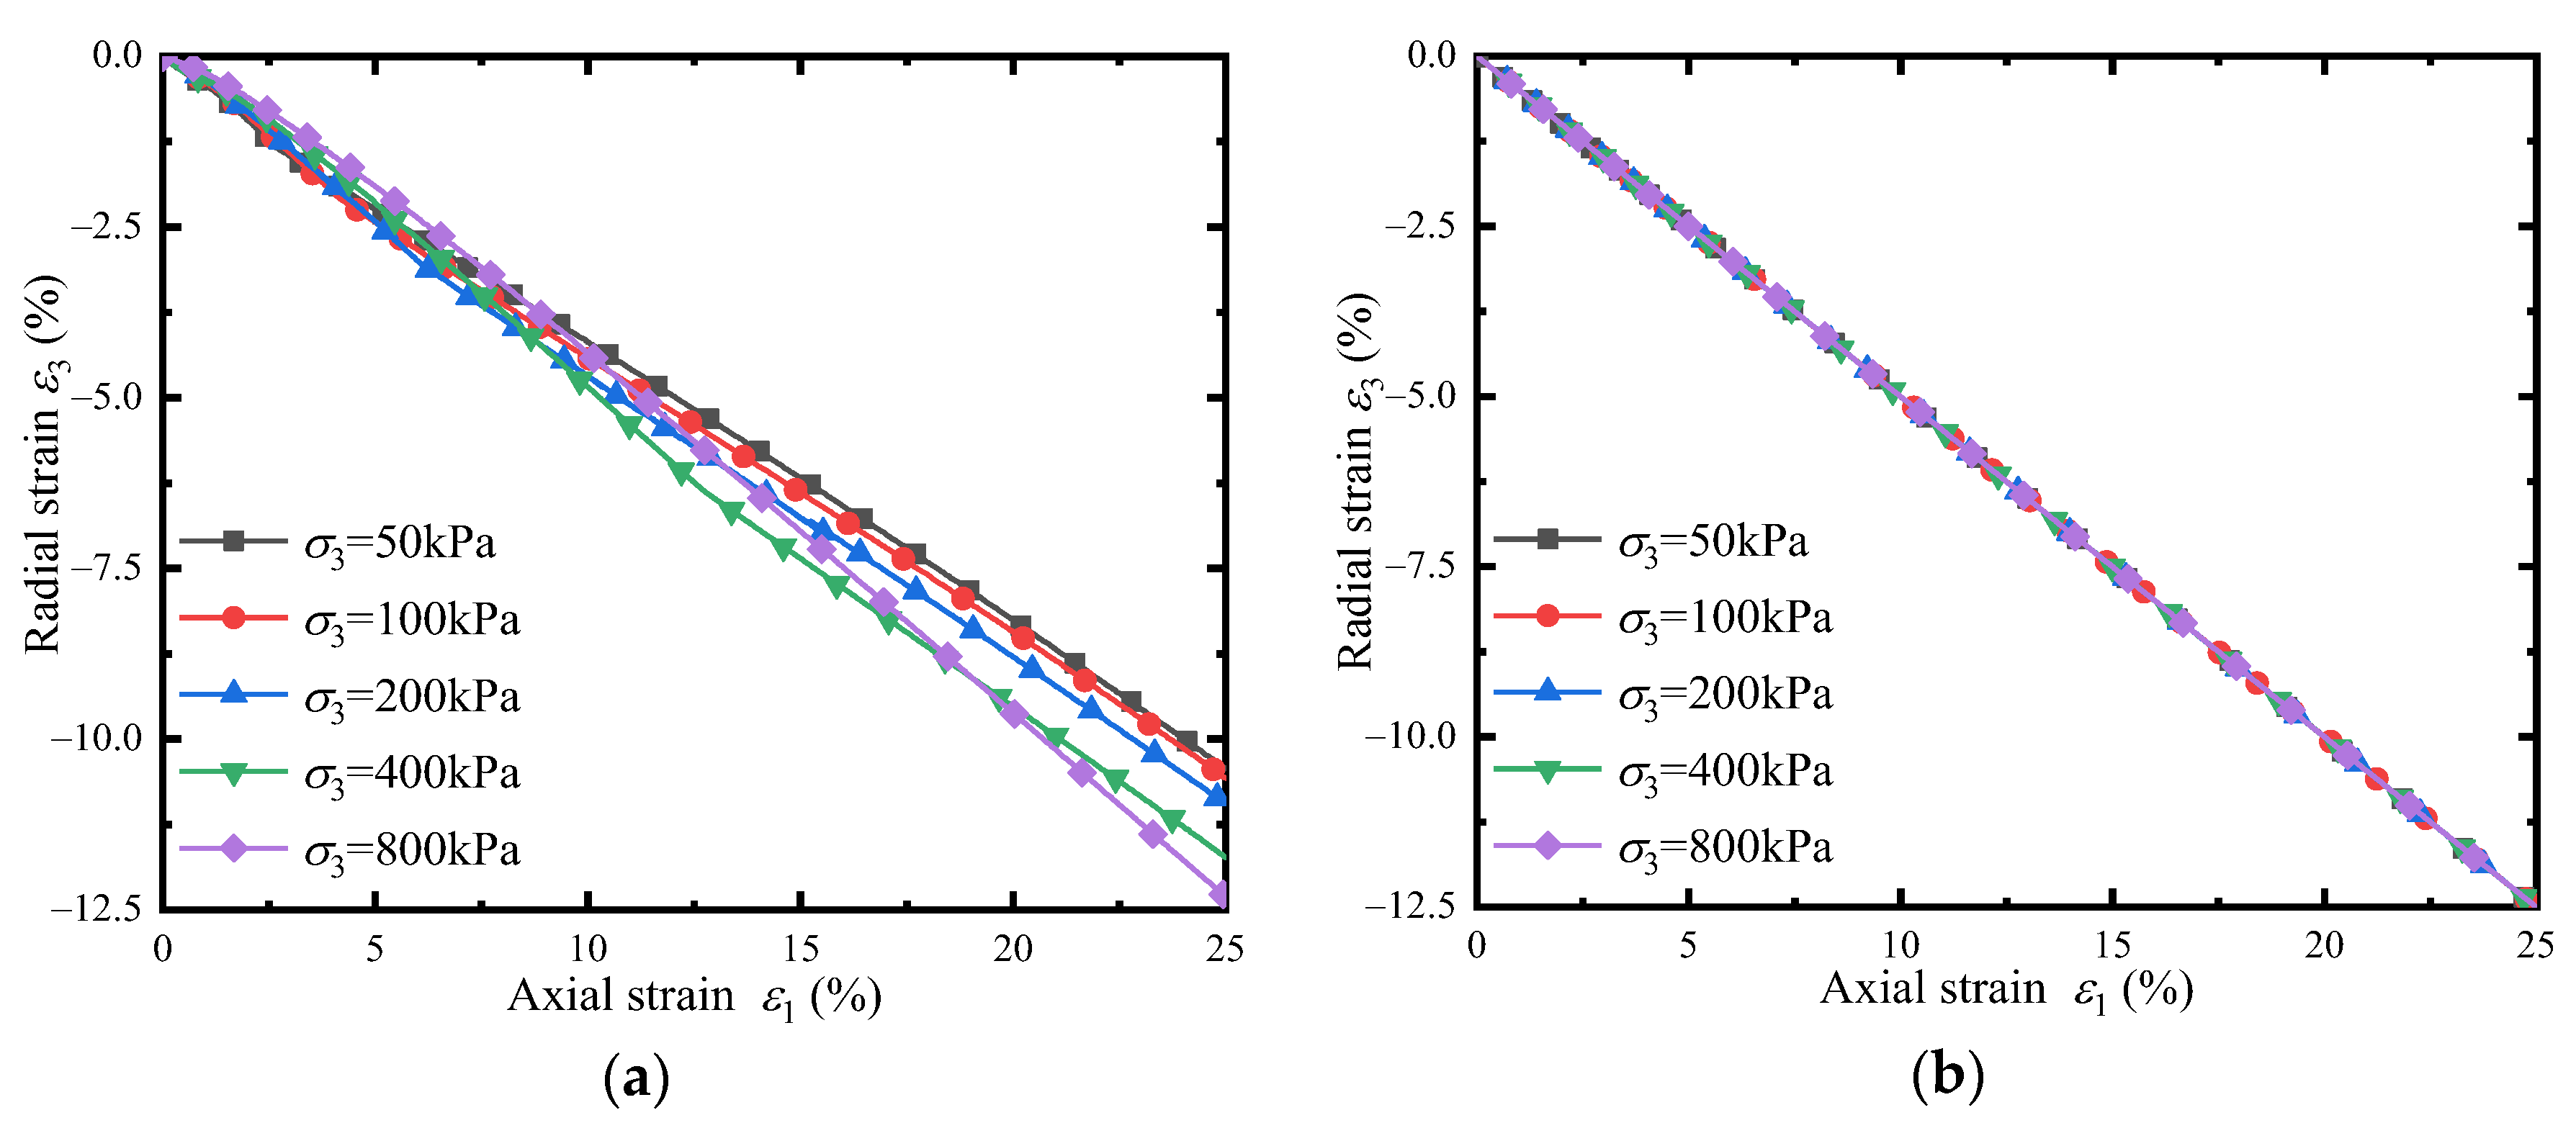
- The medium-density specimen of aeolian sand obtained by the multiple sieving pluviation method has strong initial anisotropy. With the increase of effective confining pressure, the effect of initial anisotropy gradually weakens. While the effective confining pressure is 800 kPa, the initial anisotropy has almost no effect on the deformation characteristics. The initial anisotropy characteristics of the undrained test are not obvious, and the relationships between axial strain and radial strain always satisfy the relationship ε1 = −2ε3.
- (4)
- The three-dimensional state boundary surface of aeolian sand considering dilatancy is quite different from that of remoulded clay. The study of the state boundary surface and the determination of critical state line and phase transformation line equations in three-dimensional space describe the unique state relationship formed by the generalized normal stress, shear stress and void ratio accurately, which can predict the quantitative relationship between stress state and volumetric state reasonably. The state boundary parameters can provide the basis for the establishment of the constitutive model of aeolian sand and provide basic test support for the geotechnical design, construction and maintenance of foundations, roadbeds and another foundation engineering in desert areas.
Author Contributions
Funding
Institutional Review Board Statement
Informed Consent Statement
Data Availability Statement
Conflicts of Interest
References
- Schofield, A.N.; Wroth, P. Critical State Soil Mechanics; McGraw-Hill: London, UK, 1968; Volume 310. [Google Scholar]
- Li, J.; Zhang, J.; Yang, X.; Zhang, A.; Yu, M. Carlo simulations of deformation behaviour of unbound granular materials based on a real aggregate library. Int. J. Pavement. Eng. 2023. [Google Scholar] [CrossRef]
- Fan, H.; Zhang, J.; Zheng, J. Dynamic response of a multi-layered pavement structure with subgrade modulus varying with depth subjected to a moving load. Soil. Dyn. Earthq. Eng. 2022, 160, 107358. [Google Scholar] [CrossRef]
- Wang, X.Y.; Liu, M.H.; Liu, X.; Jia, S.Y.; Xu, Z. Study on mechanical properties and carbon emissions of desert sand and machine—Made sand concrete. China Civ. Eng. J. 2022, 55, 23–30. [Google Scholar] [CrossRef]
- Wang, H.; Huang, X.; Xie, B. Strength and deformation properties of structural lightweight concrete under true tri-axial compression. Case Stud. Constr. Mater. 2019, 11, e00269. [Google Scholar] [CrossRef]
- Wang, Y.H.; Chu, Q.; Han, Q. Filling effect of kubuqi aeolian sand on different classifications of river sand. J. Build. Mater. 2021, 24, 191–198. [Google Scholar]
- Dong, Z.B.; Cui, X.J. Grain-size characteristics of transverse dune during different developmental stages in the southeastern edge of the Tengger Desert. J. Desert Res. 2015, 35, 129–135. [Google Scholar] [CrossRef]
- Liu, Z.Y.; Jin, H.L.; Liu, B.; Xue, W.P. Desert evolution during the mid holocene reflected by grain-size variation of aeolian sand and paleosoil sequence records from Mu Us sandy land. J. Desert Res. 2019, 39, 88–96. [Google Scholar]
- Ning, K.; Li, Z.L.; Wang, N.A.; Sun, J.W.; Shao, W.W. Spatial characteristics of grain size and its environmental implication in the Badain Jaran Desert. J. Desert Res. 2013, 33, 642–648. [Google Scholar]
- Guo, F.; Sun, D.H.; Wang, F.; Li, Z.J.; Li, B.F. Grain-size distribution pattern of the depositional sequence in central Badain Jaran Desert andits genetic interpretation. Mar. Geol. Quat. Geol. 2014, 34, 165–173. [Google Scholar]
- Zhang, D.S.; Tian, L.H.; Lu, R.J.; Tang, Q.L.; Shi, H. Grain-size features of aeolian deposits in the eastern shore of Qinghai lake. Arid. Land Geogr. 2013, 36, 203–211. [Google Scholar]
- Yuan, Y.Q.; Wang, X.C. Experimental research on compaction characteristics of aeolian sand. Chin. J. Geotech. Eng. 2007, 29, 360–365. [Google Scholar] [CrossRef]
- Li, Z.Y.; Cao, Y.W.; Liang, N.X.; Mei, Y.J. Compaction mechanism of aeolian sand. China J. Highw. Transp. 2006, 19, 6–11. [Google Scholar]
- Yin, Y.Z.; Wang, Y.L. Study of Key Parameters in the Process of Aeolian Sand Compactibility. Appl. Mech. Mater. 2014, 278–282. [Google Scholar] [CrossRef]
- Du, X.L.; Yang, J.B.; Zhang, X.F. Research on relationships between shear strength index and in-situ indexes of desert sand. Rock Soil Mech. 2005, 26, 837–840. [Google Scholar] [CrossRef]
- Yu, Y.F.; Zhang, X.F.; Jiao, Q.X.; Zhao, Y.M. Research on engineering properties of desert sands in Taklimakan Desert. J. Desert Res. 2007, 27, 362–366. [Google Scholar]
- Yi, F.; Hong, C.; Xue, Y.Z.; Kaidi, Z. Shear strength of aeolian sand sediments. Trans. ASABE 2018, 61, 583–590. [Google Scholar] [CrossRef]
- Zheng, M.L.; Wang, Q.Q.; Chen, W.; Gao, Y.; Zhang, S.; Zhu, L.L. Materials characteristics and shear strength of aeolian sand in different areas. China Sci. 2021, 16, 415–421. [Google Scholar]
- Yin, Y.Z.; Wang, Y.L. Determine the Shear Strength of Aeolian Sand and Bearing Capacity. Appl. Mech. Mater. 2014, 580, 165–168. [Google Scholar] [CrossRef]
- Li, Y.; Zhang, D.; Wu, C. Sensitivity study of the bearing capacity and pile-soil stress ratio for aeolian sand foundation treated with CFG piles. Rev. TÉCnica De La Fac. De Ing. Univ. Del Zulia 2017, 39, 124–135. [Google Scholar]
- Deng, Y.H.; Li, X.A.; Wang, Z.J.; Song, Y.X.; Pen, J.B. Study on dynamic strength of the aeolian sand inmaowusu desert area. Eng. Mech. 2012, 29, 281–286. [Google Scholar]
- Song, Y.X. Test Study on the Mechanical Property of the Aeolian Sand and the Bearing Capacity of the Aeolian Sand Ground of Mu Us Desert. Ph.D. Thesis, Chang’an University, Xi’an, China, 2011. [Google Scholar]
- Liu, D.; Yang, X.; Wang, J.; Mao, Z.J. Study on Static Strength of Aeolian Sand before and after Cyclic Loading. Appl. Mech. Mater. 2014, 580, 191–194. [Google Scholar] [CrossRef]
- Song, Y.; Zhang, X.D.; Zhang, X. Experimental study on the characteristics of weakened subgrade of aeolian soil along the Beijing-Shenyang super rail. J. Saf. Environ. 2014, 14, 69–73. [Google Scholar]
- Liu, D.P.; Yang, X.H.; Wang, Y.W. Study on the plastic strain characteristics of aeolian sand under cyclic loading. J. Wuhan Univ. Technol. 2014, 36, 103–108. [Google Scholar]
- Luo, J.W.; Li, X.A.; Zhao, N.; Zhou, J.; Zhao, X.K. Experimental study on dynamic characteristics of sandy loess of aeolian sand to loess transitional origin. J. Eng. Geol. 2016, 24, 915–923. [Google Scholar]
- Bao, J.Q.; Xing, Y.M.; Liu, L. Dynamic characteristics of reinforced aeolian sands with geogrid. Ind. Constr. 2019, 49, 77–81+107. [Google Scholar]
- Li, J.; Wang, F.; Yi, F.; Wu, F.; Liu, J.; Lin, Z. Effect of freeze-thaw cycles on triaxial strength property damage to cement improved aeolian sand (CIAS). Materials 2019, 12, 2801. [Google Scholar] [CrossRef] [PubMed] [Green Version]
- Badanagki, M. Shear Strength and Stiffness of a Sahara Sand from Libya. Ph.D. Thesis, Colorado State University, Fort Collins, CO, USA, 2011. [Google Scholar]
- Qureshi, M.U.; Chang, I.; Al-Sadarani, K. Strength and durability characteristics of biopolymer-treated desert sand. Geomech. Eng. 2017, 12, 785–801. [Google Scholar] [CrossRef]
- Souza Júnior, P.L.; Santos Júnior, O.F.; Fontoura, T.B.; Freitas Neto, O.D. Drained and undrained behavior of an aeolian sand from Natal, Brazil. Soils Rocks São Paulo 2020, 43, 263–270. [Google Scholar] [CrossRef]
- Wei, X.; Gao, C.; Ai, K.; Zhao, J.; Xu, L. Mechanical Interpretation of Effects of Aeolian FineSands on Coal Fly Ash in Northern Shaanxi Province, China. Adv. Civ. Eng. 2020. [Google Scholar] [CrossRef]
- Li, X.; Xu, W.; Chang, L.; Yang, W. Shear Behaviour of Aeolian Sand with Different Density and Confining Pressure. Appl. Sci. 2022, 12, 3020. [Google Scholar] [CrossRef]
- Li, X.; Ma, Z.; Lu, W.; Wang, Y. True-Triaxial Drained Test of Tengger Desert Sand. Adv. Civ. Eng. 2020, 2020, 8851165. [Google Scholar] [CrossRef]
- Li, X.F.; Lu, W.N.; Ma, Z.G.; Tuo, N. The Undrained Characteristics of Tengger Desert Sand from True Triaxial Testing. Adv. Civ. Eng. 2021, 2021, 6320397. [Google Scholar] [CrossRef]
- Li, J.S.; Zhang, Y.Z. Undrained monotonic and dynamic triaxial properties of the aeolian sand. In IOP Conference Series: Earth and Environmental Science; IOP Publishing: Bristol, UK, 2019; Volume 242, p. 062010. [Google Scholar]
- Skempton, A. Effective stress in soils, concrete and rocks. Sel. Pap. Soil Mech. 1984, 1032, 4–16. [Google Scholar]
- Wood, D.M.; Belkheir, K. Strain softening and state parameter for sand modelling. GÉOtechnique 1994, 44, 335–339. [Google Scholar] [CrossRef]
- Verdugo, R.; Ishihara, K. The steady state of sandy soils. Soils Found. 1996, 36, 81–91. [Google Scholar] [CrossRef] [PubMed]
- Riemer, M.F.; Seed, R.B. Factors affecting apparent position of steady-state line. J. Geotech. Geoenvironmental Eng. 1997, 123, 281–288. [Google Scholar] [CrossRef]


| Mass of sample taken for fine sieve analysis = 1000 g | ||||
| Sand mass on 2 mm sieve = 0 g | The percentage of sand less than 0.075 mm in the total sand mass = 1.23% | |||
| Sand mass under 2 mm sieve = 1000 g | The percentage of sand less than 2 mm in the total sand mass = 100% | |||
| Particle Size/mm | Cumulative Sand Mass on the Sieve/g | Mass of Sand with Particle Size Smaller than the Aperture/g | The Mass Percentage of Sand with a Particle Size Smaller than the Aperture/% | The Mass Percentage of Total Sand Whose Particle Size Is Smaller than the Aperture /% |
| 0 | 0 | 0 | 0 | 0 |
| 0.075 | 12.3 | 12.3 | 1.23 | 1.23 |
| 0.1 | 131.3 | 143.6 | 13.13 | 14.36 |
| 0.25 | 750.8 | 894.4 | 75.08 | 89.44 |
| 0.5 | 104.4 | 998.8 | 10.44 | 99.88 |
| 1 | 1.2 | 1000 | 0.12 | 100 |
| Material Type | Saturability | Effective Confining Pressure σ3 (kPa) | Drained Conditions | Strain Loading Rate (mm/min) |
|---|---|---|---|---|
| Aeolian sand | More than 95% | 50 | I.Drained II.Undrained | 0.12 |
| 100 | ||||
| 200 | ||||
| 400 | ||||
| 800 |
Disclaimer/Publisher’s Note: The statements, opinions and data contained in all publications are solely those of the individual author(s) and contributor(s) and not of MDPI and/or the editor(s). MDPI and/or the editor(s) disclaim responsibility for any injury to people or property resulting from any ideas, methods, instructions or products referred to in the content. |
© 2023 by the authors. Licensee MDPI, Basel, Switzerland. This article is an open access article distributed under the terms and conditions of the Creative Commons Attribution (CC BY) license (https://creativecommons.org/licenses/by/4.0/).
Share and Cite
Ma, Z.; Li, X. Experiments on the State Boundary Surface of Aeolian Sand for Road Building in the Tengger Desert. Appl. Sci. 2023, 13, 879. https://doi.org/10.3390/app13020879
Ma Z, Li X. Experiments on the State Boundary Surface of Aeolian Sand for Road Building in the Tengger Desert. Applied Sciences. 2023; 13(2):879. https://doi.org/10.3390/app13020879
Chicago/Turabian StyleMa, Zhigang, and Xuefeng Li. 2023. "Experiments on the State Boundary Surface of Aeolian Sand for Road Building in the Tengger Desert" Applied Sciences 13, no. 2: 879. https://doi.org/10.3390/app13020879