Article

A Method to Optimize Routing Paths for City-Pair Airlines on Three-Layer Air Transport Networks

1
College of Civil Aviation, Nanjing University of Aeronautics and Astronautics, Nanjing 211106, China
2
State Key Laboratory of Air Traffic Management System and Technology, Nanjing 210014, China
*
Author to whom correspondence should be addressed.
Appl. Sci. 2023, 13(2), 866; https://doi.org/10.3390/app13020866
Submission received: 31 October 2022 / Revised: 26 December 2022 / Accepted: 3 January 2023 / Published: 8 January 2023
(This article belongs to the Special Issue Analysis, Optimization, and Control of Air Traffic System)

Abstract

:
Air transportation is a huge, complex system with emergence and self-organization, which makes it important for it to be modelled. In this paper, to model the air transportation system with more accuracy, from physical facilities to traffic applications, three-layer networks, including the air route network, the city-pair airline network, and flight operation network, are built, where the air route network is regarded as the physical layer, and city-pair airline network and flight operation network are the application layers. Furthermore, a powerful tool, complex network theory, is applied to discuss the topology characteristics of the three-layer networks. Moreover, considering the path diversity of city-pair airlines, a simulated annealing-based framework is proposed to optimize the routing paths on an air route network for each city-pair airline, such that the traffic congestion of the air route network can be alleviated, where an elaborated method for perturbing solutions, named Selection after Remove (SAR), is adopted. Experimental results show that, compared with the default routing paths, the shortest routing paths, and the random routing paths, the proposed routing-path optimization strategy can reduce the maximum traffic flows of the air route network by 2.4%, 4.6%, and 4.8%, respectively, which shows that the proposed optimization method performs well in alleviating the traffic congestion of the air route network.

1. Introduction

With the development of the economy, the air transportation system is becoming more important than ever before due to its intrinsic value, high speed, and high security. Without a doubt, a better understanding of the air transportation system is important for policy, administration, and efficiency reasons. Unfortunately, the air transportation system is a huge, complex system with emergence and self-organization, whose behaviours are hard to predict. Therefore, it is necessary to model the air transportation system.
In the last twenty years, two human-made infrastructures, airline networks and air route networks, have been used to model air transportation system. Furthermore, complex network theory [1] has been used to study the air transportation system extensively, from topology analysis to functional analysis. However, these two infrastructures do not deeply consider the natural relation between traffic and transportation.
According to a report from the International Civil Aviation Organization (ICAO), the number of city-pair airlines in the world has increased by approximately 30% from 2005 to 2014 [2]. Meanwhile, the increasing air traffic flows could finally exceed the capacity limit of the current air traffic management (ATM) system, resulting in the demand-capacity imbalances problem [3] and the air-traffic congestion problem. Additionally, the air-traffic congestion problem will dramatically increase the load of air-traffic control managers and impede the safety and the performance of flights.
Generally, there are two ways to deal with the congestion problem of air transportation systems [4,5]. The first is the construction of infrastructure, such as building new airports and runways to increase the system’s capacity—a long-term strategy. However, doing so would take a long time and would have a high cost due to the need to build new airports and runways. The second is to regulate and reshape the flying traffic flow using Traffic Management Initiatives (TMIs) [6]. TMIs can be classified into two categories: (1) strategic actions, which are the strategies taken before the aircraft has taken off; (2) tactical actions, which are the strategies taken after the aircraft is airborne. In this paper, we will focus on the strategic actions to alleviate the congestion problem.
When one aircraft flies in the sky, it follows its flight plan route though airways, much like highways on the ground. Generally, there are at least two pre-planned routes for most airlines. However, in practice, air traffic managers usually take a default routing path for each city-pair airline (that is, a pair of airports) without considering the traffic flows on the air route network, resulting in the congestion of some air route segments. Therefore, it is necessary to select the optimization routing path on the air route network for each city-pair airline, in strategy stage, from the candidate pre-planned routing paths with minimization of the congestion of air route network.
In this study, to understand the nature of traffic and transportation deeply, three-layer networks were built to model the air transportation system from physical facilities to traffic applications. In addition, to reduce the congestion of air route segments in the air route network, a simulated-annealing-based method is proposed to select optimized routing paths for each city-pair airline based on the three-layer air transport network.

1.1. Related Work

As mentioned in [7], there are many previous works focused on the modelling of air transportation systems. A pioneering study [8] presents the China air network with graph theory and analyses its part features of small worlds and of scale-free networks. Based on this initial study, many researchers [9,10] have applied weighted networks [11] or complex networks [12] to analyse existing air transportation systems, where each node represents one airport (or a city), and an edge exists if there is a flight between two airports.
In [13], the authors exhaustively analysed the worldwide airport network and found out that it should be a small-world network with a power-law degree distribution [14]. Verma et al. [15] depicted three different layers of the world airline network based on the k-core decomposition algorithm. G. Bagler [16] described the Airport Network of India as a complex weighted network, which is a small-world network with a truncated power-law degree distribution and has a signature of hierarchy. In [17], the authors investigated the structure and evolution of the Brazilian Airport in terms of four aspects: routes, connections, passengers, and cargo. J. Tao [18] presented an exploratory analysis of the evolution of the US airport network from 1990 to 2010. In [19], the multi-layer structure of the European airport network, composed of connections and flights between European cities, was decomposed using the k-core decomposition of the connections network. In [8], the authors showed that the topological structure of the Chinese airport network shares two feature of small worlds, a short average path length and a high degree of clustering. J. Zhang et. al [20] analysed the evolution of Chinese airport network via complex network theory and found out that the topology remains steady through the past several years, but the cargo traffic and passengers have been growing in an exponential rate. W. Du et.al [21] proposed a k-core decomposition method to decompose the Chinese airline network into three layers, core layer, bridge layer, and periphery layer, which revealed the unique demographic and geographical properties of China. In [22], the authors carried out an empirical structural analysis of the Chinese airline network with complex network theory. S. Wandelt et al. [23] made comparisons between airport networks of Australia, Brazil, Canada, China, India, Russia, US, and Europe in the network properties and found that all of eight networks clearly share small-world properties.
However, the airport network shows only one perspective of the air transportation systems. From another perspective, it is necessary to consider where aircraft actually fly through the airspace. As the backbone of the air transport network, the air route network has been extensively studied as well.
K. Cai et al. [24] studied the Chinese air route network under the framework of complex networks and made some comparisons between the basic network features of the air route network and the airline network. The authors illustrated that the topological structure of the air route network is more homogeneous than that of the airport network, while the distribution of the flight flows in the air route network is rather heterogeneous. In their following work [25], the authors proposed a novel Memetic Algorithm for air route networks design. W. Du et al. [26] proposed a memetic algorithm to explore the robustness of the Chinese air route network, which identified the vital edges that form the backbone of Chinese air transportation system. X. Sun et al. [27] analysed the air navigation route system from fifteen different countries in terms of five metrics using complex network theory and found that air navigation route networks for all fifteen countries are rather heterogeneous. X. Sun et al. [28] analysed the European air transportation system using the two network layers, including the air route network and the airport network. In addition, the authors studied daily and seasonal variations in seven centrality measures for each network layer in the period from 2011 to 2013. In addition, the airport network was shown to have temporal characteristics because the existence of flights between any airport pair changes over time according to the flight schedules. J. Mou et al. [2] obtained a time series of topological statistics by sliding the temporal CAN with an hourly time window to analyse the temporal pattern of the Chinese Aviation Network (CAN). In [29], the authors focus on how global air traffic is integrated at the local scale along with operational time, and the results provide insights on the reliability management for the temporal airport network.
However, the aforementioned works model the air transportation system generally using either the city-pair airline network or the air route network without considering the flight operation network (air traffic flows derived from the real flight plan), which is directly related to the air route network congestion. However, the relations between the air route networks, airline network, and air traffic flows are rarely studied (shown in Table 1).

1.2. Our Contributions

In this paper, to model the air transportation system more accurately, from physical facilities to traffic applications, three-layer networks, including air route networks, city-pair airline networks (airport networks), and flight operation networks, are built, where air route networks are regarded as the physical layer, and airport networks and flight operation networks are the application layers. Moreover, considering the path diversity of airlines, a simulated annealing-based framework is proposed to optimize the routing paths for city-pair airlines (airlines between airports) on the three-layer networks, such that the traffic congestion of air route network can be alleviated. The main contributions of this paper are outlined as follows.
(1)
The three-layer networks, including air route network, city-pair airline network and flight operation network, are built to model the air transportation system from physical facilities to application, where the air route network is regarded as the physical layer, and the city-pair airline network and flight operation network are the application layers. In addition, the topology characteristics of the three-layer networks are analysed using the complex network theory.
(2)
A simulated annealing-based method is proposed to optimize the routing paths of each city-pair airline based on the three-layer air transport networks, such that the congestion issue of air route segments in the air route network can be reduced.
Experimental results show that, compared with the default routing paths, the shortest routing paths, and random routing paths, the proposed routing paths optimization strategy can reduce the maximum traffic flows of air route network by 2.4%, 4.6%, and 4.8%, respectively.
The remainder of the paper is organized as follows. Section 2 provides the construction method of air transport networks and the mapping relations between the three-layer networks. Furthermore, the problem definition of optimizing routing paths for airlines is also introduced. Section 3 discusses the simulated-annealing based method to optimize the routing paths for airlines in detail. Experimental results and conclusions are shown and discussed in Section 4 and Section 5, respectively.

2. Multi-Layer Air Transport Networks

2.1. Construction of Air Transport Networks

In this paper, to model the air transportation system more accurately from physical facilities to traffic applications, three-layer networks, including air route networks, city-pair airline networks, and flight operation networks, are built, which are defined as follows.
Definition 1.
Air Route Network Graph G A R N , which is a undirected graph G A R N = ( W , R ) , whereeach node w i W represents a waypoint and each edge r i , j = ( w i , w j ) R represents the existence of an air route segment between waypoint w i and w j .
An air route network G A R N plays a fundamental role in the infrastructure of air traffic management systems, where each air route waypoint is a navigation marker whose longitude and latitude coordinates are determined by the ground navaids, which can help the pilots with information about the desired track and the direction that the aircraft is heading. Recently, assisted by GNSS, many waypoints have been set by air traffic managers, without any real ground navaids. In addition, the volume of flights routed on the air route segments will affect the control load of air traffic managers. Thus, it is necessary to optimize the distribution of air traffic flows on the air route segments of the air route network.
Definition 2.
City-Pair Airline Network Graph G A N , which is a directed graph G A N = ( A , L ) , where each node a i A represents a city and each directed edge l i , j = ( a i , a j ) L represents the existence of a direct airline from city a i to city a j .
In fact, flights are allowed to take off from city a i to a j only if there exists a corresponding city-pair airline ( a i , a j ) in G A N . Thus, there must be exist one routing path (that is, a sequence of air route segments from city a i to a j ) at least in air route network G A R N for each city-pair airline ( a i , a j ) in G A N .
Figure 1 shows a simple example to illustrate the air route and the city-pair airline from Beijing to Nanjing. In Figure 1, the air route segments are drawn by the solid line and have a sequence of waypoints located along the segment. Furthermore, the city-pair airline between Beijing and Nanjing is shown as the dotted straight line. However, aircraft in reality will not directly fly from one airport to another along the city-pair airline but fly along the air route segments.
To take the actual flight operations (flight schedule) into consideration, a flight operation network G F N t is defined. In this paper, a flight f is associated with a 4-tuple ( a i , a j , t f d e p , t f a r r ) , where a i and t f d e p represent the departure airport and departure time, and a j and t f a r r represent the arrival airport and arrival time. Due to the continuity of flight operation in a day, we discretise the time axis of a day into a set τ = { 1 T , 2 T , n T } of consecutive time periods, and the size of time interval T can be set to any value. Therefore, the flight operation network, G F N t , in a time interval [ t , t + T ] can be defined as follows.
Definition 3.
Flight Operation Network Graph G F N t , which is a directed graph G F N t = ( A t , E t ) , where each node a i A t represents an airport and each directed edge e i , j t = ( a i , a j ) E t represents the existence of a direct airline from airport a i to airport a j during the time interval [ t , t + T ] .
According to the definition of G F N t , the edge e i , j t in time interval [ t , t + T ] exists if and only if there is a flight f that meets one of the following four situations [2].
(1)
t < t f d e p and t f a r r < t + T
(2)
t f d e p < t and t f a r r < t + T
(3)
t < t f d e p and t + T < t f a r r
(4)
t f d e p < t and t + T < t f a r r
According to the definition of G F N t , Figure 2 gives the constructed flight operation networks based on the flight schedule in 2019. In Figure 2, the span of a time interval T is set to one hour; thus, it will generate 24 ( n T = 24 ) flight operation networks. From Figure 2, we can see that the spatial variation and the connects between airports are changed over 24 h, and the connects in the [ 0 , 1 ] time interval are much sparser than others, which is in line with the actual situation.

2.2. Mapping of Air Transport Networks

The three-layer networks, including air route networks, city-pair airline networks, and flight operation networks, can model the air transportation system more accurately from physical facilities to traffic applications, where the air route network plays the fundamental role in the architecture of the air traffic management system, and city-pair airline networks and flight operation networks are the application layers, which can represent that the flights’ operation on the air route network.
To illustrate the mapping relations of the three-layer air transport networks, Figure 3 gives a simple example with only six cities, JiNan, HeFei, YanCheng, NanTong, NanJing, and ShangHai. Figure 3a–c show the flight operation network in the time intervals of 9:00–10:00, 18:00–19:00, and 21:00–22:00, respectively, which are constructed on the timetable of flights in 2019. Figure 3d shows the city-pair airline network among these six cities, where nine direct airlines exist, including “Shanghai → Hefei”, “Shanghai → Nanjing”, “Shanghai → Nantong”, “Shanghai → Yancheng”, “Shanghai → Jinan”, “Jinan → Hefei”, “Jinan → Nanjing”, “Nanjing → Hefei”, and “Jinan → Hefei”. From Figure 3a–d, we can see that the flight operation network must be the sub-graph of the city-pair airline network, because the flights can be allowed only if there exists a corresponding airline between the cities. Figure 3e is the air route network of China, and Figure 3f shows the routing path “Hefei → WZPYI→ BSSZ → Shanghai” on the air route network for the city-pair airline “Hefei → Shanghai”.
The coupling relations of the three-layer networks are discussed in detail as follow.

2.2.1. Coupling Relationship between G A N and G A R N

For the city-pair airline network G A N , each city-pair airline l i , j L ( G A N ) from city a i to a j must have at least one corresponding routing path in the air route network G A R N , and one routing path is a sequence of air route segments. For example, as shown in Figure 1, for a city-pair airline “Beijing → Nanjing”, the corresponding routing path on the air route network G A R N includes five air route segments, that is, “Beijing → IDKUP→ Jinan→ DALIM→ UDINO→ Nanjing”.
For each air route segment r i , j = ( w i , w j ) R ( G A R N ) in the air route network G A R N , we can obtain all the city-pair airlines, whose routing path contains the air route segment ( w i , w j ) . For example, for the air route segment “DALIM→ UDINO”, we can obtain the city-pair airlines, whose routing path contains the air route segment “DALIM→ UDINO”, such as a city-pair airline “Beijing → Nanjing”.

2.2.2. Coupling Relationship between G A N and G F N

For each city-pair airline l i , j = ( a i , a j ) L ( G A N ) from city a i to a j , there may exist many flights along the city-pair airline or not; thus, the flight operation network is the sub-graph of the city-pair-airline network. In addition, the flights along the city-pair airline are scheduled by different airline companies at different times in a day. Therefore, the flight operation network G F N can be obtained by extending each city airport of G A N along the time axis into 24 time intervals. Furthermore, then, according to the arrival and departure time of all flights based on the timetable of flights, and definition 3, we can obtain the 24 flight operation networks, which are the sub-graph of the city-pair airline network.
Furthermore, we can also obtain the city-pair airline network G A N from flight operation network G F N , where the nodes in G A N are defined as follows: A ( G A N ) = 1 t 24 A t ( G F N t ) . Furthermore, the edges l i , j = ( a i , a j ) in G A N are defined as follows:
l i , j = t r u e , i f t [ 1 , 24 ] , e i , j t ( G F N t ) = = t r u e f a l s e . o t h e r w i s e

2.2.3. Coupling Relationship between G A R N and G F N

As discussed earlier, from the coupling relationships between G A N and G A R N , we can obtain all city-pair airlines, whose routing path contains a given air route segment. Furthermore, for each city-pair airline l i , j = ( a i , a j ) L ( G A N ) , we can also obtain the flights along this city-pair airline at different times. Thus, for a given air route segment, we can obtain the flights through it.
Conversely, for each flight f i in G F N , the routing paths on G A R N that it will fly in reality can be obtained by the coupling relations of three-layer networks.
According to the mapping relations between the three-layer air transport networks, we can find that the flight operation network will affect the traffic flow distribution ofthe air route network if the routing paths for city-pair airlines are determined.

2.3. Problem Description
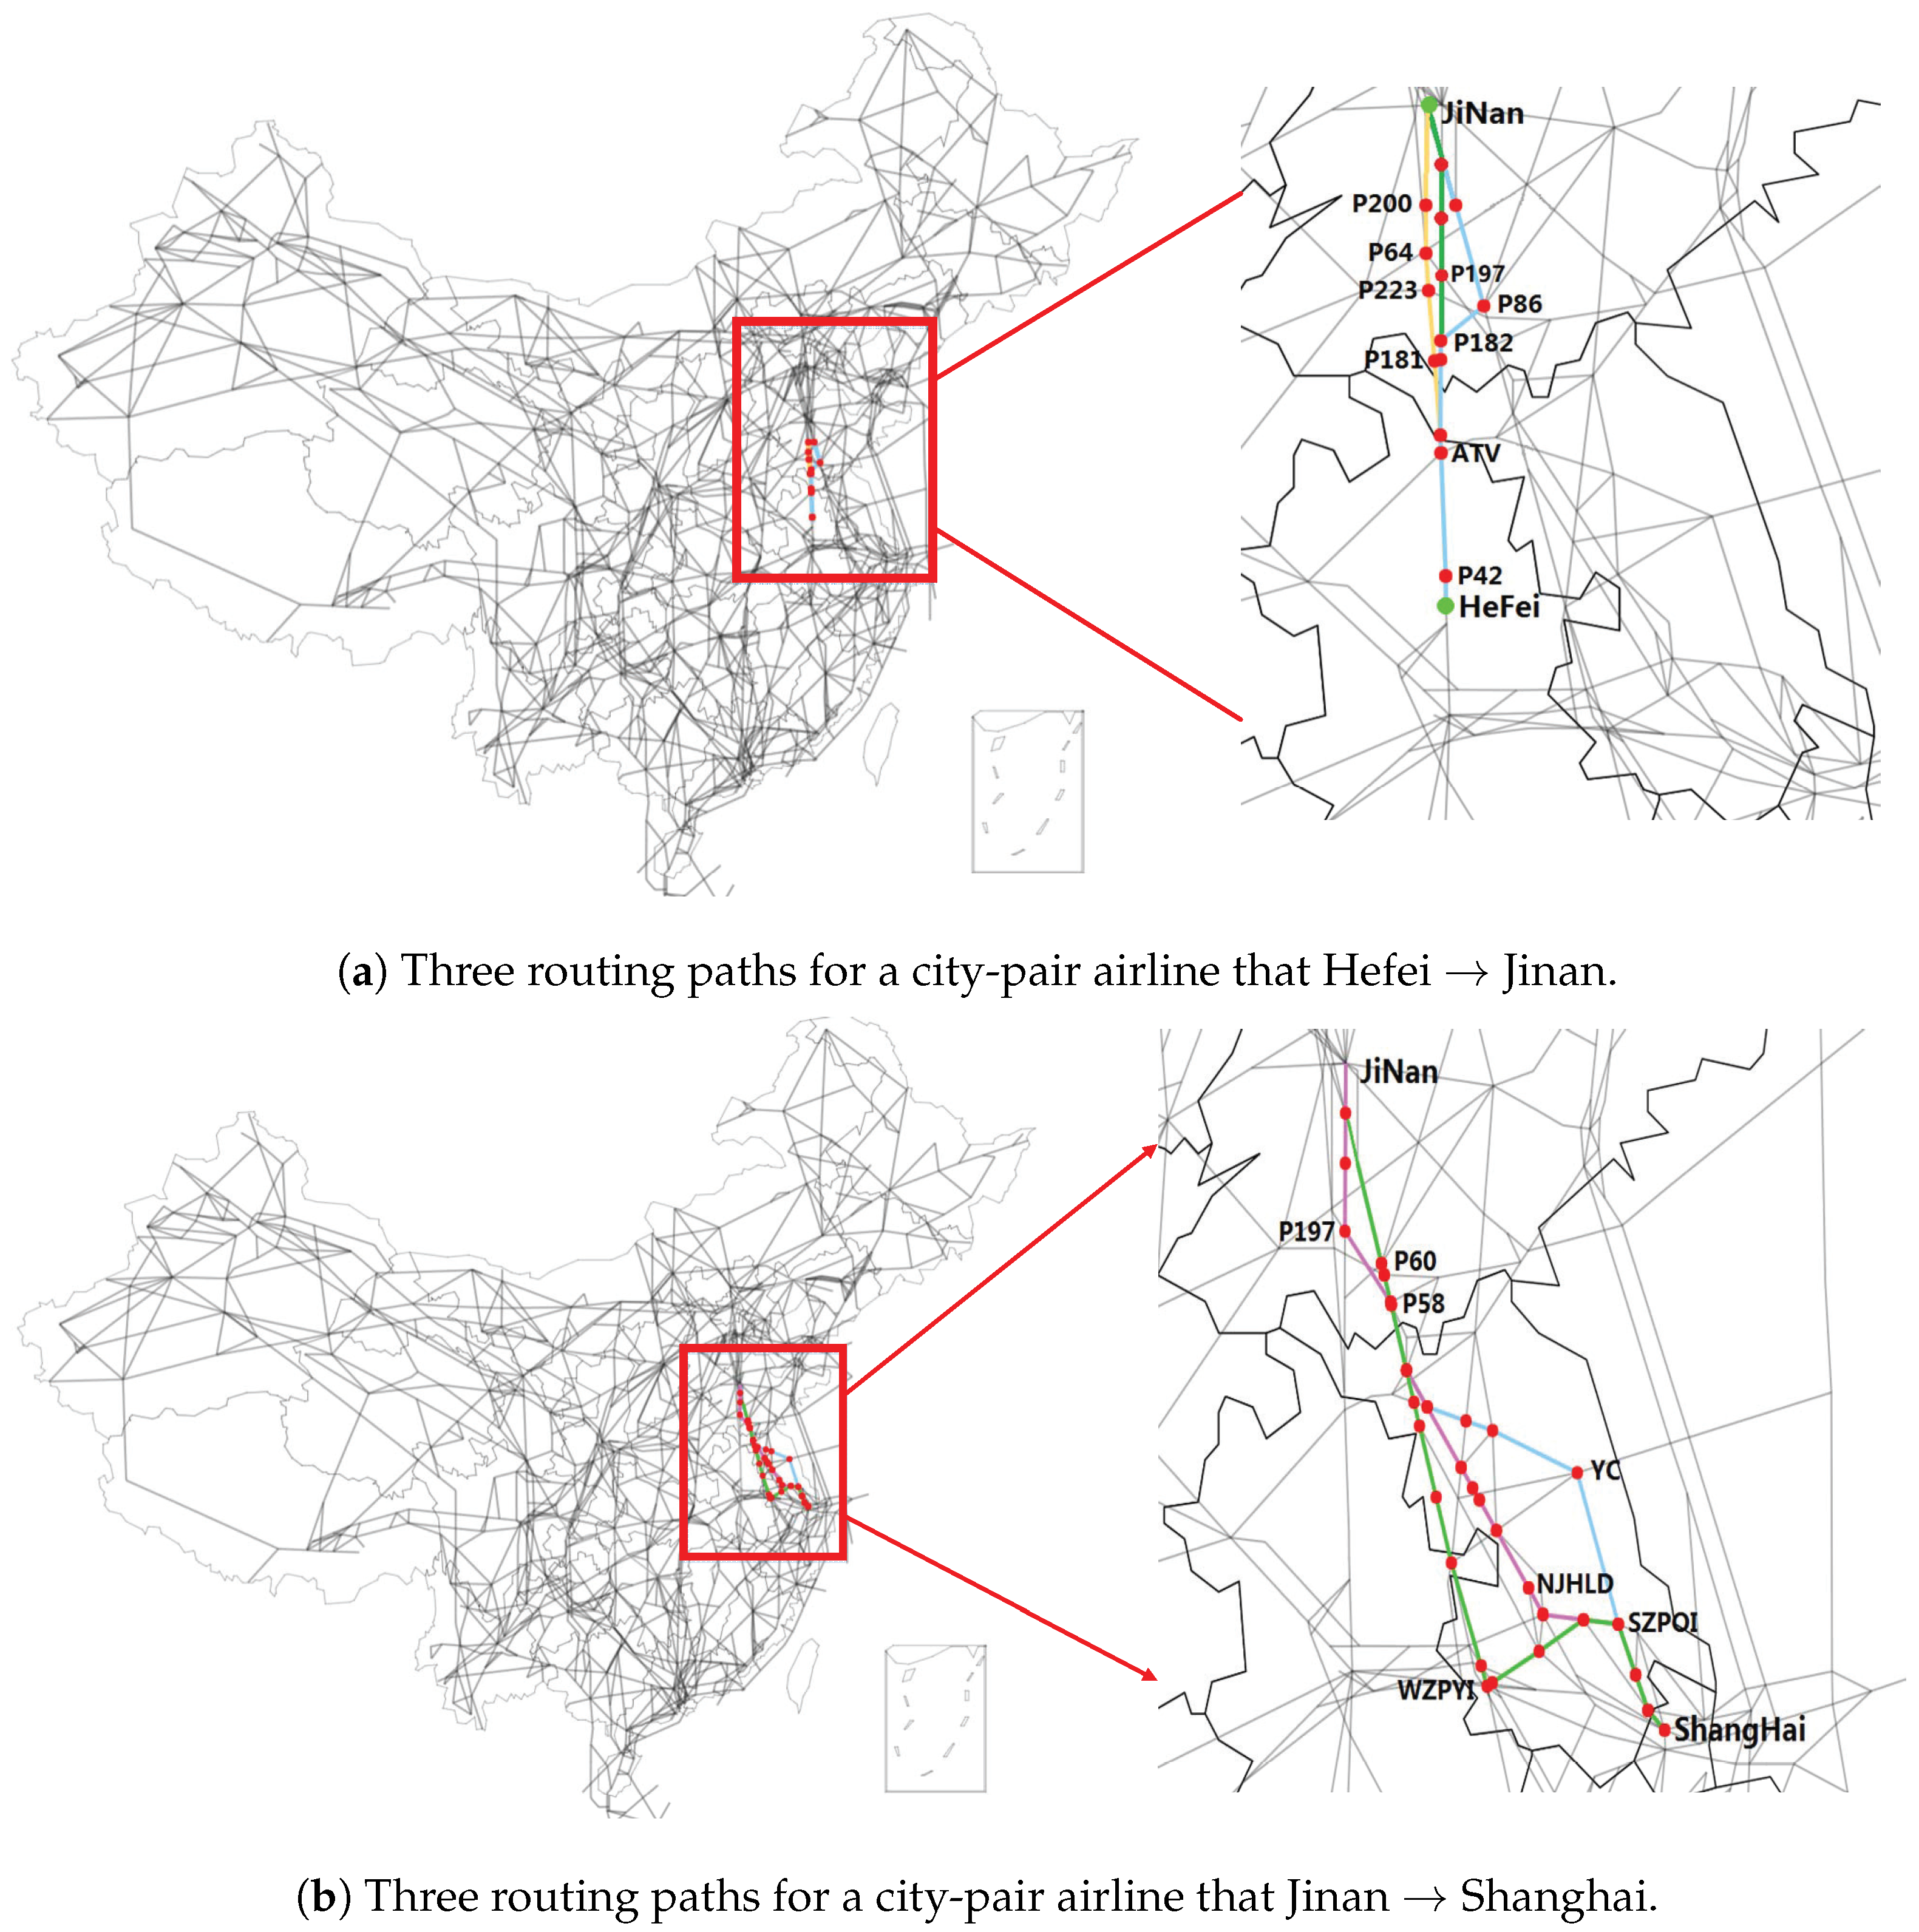
Generally, a city-pair airline (or a pair of airports) in an airline network G A N may correspond to multiple routing paths on the air route network G A R N as shown in Figure 4. In Figure 4a, given a city-pair airline from Jinan to Hefei, there are three candidate routing paths on the air route network, including
(1)
JiNan → P200 → P64 → P223 → P181 → ATV → P42 → Hefei
(2)
JiNan → P86 → P182 → ATV → P42 → Hefei
(3)
JiNan → P197 → P182 → ATV → P42 → Hefei
In Figure 4b, given a city-pair airline from Jinan to Shanghai, there are three candidate routing paths on the air route network, including
(1)
JiNan → P197 → NJHLD → SZPOI → ShangHai
(2)
JiNan → P58 → WZPYI → SZPOI → ShangHai
(3)
JiNan → P60 → YC → SZPOI → ShangHai
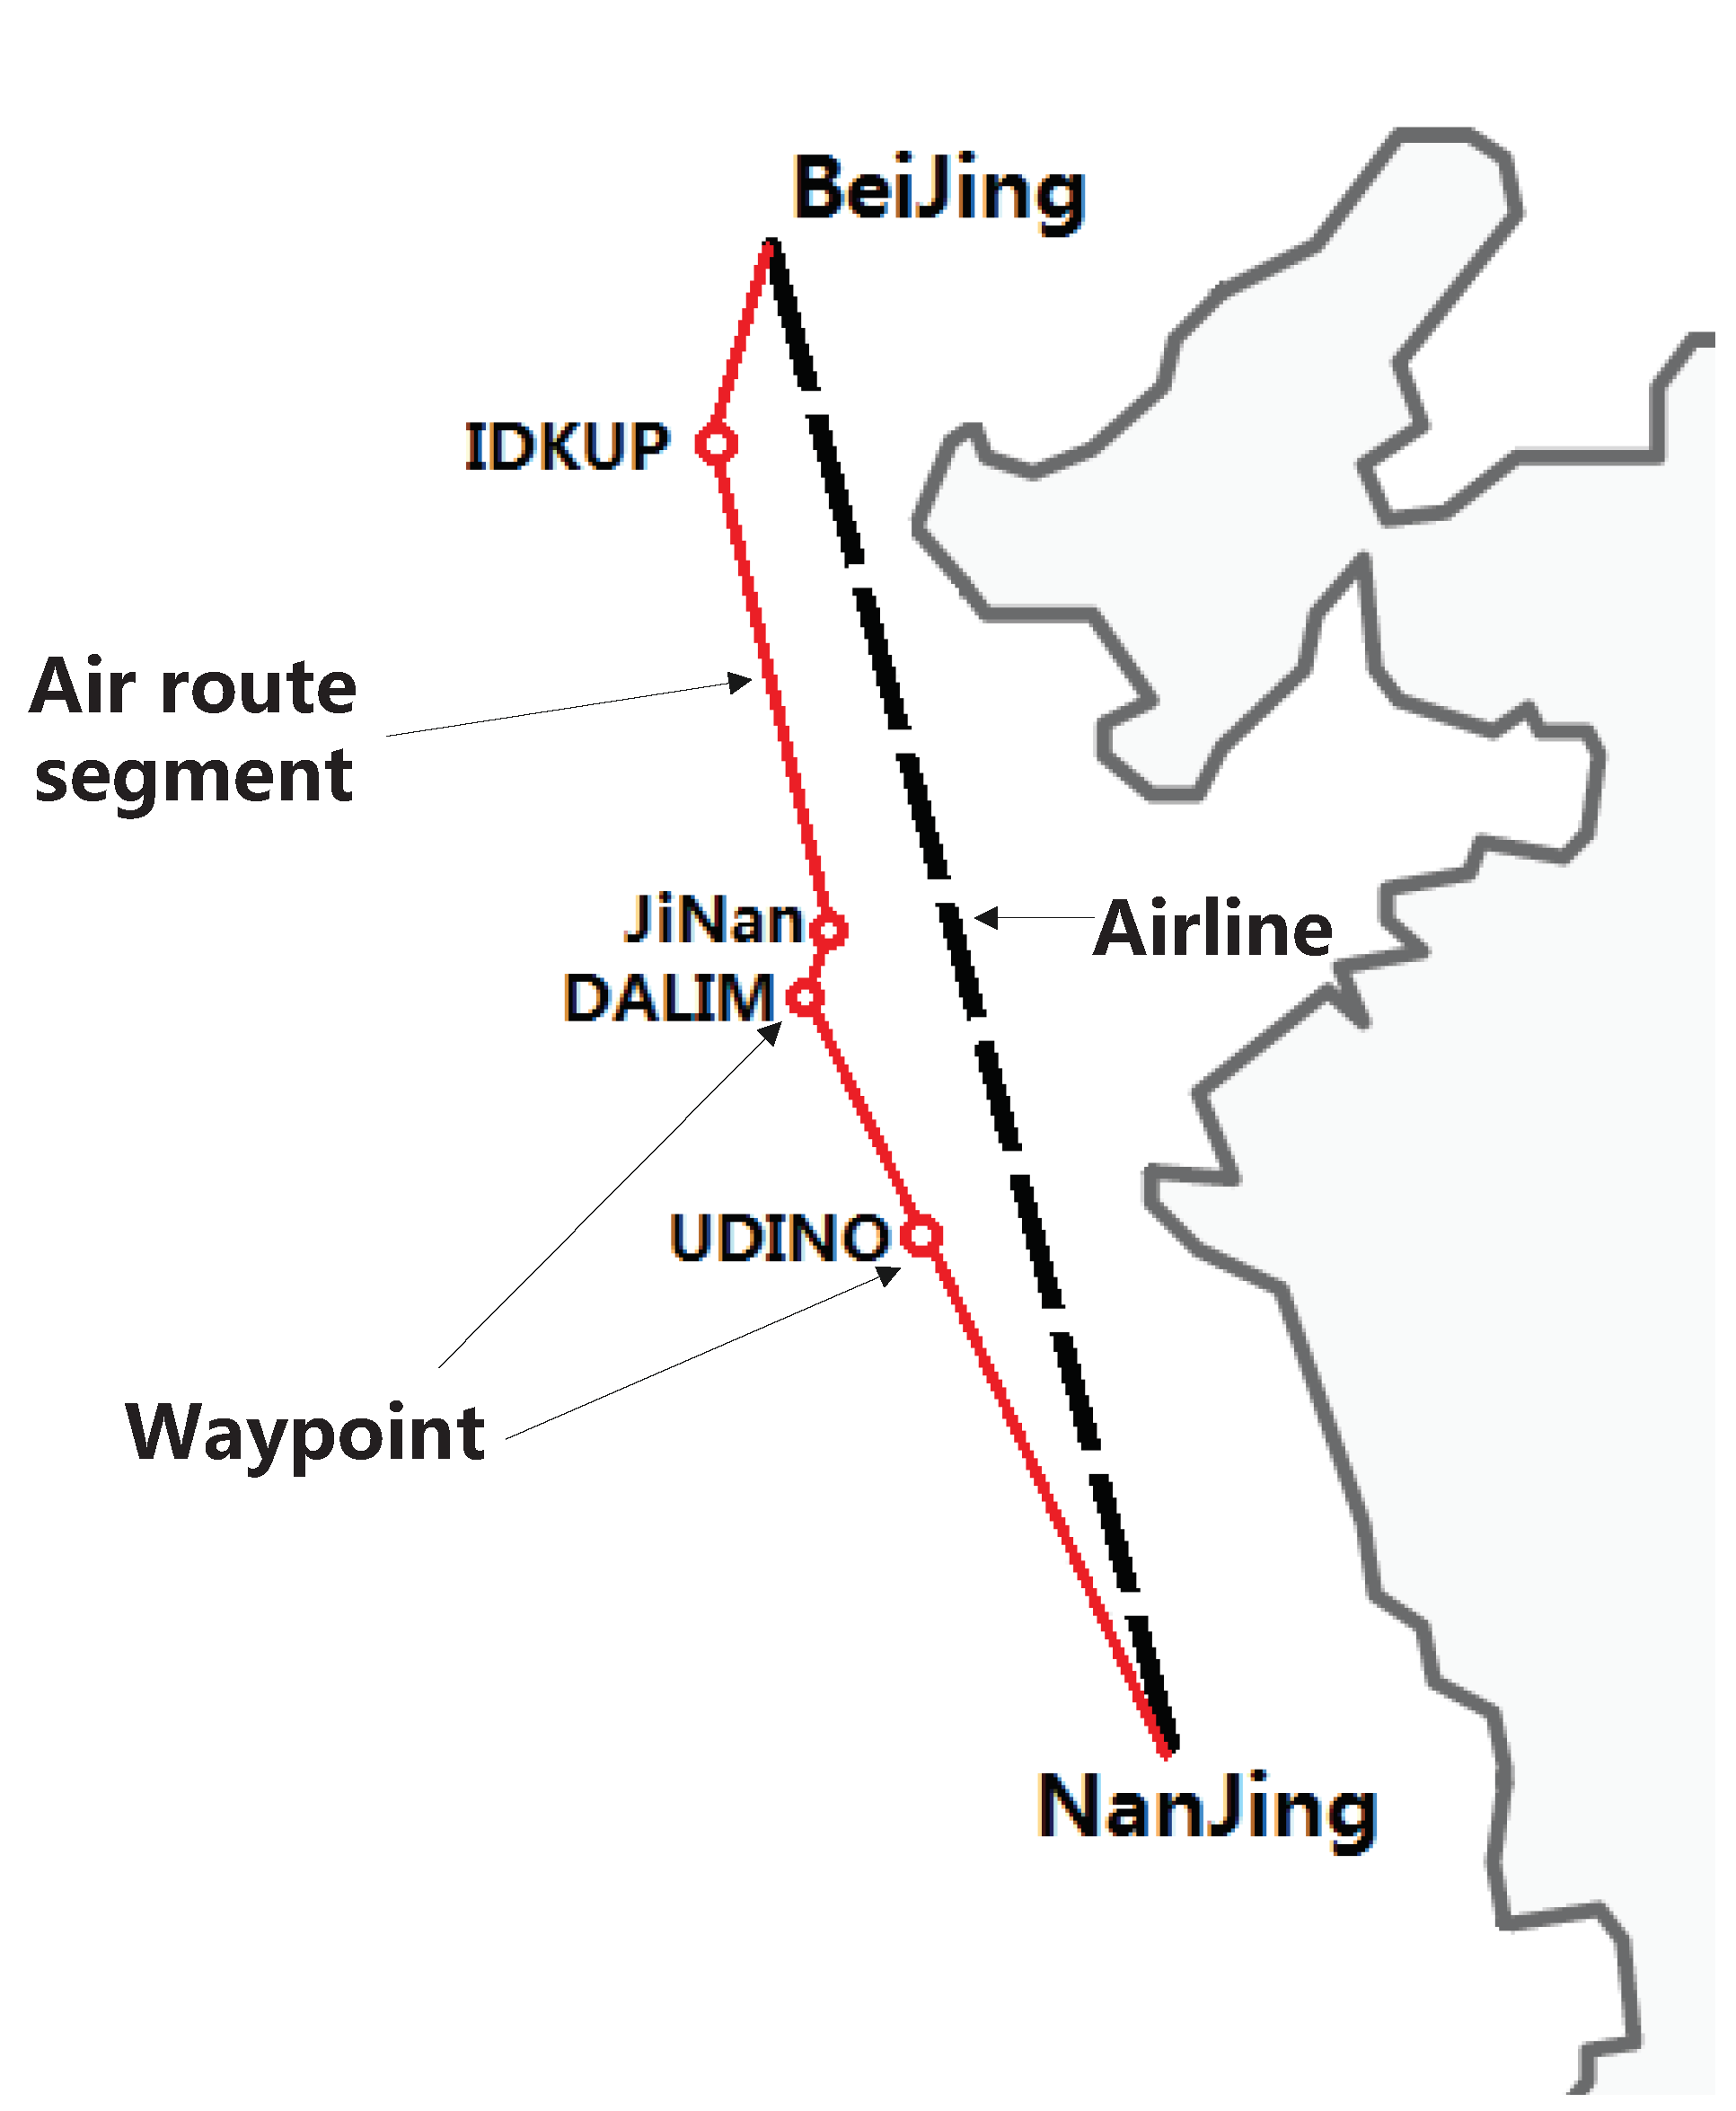
However, in reality, air traffic managers usually take default routing paths for each city-pair airline, and all the traffic flows between the pair of cities are along the default routing path. However, the simple routing path selection strategy for city-pair airlines may incur the congestion of some air route segments on the air route network. For example, if the city-pair airline “Jinan → Hefei” takes the routing path that “JiNan → P197 → P182 → ATV → P42 → Hefei”, and airline “JiNan → ShangHai” takes the routing path that “JiNan → P197 → NJHLD → SZPOI → ShangHai”, the shared air route segment “JiNan → P197” may be congested.
Therefore, it is necessary to select the optimization routing path for each city-pair airline, in the strategy stage, from the alternative pre-planned routing paths, such that the traffic flow distribution of the air route network can be optimized, and the work load and congestion issue of the air route network can be minimized.
To simplify the discussion, the candidate routing paths in the air route network for each city-pair airline l i , j can be labelled as S c r p i , j . Therefore, the routing-path optimization problem can be defined as follows.
Consider the following inputs:
-
the air route network, G A R N , which is the basis of national airspace and will affect the flight distance and operational capacity of the air transportation system;
-
the city-pair airline network, G A N , which represents the existence of flights between a pair of airports or not;
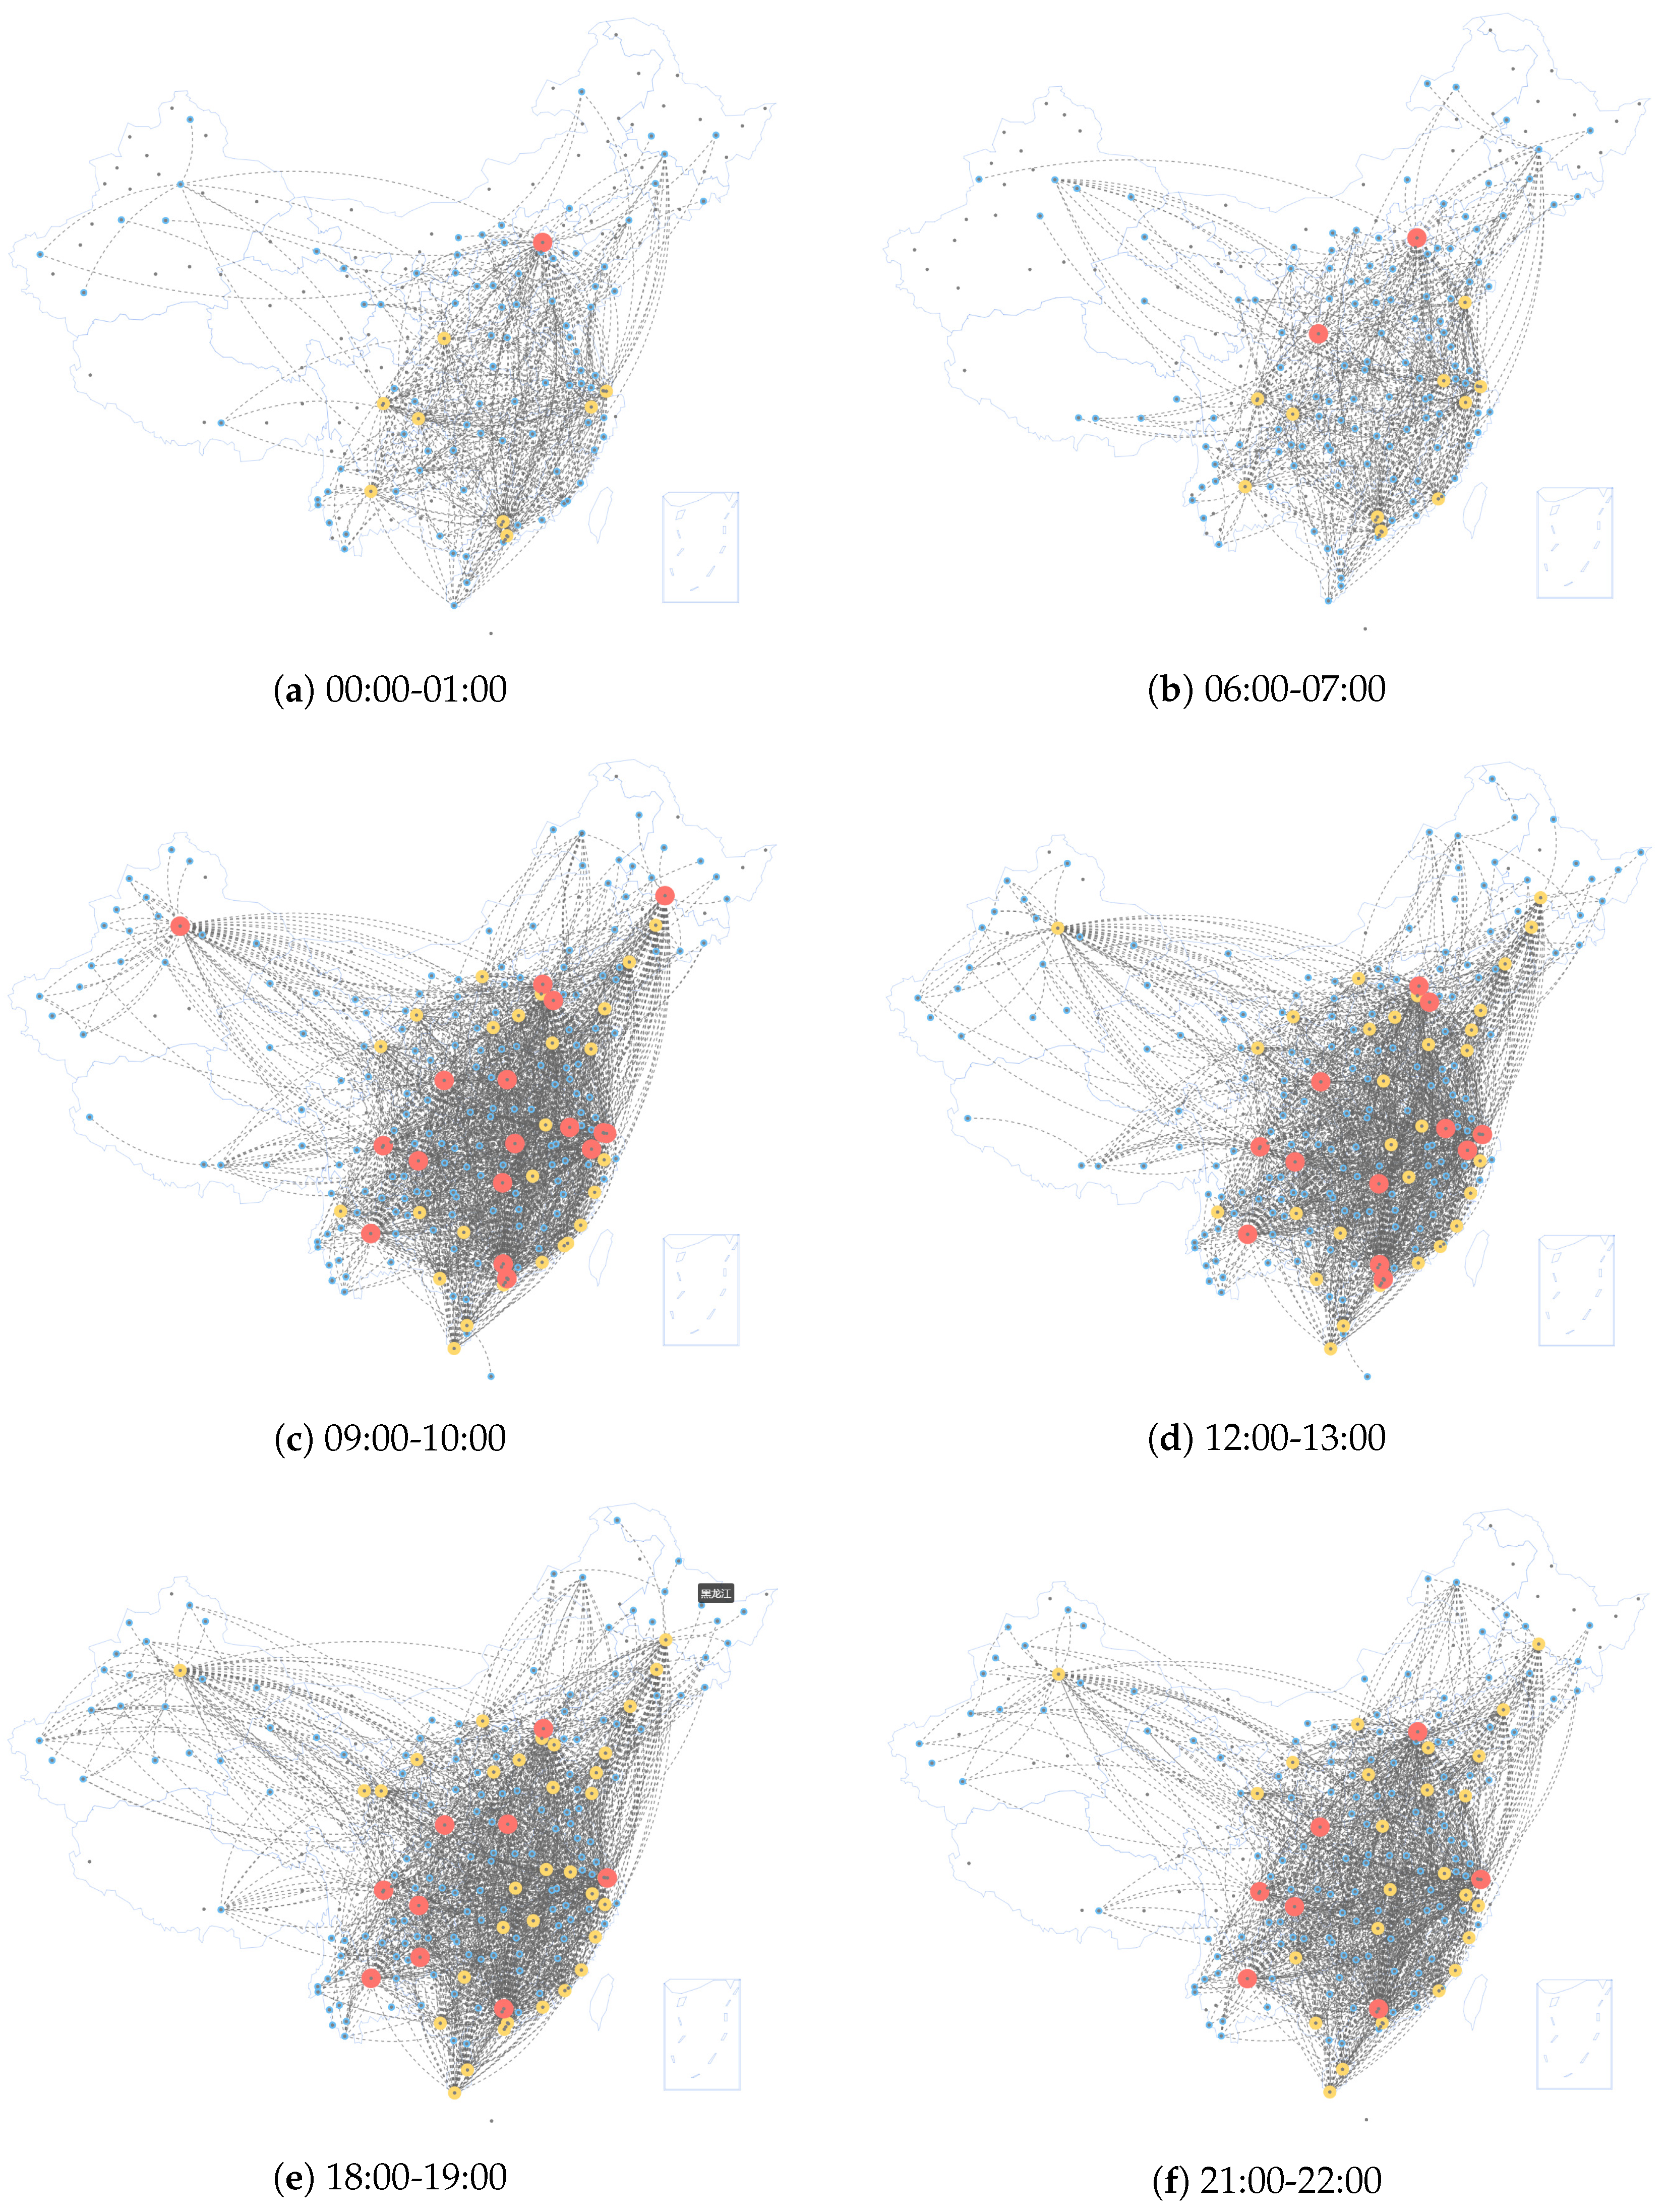
-
the flight operation network, G F N t , at different time intervals [ t , t + 1 ) , 1 t 24 , which represents the air traffic flows based on the timetable of flights;
-
the coupling relationship between the three-layer air transport networks, as discussed in Section 2.2.
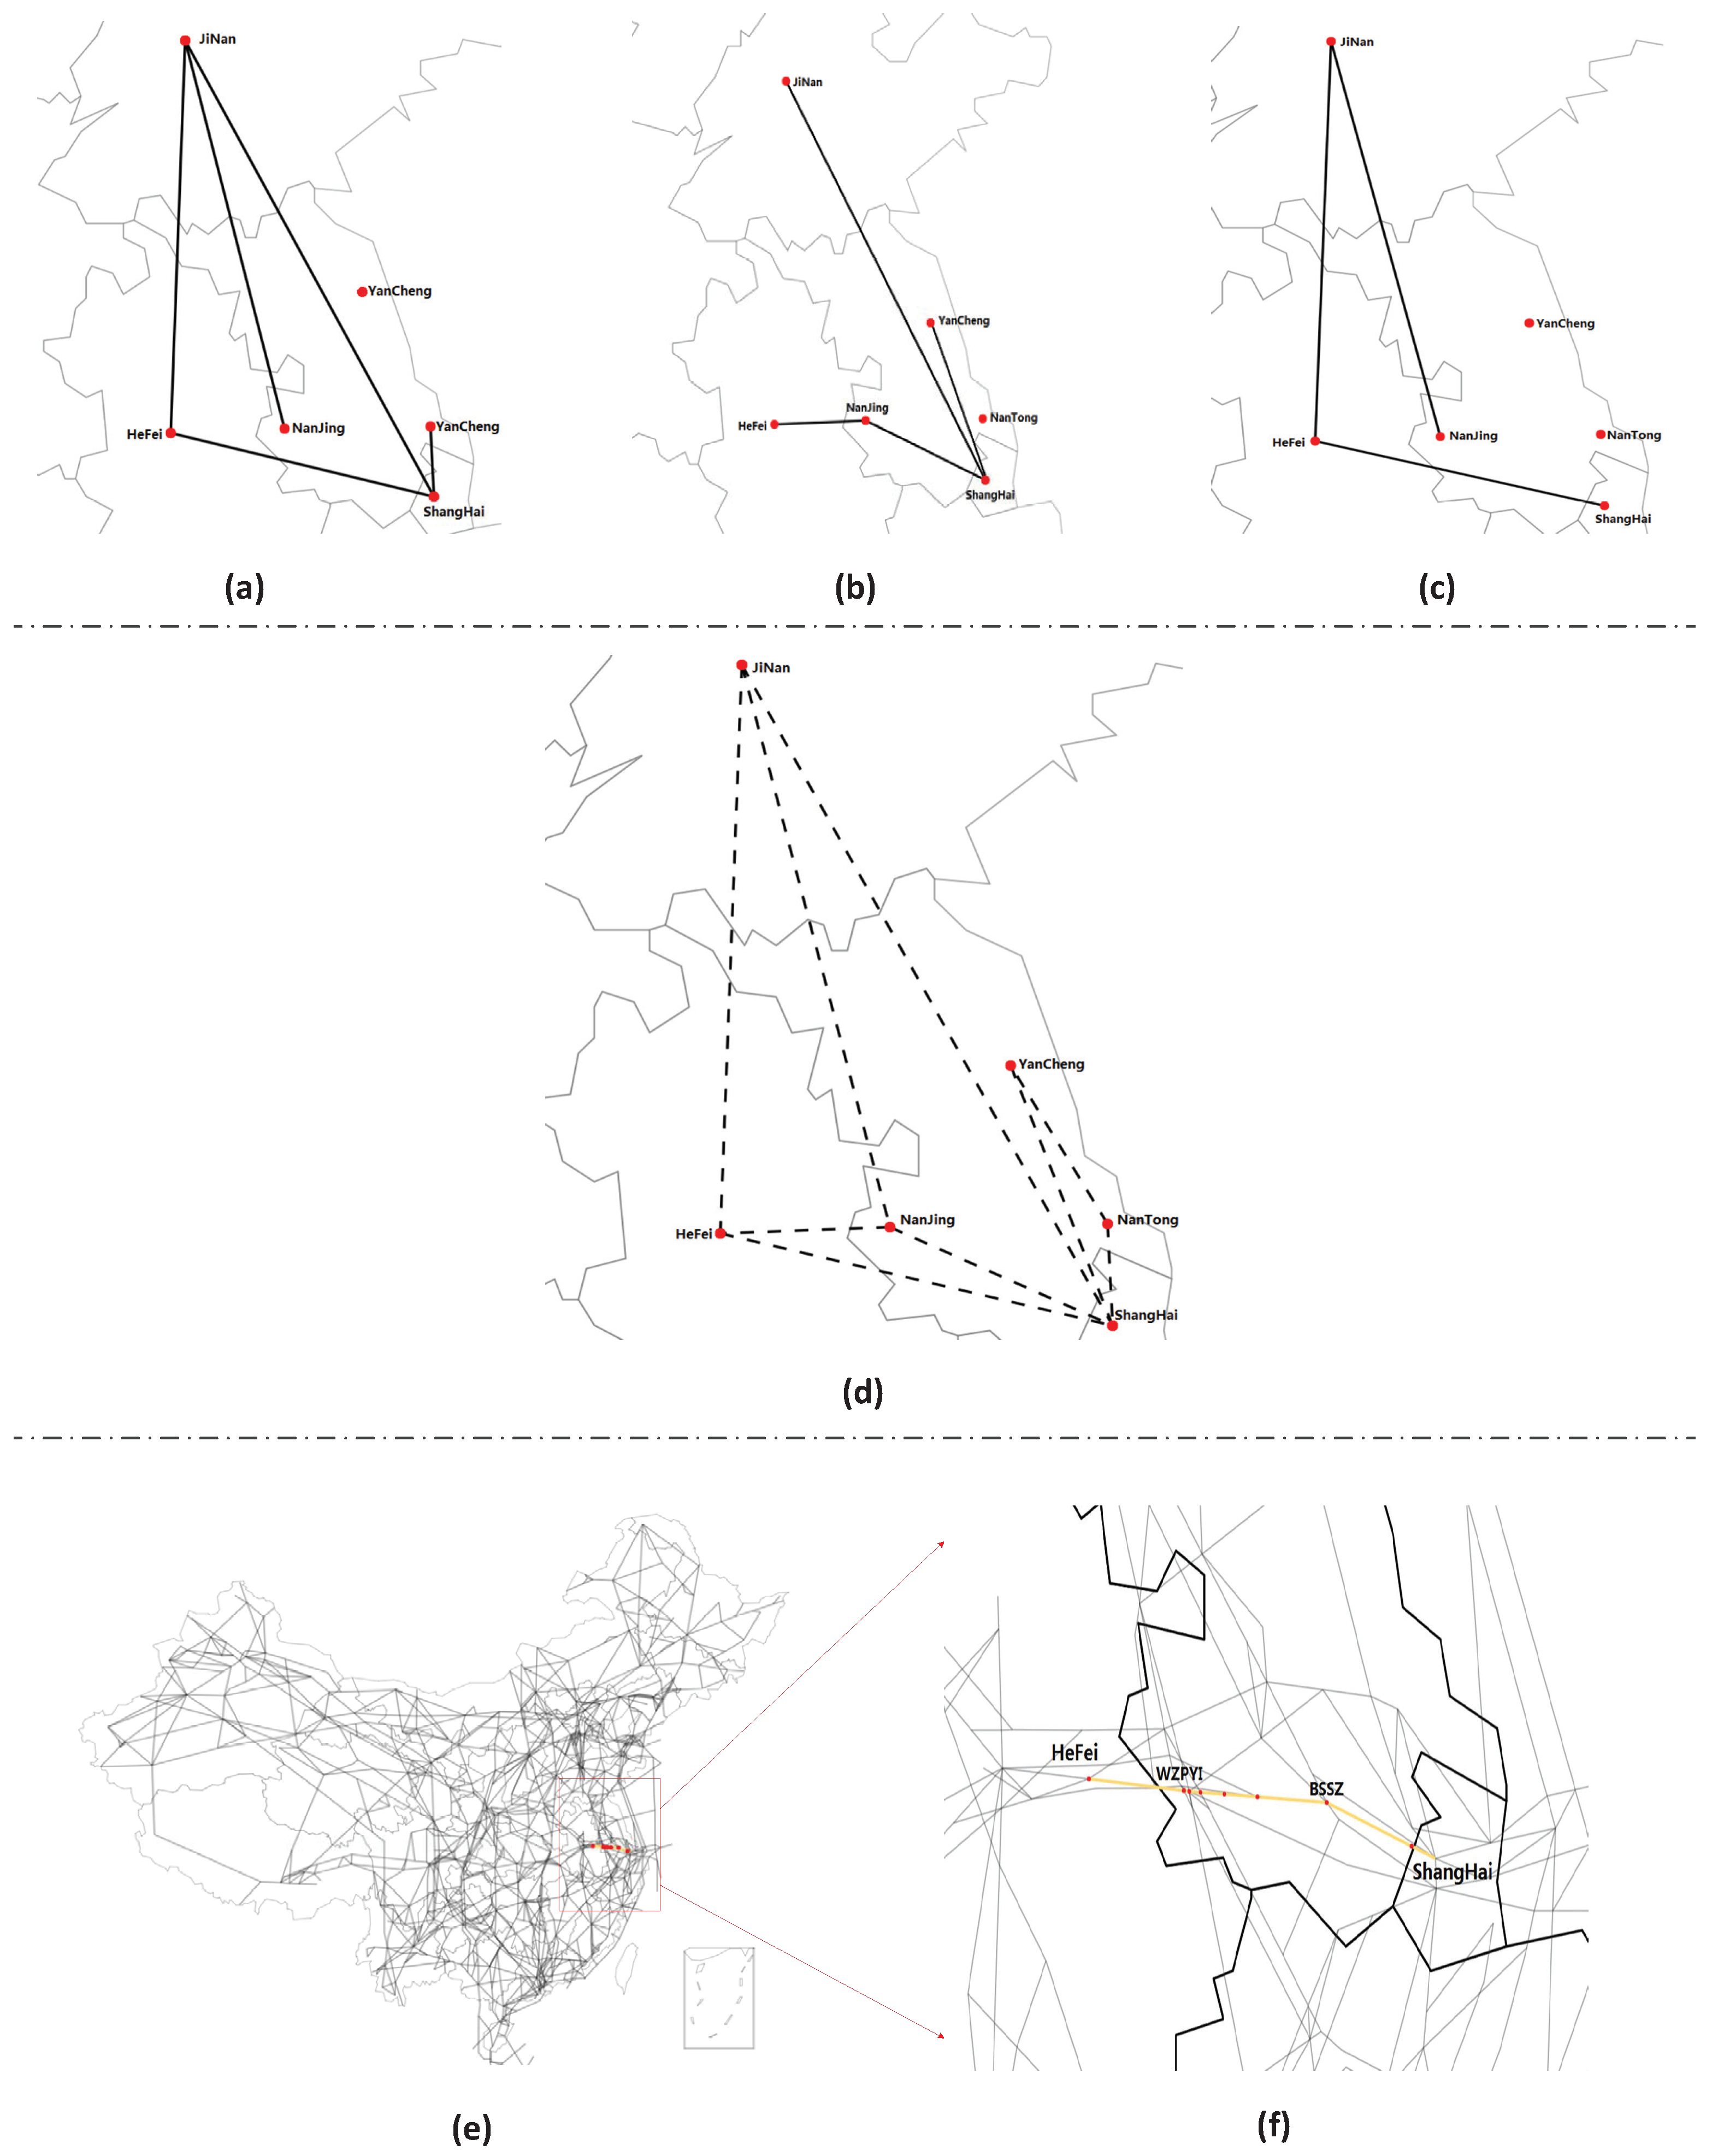
-
the candidate routing paths S c r p i , j for the each city-pair airline l i , j in G A N .
Our goal is to select the optimization routing path from the candidate set S c r p i , j for each city-pair airline l i , j in G A N such that the flights from airport a i to a j of the flight operation network G F N t ( 1 t 24 ) can fly along the optimization routing paths (a sequence of waypoints) on the air route network G A R N , with minimal congestion of the air route network.

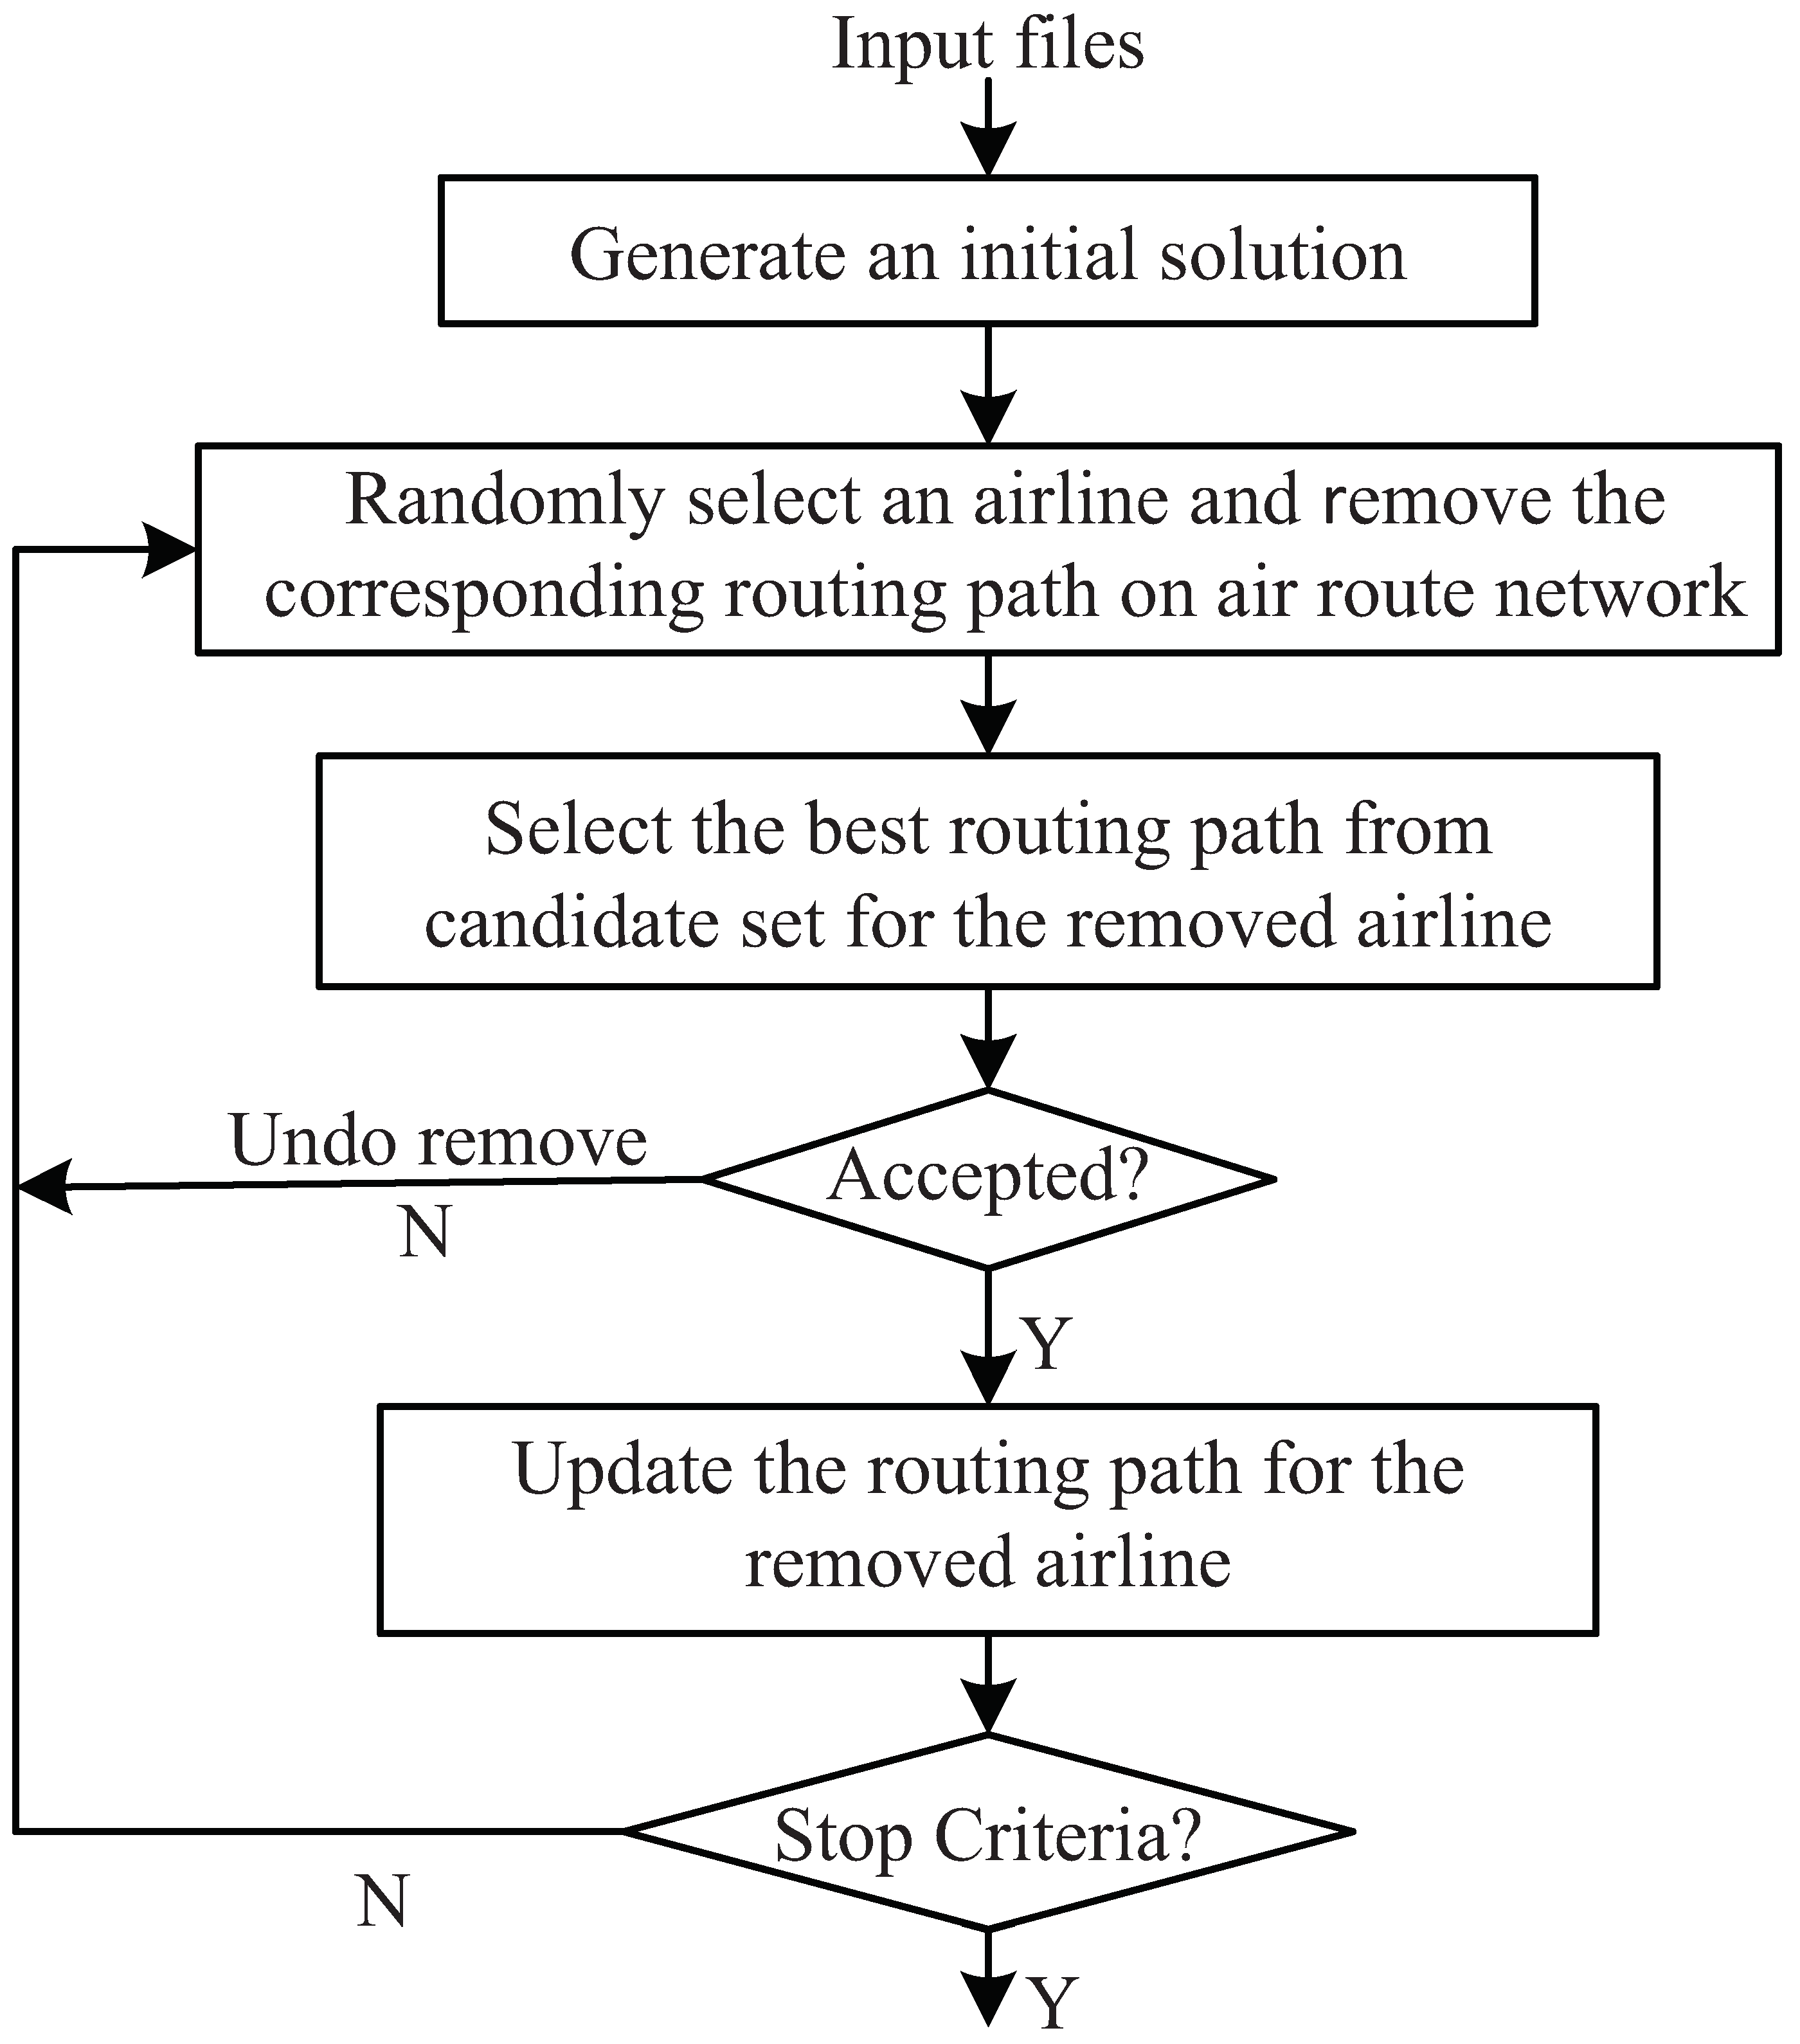
3. Routing Paths Optimization of City-Pair Airlines

To consider the path diversity of city-pair airlines, intrinsically, in this paper, a simulated annealing-based method is proposed to select the optimization routing path from the candidate routing paths set S c r p i , j for each city-pair airline l i , j , such that the congestion of air route segments in air route network can be minimized.
Figure 5 shows the overall flow of the proposed routing paths optimization method for all city-pair airlines between cities/airports. The initial solution is generated randomly, and then, the simulated annealing method is invoked. In this study, we elaborate a perturbation method, “SAR“, which follows the strategy of Selection after Remove.
The key steps of the proposed simulated annealing-based method are listed as follows:
(a)
A city-pair airline l r e v of G A N is selected, randomly. Furthermore, the traffic flows in the corresponding routing path (air route segments) on air route network G A R N should be updated.
(b)
Each candidate routing path in the set S c r p i , j is evaluated for the removed airline l r e v , and the best one is selected.
(c)
According to the selected best routing path, the traffic flows on the corresponding air route segments are updated actually.
In step (a), we can randomly choose one city-pair airline l r e v = ( a i r e v , a j r e v ) from G A N , and remove the corresponding routing path. Based on the coupling relationship of the three-layer air networks as discussed in Section 2.2, we can obtain the traffic flows between airport a i r e v and a j r e v from flight operation network G F N , and the corresponding routing path on air route network G A R N can also be obtained. Thus, once the corresponding routing path of city-pair airline l r e v = ( a i r e v , a j r e v ) is removed, the traffic flows of each air route segment of the corresponding routing path are updated based on the timetables of flights for airline l r e v in flight operation network G F N .
In step (b), every candidate routing path from S c r p i , j is evaluated for the removed city-pair airline l r e v . Firstly, we can calculate its costs (Formula (2)) by a linear combination of distance costs and air traffic load, accurately. Secondly, if the best one of them shows an improvement, the corresponding candidate routing path should be better routing path for the removed city-pair airline l r e v , and the traffic flows on the air route segments of the optimized routing path should be updated accordingly in step (c). Otherwise, an acceptable probability will be calculated following the simulated annealing rule.

Objective Function

In this subsection, we will introduce the objective function of routing path optimization, which is defined as follows:
O b j = α · D i s + β · T L + γ · S L
where α , β , γ are balance factors and α + β + γ = 1 . Because of the difference between the orders of magnitude of the three objectives, it is difficult to choose the balance factors, so the three objectives are normalized in our work.
D i s is the total distance of the optimized routing paths for all airlines.
T L is the total traffic load of N L time intervals, which is calculated as follows:
T L = t = 0 N L t l t
where t l t is the traffic load of a time interval [ t , t + T ] , which represents the maximum traffic flows across all air route segments in a time interval [ t , t + T ] based on the flight operation network G F N , that is, t l t = max e R ( G A R N ) e t .
S L is the total segment load of all air route segments, which is calculated as follows:
S L = e R ( G A R N ) s l e
where s l e is defined as the segment load, which represents the maximum traffic flows on air route segment e R ( G A R N ) of N L time intervals based on the flight operation network G F N ; that is, s l e = max 0 t N L e t .
In the definitions of T L and S L , a variable e t is introduced. The e t is defined as the air traffic flows on the air route segment e in time interval [ t , t + T ] . Because of the departure airport and departure time for each flight in G F N are given, we can calculate the arrival time of each air route segment across the optimized routing path by using historical flight times based on machine learning.

4. Experiments

The proposed construction methods of air transport networks and routing paths optimization method were implemented in Python-3.6 on a 64-bit workstation (Intel 2.4 GHz, 256 GB RAM).

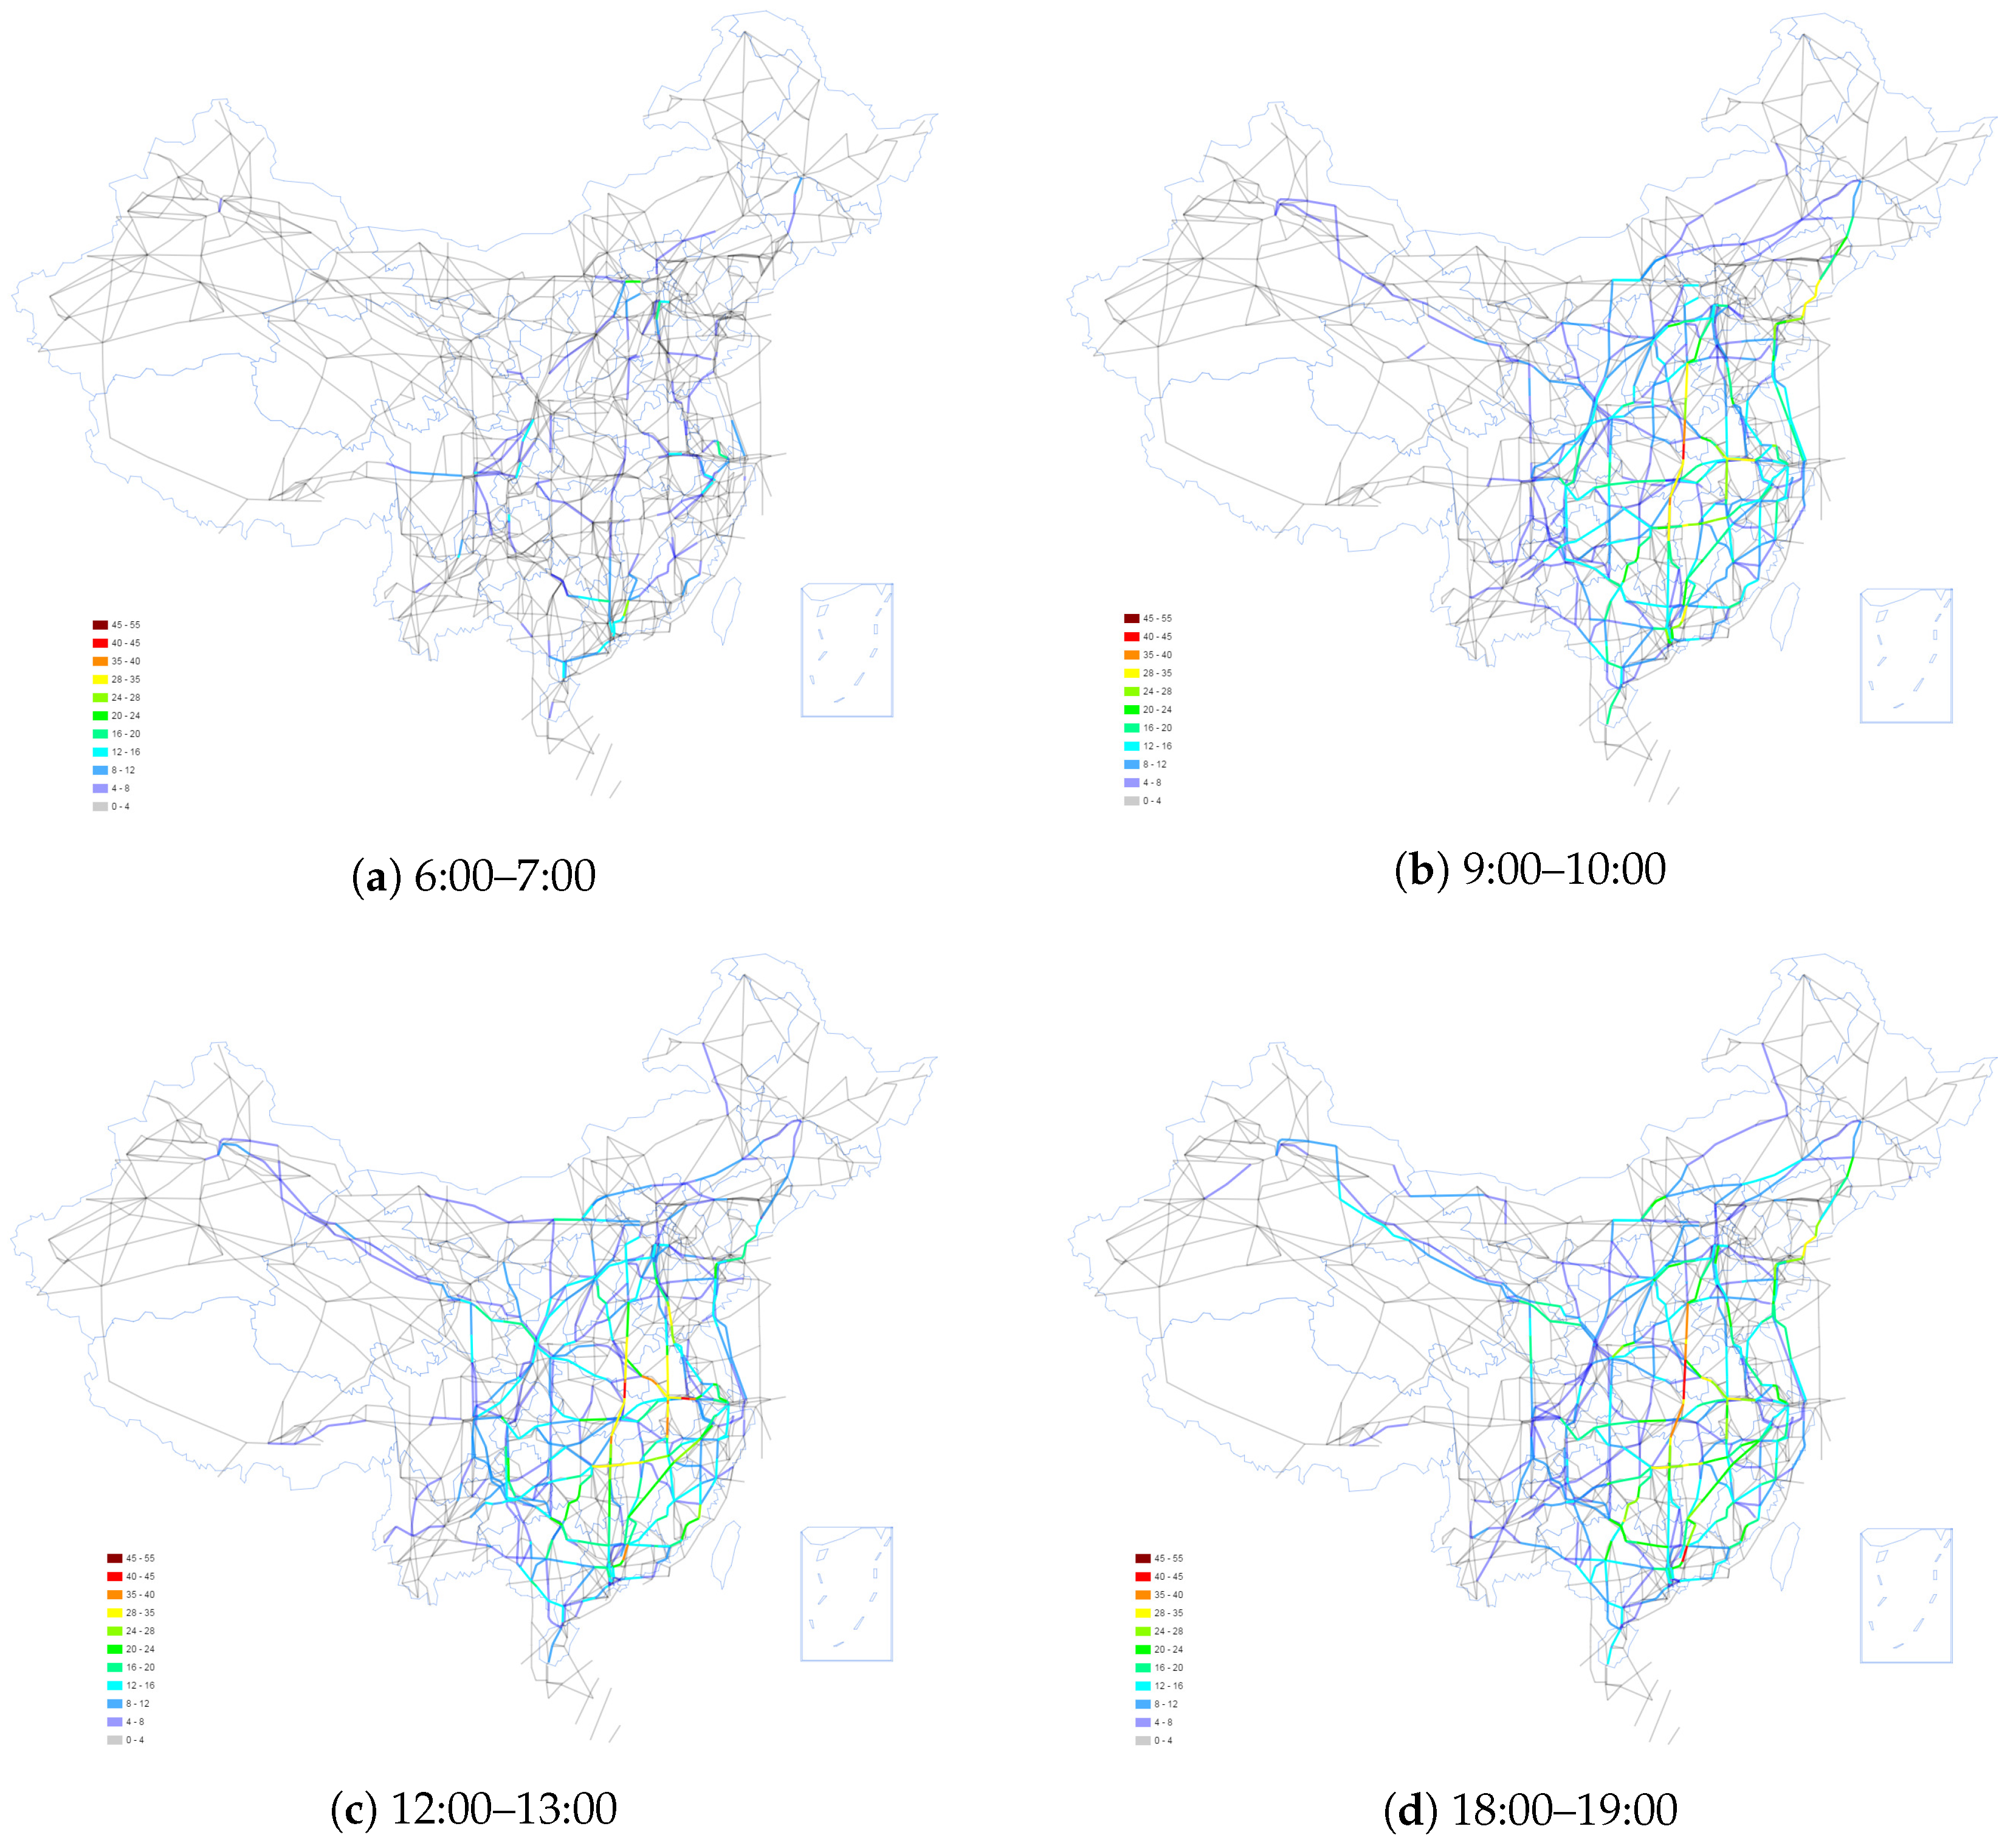
4.1. Analysis of Aviation Networks

Complex network theory is a powerful tool to analyse the structure and dynamics of air transportation systems. In what follows, we will analyse the three-layer network from the perspective of complex networks, such as the degree distribution, the degree–degree correlation, and the clustering coefficient, which are defined as follows.

4.1.1. Air Route Network

In this paper, we focus on the Chinese air route network G A R N , where there are W = 1547 waypoints and R = 2632 air route segments. In G A R N , the average degree is merely 3.38, and the largest degree is only 13.

4.1.2. City-Pair Airline Network

Following the construction procedure of the airline network introduced in Section 2.1, we can build the city-pair airline networks G A N based on the flight schedules from different years. Table 2 shows the fundamental part of the basic network parameters in airline networks in different years.
From Table 2, we can see that the scale of the Chinese airline network becomes larger and larger as the number of airports and airlines as well as the average degree increase year by year. The average shortest path length and network diameter make a small change, which shows the airline network is a typical small-world network. Furthermore, the mixing coefficients (the degree–degree correlation) of airline networks in different years are negative. In addition, the topological structure of all the airline networks share a characteristic of a high degree-of-clustering coefficient.

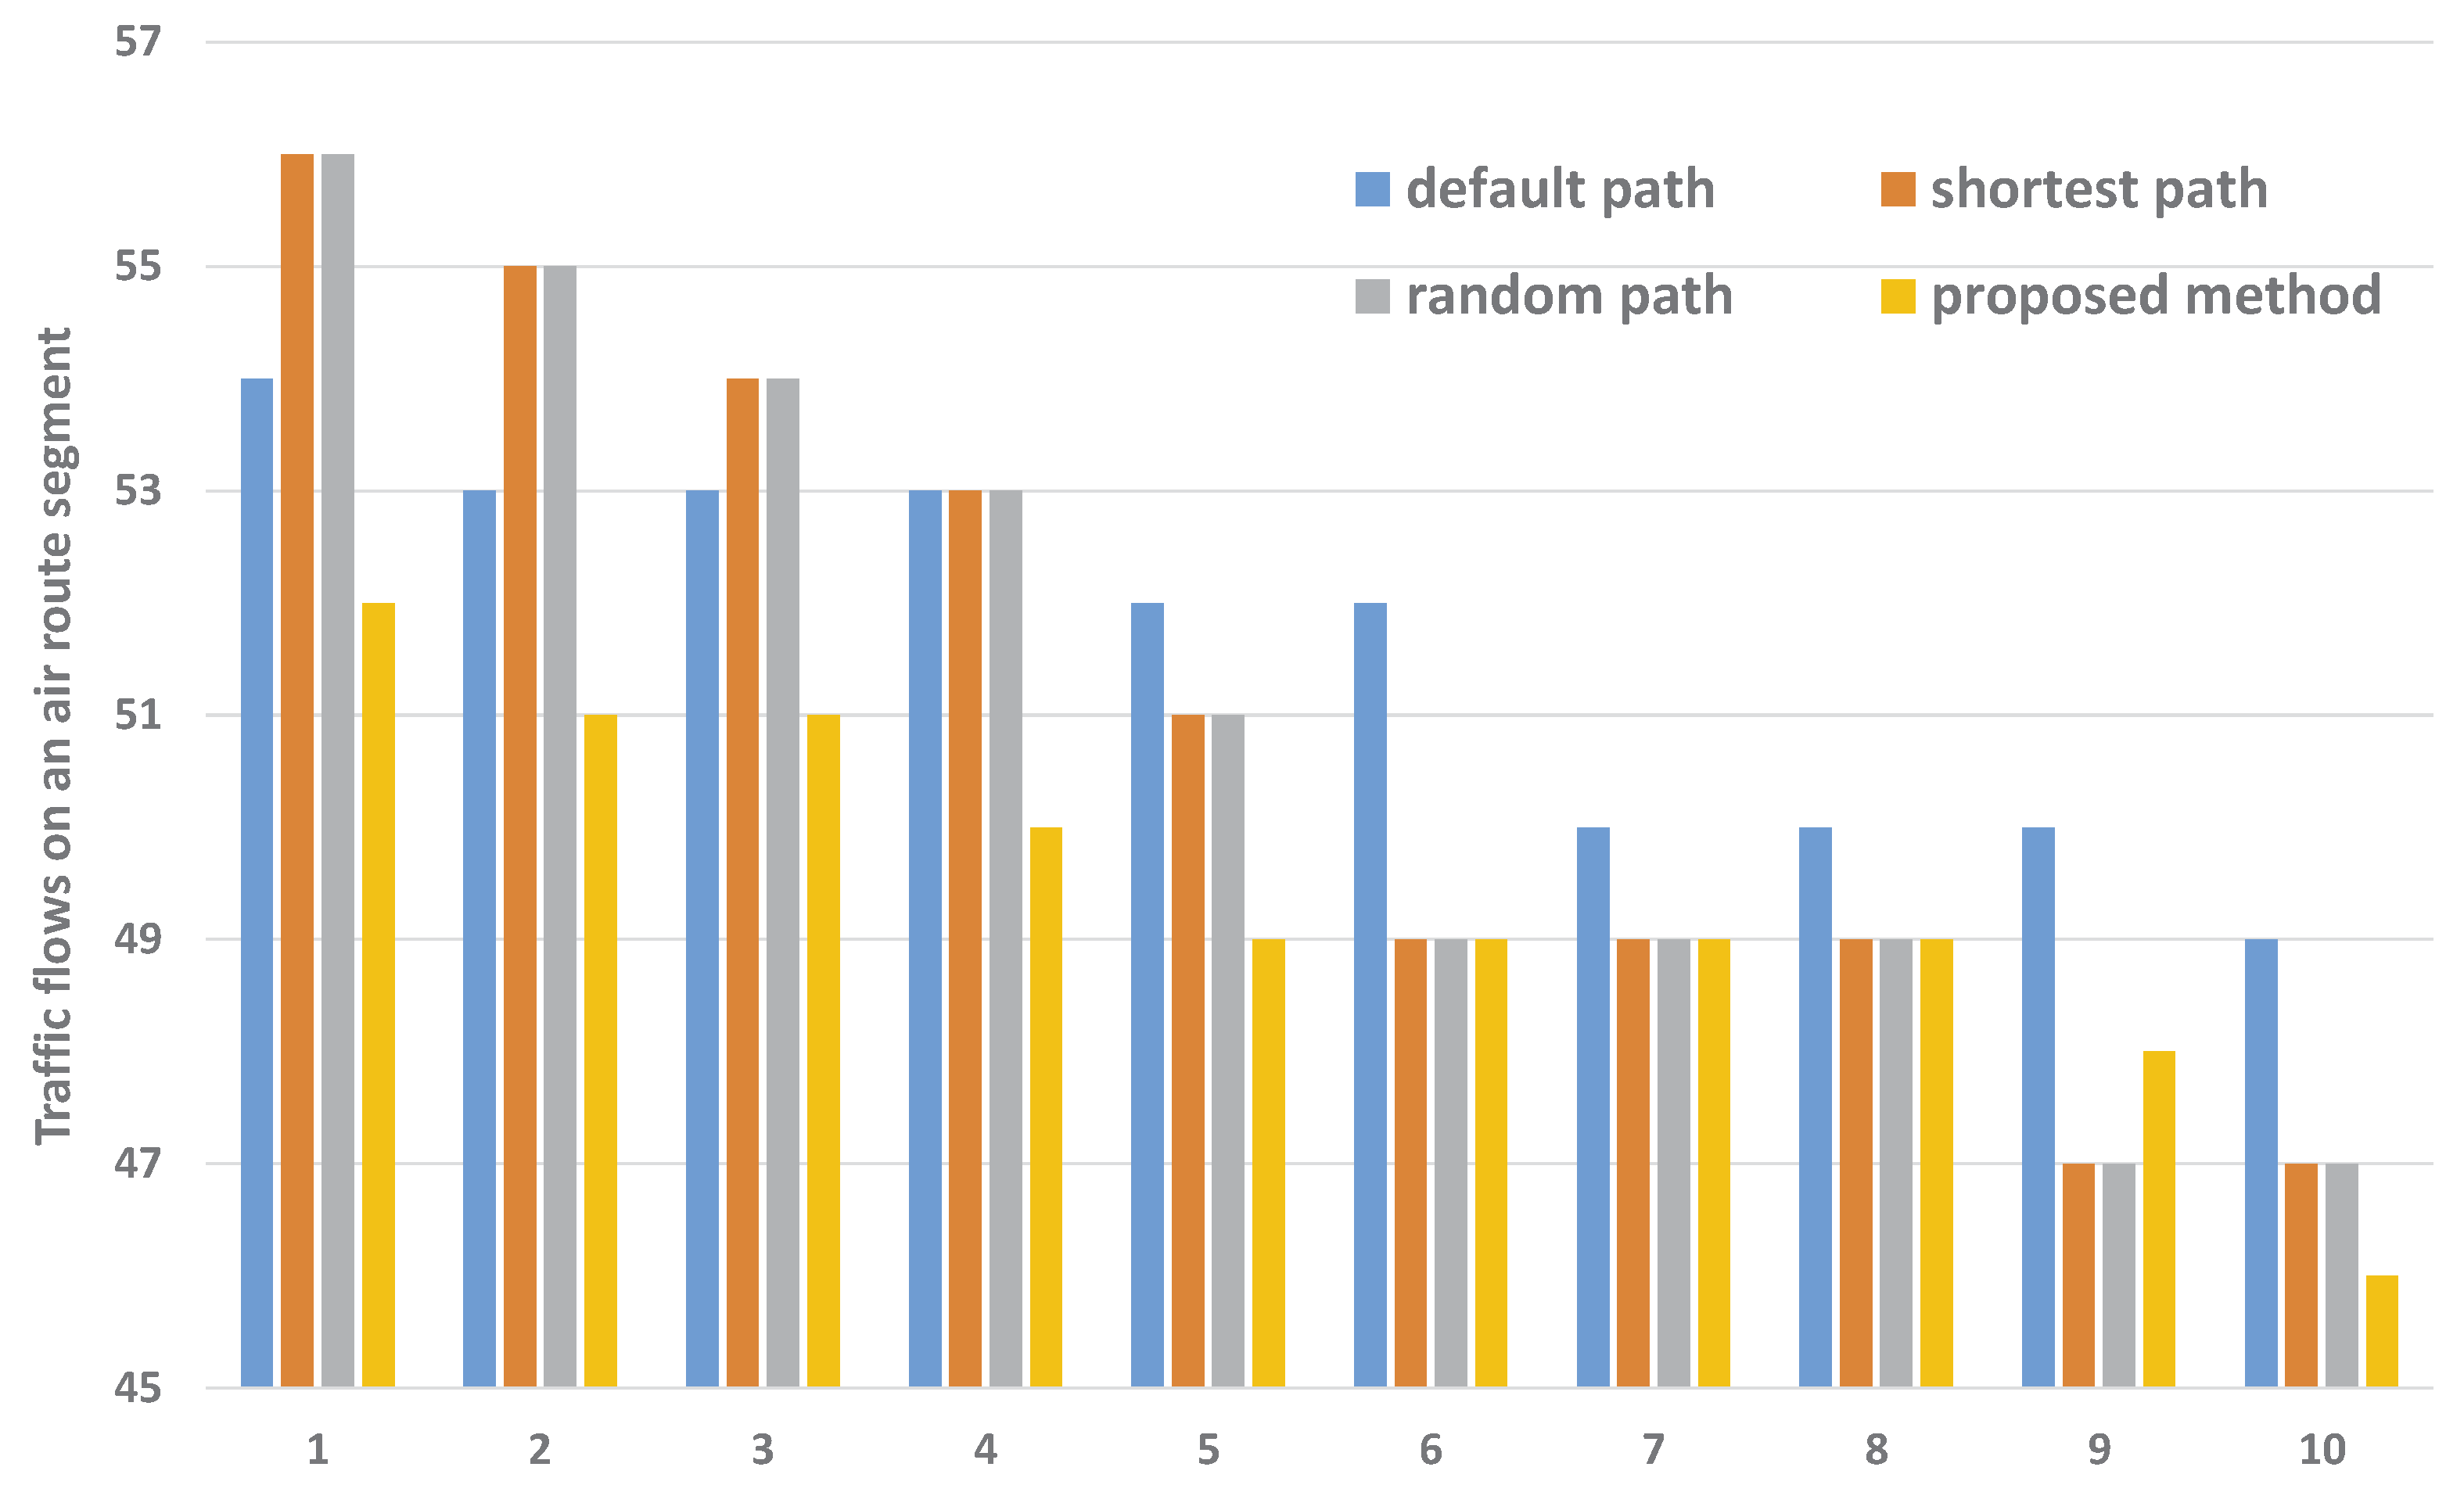
4.2. Optimization Results

In order to demonstrate the effectiveness of the proposed routing path allocation method, we compare it with three other strategies: the “ D e f a u l t ” routing path, the “ S h o r t e s t ” routing path, and the “ R a n d o m ” routing path.
(1)
D e f a u l t ”, which takes the routing path used by air traffic managers in practice;
(2)
S h o r t e s t ”, which takes the shortest length routing path from the candidate set S c r p i , j for airline l i , j ;
(3)
R a n d o m ”, which takes a routing path for airline l i , j from its candidate set S c r p i , j ;
(4)
P r o p o s e d ”, which is the proposed simulated annealing-based method to select the optimal routing paths.
Table 3 shows the traffic flows (the number of airlines) at the most heavily crowded air route segments in different time intervals using the method of different routing paths. Compared with the default routing paths, the shortest routing paths, and the random routing paths, the proposed routing-paths-optimization strategy can reduce the maximum traffic flows of the air route network by 2.4%, 4.6%, and 4.8%, respectively, which shows that the proposed optimization method has a particularly positive effect in alleviating the traffic congestion of air route network. This improvement is mainly due to the cost function 2, which takes both elements (traffic flow and flight distance) into consideration in a well-balanced way. However, other solutions (“ D e f a u l t ”, “ S h o r t e s t ” and “ R a n d o m ”) only cover some of these elements. “ D e f a u l t ” is derived from the flight schedule, which is the baseline. “ S h o r t e s t ” only considers the flight distance of one aircraft, while “ R a n d o m ” selects randomly from potential routes.
To further demonstrate the effectiveness of the proposed optimization method, we also provide the first ten air route segment traffic flows in time interval 9:00–10:00 under different routing paths strategies, as shown in Figure 6. As shown in Figure 6, the proposed method could reduce the first ten traffic flows of air route segments on the whole, such that the congestion of some air route segments could be alleviated. In time interval 9:00–10:00, the maximum traffic flows of air route segment in the proposed method could be reduce the number of flights by two, four, and four, respectively, when compared with “ D e f a u l t ”, “ S h o r t e s t ” and “ R a n d o m ”.
In addition, Figure 7 shows the distributions of traffic flow on air route network for different time intervals, where the routing paths for airlines were selected based on the proposed simulated-annealing method.

5. Conclusions

In this study, to model the air transportation system more accurately from physical facilities to traffic applications, three-layer networks, including air route networks, airline networks, and flight operation networks, were built, where the air route networks were regarded as the physical layer, and the airline networks and flight operation networks were the application layers. Moreover, a powerful tool, complex network theory, was used to analyse the topology characteristics of the three-layer networks. In addition, to reduce the congestion of the air route network induced by the air traffic flows of application layers, a simulated annealing-based method was proposed to optimize the routing paths for the airlines based on the mapping relations between three-layer networks, where an elaborate method for perturbing solutions, named Selection after Remove (SAR), is adopted. Experimental results show that, compared with the default routing paths, the shortest routing paths, and random routing paths, the proposed routing paths’ optimization strategy can reduce the maximum traffic flows of the air route network by 2.4%, 4.6%, and 4.8%, respectively, making air traffic distribution well-balanced, which shows that the proposed optimization method is an effective way of alleviating the traffic congestion of the air route network. In other words, there is an opportunity for advancements in air transportation system, especially in air-routing-allocation programs for flight plans. For future work, we plan to investigate the improvement of the proposed methods under more datasets from other countries besides China.

Author Contributions

Conceptualization, H.D., M.H., Q.X., Y.T. and J.Y.; methodology, H.D. and M.H.; software, H.D., Q.X. and Y.T.; validation, H.D., M.H. and J.Y.; formal analysis, H.D.; investigation, H.D.; resources, M.H.; data curation, J.Y.; writing—original draft preparation, H.D. and J.Y.; writing—review and editing, H.D. and M.H.; visualization, H.D. and Q.X.; supervision, M.H.; project administration, M.H.; funding acquisition, H.D., M.H., Y.T. and J.Y. All authors have read and agreed to the published version of the manuscript.

Funding

This research was funded by the National Key Research and Development Program of China (2018YFE0208700) and the Science and Technology Project of Jiangsu Province (No.BZ2020001).

Institutional Review Board Statement

Not applicable.

Informed Consent Statement

Not applicable.

Data Availability Statement

Not applicable.

Conflicts of Interest

The authors declare no conflict of interest.

Nomenclature

The following variables are used in this manuscript:
G A R N    Graph of the air route network
G F N t Graph of the flight operation network at time t
G A N Graph of the city-pair airline network
r i , j air route segment connecting city i and city j
l i , j city-pair airline connecting city i and city j

References

  1. Newman, M.E. The structure and function of complex networks. Siam Rev. 2003, 45, 167–256. [Google Scholar] [CrossRef] [Green Version]
  2. Mou, J.; Liu, C.; Chen, S.; Huang, G.; Lu, X. Temporal characteristics of the chinese aviation network and their effects on the spread of infectious diseases. Sci. Rep. 2017, 7, 1275. [Google Scholar] [CrossRef] [PubMed] [Green Version]
  3. Yan, Y.; Cao, G. Operational concepts and key technologies of next generation air traffic mangement system. Command. Inf. Syst. Technol. 2018, 9, 8–17. [Google Scholar]
  4. Bertsimas, D.; Odoni, A. A Critical Survey of Optimization Models for Tactical and Strategic Aspects of Air Traffic Flow Management; NASA: Washington, DC, USA, 1997. [Google Scholar]
  5. Huang, J.; Xu, Q.; Yan, Y.; Ding, H.; Tian, J. Generalized method of modeling minute-in-trail strategy for air traffic flow management. Math. Probl. Eng. 2019, 2019, 6059608. [Google Scholar] [CrossRef]
  6. FAA. Traffic Flow Management in the National Airspace System; FAA National Headquarters: Washington, DC, USA, 2009. [Google Scholar]
  7. Rocha, L.E. Dynamics of air transport networks: A review from a complex systems perspective. Chin. J. Aeronaut. 2017, 30, 469–478. [Google Scholar] [CrossRef]
  8. Li, W.; Cai, X. Statistical analysis of airport network of china. Phys. Rev. 2004, 69, 046106. [Google Scholar] [CrossRef] [Green Version]
  9. Kurant, M.; Thiran, P. Extraction and analysis of traffic and topologies of transportation networks. Phys. Rev. 2006, 74, 036114. [Google Scholar] [CrossRef] [Green Version]
  10. Barrat, A.; Barthelemy, M.; Pastor-Satorras, R.; Vespignani, A. The architecture of complex weighted networks. Proc. Natl. Acad. Sci. USA 2004, 101, 3747–3752. [Google Scholar] [CrossRef] [Green Version]
  11. Newman, M.E. Analysis of weighted networks. Phys. Rev. 2004, 70, 056131. [Google Scholar] [CrossRef] [Green Version]
  12. Zanin, M.; Lillo, F. Modelling the air transport with complex networks: A short review. Eur. Phys. J. Spec. Top. 2013, 215, 5–21. [Google Scholar] [CrossRef] [Green Version]
  13. Guimera, R.; Amaral, L.A.N. Modeling the world-wide airport network. Eur. Phys. J. 2004, 38, 381–385. [Google Scholar] [CrossRef]
  14. Watts, D.J.; Strogatz, S.H. Collective dynamics of small world networks. Nature 1998, 393, 440. [Google Scholar] [CrossRef] [PubMed]
  15. Verma, T.; Araújo, N.A.; Herrmann, H.J. Revealing the structure of the world airline network. Sci. Rep. 2014, 4, 5638. [Google Scholar] [CrossRef] [PubMed] [Green Version]
  16. Bagler, G. Analysis of the airport network of india as a complex weighted network. Phys. Stat. Mech. Its Appl. 2008, 387, 2972–2980. [Google Scholar] [CrossRef] [Green Version]
  17. Da Rocha, L.E. Structural evolution of the brazilian airport network. J. Stat. Mech. Theory Exp. 2009, 2009, P04020. [Google Scholar] [CrossRef]
  18. Jia, T.; Qin, K.; Shan, J. An exploratory analysis on the evolution of the us airport network. Phys. Stat. Mech. Its Appl. 2014, 413, 266–279. [Google Scholar] [CrossRef]
  19. Lordan, O.; Sallan, J.M. Analyzing the multilevel structure of the european airport network. Chin. J. Aeronaut. 2017, 30, 554–560. [Google Scholar] [CrossRef] [Green Version]
  20. Zhang, J.; Cao, X.-B.; Du, W.-B.; Cai, K.-Q. Evolution of chinese airport network. Phys. Stat. Mech. Its Appl. 2010, 389, 3922–3931. [Google Scholar] [CrossRef]
  21. Du, W.-B.; Zhou, X.-L.; Lordan, O.; Wang, Z.; Zhao, C.; Zhu, Y.-B. Analysis of the chinese airline network as multi-layer networks. Transp. Part Logist. Transp. Rev. 2016, 89, 108–116. [Google Scholar] [CrossRef] [Green Version]
  22. Yang, Y.; Xu, K.; Wu, J. Empirical structural analysis on chinese airline network. In Asia-Pacific International Symposium on Aerospace Technology; Springer: Berlin/Heidelberg, Germany, 2018; pp. 2757–2764. [Google Scholar]
  23. Wandelt, S.; Sun, X.; Zhang, J. Evolution of domestic airport networks: A review and comparative analysis. Transp. Transp. 2019, 7, 1–17. [Google Scholar] [CrossRef]
  24. Kai-Quan, C.; Jun, Z.; Wen-Bo, D.; Xian-Bin, C. Analysis of the chinese air route network as a complex network. Chin. Phys. 2012, 21, 028903. [Google Scholar]
  25. Cai, K.; Zhang, J.; Zhou, C.; Cao, X.; Tang, K. Using computational intelligence for large scale air route networks design. Appl. Soft Comput. 2012, 12, 2790–2800. [Google Scholar] [CrossRef]
  26. Du, W.; Liang, B.; Yan, G.; Lordan, O.; Cao, X. Identifying vital edges in chinese air route network via memetic algorithm. Chin. J. Aeronaut. 2017, 30, 330–336. [Google Scholar] [CrossRef] [Green Version]
  27. Sun, X.; Wandelt, S.; Linke, F. On the topology of air navigation route systems. In Proceedings of the Institution of Civil Engineers-Transport; Thomas Telford Ltd.: Telford, UK, 2016; Volume 170, pp. 46–59. [Google Scholar]
  28. Sun, X.; Wandelt, S.; Linke, F. Temporal evolution analysis of the european air transportation system: Air navigation route network and airport network. Transp. Transp. Dyn. 2015, 3, 153–168. [Google Scholar] [CrossRef]
  29. Shiyan, L.I.U.; Zhenfu, L.I.; Zhong, J.; Daqing, L.I. Percolation transition in temporal airport network. Chin. J. Aeronaut. 2019, 33, 219–226. [Google Scholar]
Figure 1. An example of air route and city-pair airline from Beijing to Nanjing.
Applsci 13 00866 g001
Figure 2. The flight operation network G F N t in different time intervals based on the flight schedule of one day in 2019.
Applsci 13 00866 g002
Figure 3. An example of the mapping relations of a three-layer air transport network with six cities, JiNan, HeFei, YanCheng, NanTong, NanJing, and ShangHai. (ac) show the flight operation networks in the time intervals of 9:00–10:00, 18:00–19:00, and 21:00–22:00, respectively. (d) shows the city-pair airline network among these six cities. (e) shows the air route network of China, and (f) shows the routing path on the air route network for the city-pair airline “Hefei → Shanghai ”.
Applsci 13 00866 g003
Figure 4. An example of multi-routing paths on air route network for city-pair airlines.
Applsci 13 00866 g004
Figure 5. Optimization flow of routing paths for airlines.
Applsci 13 00866 g005
Figure 6. The first ten traffic flows of an air route network in the time interval 9:00–10:00 under different routing-path strategies.
Applsci 13 00866 g006
Figure 7. The traffic flows distributed on air route network at different time intervals.
Applsci 13 00866 g007
Table 1. Three different factors of air transportation network and most researches hardly cover flight operation network.
Factors Discussed in ResearchAir RouteCity-Pair AirlineFlight Operation
[8,10,12,13,15,16,17,18,19,20,21,22,23]--
[9,25,27]--
[2,24,26,28,29]-
This paper
Table 2. A comparison between network parameters in airline networks in different years.
Parameters2012 [24]201520182019
Nodes147198227233
Edges1055265739194498
Average degree14.3516.8322.5224.98
Average shortest path length2.202.292.292.25
Diameter4333
Mixing coefficient−0.15−0.45−0.38−0.36
Clustering coefficient0.790.620.550.58
Table 3. The maximum traffic flows of air route segments in different time intervals using different routing path methods.
Time IntervalMaximum Traffic Flows
Default Shortest Random Proposed
0:00–1:005554
1:00–2:009998
2:00–3:008889
3:00–4:008988
4:00–5:005556
5:00–6:005554
6:00–7:0024222423
7:00–8:0043414342
8:00–9:0052565651
9:00–10:0054565652
10:00–11:0045494941
11:00–12:0038383637
12:00–13:0040404039
13:00–14:0044474743
14:00–15:0041454540
15:00–16:0045424242
16:00–17:0045454548
17:00–18:0046484847
18:00–19:0043444443
19:00–20:0043454542
20:00–21:0040414139
21:00–22:0038404037
22:00–23:0042414241
23:00–00:0031323230
A v e r a g e 33.0833.8833.9632.33
1.0--−2.4%
-1.0-−4.6%
--1.0−4.8%
Disclaimer/Publisher’s Note: The statements, opinions and data contained in all publications are solely those of the individual author(s) and contributor(s) and not of MDPI and/or the editor(s). MDPI and/or the editor(s) disclaim responsibility for any injury to people or property resulting from any ideas, methods, instructions or products referred to in the content.

