Article

Using Mental Shadowing Tasks to Improve the Sound-Evoked Potential of EEG in the Design of an Auditory Brain–Computer Interface

Department of Information and Learning Technology, National University of Tainan, 33, Sec. 2, Shu-Lin St., Tainan 70005, Taiwan
*
Author to whom correspondence should be addressed.
Appl. Sci. 2023, 13(2), 856; https://doi.org/10.3390/app13020856
Submission received: 6 December 2022 / Revised: 2 January 2023 / Accepted: 5 January 2023 / Published: 8 January 2023

Abstract

:
This study proposed an auditory stimulation protocol based on Shadowing Tasks to improve the sound-evoked potential in an EEG and the efficiency of an auditory brain–computer interface system. We use stories as auditory stimulation to enhance users’ motivation and presented the sound stimuli via headphones to enable the user to concentrate better on the keywords in the stories. The protocol presents target stimuli with an oddball P300 paradigm. To decline mental workload, we shift the usual Shadowing Tasks paradigm: Instead of loudly repeating the auditory target stimuli, we ask subjects to echo the target stimuli mentally as it occurs. Twenty-four healthy participants, not one of whom underwent a BCI use or training phase before the experimental procedure, ran twenty trials each. We analyzed the effect of the auditory stimulation based on the Shadowing Tasks theory with the performance of the auditory BCI system. We also evaluated the judgment effectiveness of the three ERPs components (N2P3, P300, and N200) from five chosen electrodes. The best average accuracy of post-analysis was 78.96%. Using component N2P3 to distinguish between target and non-target can improve the efficiency of the auditory BCI system and give it good practicality. We intend to persist in this study and involve the protocol in an aBCI-based home care system (HCS) for target patients to provide daily assistance.

1. Introduction

Many people with severe motor paralysis, such as spinal cord injury, locked-in syndrome (LIS), and amyotrophic lateral sclerosis (ALS), who have lost communication skills, cannot express their thoughts freely. Yet, most functions of their brain and senses are without dysfunction [1,2,3,4,5]. Over the past few decades, many supportive tools have been developed (including brain–computer interface (BCI) systems) in dramatic proliferation [6,7,8,9,10,11,12,13]. In addition, an auditory BCI (aBCI) is a helpful tool for people with severe motor paralysis at the end stage or who cannot stare at the screen [14,15,16]. However, the speed and accuracy of contemporary auditory BCIs are slower and lower than those of visual modality BCIs [17].
The user of a stimulus-driven BCI system has to choose to focus on one stimulus out of the numerous stimuli presented at the same time, which evokes a specific event-related potential (ERP) pattern [15,18,19], including components P300 (P3), and N200 (N2), as shown in Figure 1. The oddball paradigm is usually used to elicit the components of ERPs. BCI application extracts the feature values of the data from the monitored electroencephalograph (EEG) simultaneously. Then, the features are classified and generated to a resulting command immediately. The application of EEG is in a broad scope for clinical [20] and non-clinical applications, such as transport, entertainment [21], and education [22]. For example, using EEG equipment in the applications of ML-based disease diagnosis or mental workload prediction is familiar.
Sutton proposed that external stimuli would evoke a human brainwave fluctuation, called event-related potentials (ERP), in 1965 [23]. Specific physical events or psychological events trigger these time-dependent potentials of brainwave fluctuations [23,24]. A BCI system based on ERP obtains potentials on the surface of the cortex [13,15,25]. The ERP-based BCI system learns the basics of a user’s brain system via the ERPs obtained from the user’s brain rhythm [24,26]. The potentials of the user’s brainwaves are amplified and recorded by the EEG device [19,27,28]. The ERP-based BCI system accepts these signals from EEG and filters these EEG data. Then, the BCI system uses signal accumulation and averaging methods to extract the specific features of ERP components, then classify and interpret them [16,24,29]. Finally, these signals are converted into instructions and output to the devices to help the user perform [9,12,13,30,31].
A P300 (P3) peak usually appears around 300–400 ms after the stimulus presentation. That is, P3 is a higher deflection peak of an ERP [16,19,28,29,32]. Additionally, an N200 (N2) trough often comes about 200 ms later than the onset of a target stimulus. So, N2 is a lower deflection trough of an ERP [9,16,31,33]. If the user focuses on detecting the targets, the P300 and N200 waves facilely come about [18,34,35]. Usually, the P3 potentials of the non-target stimuli are lower than that of the target stimulus. The situation is just the opposite for N2 [31,36]. In addition, the ERP component latencies deepen the difficulty of discriminating between the target and non-target stimuli [29].
A stimulus-driven aBCI system plays the sound stimuli through either headphones or speakers. The users of a stimulus-driven aBCI must focus only on the sound they want to hear (target) while ignoring the others (non-targets) [17]. For example, if the user pays attention to the sound played in the left earphone and ignores the sound in the right earphone, then the sound played from the left channel of the headphones is the target sound stimulus at that moment. The difference in the responses that the EEG gains allows the system to group the ERPs into target and non-target. The aBCI system then captures and classifies these signals and interprets the discriminative features of the ERP components.
However, it is not a simple task for the user of an aBCI to pay attention to one of the two or more different voices played simultaneously [31,37]. The noise ratio (SNR) of a non-invasive BCI is lower than in the case of invasive technology [38]. Thus, ERP responses of an auditory BCI system were less class-discriminative between attended and unattended stimuli than those of a visual BCI (vBCI) [39,40].
Therefore, numerous studies have used diverse stimulation methods to increase the classification accuracy for better-quality interfacing applications. Most aBCI systems use the Auditory Steady-State Response (ASSR) [38], N200 [9,26], or P300 [16,31,39] modalities to interpret sound stimuli. Hybrid systems that combine two aBCI modalities or at least one aBCI system with another scheme seek to improve the system’s performance [41,42,43,44]. Several studies based on ASSR have explored the impact of natural and synthetic sound sources on aBCI [45] to reduce users’ mental workload. Using more than two loudspeakers to present the spatial directionality allows the users to accept more than two options simultaneously [43,46,47]. In addition to these stimulations, the work of Marassi et al. contrasts two ways of using the aBCI: passively counting the presented target sound stimuli or simply mentally repeating them when they occur [31]. Further, aBCI performance does not depend solely on the aBCI system. Several studies indicate that the users’ mood, attention, and motivation could influence aBCI performance and P300 electrophysiology. Such factors may contribute to inter-individual differences [31,42,48].
However, conventional aBCI has not been practical because of its lack of high accuracy and reliability. The users have to suffer a substantial workload due to these auditory approaches employing more complex interfaces for system efficiency [39,42]. Furthermore, the structure of the human hearing system and the user’s attention may be critical factors [49].
A user who wants to do something via an aBCI system must be able to listen attentively to the sound stimuli of the desired option. However, when sound enters one human ear, the tone will be transmitted immediately to the other ear through the human hearing system. With the time difference in binaural hearing, people can identify the position where the sound came from and be alerted to the direction of danger [49]. Yet, this critical feature of the hearing functions makes it difficult for the user to concentrate on listening to the target sound entering one of the ears.
In addition, the degree of user concentration (selective and continuous attention) also affects the accuracy of a BCI system [50,51]. In da Silva-Sauer et al. [51], the authors showed that when the user’s attention declines, the accuracy of a BCI falls. When a person needs to pay attention to a particular sound source, they activate the control of selective attention. Thus, many studies of a stimulus-driven BCI system ask subjects to maintain a high degree of concentration during the experiment [52]. Lakey et al. [28] found that using a short mindfulness meditation induction (MMI) could maintain the user’s attention and improve the performance of P300-based BCI systems.
Thus, two factors affect the performance of an aBCI system: whether the target sound stimulus can attract the user’s attention and whether the user can easily distinguish the target sound stimulus from non-target stimuli. Therefore, we propose a strategy to maintain the user’s concentration during the sound stimuli playing to improve the accuracy of our aBCI. We introduce a novel auditory paradigm to solve the problem caused by the human hearing system and the user’s attention: using mental Shadowing Tasks to improve EEG’s sound-evoked potential of the target stimuli to enhance the aBCI system’s efficiency.
At the beginning of our study on an aBCI system, the sound stimuli consisted of periodic click sounds, such as beep, dang, and bleep. However, the effectiveness of such a sound stimulus model was mediocre. The accuracy was equal to or below the chance level. According to the work of Baykara et al., motivation influences P300 amplitude and the performance of a BCI system [48]. If the sound stimuli are monotonous and repetitive, such as beeps, they cannot trigger the users’ motivation [45]. Because the discriminative features of the ERP components in our former aBCI system research were severely disorganized, we had to use other sound sources.
Story sound is friendlier for the users than simple periodic click tones since it has a friendlier alternating (musical) temporal structure. So, we hypothesize that the application of the novel stimuli to the auditory BCI will result in a more comfortable interfacing experience. Therefore, we created a prototype of the aBCI system using audio story stimulation and the Shadowing Tasks mechanism [37,53] to carry out the subsequent experiment.
Shadowing Tasks is an experimental technique performed via headphones. Participants are required to repeat the target stimuli aloud immediately after hearing a sentence, word, or phrase. Usually, non-target stimuli appear in the background simultaneously [54]. Cherry’s Shadowing Tasks present two distinct auditory messages to the participant’s right and left ears and asks the participant to pay attention to the target sound heard in one of the two ears and repeat the sound [37,54].
Shadowing Tasks require the user to have the ability to recognize the target sound from two simultaneously heard messages. The ability to separate the target sound from the noisy background sounds is affected by many variables, such as the speaker’s gender, the direction the sound comes from, the pitch, and the speed of speech. Thus, in the Shadowing Tasks, the subjects must engage in selective attention to enable them to focus on the target sound stimuli.
This study adopted Cherry’s approach to delivering sound stimuli: stories with the target stimulus. Different story sounds are played to the user’s left and right ears in synchronization through headphones. The participant was required to pay attention to the target sound from the left or right headphones [41]. To reduce the mental workload, we asked the participants to mentally repeat the target stimuli, not repeat them aloud [31].
In this study, we incorporated mental Shadowing Tasks to maintain the user’s concentration during the presentation of sound stimuli. We aim to confirm whether the mental Shadowing Tasks can improve the EEG’s sound-evoked potential of the target stimuli and enhance the aBCI system’s efficiency. In addition, we also evaluated the judgment effectiveness of the three ERPs components (N2P3, P300, and N200) across five chosen electrodes.

2. Materials and Methods

2.1. Participants

The participants were 24 healthy people aged 20–22, 7 females. All participants were volunteers and had no head injuries, history of neurological defects, mental illness, or drug treatments. All participants had normal hearing. No participants had used BCI or received training ahead of the experimental procedure. Before participating in the experiment, all subjects signed the Informed Consent Form approved by the Human Research Ethics Committee at National Cheng Kung University. The experimental procedure ended immediately if a participant withdrew during the test, and we dropped the data.

2.2. The aBCI System

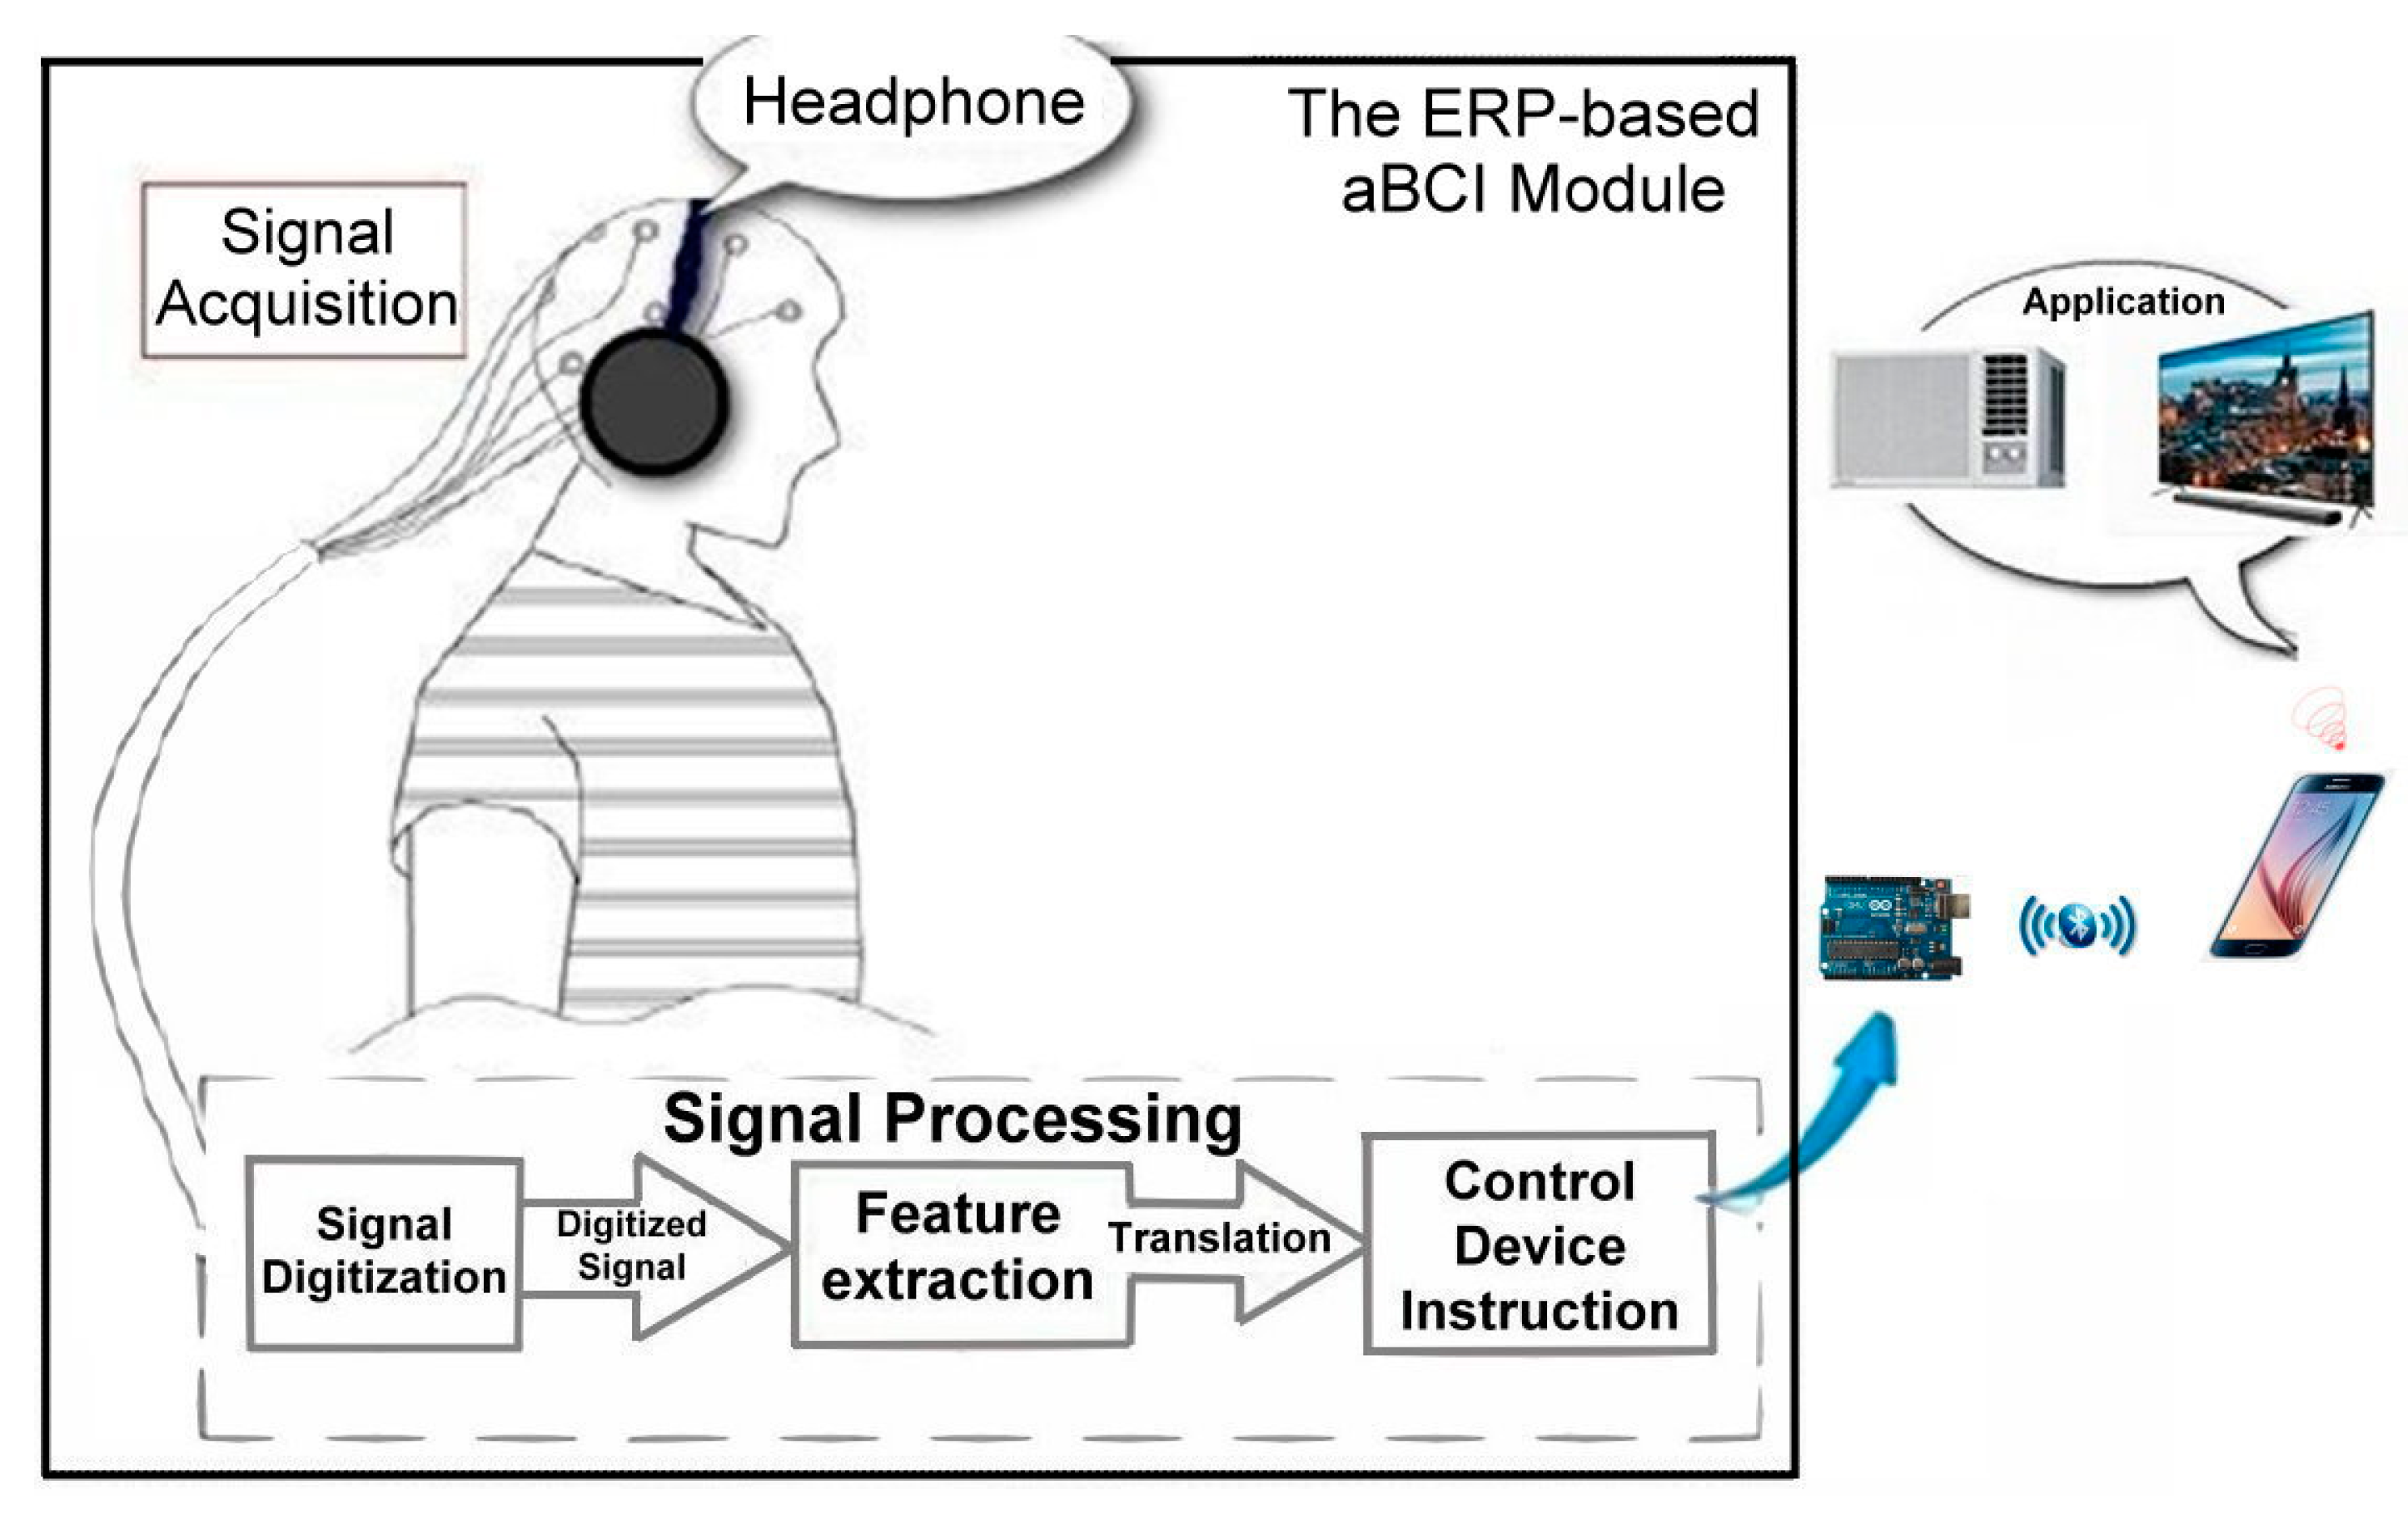
2.2.1. The Prototype of the aBCI System Module

Figure 2 shows the experimental setup. There are signal acquisition, signal processing, and application in the prototype.
The experiment used short stories compiled by the author as sound stimuli. There is a keyword in each short story that appears seven times, and the user must pay close attention and mentally repeat the keyword. The ERP-based aBCI module receives the signal data of the participant’s brainwaves via non-invasive EEG equipment that includes 32 channels [15,25]. Thus, the aBCI module can discern the participant’s choice and then export the command signal to the application.

2.2.2. The Stimulation Trials Using Audio Story

Based on the Shadowing Tasks, the study needed sound stimuli in the form of a story. We designed twelve audio stories to be the sound stimuli to help participants test the aBCI module using Shadowing Tasks. The twelve audio stories, six recorded by male pronunciation and six by female, were all recorded in mono sound channel. These stories consisted of approximately 117–138 Chinese characters, with playtimes of 45–60 s. Figure 3 shows two of the twelve audio stories (original text written in Chinese).
Each audio story includes one keyword (words rendered in boldface in Figure 3). The keyword appears seven times in the story, following the principles of the oddball paradigm [35,43], and the inter-stimulus interval (ISI) between the two keywords was 5–8 s. Thus, the user can easily focus on the target stimuli (the keyword appears seven times) in the story he wants to hear by mentally repeating the keyword, not all the words. The unequal ISI avoids anticipatory psychology from the user. The onset times of the keywords in the different stories are all different, to prevent mutual interference.

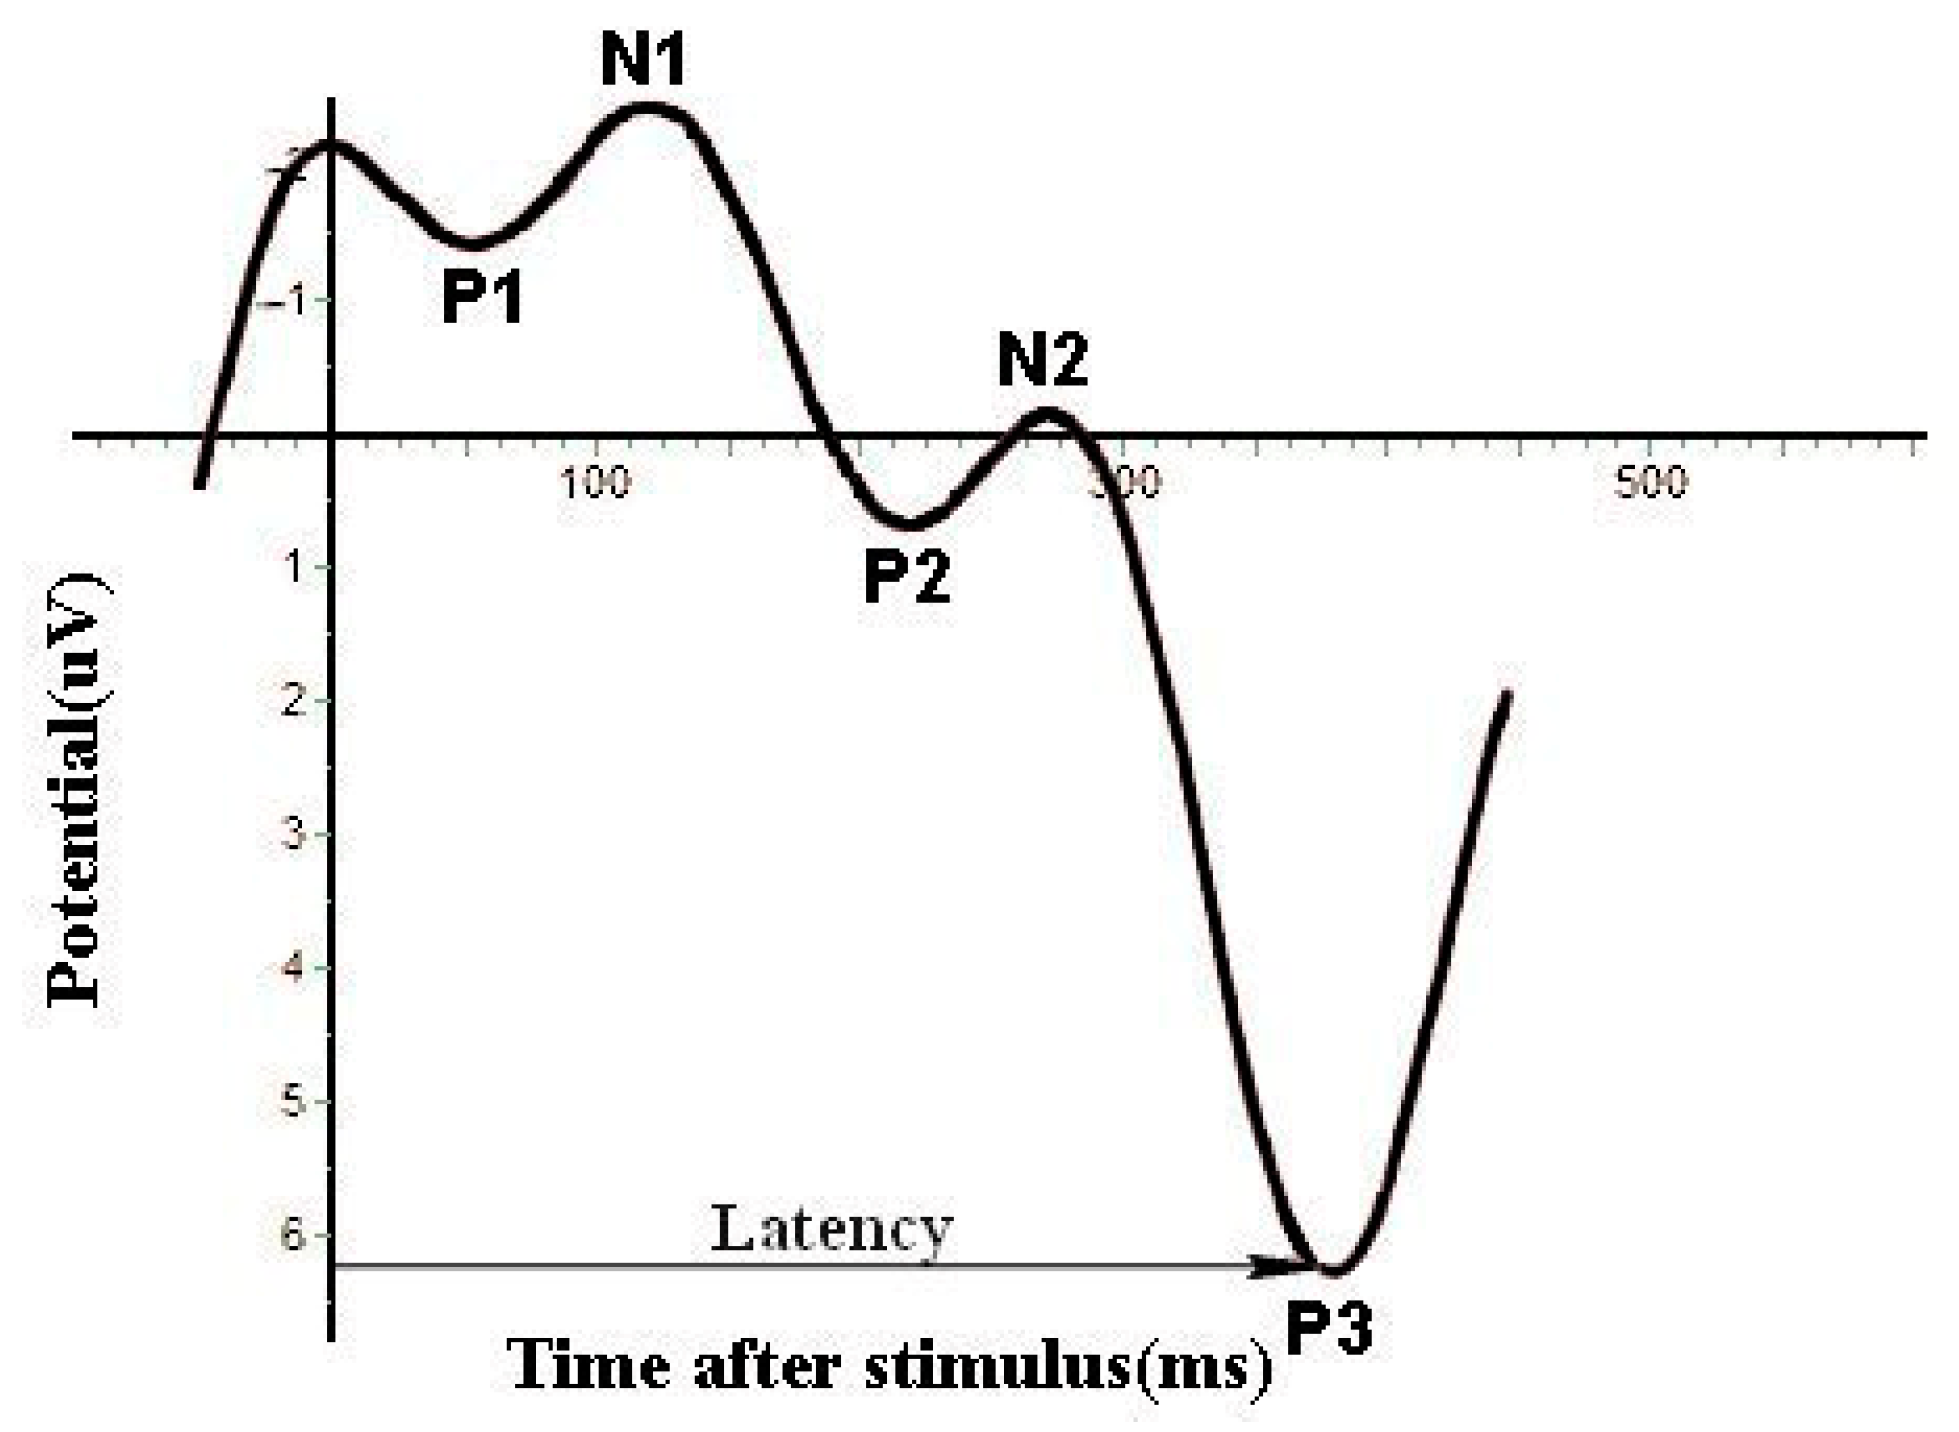
2.2.3. ERP Trial Features

In the study, the auditory BCI prototype first searched out sound-evoked potentials of the P3 peak and the N2 trough out of the ERPs gained from EEG after every trial. Thus, the system can obtain an N2P3 potential: the P300 potential minus the N200 potential. We used the values of N2P3, P300, and N200 to interpret the discriminative features and identify the best system accuracy in the post-analysis.
Our aBCI system provides two options for the user in every trial: one audio story via the left earphone (L) and the other via the right earphone (R). If the participant focuses on the audio story in the right earphone, then the figure of the ERP components in this trial resembles Figure 4. In Figure 4, the green circles mark the locations of the P3 peaks in the ERP feature, while the red marks indicate the N2 troughs. The P300 potential minus the N200 potential in the same curve is the N2P3 potential. The results using any one component of ERPs, N2P3, P300, and N200, to distinguish which audio story the participant listened to all indicate that the participant focused on the option from the right channel in this trial. Thus, the red curve (R_2) in Figure 4 is what the participant chose in this trial.

2.3. Experimental Program

2.3.1. Experimental Equipment

The EEG equipment produced by Braintronics B.V. Company for obtaining the user’s brainwave data contains CONTROL-1132, a control unit, and ISO-1032CE, a 32-channel amplifier. In addition, the prototype used a PCI-1713 card to shift the data from analog to digital. The signals of brainwave acquisition used MATLAB’s ERPLAB. Additionally, we used Borland C++ Builder to develop the aBCI module.

2.3.2. Data Collection

We made the impedance remain below 10 kΩ in the EEG equipment and set the sampling rate at 500 Hz. According to Peschke et al. [55], the connection between hearing and language processing is found in the Broca area (Cz and Fz) in the human brain by fMRI during the non-word Shadowing Tasks. The work of De Vos et al. [56] gained distinct P300 data from electrode Pz. Further, T3 and T4 of the 10/20 location system lie in the chief auditory cortex [49]. Thus, in this study, the EEG device obtains the user’s brainwaves via electrodes T3, T4, Pz, Cz, and Fz on their scalp [16], as shown in Figure 5. Electrode FP2 is grounded, and the reference potential gains from electrodes A1 and A2. Every electrode is Ag/AgCl wet electrode, and the electrode locations refer to the International 10–20 Location System [57,58,59].
The ISO-1032CE in EEG equipment amplifies the brainwave signal and records the EEG potentials. The control unit, CONTROL-1132, uses a 0.3–15 Hz band-pass filter to filter the signal. Then, the converter card, PCI-1713, shifts the data from analog to digital, and finally, the aBCI system receives all the EEG signals to find the stimulus focused by the user.
For noise processing, there are two parts. The first is to filter the blink noise. So, there is electrode Fp2 around the eye. If the EMG signal is detected, the system will discard the signal. The second is the AC signal of the power supply. EEG hardware equipment has filtering and voltage stabilization functions to filter. For heartbeat noise, we remove it with relative potential between the sampling electrodes and the reference electrodes (electrodes A1 and A2 around the ears). Therefore, the system can remove most of the noise. Finally, based on the principle of event-related potentials: the potentials obtained by multiple stimulations and then averaged, the system can deal with the remaining small part of the noise and gain a stable and reliable electroencephalogram.

2.3.3. Data Processing

  • Stimuli presentation: The system synchronously plays two different audio stories via the left and the right headphones as the stimuli of the aBCI experiment.
  • ERPs acquisition: One keyword appears seven times in each audio story file. The system ignores first time the keyword appears and then obtains the subject’s brainwaves the remaining six onset times of the keyword. Therefore, six ERP segments were retrieved one by one inside −100 to 800 ms based on each onset time of six keywords. Then, the aBCI system uses signal accumulation and averaging methods to treat the six ERP segments for every option to gain the ERP features.
  • ERP features interpretation: After the processing of ERPs acquisition, our aBCI system thus finds out P3 and N2 potential and calculates the N2P3 potential. Then, the system would determine which audio story was focused on by the user during the trial after it estimated the component potential for each option with each other.

2.4. Experimental Procedure

We use Figure 2 to explain the experimental prototype of the aBCI. The participant sits comfortably ahead of the aBCI system before the experimental procedure. The first preparation step before the test was to explain the test scheme, audio stories, and how to mentally repeat the keyword in the target story to the participant. Then, the experimenter attached electrodes to the participant’s scalp, helped the user to put on the headphones, and checked the headphone volume. After completing all the preparations, the experimental procedure of 20 trials (10 test runs, there are 2 trials in each test) began immediately, up to 30mins. That is, each test run includes two trial stages. Each participant must perform the test run ten times. They must make one choice on each trial (two selections on a test run). Figure 6 shows the flowchart of the test procedure.
Before each trial, the experimenter specified one audio story as the target stimulus. There is an additional instruction: a mindfulness induction, played before each trial stage to help the participant focus on the target sound stimuli. During each trial, the participant must pay attention to the target story and mentally repeat the keyword in the story. The system then obtained the ERPs of both options from EEG equipment. Next, our aBCI system determined the sound-evoked potentials of every ERP component for both options. The choice having the highest potential should be the one the participant was paying attention to during the operation. Then, the system outputted the results of each trial with R or L. If the user focuses on the audio story played through the right earphone, the code is R; otherwise, the code is L. The system will judge it as correct when the output result comes together with the target specified by the experimenter. For example, the experimenter asks the participant to listen to the audio story of the right channel (R), and if the output is R, it is correct. Therefore, after each test run (two trial stages), the user can choose which one he prefers from four options (LL, LR, RL, RR).

2.5. System Evaluation

2.5.1. Information Transfer Rate

We evaluated our proposed system by computing the classification accuracy and the information transfer rate (ITR). ITR is quite valuable for estimating an aBCI system. We refer to the work of Wolpaw et al. to do the bit-rate/min calculation [31,60], as follows:
ITR   ( bit - rate / min ) = M { log 2 N + P log 2 P + ( 1 P ) log 2 [ ( 1 P ) ( N 1 ) ] }
where M indicates the number of choices made in a minute, N is the number of options, and P is the classification accuracy.

2.5.2. Neural Network

To determine the best identification for each participant, we used artificial intelligent technology neural network (NN) [61], a multi-layer neural network (Figure 7), to learn and analyze the output data of the five electrodes. The output of the BCI system is the input data of the neural network. Each electrode has two pieces of data: the sound-evoked potential obtained from stimulation on the left and right ears via the headphones. Therefore, the system will generate ten data from the five electrodes after every trial. Additionally, the expected output of the multi-layer neural network is to L (=0) or R (=1).
There are 11 neurons (N101 to N111) in Hidden Layer 1 and two (N201 and N202) in Hidden Layer 2. We used the Keras API with parameters set as activation = ‘sigmoid’, model.compile: loss = ‘categorical_crossentropy’, optimizer = ‘adam’, metrics = [‘accuracy’].
We use a 5-fold cross-validation method to train and validate the performance of the aBCI system. The NN model divides the data from 20 trials of each participant into five data sets. In each iteration of the cross-validation, four data sets out of five are used as training data, while the remaining data set is the testing data. Additionally, the NN model uses the gradient descent method to update the weights, the cross entropy function (Equation (3)) is used as the loss function (Equation (4)), and the learning rate is set as 0.001. After 10,000 iterations of training, the neural network achieved a high classification accuracy for training data. Then, the testing data is used to evaluate the accuracy of the model. Finally, the averaged accuracy among the five testing data sets obtained.
The activation function of each neuron is defined as sigmoid function:
f w ( x ) = 1 1 + e ( w T x + b )
where w is the weight vector, x is the input vector, and b is the bias.
The cross entropy function is:
H ( p , q ) = x p ( x ) log q ( x )
where p(x) is the target distribution and q(x) is the predicted matching distribution.
So, the loss function is:
L ( w ) = 1 n i = 1 n [ y i log f w ( x i ) + ( 1 y i ) log ( 1 f w ( x i ) ]
where n is the number of training data, and when yi (desired output) ≈ fw(xi) (NN output), L(w) has a minimum value.

3. Results

Twenty-four healthy people were involved in the study and completed all experimental processes. Component N2P3 was used to analyze the EEG output online. The experimental results were analyzed as follows.

3.1. Discriminating the Sound-Evoked Potential in EEG

The system outputs the potential data (such as Table 1), the figures of the ERPs’ features (such as Figure 4), and the results using N2P3 to distinguish the EEG data online. Figure 4 illustrates how to discriminate the characteristics of EEG data with a ERPs figure. Table 1 explains the scheme for determining the value of components N2P3, P300, and N200 via sound-evoked potentials. In Figure 4, the red curve presents the ERP evoked for the sound from the right ear, and the green-dot curve shows the ERP induced for the sound from the left ear.
Figure 4 and Table 1 show that the P300 value (1.0947 µV at 376 msec) of the red curve (R option) is higher potential than that of the green-dot curve (L option), and the N200 value (−3.3680 µV at 258 msec) of the red curve (R option) is lower potential than that of the green-dot curve (L option). In Table 1, the R option (red curve) exhibits a higher N2P3 value (4.4627 µV). Therefore, the red curve is the dominant option. We thus know that the subject was focusing on the sound from the right channel of the headphones. Hence, the user’s choice is R, which is also the target specified by the experimenter. That is, the user made the right choice during this trial.

3.2. Accuracy Analyses of Experimental Results

We used audio story stimulation and mental Shadowing Tasks to accomplish the experiment. The following accuracy analyses of the data obtained from electrodes show the experimental results using Shadowing Tasks.

3.2.1. Accuracy Analyses for All Output Data

The system used five electrodes (T3, T4, Pz, Cz, and Fz) to gain the potential data of the participants’ brainwaves (ERPs). The system also outputs the classification results from the EEG data of five electrodes based on each component of the ERPs (Table 2, Table 3 and Table 4). Additionally, Figure 8 shows the potential difference between target and non-target.
Component N2P3 was used to analyze the output of the EEG online. The experimental results in Table 2, Table 3 and Table 4 demonstrate the correctness of the system’s experimental setup: the N2P3 features enabled the best discrimination. Table 5 displays the paired samples t-test results between the target and non-target options regarding accuracy and potential. These results indicate that component N2P3 can discriminate the features of ERPs well. Thus, component N2P3 is the optimal ERP for interpretation.
In addition, from the N2P3 results for online output (Table 4), the best-performing electrode Pz and the worst-performing electrode T3 were subjected to paired samples t-test. The mean between Pz and T3 did not reach a significant level (Table 6). So, we inferred that all five points are suitable for sampling electrode points.

3.2.2. Accuracy Analyses via Neural Network

The experimental results in Table 2, Table 3 and Table 4 show that the average accuracy (correct rate) is not consistent across the five electrodes of each participant, and there are high individual differences among the users. Therefore, we use a NN technology for classification and identification to identify the best prediction function for each participant and perform the validation with a 5-fold cross-validation method (Table 7). The accuracy rendered in boldface is the best among the three components of the ERPs for each participant, respectively.
The average accuracy across all the participants via the NN analysis using the data from component N2P3 was 78.96%, which is better than the accuracies of the other two components.

3.2.3. Analysis of the Average Accuracies of the ERP Components

Table 7 shows the average accuracies of the three ERP components using NN analysis. The average accuracy of using the N2P3 component to discriminate the data from the same electrodes is better than that obtained using the P300 or N200 components. Each electrode gained the same results, as shown in Table 8. As expected, after the computer calculates the results, the average accuracy using the NN analysis is better than that of each electrode as well.
We also verify whether the difference among average accuracies of three components calculated by the NN technology (Table 7) reaches significance, as shown in Table 9.

3.2.4. Effect of Gender Voice Differences on Accuracy

In the experimental process, the system simultaneously sent a pair of audio stories through the left and right sides of the headphones for participants to listen to during each trial. There are twelve audio stories, six recorded in a male voice and six in a female voice. The auditory stimuli may or may not be the same-gender voice combination. A different-gender voice combination (DG) sends one male voice and one female voice simultaneously. The same-gender voice combination (SG) presents two male (or female) voices simultaneously. Next, we compared whether the auditory stimuli of different-gender voices or same-gender voices affected the accuracy, as shown in Table 10.
After the paired samples t-test, there are no significant difference between the accuracies of different-gender voice combinations and same-gender voice combinations using components N200 and N2P3 except for P300 (p = 0.0353 * < 0.05). Additionally, the paired samples t-test results of the correct chosen R and the correct chosen L for all trials show no significant difference between the accuracies (Table 11).
This result implies that accuracy is not affected by the gender voice combination played in each headphone if the system uses component N2P3 to distinguish EEG output data.

3.2.5. Effect of the Different Gender of Subjects on Accuracy

Twenty-four healthy people, seven females, were involved in the study and completed all experimental processes. Next, we compared whether the different gender of subjects affected the accuracy, as shown in Table 12.
After the independent samples t-test, there are no significant difference between the accuracies of different gender of subjects using components P300 and N2P3 to distinguish except for using component N200 (electrodes Fz, Cz, and Pz). This result implies that accuracy is not affected by the gender of users if the system uses component N2P3 to distinguish EEG output data.

3.3. Bit-Rate Analysis

Table 13 shows the bit rate of the trials from these five electrodes and the NN technology. The average bit rate of the study is lower than that of other studies [13].

4. Discussion

Almost all researchers in this field have tried to promote the efficiency of their aBCI systems through various methods [17,41,45,47,48]. So, improving the efficiency of our aBCI is a primary task in the study as well. The accuracy of an aBCI system is deeply affected by three primary factors. First, is the stimulus appropriate? Second, are the positions of electrodes to obtain the brainwave data appropriate? Finally, should the system select which ERP components (N2P3, P300, and N200) to interpret the data of the user’s brainwaves online to achieve the best system efficiency?
Related research has sprung up like mushrooms after rain to solve the above problems. We reviewed several studies similar to this one to discuss their strengths and weaknesses, as shown in Table 14. The further discussion showed in the text description after the table.
Because of human hearing function, two factors affect the performance of the BCI system: whether the target sound stimulus attracts the user’s attention and whether the user can easily distinguish the target sound stimulus from the non-target stimuli. The work of Domingos et al. also showed that performing an attention task in an intermittent noisy or silent room had different results. It could be that humans are unaware of all the noise surrounding them every second, but if we deprive them of it, it can be worse [21].
We decided to use audio stories as sound stimulation to improve user motivation and use headphones to deliver the audio stories to enable the user to concentrate on and repeat the keywords in the stories. In our previous work [14], we invited seven participants familiar with a BCI system to test our aBCI system. We found the discriminative features in ERPs from the aBCI system are traceable, as shown in Figure 4. The features of P300 and N200 using audio story stimulation and the Shadowing Tasks mechanism were more distinct than those using other methods. These results encouraged us to perform a subsequent study of the aBCI system.
In addition, to a decline in mental workload, we shift the usual Shadowing Tasks paradigm [14]: instead of loudly repeating the auditory target stimuli, we ask subjects to echo the target stimuli mentally as it occurs [31]. We call this approach, different from those of previous studies, the mental Shadowing Tasks mechanism.
This study used twelve audio stories, six recorded by male and six by female voices. The number of audio stories is greater than that of our previous work [14]. According to the post-analysis, we found that the gender of the story voice did not affect the participants’ attention or the average accuracies using N2P3 to distinguish the EEG data, as shown in Table 10.
Most aBCI studies use more than eight electrodes to collect data [17,31,38,41,47,48,62]. To reduce user discomfort, we used only three electrodes, Pz, Cz, and Fz, to sample the user’s brainwaves via EEG equipment in our previous work [14]. In this study, referencing [16,17,49] and passing through multiple experiments, we selected five electrodes to collect the data: T3, T4, Pz, Cz, and Fz. From Table 5 and Table 6, we inferred that all five points are suitable for sampling electrode points.
In the study, we invited 24 participants who had never used a BCI system to test our aBCI system. Table 2, Table 3 and Table 4 show the average accuracies of EEG data from each electrode for each participant. While the average accuracies are better than chance, the average accuracies are not consistent across the five electrodes of each participant, and there are high individual differences among the participants as well. Therefore, we used a neural network for classification and identification to identify the best prediction function for each user to improve the user’s accuracy when using the system. Table 7 shows the average accuracies via the NN analysis. NN analysis does raise all accuracies. The average accuracies for most participants using the data from component N2P3 were the highest among the three components via the NN analysis. The average accuracy across all participants was 78.96% ((921 + 974)/2400, shown in Table 15).
The output of the designed experiment comes from one of two options, R or L. It is different from the example of a medical test for diagnosing a condition that is positive or not. So, we set the right/left ear stimulus as the target and the left/right ear as the non-target, set different thresholds for the values of ERPs, and then obtained a sequence of confusion matrices and the ROC curve (Figure 9). Based on the ROC curve, we find the best cut-off score (accuracy) = 78.32%, slightly lower than that obtained by ANN (= 78.96%).
Further, the best result of confusion matrices is the precision = 80.02%, sensitivity = 76.75%, specificity = 79.89%, and recall = 76.62% [63].
In addition to auditory stimulation and sampling electrodes, another factor affecting the performance of a BCI is the interpretation of the ERPs. This study analyzed the data of each electrode using three ERP components (N2P3, P300, and N200). Which ERP component should the aBCI system use to interpret the data of the user’s brainwaves online? Table 8 shows the average accuracies across all participants for each electrode (including the average accuracies obtained by the NN analysis). This analysis showed that the average accuracy using component N2P3 to discriminate is the best. Table 8 also indicates that no matter which electrode is used, as long as the system uses component N2P3 to discriminate the data, we obtain better results. This result is consistent with the results of our vBCI experimental [13]. According to Table 9, the average accuracies of using the three components to discriminate the data from the same electrodes is significantly different. The accuracy using component N2P3 remains the best.
Searching for suitable ERP features and algorithms to raise the information transfer rate (ITR) attracts the most activity in BCI research [64]. Based on Höhne et al., the stimuli should exist long enough to evoke the sound-evoked potential. However, if the system uses much longer stimulation, the inter-command intervals will be extended, resulting in lower information–transfer–rates (ITR) [38]. Unacceptably low ITR in this study, as shown in Table 13, is one of the items that the subsequent systems need to improve. Increasing ITR will thus be a target of future research. Perhaps the number of keywords should be reduced from 7 to 5 or 4, or the stories shortened.
Finally, in this study, we noticed that the occurrence of the ERPs components varies from person to person, as shown in Figure 4 and Figure 8. Ref. [65] implemented a thorough test for the audio-visual, visual, and auditory spatial speller paradigms. One of the results is the latencies of auditory-based P300 peaks were longer than those of visual-based P300 peaks, from 250ms to 600ms. Those latencies both occur in target and non-target stimulation. The sampling time of the P300 and N200 components in our aBCI system is different from that of the ERPs diagram of our vBCI system [13], similar to the works of Chang et al. [65] and Marassi et al. [31]. The sampling time of brainwaves for some users is delayed and varies from person to person (Figure 10). That is also an issue for our follow-up research.

5. Conclusions

The shadowing tasks of cognitive science can effectively improve users’ concentration. This study applied this principle to help the user focus more on the target stimuli during using the auditory BCI, which improved the recognition accuracy of this system. So, the shadowing tasks approach is a primary innovation of this study.
The shadowing tasks proposed by Cherry elicited increased bilateral activation predominantly in the superior temporal sulci [55]. Additionally, mental repetition can be a simpler alternative to the mental count to reduce the cognitive workload [31]. Therefore, we proposed using mental shadowing tasks to increase the sound-evoked potential of EEG. Further, motivation influences performance and P300 amplitude [48], so we use audio stories to cause and enhance the motive of users.
Patients, such as those at the terminal stage of ALS, cannot use the visual-based BCI system due to the functional loss of muscle activities such as eye movement [15]. Our aBCI system wants to address this situation. Hence, this study focuses on the aBCI paradigm based on the Shadowing Tasks. We hope to develop an auditory BCI home care system.
The study adopts an event-related potential paradigm that combines motion-onset and oddball presentation. This ERP pattern uses components P300 and N200 [9] and the component N2P3 that we identified [13,14].
We compare the average accuracy of each electrode to confirm the performance of the data from each electrode. We also contrasted the interpretation capabilities of components N2P3, P3, and N2. Our results show that the accuracy improves. The efficiency is better than the efficiency obtained using the sound stimuli consisting of periodic click sounds. The average accuracy of each subject exceeded the theoretical chance levels (Table 7). When we interpret the data gained from component N2P3 via the NN technology, the average accuracy reaches 78.96%. Farther, the average accuracies for five users out of eight exceeded 80%. The preliminary results for audio story stimulation with mental Shadowing Tasks are a step forward compared with current state-of-the-art aBCI applications. This result encourages us to conduct future research into aBCI systems with Shadowing Task paradigms for possible inclusion in practical online applications.
Finally, the lower ITR needs to be improved. Therefore, research on more efficient stimuli types for BCI based on the mental Shadowing Tasks is necessary. Future studies should include the stories of the mental Shadowing Tasks, the sampling time of the component P300 and N200 optimization for handicapped or bedridden subjects, and the algorithms to increase information transfer rates. We intend to persist in this study and involve the protocol in an aBCI-based home care system (HCS) for target patients to provide daily assistance without gaze control with their environment.

Author Contributions

Conceptualization, K.-T.S. and K.-L.H.; methodology, K.-T.S. and K.-L.H.; software, K.-L.H. and S.-Y.L.; validation, K.-T.S. and S.-Y.L.; formal analysis, K.-T.S. and K.-L.H.; investigation, K.-T.S., K.-L.H. and S.-Y.L.; resources, K.-L.H. and S.-Y.L.; data curation, K.-L.H. and S.-Y.L.; writing—original draft preparation, K.-L.H.; writing—review and editing, K.-T.S.; supervision, K.-T.S.; project administration, K.-T.S.; funding acquisition, K.-T.S. All authors have read and agreed to the published version of the manuscript.

Funding

This research received no external funding.

Institutional Review Board Statement

The study protocol was approved by the Human Research Ethics Committee at National Cheng Kung University (protocol code: 107-349-2 and date of approval: 16 April 2019).

Informed Consent Statement

All subjects involved in the study had signed the informed consent.

Data Availability Statement

Post-analysis data and raw data are available; please email: d10355002@gm2.nutn.edu.tw or klhsieh@gmail.com.

Conflicts of Interest

The authors declare no conflict of interest.

References

  1. Van Es, M.A.; Hardiman, O.; Chio, A.; Al-Chalabi, A.; Pasterkamp, R.J.; Veldink, J.H.; van den Berg, L.H. Amyotrophic Lateral Sclerosis. Lancet 2017, 390, 2084–2098. [Google Scholar] [CrossRef]
  2. Kiernan, M.C.; Vucic, S.; Cheah, B.C.; Turner, M.R.; Eisen, A.; Hardiman, O.; Burrell, J.R.; Zoing, M.C. Amyotrophic Lateral Sclerosis. Lancet 2011, 377, 942–955. [Google Scholar] [CrossRef] [PubMed] [Green Version]
  3. Turner, M.R.; Agosta, F.; Bede, P.; Govind, V.; Lulé, D.; Verstraete, E. Neuroimaging in Amyotrophic Lateral Sclerosis. Biomark. Med. 2012, 6, 319–337. [Google Scholar] [CrossRef] [PubMed]
  4. Kiernan, M.C.; Vucic, S.; Talbot, K.; McDermott, C.J.; Hardiman, O.; Shefner, J.M.; Al-Chalabi, A.; Huynh, W.; Cudkowicz, M.; Talman, P.; et al. Improving Clinical Trial Outcomes in Amyotrophic Lateral Sclerosis. Nat. Rev. Neurol. 2021, 17, 104–118. [Google Scholar] [CrossRef] [PubMed]
  5. Vahsen, B.F.; Gray, E.; Thompson, A.G.; Ansorge, O.; Anthony, D.C.; Cowley, S.A.; Talbot, K.; Turner, M.R. Non-Neuronal Cells in Amyotrophic Lateral Sclerosis—From Pathogenesis to Biomarkers. Nat. Rev. Neurol. 2021, 17, 333–348. [Google Scholar] [CrossRef]
  6. Huang, T.W. Design of Chinese Spelling System Based on ERPs. Master’s Thesis, National University of Tainan, Tainan, Taiwan, 2011. [Google Scholar]
  7. Sun, K.T.; Huang, T.W.; Chen, M.C. Design of Chinese Spelling System Based on ERP. In Proceedings of the 11th IEEE International Conference on Bioinformatics and Bioengineering, BIBE 2011, Taichung, Taiwan, 24–26 October 2011; pp. 310–313. [Google Scholar]
  8. Liu, Y.-H.; Wang, S.-H.; Hu, M.-R. A Self-Paced P300 Healthcare Brain-Computer Interface System with SSVEP-Based Switching Control and Kernel FDA + SVM-Based Detector. Appl. Sci. 2016, 6, 142. [Google Scholar] [CrossRef] [Green Version]
  9. Hong, B.; Guo, F.; Liu, T.; Gao, X.; Gao, S. N200-Speller Using Motion-Onset Visual Response. Clin. Neurophysiol. 2009, 120, 1658–1666. [Google Scholar] [CrossRef] [PubMed]
  10. Yin, E.; Zhou, Z.; Jiang, J.; Chen, F.; Liu, Y.; Hu, D. A Speedy Hybrid BCI Spelling Approach Combining P300 and SSVEP. IEEE Trans. Biomed. Eng. 2014, 61, 473–483. [Google Scholar] [CrossRef]
  11. Wolpaw, J.R.; Birbaumer, N.; McFarland, D.J.; Pfurtscheller, G.; Vaughan, T.M. Brain-Computer Interfaces for Communication and Control. Clin. Neurophysiol. 2002, 113, 767–791. [Google Scholar] [CrossRef]
  12. Martínez-Cagigal, V.; Santamaría-Vázquez, E.; Gomez-Pilar, J.; Hornero, R. Towards an Accessible Use of Smartphone-Based Social Networks through Brain-Computer Interfaces. Expert Syst. Appl. 2019, 120, 155–166. [Google Scholar] [CrossRef]
  13. Sun, K.T.; Hsieh, K.L.; Syu, S.R. Towards an Accessible Use of a Brain-Computer Interfaces-Based Home Care System through a Smartphone. Comput. Intell. Neurosci. 2020, 2020, 16–18. [Google Scholar] [CrossRef] [PubMed]
  14. Hsieh, K.L.; Sun, K.T. Auditory Brain Computer Interface Design. In Proceedings of the 2017 International Conference on Applied System Innovation (ICASI), Sapporo, Japan, 13–17 May 2017; pp. 11–14. [Google Scholar]
  15. Matsumoto, Y.; Makino, S.; Mori, K.; Rutkowski, T.M. Classifying P300 Responses to Vowel Stimuli for Auditory Brain-Computer Interface. In Proceedings of the 2013 Asia-Pacific Signal and Information Processing Association Annual Summit and Conference, APSIPA 2013, Kaohsiung, Taiwan, 29 October–1 November 2013; pp. 1–5. [Google Scholar]
  16. Borirakarawin, M.; Punsawad, Y. Event-Related Potential-Based Brain-Computer Interface Using the Thai Vowels’ and Numerals’; Auditory Stimulus Pattern. Sensors 2022, 22, 5864. [Google Scholar] [CrossRef]
  17. Zeyl, T.; Yin, E.; Keightley, M.; Chau, T. Improving Bit Rate in an Auditory BCI: Exploiting Error-Related Potentials. Brain-Comput. Interfaces 2016, 3, 75–87. [Google Scholar] [CrossRef]
  18. Aydin, E.A.; Bay, O.F.; Guler, I. P300-Based Asynchronous Brain Computer Interface for Environmental Control System. IEEE J. Biomed. Health Inform. 2018, 22, 653–663. [Google Scholar] [CrossRef] [PubMed]
  19. Abiri, R.; Borhani, S.; Sellers, E.W.; Jiang, Y.; Zhao, X. A Comprehensive Review of EEG-Based Brain-Computer Interface Paradigms. J. Neural Eng. 2019, 16, 011001. [Google Scholar] [CrossRef] [PubMed]
  20. Islam, M.S.; Hussain, I.; Rahman, M.M.; Park, S.J.; Hossain, M.A. Explainable Artificial Intelligence Model for Stroke Prediction Using EEG Signal. Sensors 2022, 22, 9859. [Google Scholar] [CrossRef]
  21. Domingos, C.; da Silva Caldeira, H.; Miranda, M.; Melicio, F.; Rosa, A.C.; Pereira, J.G. The Influence of Noise in the Neurofeedback Training Sessions in Student Athletes. Int. J. Environ. Res. Public Health 2021, 18, 13223. [Google Scholar] [CrossRef]
  22. Cheng, P.W.; Tian, Y.J.; Kuo, T.H.; Sun, K.T. The Relationship between Brain Reaction and English Reading Tests for Non-Native English Speakers. Brain Res. 2016, 1642, 384–388. [Google Scholar] [CrossRef]
  23. Sutton, S.; Braren, M.; Zubin, J.; John, E.R. Evoked-Potential Correlates of Stimulus Uncertainty. Science 1965, 150, 1187–1188. [Google Scholar] [CrossRef]
  24. Kappenman, E.S.; Farrens, J.L.; Zhang, W.; Stewart, A.X.; Luck, S.J. ERP CORE: An Open Resource for Human Event-Related Potential Research. Neuroimage 2021, 225, 117465. [Google Scholar] [CrossRef]
  25. Jamil, N.; Belkacem, A.N.; Ouhbi, S.; Lakas, A. Noninvasive Electroencephalography Equipment for Assistive, Adaptive, and Rehabilitative Brain–Computer Interfaces: A Systematic Literature Review. Sensors 2021, 21, 4754. [Google Scholar] [CrossRef] [PubMed]
  26. Gamble, M.L.; Luck, S.J. N2ac: An ERP Component Associated with the Focusing of Attention within an Auditory Scene. Psychophysiology 2011, 48, 1057–1068. [Google Scholar] [CrossRef] [PubMed] [Green Version]
  27. Regan, D. Human Brain Electrophysiology: Evoked Potentials and Evoked Magnetic Fields in Science and Medicine; Elsevier: New York, NY, USA, 1989. [Google Scholar]
  28. Lakey, C.E.; Berry, D.R.; Sellers, E.W. Manipulating Attention via Mindfulness Induction Improves P300-Based Brain-Computer Interface Performance. J. Neural Eng. 2011, 8, 025019. [Google Scholar] [CrossRef] [PubMed] [Green Version]
  29. Picton, T.W. The P300 Wave of the Human Event-Related Potential. J. Clin. Neurophysiol. 1992, 9, 456–479. [Google Scholar] [CrossRef] [PubMed]
  30. Panicker, R.C.; Puthusserypady, S.; Sun, Y. Adaptation in P300 Braincomputer Interfaces: A Two-Classifier Cotraining Approach. IEEE Trans. Biomed. Eng. 2010, 57, 2927–2935. [Google Scholar] [CrossRef] [Green Version]
  31. Marassi, A.; Budai, R.; Chittaro, L. A P300 Auditory Brain-Computer Interface Based on Mental Repetition. Biomed. Phys. Eng. Express 2018, 4, 035040. [Google Scholar] [CrossRef]
  32. Hoffmann, U.; Vesin, J.M.; Ebrahimi, T.; Diserens, K. An Efficient P300-Based Brain-Computer Interface for Disabled Subjects. J. Neurosci. Methods 2008, 167, 115–125. [Google Scholar] [CrossRef] [Green Version]
  33. Patel, S.H.; Azzam, P.N. Characterization of N200 and P300: Selected Studies of the Event-Related Potential. Int. J. Med. Sci. 2005, 2, 147–154. [Google Scholar] [CrossRef] [Green Version]
  34. Donchin, E.; Spencer, K.M.; Wijesinghe, R. The Mental Prosthesis: Assessing the Speed of a P300-Based Brain- Computer Interface. IEEE Trans. Rehabil. Eng. 2000, 8, 174–179. [Google Scholar] [CrossRef] [Green Version]
  35. Halgren, E.; Marinkovic, K.; Chauvel, P. Generators of the Late Cognitive Potentials in Auditory and Visual Oddball Tasks. Electroencephalogr. Clin. Neurophysiol. 1998, 106, 156–164. [Google Scholar] [CrossRef]
  36. Zhang, R.; Wang, Q.; Li, K.; He, S.; Qin, S.; Feng, Z.; Chen, Y.; Song, P.; Yang, T.; Zhang, Y.; et al. A BCI-Based Environmental Control System for Patients with Severe Spinal Cord Injuries. IEEE Trans. Biomed. Eng. 2017, 64, 1959–1971. [Google Scholar] [CrossRef] [PubMed]
  37. Cherry, E.C. Some Experiments on the Recognition of Speech, with One and with Two Ears. J. Acoust. Soc. Am. 1953, 25, 975–979. [Google Scholar] [CrossRef]
  38. Matsumoto, Y.; Nishikawa, N.; Yamada, T.; Makino, S.; Rutkowski, T.M. Auditory Steady-State Response Stimuli Based BCI Application-the Optimization of the Stimuli Types and Lengths. In Proceedings of the Signal and Information Processing Association Annual Summit and Conference (APSIPA), Kaohsiung, Taiwan, 29 October–1 November 2013; pp. 285–308. [Google Scholar]
  39. Höhne, J.; Tangermann, M. Towards User-Friendly Spelling with an Auditory Brain-Computer Interface: The CharStreamer Paradigm. PLoS ONE 2014, 9, e102630. [Google Scholar] [CrossRef]
  40. Sosulski, J.; Hübner, D.; Klein, A.; Tangermann, M. Online Optimization of Stimulation Speed in an Auditory Brain-Computer Interface under Time Constraints. arXiv 2021, arXiv:2109.06011. [Google Scholar]
  41. Kaongoen, N.; Jo, S. A Novel Hybrid Auditory BCI Paradigm Combining ASSR and P300. J. Neurosci. Methods 2017, 279, 44–51. [Google Scholar] [CrossRef] [PubMed]
  42. Lu, Z.; Li, Q.; Gao, N.; Yang, J.; Bai, O. Happy Emotion Cognition of Bimodal Audiovisual Stimuli Optimizes the Performance of the P300 Speller. Brain Behav. 2019, 9, e01479. [Google Scholar] [CrossRef] [Green Version]
  43. Oralhan, Z. A New Paradigm for Region-Based P300 Speller in Brain Computer Interface. IEEE Access 2019, 7, 106618–106627. [Google Scholar] [CrossRef]
  44. Lu, Z.; Li, Q.; Gao, N.; Yang, J.; Bai, O. A Novel Audiovisual P300-Speller Paradigm Based on Cross-Modal Spatial and Semantic Congruence. Front. Neurosci. 2019, 13, 1040. [Google Scholar] [CrossRef]
  45. Heo, J.; Baek, H.J.; Hong, S.; Chang, M.H.; Lee, J.S.; Park, K.S. Music and Natural Sounds in an Auditory Steady-State Response Based Brain–Computer Interface to Increase User Acceptance. Comput. Biol. Med. 2017, 84, 45–52. [Google Scholar] [CrossRef]
  46. Nishikawa, N.; Makino, S.; Rutkowski, T.M. Spatial Auditory BCI Paradigm Based on Real and Virtual Sound Image Generation. In Proceedings of the 2013 Asia-Pacific Signal and Information Processing Association Annual Summit and Conference, APSIPA 2013, Kaohsiung, Taiwan, 29 October–1 November 2013. [Google Scholar]
  47. Chang, M.; Mori, K.; Makino, S. Spatial Auditory Two-Step Input Japanese Syllabary Brain-Computer Interface Speller. Procedia Technol. 2014, 18, 25–31. [Google Scholar] [CrossRef] [Green Version]
  48. Baykara, E.; Ruf, C.A.; Fioravanti, C.; Käthner, I.; Simon, N.; Kleih, S.C.; Kübler, A.; Halder, S. Effects of Training and Motivation on Auditory P300 Brain-Computer Interface Performance. Clin. Neurophysiol. 2016, 127, 379–387. [Google Scholar] [CrossRef] [PubMed]
  49. Moller, A.R. Hearing: Anatomy, Physiology, and Disorders of the Auditory System, 2nd ed.; Academic Press: San Diego, CA, USA, 2006; ISBN 978-0-12-372519-6. [Google Scholar]
  50. Lobato, B.Y.M.; Ramirez, M.R.; Rojas, E.M.; Moreno, H.B.R.; Soto, M.D.C.S.; Nuñez, S.O.V. Controlling a Computer Using BCI, by Blinking or Concentration. In Proceedings of the 2018 International Conference on Algorithms, Computing and Artificial Intelligence; Association for Computing Machinery, New York, NY, USA, 21–23 December 2018. [Google Scholar]
  51. Da Silva-Sauer, L.; Valero-Aguayo, L.; dela Torre-Luque, A.; Ron-Angevin, R.; Varona-Moya, S. Concentration on Performance with P300-Based BCI Systems: A Matter of Interface Features. Appl. Ergon. 2016, 52, 325–332. [Google Scholar] [CrossRef] [PubMed]
  52. Da Silva Souto, C.; Lüddemann, H.; Lipski, S.; Dietz, M.; Kollmeier, B. Influence of Attention on Speech-Rhythm Evoked Potentials: First Steps towards an Auditory Brain-Computer Interface Driven by Speech. Biomed. Phys. Eng. Express 2016, 2, 325–332. [Google Scholar] [CrossRef]
  53. McDermott, J.H. The Cocktail Party Problem. Curr. Biol. 2009, 19, R1024–R1027. [Google Scholar] [CrossRef] [PubMed] [Green Version]
  54. Revlin, R. Human Cognition: Theory and Practice; Worth Publishers: New York, NY, USA, 2007; ISBN 9780716756675. [Google Scholar]
  55. Peschke, C.; Ziegler, W.; Kappes, J.; Baumgaertner, A. Auditory-Motor Integration during Fast Repetition: The Neuronal Correlates of Shadowing. Neuroimage 2009, 47, 392–402. [Google Scholar] [CrossRef] [PubMed]
  56. DeVos, M.; Gandras, K.; Debener, S. Towards a Truly Mobile Auditory Brain-Computer Interface: Exploring the P300 to Take Away. Int. J. Psychophysiol. 2014, 91, 46–53. [Google Scholar] [CrossRef] [PubMed]
  57. Jurcak, V.; Tsuzuki, D.; Dan, I. 10/20, 10/10, and 10/5 Systems Revisited: Their Validity as Relative Head-Surface-Based Positioning Systems. Neuroimage 2007, 34, 1600–1611. [Google Scholar] [CrossRef]
  58. Wagner, A.; Ille, S.; Liesenhoff, C.; Aftahy, K.; Meyer, B.; Krieg, S.M. Improved Potential Quality of Intraoperative Transcranial Motor-Evoked Potentials by Navigated Electrode Placement Compared to the Conventional Ten-Twenty System. Neurosurg. Rev. 2022, 45, 585–593. [Google Scholar] [CrossRef]
  59. Ng, C.R.; Fiedler, P.; Kuhlmann, L.; Liley, D.; Vasconcelos, B.; Fonseca, C.; Tamburro, G.; Comani, S.; Lui, T.K.-Y.; Tse, C.-Y.; et al. Multi-Center Evaluation of Gel-Based and Dry Multipin EEG Caps. Sensors 2022, 22, 8079. [Google Scholar] [CrossRef]
  60. Wolpaw, J.R.; Birbaumer, N.; Heetderks, W.J.; McFarland, D.J.; Peckham, P.H.; Schalk, G.; Donchin, E.; Quatrano, L.A.; Robinson, C.J.; Vaughan, T.M. Brain-Computer Interface Technology: A Review of the First International Meeting. IEEE Trans. Rehabil. Eng. 2000, 8, 164–173. [Google Scholar] [CrossRef]
  61. Abiodun, O.I.; Jantan, A.; Omolara, A.E.; Dada, K.V.; Mohamed, N.A.; Arshad, H. State-of-the-Art in Artificial Neural Network Applications: A Survey. Heliyon 2018, 4, e00938. [Google Scholar] [CrossRef] [PubMed]
  62. An, X.; Höhne, J.; Ming, D.; Blankertz, B. Exploring Combinations of Auditory and Visual Stimuli for Gaze-Independent Brain-Computer Interfaces. PLoS ONE 2014, 9, e111070. [Google Scholar] [CrossRef] [PubMed] [Green Version]
  63. Ahsan, M.M.; Luna, S.A.; Siddique, Z. Machine-Learning-Based Disease Diagnosis: A Comprehensive Review. Healthcare 2022, 10, 541. [Google Scholar] [CrossRef]
  64. Dornhege, G.; Blankertz, B.; Curio, G.; Müller, K.-R. Increase Information Transfer Rates in BCI by CSP Extension to Multi-Class. In Proceedings of the NIPS 2003, Vancouver, BC, Canada, 8–13 December 2003. [Google Scholar]
  65. Chang, M.; Nishikawa, N.; Struzik, Z.R.; Mori, K.; Makino, S.; Mandic, D.; Rutkowski, T.M. Comparison of P300 Responses in Auditory, Visual and Audiovisual Spatial Speller BCI Paradigms. arXiv 2013, arXiv:1301.6360. [Google Scholar] [CrossRef]
Figure 1. ERP components after the onset of an audio stimulus, including the P300 (labeled P3) and N200 (labeled N2). Generally, the Y-axis scales are often upside down in ERP research.
Applsci 13 00856 g001
Figure 2. The prototype of the aBCI system. The upper left presents the concept of signal acquisition, the lower the module of signal processing, and the upper right the module of signal application for subsequent development.
Applsci 13 00856 g002
Figure 3. Two of the twelve audio stories (original text written in Chinese). Each story file includes a keyword (words rendered in boldface) that appears seven times in the story.
Applsci 13 00856 g003
Figure 4. Average waveforms at Cz of the second stage of the 4th test run from participant N04: The red circles mark the locations of N200 (marks 1 and 2), while the green circles mark the locations of P300 (marks 3 and 4).
Applsci 13 00856 g004
Figure 5. The positions of the electrodes based on the International 10–20 Location System. The green circles, A1 and A2, represent the reference electrodes. The ground electrode is the blue circle, FP2.
Applsci 13 00856 g005
Figure 6. The flowchart of the test procedure. The audio stories in blue squares were played in Chinese by the system during the operation.
Applsci 13 00856 g006
Figure 7. The structure of neural network to learn the data from the five electrodes.
Applsci 13 00856 g007
Figure 8. The potential differences between the target and non-target using components N200, P300, and N2P3 of ERPs to classify data from the five electrodes.
Applsci 13 00856 g008
Figure 9. The ROC curve by setting the right ear stimulus as the target and the left ear stimulus as the non-target.
Applsci 13 00856 g009
Figure 10. The delay situation of the components P300 and N200 in ERPs: The latencies of auditory P300 (marks 3 and 4) and N200 (marks 1 and 2) responses are longer than the theoretical latencies. The average waveforms at T3 is the first stage output of the 5th test run from participant N01.
Applsci 13 00856 g010
Table 1. ERP values (µV) of options obtained from the Cz, 2nd stage, the 4st test run of N04.
OptionsN2P3P300N200TargetResult
SpecifiedOn LineOff Line
R4.4627 *1.0947 *−3.3680 *N2P3, P300, N200
L1.0026−0.1217−1.1242
*: the potential accepted between two options.
Table 2. The average accuracies by component N200 of the experimental trial using mental Shadowing Tasks.
Unit: %
SubjectsT3T4FzCzPzAverage
N0150.0050.0070.00 *60.0045.0055.00
N0260.0065.0075.0080.00 *70.0070.00
N0355.0045.0050.0060.00 *50.0052.00
N0455.0065.0085.00 *75.0060.0068.00
N0540.0065.00 *60.0060.0035.0052.00
N0655.0040.0060.0055.0065.00 *55.00
N0760.0065.00 *60.0060.0050.0059.00
N0860.0065.00 *60.0050.0055.0058.00
N0955.00 *50.0055.00 *55.00 *55.00 *54.00
N1040.0045.0070.00 *70.00 *65.0058.00
N1150.00 *40.0050.00 *50.00 *50.00 *48.00
N1250.0035.0065.00 *45.0050.0049.00
N1370.0070.0070.0075.00 *45.0066.00
N1445.0080.00 *50.0060.0065.0060.00
N1545.0070.00 *65.0065.0050.0059.00
N1650.0065.00 *45.0040.0040.0048.00
N1745.0080.00 *70.0070.0070.0067.00
N1850.0065.0070.0075.00 *65.0065.00
N1970.00 *60.0070.00 *70.00 *65.0067.00
N2045.0055.0075.00 *60.0045.0056.00
N2155.0055.0070.00 *65.0060.0061.00
N2275.00 *55.0060.0055.0045.0058.00
N2360.0065.00 *55.0055.0050.0057.00
N2475.00 *50.0075.00 *50.0060.0062.00
Average54.7958.3363.96 *60.8354.5858.50
*: the best accuracy around the electrodes.
Table 3. The average accuracies by component P300 of the experimental trial using mental Shadowing Tasks.
Unit: %
SubjectsT3T4FzCzPzAverage
N0175.00 *75.00 *60.0075.00 *75.00 *72.00
N0240.0060.00 *35.0030.0035.0040.00
N0365.0065.0050.0060.0070.00 *62.00
N0470.00 *55.0045.0050.0055.0055.00
N0570.00 *45.0045.0050.0055.0053.00
N0660.0040.0050.0060.0065.00 *55.00
N0755.0055.0060.0055.0065.00 *58.00
N0850.0060.0080.0065.0085.00 *68.00
N0965.00 *60.0050.0065.00 *55.0059.00
N1060.0055.0065.00 *55.0065.00 *60.00
N1165.0055.0080.00 *60.0060.0064.00
N1255.0065.00 *60.0060.0060.0060.00
N1355.00 *55.00 *55.00 *55.00 *40.0052.00
N1475.0050.0055.0080.00 *75.0067.00
N1570.0060.0075.0080.0085.00 *74.00
N1670.0060.0055.0065.0075.00*65.00
N1765.00 *60.0060.0060.0055.0060.00
N1865.0045.0070.00 *60.0070.00 *62.00
N1965.0075.00 *55.0060.0065.0064.00
N2075.0065.0075.0085.00 *85.00 *77.00
N2170.00 *70.00 *60.0045.0055.0060.00
N2255.0070.00 *55.0060.0055.0059.00
N2370.00 *60.0055.0070.00 *55.0062.00
N2435.0075.00 *55.0050.0045.0052.00
Average62.5059.7958.5460.6362.71 *60.83
*: the best accuracy around the electrodes.
Table 4. The average accuracies by component N2P3 of the experimental trial using mental Shadowing Tasks.
Unit: %
SubjectsT3T4FzCzPzAverage
N0180.0065.0075.0085.00 *65.0074.00
N0280.00 *75.0060.0065.0065.0069.00
N0375.00 *55.0070.0055.0070.0065.00
N0475.0075.0080.0090.00 *85.0081.00
N0575.00 *60.0065.0070.0050.0064.00
N0655.0050.0065.0075.0080.00 *65.00
N0765.0060.0060.0065.0075.00 *65.00
N0865.0070.0075.0080.00 *75.0073.00
N0970.00 *60.0065.0070.00 *70.00 *67.00
N1070.0085.00 *75.0080.0080.0078.00
N1165.0045.0070.00 *60.0065.0061.00
N1265.0060.0080.00 *65.0060.0066.00
N1360.0060.0060.0045.0070.00 *59.00
N1465.0090.00 *70.0075.0090.00 *78.00
N1555.0070.0075.0065.0085.00 *70.00
N1680.00 *60.0055.0060.0080.00 *67.00
N1765.0065.0075.0085.00 *75.0073.00
N1855.0065.0075.0085.0090.00 *74.00
N1965.0090.00 *70.0080.0080.0077.00
N2070.0085.00 *80.0080.0070.0077.00
N2170.0075.0065.0080.00 *55.0069.00
N2285.00 *65.0075.0065.0060.0070.00
N2380.00 *70.0055.0065.0070.0068.00
N2435.0045.0055.0060.00 *50.0049.00
Average67.7166.6768.7571.0471.46 *69.13
*: the best accuracy around the electrodes.
Table 5. Paired samples t-test results of all trials between the target and non-target options regarding accuracy and potential.
α = 0.01, N = 480
ComponentsElectrodeCaseAccuracy (%)Potential (µV)
T-Valuep-ValueT-Valuep-Value
N200T3target
vs.
non-target
2.3350.028−0.17720.859
T43.3660.002 *−1.2370.217
Fz6.9150.000 ***−3.9710.000 ***
Cz5.1590.000 ***−2.2490.025
Pz2.2980.031 *−0.5760.565
P300T3target
vs.
non-target
5.8730.000 ***2.5210.012
T45.1130.000 ***1.0210.308
Fz3.7430.001 *0.0280.977
Cz4.3350.000 ***2.0110.045 *
Pz4.6630.000 ***2.7920.005 *
N2P3T3target
vs.
non-target
7.9350.000 ***4.2880.000 ***
T46.4960.000 ***3.0460.002 *
Fz11.3270.000 ***4.2240.000 ***
Cz9.1820.000 ***4.5220.000 ***
Pz9.2450.000 ***4.1600.000 ***
* p < 0.05; *** p < 0.001.
Table 6. Paired samples t-test results of average accuracies for every trial between the best and worst electrodes.
α = 0.01, N = 480
ComponentCaseT-Valuep-Value
N2P3T4 vs. Pz−1.8090.084
Table 7. Average accuracies based on the NN analysis.
Unit: %
SubjectsN200P300N2P3
N0170.0095.00 *90.00
N0285.00 *55.0085.00 *
N0360.0075.0080.00 *
N0470.0060.0085.00 *
N0565.0065.0070.00 *
N0665.0060.0085.00 *
N0770.00 *70.00 *70.00 *
N0860.0080.00 *80.00 *
N0960.0065.0080.00 *
N1080.0070.0085.00 *
N1150.0080.00 *65.00
N1255.0070.0075.00 *
N1375.00 *65.0075.00 *
N1470.0075.0080.00 *
N1570.0090.00 *75.00
N1645.0070.0075.00 *
N1780.0055.0085.00 *
N1875.0080.0090.00 *
N1970.0065.0085.00 *
N2065.0080.0085.00 *
N2165.0085.00 *85.00 *
N2260.0065.0080.00 *
N2370.00 *65.0070.00 *
N2465.00 *50.0060.00
Average66.6770.4278.96 *
*: the best accuracy around the components.
Table 8. Comparison of the average accuracy of three ERP components (N2P3, P300, and N200).
Dependent Variable: Average AccuraciesUnit: %
ComponentsT3T4FzCzPzNN Technology
N20054.7958.3363.9660.8354.5866.67
P30062.5059.7958.5460.6362.7170.42
N2P367.7166.6768.7571.0471.4678.96
Table 9. Multiple comparison of the average accuracies calculated by the NN technology.
Dependent Variable: Average Accuracies from the Analysis of NN Technology
Electrode(I)Electrode(J)Mean Discrepancy(I-J)p-Value
N2P3N20012.29167 ***0.000 ***
P3008.54167 *0.011 *
P300N2003.750000.400
* p < 0.05; *** p < 0.001.
Table 10. The average accuracies using different-gender (DG) and same-gender (SG) voices.
Unit: %
SubjectsN200P300N2P3
DGSGDGSGDGSG
N0146.0064.0082.0062.0088.0060.00
N0268.0072.0048.0032.0072.0066.00
N0344.0060.0060.0064.0060.0070.00
N0462.0074.0060.0050.0082.0080.00
N0546.0058.0052.0054.0060.0068.00
N0662.0048.0044.0066.0064.0066.00
N0764.0054.0056.0060.0060.0070.00
N0860.0056.0068.0068.0070.0076.00
N0962.0046.0064.0054.0072.0062.00
N1056.0060.0066.0054.0086.0070.00
N1166.0030.0056.0072.0064.0058.00
N1234.0064.0060.0060.0052.0080.00
N1366.0066.0062.0042.0064.0054.00
N1452.0068.0084.0050.0078.0078.00
N1560.0058.0078.0070.0078.0062.00
N1644.0052.0064.0066.0060.0074.00
N1762.0072.0068.0052.0072.0074.00
N1858.0072.0066.0058.0070.0078.00
N1970.0064.0062.0066.0080.0074.00
N2048.0064.0082.0072.0078.0076.00
N2158.0064.0054.0066.0064.0074.00
N2248.0068.0066.0052.0062.0078.00
N2366.0048.0068.0056.0076.0060.00
N2462.0062.0060.0044.0056.0042.00
Average56.8360.1763.7557.9269.5068.75
t-testp = 0.2827p = 0.0353 *p = 0.7764
* p < 0.05.
Table 11. Paired samples t-test results of average accuracies for every trial between correct selected R and correct selected L.
α = 0.01, N = 480
CaseT-Valuep-Value
N200correct selected R vs. correct selected L1.0660.292
P300correct selected R vs. correct selected L−0.6390.525
N2P3correct selected R vs. correct selected L−0.2890.774
Table 12. Independent samples t-test results of all trials between girls and boys.
α = 0.01, N = 340 for Boys and 140 for Girls
ComponentsElectrodeCaseT-Valuep-Value
N200T3boys vs. girls−1.1930.246
T4boys vs. girls−0.3270.746
Fzboys vs. girls−4.4050.000 ***
Czboys vs. girls−2.3480.028 *
Pzboys vs. girls−2.1160.045 *
NNboys vs. girls−1.3980.176
P300T3boys vs. girls0.5640.590
T4boys vs. girls−1.2840.212
Fzboys vs. girls0.5860.564
Czboys vs. girls1.3280.226
Pzboys vs. girls0.9730.341
NNboys vs. girls0.7090.486
N2P3T3boys vs. girls0.9830.336
T4boys vs. girls−1.6000.124
Fzboys vs. girls−0.2030.841
Czboys vs. girls−1.7880.088
Pzboys vs. girls0.2010.842
NNboys vs. girls−1.3030.206
* p < 0.05; *** p < 0.001.
Table 13. Comparison of the bit-rate of three ERP components (N2P3, P300, and N200).
Dependent Variable: Average Bit-Rate
ComponentsT3T4FzCzPzNN Technology
N2000.01140.03450.09770.05850.01040.1401
P3000.07810.04770.03630.05630.08080.2123
N2P30.15850.14010.17820.22600.23530.4418
Table 14. A comparison of the advantages and drawbacks of the proposed method with other studies.
ReferencesStimulation ModalityElectrodesSubjectsAdvantagesDrawbacks
[46]P300
Spatial real, virtual sounds
Cpz, Poz, P3, P4, P5, P6, Cz, Pz in 10/109 HSBoth stimuli types generate different event-related potential response patterns allowing for their separate classification.
  • Too few people participated in the experiment.
  • This analysis was more complicated, based on 8 electrodes.
[48]P300
Spatial vs. non-spatial
F3, Fz, F4, T7, C3, Cz, C4, T8, Cp3, Cp4, P3, Pz, P4, PO7, PO8, Oz16 HSTraining improves performance in an auditory BCI paradigm. Motivation influences performance and P300 amplitude.
  • This analysis was more complicated based on 16 electrodes.
  • Average accuracy < 80%
[17]P300
Spatial auditory
32 channels in the extended 10–20 system9HSErrP-based error correction can be used to make a substantial improvement in the performance of aBCIs.
  • Too few people participated in the experiment.
  • This analysis was more complicated, based on 32 electrodes.
[41]ASSR+P300
Earphone auditory
Fz, Cz, Pz, P3, P4, Oz, T3 and T410 HSThe average accuracy of the hybrid system is better than that of P300 or ASSR alone.
  • Too few people participated in the experiment.
  • This analysis was more complicated, based on a hybrid system.
[45]ASSR
Earphone auditory
Cz, Oz, T7, and T86 HSThe average classification accuracies online were excellent, more than 80%.
  • Too few people participated in the experiment.
  • This analysis was more complicated, based on the ASSR method.
[31]P300
Headphone auditory
Fz, Cz, Pz, Oz, P3, P4, PO7, PO810 HSMental repetition can be a simpler alternative to the mental count to reduce the mental workload.
  • Too few people participated in the experiment.
  • This analysis was offline.
[16]Speakers19 channels12HSMulti-loudspeaker patterns through vowel and numeral sound stimulation provided an accuracy greater than 85% of the average accuracy.
  • Too few people participated in the experiment.
  • This analysis was more complicated, based on 19 electrodes.
The proposed methodP300
Headphone auditory
T3, T4, Fz, Cz, Pz24HSThe method of mental shadowing tasks helps the user focus on the option he wants with ease to reduce the mental workload.Average accuracy = 78.69%, and it will be better if the accuracy rate can be higher.
Table 15. The frequency distribution of sound stimuli in the right and left ear using the NN technology to classify the data gained from component N2P3.
N2P3Specified ConditionTotal
RL
Classification
result
R9212261147
L2799741253
Total12001200
Disclaimer/Publisher’s Note: The statements, opinions and data contained in all publications are solely those of the individual author(s) and contributor(s) and not of MDPI and/or the editor(s). MDPI and/or the editor(s) disclaim responsibility for any injury to people or property resulting from any ideas, methods, instructions or products referred to in the content.

