Article

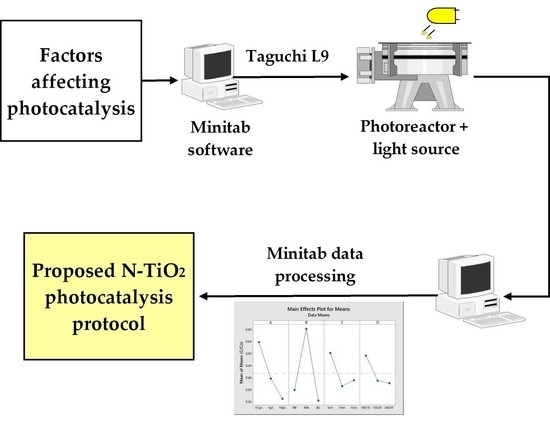
Photocatalytic Testing Protocol for N-Doped TiO2 Nanostructured Particles under Visible Light Irradiation Using the Statistical Taguchi Experimental Design

by
Maria-Emmanouela Kassalia
,
Zoe Nikolaou
and
Evangelia A. Pavlatou
*
General Chemistry Laboratory, School of Chemical Engineering, National Technical University of Athens, 15772 Athens, Greece
*
Author to whom correspondence should be addressed.
Appl. Sci. 2023, 13(2), 774; https://doi.org/10.3390/app13020774
Submission received: 15 December 2022 / Revised: 31 December 2022 / Accepted: 3 January 2023 / Published: 5 January 2023
(This article belongs to the Special Issue Titania Surface Modification: Theory, Methods, and Applications)

Abstract

:
The primary objective of this research is to propose and compile a specific protocol for photocatalytic measurements of modified TiO2 particles under visible-light irradiation. Nitrogen-modified titanium dioxide (N-TiO2) powder was synthesized by the sol–gel method and characterized by X-ray Diffraction Analysis (XRD), Field Emission Scanning Electron Microscopy (FESEM), Transmission Electron Microscopy (TEM), X-ray Photoelectron Spectroscopy (XPS), Raman Spectroscopy (micro-Raman), and Ultraviolet–visible Spectroscopy (UV-Vis). Photocatalytic tests were performed on a specially designed photocatalytic batch reactor to test the ability of the powder to degrade hazardous toxic compounds. Via the Taguchi method, nine experiments (L9) were compiled to examine the factors that affect the photocatalytic activity of the nano-sized powder. The N-TiO2 particles were characterized by the dominance of the crystalline anatase phase, exhibiting crystals in the nano-scale. The Taguchi method was designed to control four selected parameters (pollutant selection among azo dyes, amount of catalyst to pollutant, distance of the photocatalytic cell from the radiation source, and time protocol) with three levels/options each. Conclusions were drawn regarding the way each parameter affects the final degradation of the pollutant. The parameter that proved to affect the degradation of the pollutant to a greater extent was the choice of pollutant, followed by the amount of catalyst. The other two factors almost slightly affect the process, with a similar percentage. Taking into account the abovementioned results, a photocatalytic protocol for testing TiO2 nano-powder activity under visible light irradiation is proposed by using a batch, horizontal, rectangular, vis-LED equipped reactor with reflective walls.

Graphical Abstract

1. Introduction

Titanium dioxide (TiO2) is considered to be a widely used and safe material with various applications. It is a semiconductor widely and thoroughly studied by the scientific community regarding its catalytical, self-cleaning, and antibacterial properties [1,2,3]. It occurs in three different crystalline phases: rutile (tetragonal), anatase (tetragonal), and brookite (orthorhombic). The first two exhibit a higher catalytic effectiveness and stability, whereas brookite is a more unstable polymorph [4]. The crystalline phase, the size, and the shape of particles are the characteristics leading to TiO2 catalysts with different physical and chemical features [5]. The self-cleaning and antibacterial properties of TiO2 are a result of ultraviolet (UV) irradiation photoactivation, associated with its energy or band gap (Eg). To enhance these properties under visible light, a metal or non-metal element doping is applied [6,7,8].
The doped TiO2 nanoparticles have various environmental applications and are widely studied by the scientific community, using mainly organic pollutants such as Methylene Blue (MB), Rhodamine B (RhB), Acid Orange (AO7), Brilliant Green (BG), Reactive Red Dye (RRed Dye), etc. [9,10,11,12]. There has been extensive scientific research on how to degrade dyes and organic pollutants, proposing the synthesis of various catalysts [13,14]. These catalysts can be composite materials with metal nanoparticles and polymers. For example, hybrids with Gold (Au) nanoparticles (NPs) and polymer microgels are used as catalysts for dye reduction [15]; Cobalt (Co) NPs with organic polymers are used for water purification and removal of toxic dyes [16]; Silver (Ag) NPs with Poly(acrylic acid) hydrogel are reported to reduce Methyl Orange (MO) [17]; and S-doped graphite carbon nitride with Nikel (Ni)-doped Zinc Oxide (ZnO) degrades MB under UV and visible light [18]. However, the use of expensive metal NPs is not considered cost effective, especially when upscaling [13]. Moreover, metal NPs exhibit high toxicity and are not biocompatible or environmentally friendly [14]. Therefore, more eco-friendly choices are presented in the recent literature, such as the extraction of NPs from the plant Pulicaria Undulata combined with TiO2 for the degradation of MB and MO [19]. In some cases, metals are also combined with graphene to form composite materials for catalytic purposes. Graphene with organic or inorganic NPs has been broadly studied, showing a high catalytic activity and adsorption properties [20]. In fact, when doped with Nitrogen (N), it leads to defects in the catalyst and to the formation of more active sites for photocatalysis [21,22]. An investigation regarding azo dye photocatalysis by using the above-mentioned catalysts is relatively demanding, due to their intricacy and complicated physicochemical characteristics. Therefore, the widely studied, low cost, chemically and biologically inert TiO2 is chosen for the present study, being doped with Nitrogen [7,23].
The photocatalysis process is a complex one, with various features affecting the final photodegradation [24]. The nature of the pollutant used for the photocatalytic process, the catalyst’s amount used, the distance from the irradiation source, and the time protocol followed are some of these features. The present study focuses on examining those specific features affecting the catalytic behavior of doped TiO2, as these are commonly researched [25,26,27]. The need to investigate the matter more thoroughly arises from the different photocatalytic protocols followed in the literature, which often lead to contradictory results [23]. A useful tool for studying the above is the Taguchi method. The same method is found in the literature applied for optimizing the synthesis of TiO2 photocatalysts [28,29].
The Taguchi method is a statistical method developed by Genichi Taguchi. Initially, it was developed to improve the quality of goods produced (manufacturing process development), but later its application was extended to many other fields of engineering, such as biotechnology, etc. Professional statisticians recognized Taguchi’s contribution, especially to the development of designs for studying variation [30,31]. A complete factor design identifies all possible combinations for a given set of factors affecting a process, known as control and noise parameters. The Taguchi method involves identifying the appropriate control agents to achieve optimal process results. Orthogonal arrays (OAs) are used to perform a series of experiments, and are used as a procedure to study all the parameters with a smaller number of experiments. Since most industrial experiments involve a significant number of factors, a complete factorial design may involve a large number of experiments. The results of these experiments are used to analyze the data and predict the quality of the data produced. The whole method is of the philosophy “the larger the better” when evaluating the results. The investigative results are modified into signal-to-noise ratio values (S/N) using available statistical software [26,28,32]. In this study, the S/N ratio is equivalent to the final degradation efficiency.
In this work, presented chemically modified N-TiO2 nanoparticles were synthesized by the sol–gel process. Full characterization, utilizing several techniques such as X-ray Powder Diffraction (XRD), micro-Raman, X-ray Photoelectron Spectroscopy (XPS), Field Emission Scanning Electron Microscopy (FESEM), Transmission Electron Microscopy (TEM) and Ultraviolet–visible (UV-Vis) Spectroscopy, was executed to confirm that the particles are on the nano-scale, as well as exhibiting the desirable physicochemical properties and morphology. A Taguchi design experiment of four factors and three levels was composed to evaluate and optimize the N-doped TiO2 powder photocatalysis. All the photocatalytic results from the different Taguchi experiments were used to assess the factors mostly affecting the photocatalytic process, in order to finally propose a protocol for photocatalytic testing.

2. Materials and Methods

2.1. Preparation of N-Doped TiO2 Nanoparticles

The sol–gel method was utilized to synthesize the N-doped TiO2 powder. To form the TiO2 particles, 100 × 10−6 m3 of deionized water was acidified by using nitric acid (HNO3 65%, Penta, Prague, Czech Republic), so that the pH is adjusted acidic and hydrolysis can evolve. Respectively, 15 × 10−6 m3 of the precursor titanium butoxide alkoxide (titanium (IV) butoxide, C16H36O4Ti, 97%, Sigma-Aldrich, Darmstadt, Germany) was added under robust stirring. The produced solution was sub-white. An addition of 30 × 10−6 m3 2-propanol (C3H8O 99.8 %, Sigma-Aldrich, Darmstadt, Germany) followed after 5 h, resulting in a transparent sol–gel of Titania. Then, 30 × 10−3 kg of Urea (CH4N2O 99 %, Sigma-Aldrich, Darmstadt, Germany) was added in the sol–gel, under vigorous stirring. We then heated the solution to completely volatilize the solvents. The produced gel was calcinated at 450 °C for 4 h. To remove impurities, the produced powder was triturated, rinsed, and centrifuged. The result was a yellow-colored powder. All the synthesis procedure followed was in accordance with a previous study from our research group [33].

2.2. Characterization

After synthesis of the powder, the study of its structural properties followed. A number of techniques including XRD, micro-Raman, XPS, and UV-Vis Spectroscopy were applied. For the XRD analysis (D8 Advance, Bruker, Germany), the measurements were conducted at a 2-theta angle with a 20° to 80° range and a 0.01°/0.5sec scanning rate, employing Cu-Kα radiation (λ = 1.5418 Å) at a voltage of 30 kV and current of 15 mA. The confocal microscope Raman apparatus (inVia, Renishaw, Wotton-under-Edge, Gloucestershire, UK) used an excitation source of a high power near infrared (NIR) diode laser (λ = 785 nm). All measurements were conducted at room temperature in a backscattering configuration. The laser beam was focused onto the samples using a x20 short distance magnification lens, with low excitation power, in order to secure low laser heating of the powder. An internal Si reference was used to calibrate the frequency shifts. Three spots were measured for each sample for repeatability purposes. The exposure time was 30 s, with three accumulations, 0.1% power, and a range of 100–1500 cm−1. An analysis of the chemical states on the surface of the powder was assessed by X-ray Photoelectron Spectroscopy (Leybold SPECS, Pittsburgh, PA, USA). The photoemission experiments were executed in an ultra-high vacuum system (UHV) equipped with an X-ray gun for XPS measurements. Two analyzer pass energies of 15 eV and 40 eV and an unmonochromatized MgKα line at 1253.6 eV were used. All XPS core-level spectra were evaluated using a fitting routine, which can decompose each spectrum into individual mixed Gaussian–Lorentzian peaks after a Shirley background subtraction. The sample was in powder form and pressed into a pellet, the analyzed area was a spot of 7.0 mm diameter, and the measurements were recorded at room temperature. A UV-Vis spectrometer (U-3010, Hitachi, Tokyo, Japan) was used to measure the band gap of the powder. The apparatus is equipped with a 50 mm integrating sphere, to allow diffuse reflectance measurements. The surface and morphological characteristics of the powder were investigated by a Field Emission Scanning Electron Microscope (FESEM, JSM-7401F, JEOL, Tokyo, Japan) and a Transmission Electron Microscope (TEM, CM20, Philips, Amsterdam, The Netherlands).

2.3. Experimental Design

In this work, a standard Taguchi experimental procedure of an L9 orthogonal array of four factors and three levels was chosen to evaluate and optimize the N-doped TiO2 powder photocatalysis, in order to finally propose a protocol for photocatalytic testing on organic dyes. The factors selected for investigation were the photocatalyst-to-pollutant ratio (g/L), the type of the pollutant, the irradiation time (min), and the distance from the light source (cm). Table 1 presents the parameters tested in this study and their different levels. This procedure results in conducting only nine different experiments to investigate the photocatalytic procedure of N-doped TiO2 powder. The modified L9 orthogonal array is depicted in Table 2. Based on the Taguchi method, the optimization of the photocatalytic process was determined by comparing the mean of the mean values regarding the C/C0 photocatalytic degradation of the pollutant at the final time spot of irradiation in every experiment. In order to achieve this, Minitab 17 statistical software was used.

2.4. Photocatalytic Test

In order to determine the photocatalytic degradation of each pollutant of the experiments shown in Table 2, photocatalytic tests in cylindrical round-bottomed photocatalytic cells were performed. These cells have a diameter of 4.5 × 10⁻² m and a volume of 39.7 × 10⁻⁶ m3 and are made of quartz glass. For all the different pollutants used, their aqueous solutions were prepared. The initial absorbance of the pollutant is computed by the spectrophotometer UV-Vis (U-2001, Hitachi, Tokyo, Japan) and set to 7 × 10⁻⁶ M (Ainitial), in pH = 6.
The experimental procedure starts with the oxygenation of the pollutant by purging it with ultrapure O2 gas in a dark bubbler container for 1 h. A sufficient amount of N-doped TiO2 powder and pollutant are then placed in the cells so that the photocatalyst per pollutant load (g/L) of every test is met. Prior to the irradiation test, the powders dispersed in the pollutant solution are kept in the dark, so that there are no absorption phenomena altering the photocatalytic results. The cells are then placed in a photoreactor (0.5 m × 0.4 m × 0.3 m dimensions) with reflective walls (lCutoff = 320 nm), equipped with white light LED tape of 6 W/m, 870 lm/m, and 12 V on top. All photocatalytic tests are conducted under visible light irradiation and continuous stirring (300 rpm). To measure the absorption of every pollutant at a specific time, the shift and intensity of the maximum of the absorption curve is monitored using the spectrophotometer.
In the photocatalytic tests of 100 min total duration, a quantity of the pollutant was selected every 10 minutes to measure its concentration with the aid of the spectrophotometer. In the 150 min total duration tests, a similar process was followed every 30 min, while in the case of the 200 min total duration tests, the process was followed every 20 min. The ratio of the measured absorption each time (A) to the initial (Ainitial) one corresponds to the ratio of C/C0 pollutant concentrations. The cuvettes used for measuring the absorption were made of quartz.

3. Results and Discussion

3.1. Characterization of the N-TiO2 Powder

3.1.1. XRD Analysis

An XRD analysis was conducted to investigate the crystallinity of the N-doped TiO2 powder produced. Figure 1 presents the diffraction diagram recorded for the N-TiO2 powder. The TiO2 crystal phase of anatase is the dominant one, while the rutile phase is the second one existing. The highest intensity diffraction peak of anatase (IA) is at 2θ = 25.35° corresponding to (1 0 1) crystal plain, with all the other peaks of anatase present being in accordance with the PDF No 03-065-5714. These results are supported by the relevant literature [34,35]. Rutile is observed on its highest intensity (IR) at 2θ = 27.30°, corresponding to (1 1 0) crystal plain [34,35]. The percentage of the rutile face in the powder is calculated by the following equation [36]:
% Rutile = ( 1 1 + 0 . 884 I A ( 101 ) I R ( 110 ) )   ×   100
The percentage of rutile in the N-TiO2 powder produced is 37.9%. This percentage is within accepted limits regarding the values found in the literature [37,38]. In fact, the higher the percentage of rutile, the higher the photocatalytic performance in N-doped powder [39]. The presence of rutile in N-doped TiO2 could be associated with the calcination temperature (450 °C) followed in the experimental procedure [37,40].
The average crystallite size of the as-produced powder was calculated by using Scherrer’s equation.
d = 0 . 89   λ β cos θ
where d is the average crystalline size, 0.89 is the Scherrer’s constant, λ is the X-ray wavelength, θ is the diffraction angle, and β is the FWHM (full-width-half-maximum). This is calculated for the main peak of anatase (1 0 1) at 2 = 25.35 [41]. The average crystallite size of the powder is on the nano-scale, estimated at ~14 nm.

3.1.2. Raman Analysis

Figure 2 illustrates a representative Raman spectrum of the as-prepared powder.
The peaks observed corresponding to the Raman fundamental modes of pure anatase crystal phase are located at 142 (Eg1), 196 (Eg2), 396 (B1g), 516 (A1g), and 638 (Eg3) cm−1, while other peaks located at 142 (B1g), 448 (Eg), and 608 (A1g) cm−1, are characteristic of the rutile phase. A small blue-shift compared to pure TiO2 anatase (142 (Eg1), 196 (Eg2), 398 (B1g), 517 (A1g), and 638 (Eg3) cm−1) is observed at some of the recorded peaks [42,43]. This is due to the presence of the N dopant and the doping effect, which leads to an alteration of the TiO2 lattice. Shifts are generally a result of changes in crystallinity or grain size, presence of defects, or changes of surface oxygen deficiencies [42,44]. No other crystalline form of TiO2 was detected. These findings are in agreement with the XRD results of this study, as well as with the relevant literature for Raman analysis of anatase and rutile TiO2 [42,45].

3.1.3. XPS Analysis

An examination of the chemical state of the elements that are present on the surface of the N-TiO2 synthesized powder was conducted via XPS analysis. The results are presented in Figure 3.
Figure 3a displays the wide spectrum survey of N-TiO2, where all the peaks that correspond to the chemical synthesis followed, i.e., the Ti2p (Ti4+ in TiO2 chemical state, Figure 3b in high resolution with binding energy of Ti2p3/2 at 458.8 ± 0.1 eV), deconvoluted O1s (lattice oxygen Ti-O in TiO2 state with binding energy 530.0 ± 0.1 eV and hydroxides and/or adsorbed water on the surface with binding energy 531.7 ± 0.1 eV, Figure 3c), and C1s (hydrocarbon state) are ascertained, which is in compliance with the corresponding relative publications [33,46]. The N1s element, assigned to N-Ti bonds, is presented in high resolution in Figure 3d and pinpointed at ~ 400 ± 0.1 eV [47]. The surface atomic concentration of N1s peak is 0.3 ± 0.1%, whereas that of the Ti2p peak is 20.8 ± 0.1%.

3.1.4. UV-Vis Spectrophotometry Analysis

The Eg of the nano-powder was estimated via a UV-Vis spectrophotometry analysis. Firstly, the reflectance of the N-TiO2 powder is measured in Kubelka–Munk (K-M) units, based on the equation:
F ( R ) = ( 1   R ) 2 2 R  
where R is the reflectance. This method is usually applied when the samples measured exhibit high absorbance or light scattering [48,49,50,51]. Figure 4 illustrates the change in the reflectance of the powder within the visible light spectrum.
In order to calculate a semiconductor’s Eg, Tauc’s equation is used:
ahv = A ( hv   E g ) n
where Eg is the energy band gap, a is the absorption coefficient, A is a constant, and n = 1/2 for direct and n = 2 for indirect transition band gaps [52]. Consequently, the band gap energy is obtained by applying the K-M method and extrapolating the linear region of the spectra ( F ( R ) hv ) 1 2 vs. hv, as presented in Figure 5.
The measured band gap of the produced N-TiO2 nano-powder revealed that there is a decrease of Eg compared to pure anatase, due to doping with N. This may be related to a better photocatalytic activity under visible light irradiation, since the catalyst needs lower energy in order to be activated. These findings are in close agreement with similar studies, with the observed red shift of Eg attributed to a combination of both substitutional and interstitial doping of N [7].

3.1.5. FESEM and TEM Analysis

The morphology of the produced N-TiO2 powder was examined by FESEM, with the images shown in Figure 6.
A micro-structural morphology of the powder is revealed in FESEM images (Figure 6) with particles exhibiting a spherical shape with a mean size ~14 nm (Figure 6b). To further examine the morphology of the synthesized particles, as well as the distribution of their grain size, a TEM analysis was conducted, with the images presented in Figure 7.
The grain size of the particles appears to range between 5–15 nm. These particles have a spherical shape and various orientations. The particles with the darker color are the ones that, due to their orientation, create this shade effect when electrons hit their surface. The above results are consistent with the XRD data regarding the average crystallite size and the FESEM results for the grain size.

3.2. Photocatalytic Results

The photocatalytic behavior of the as-produced N-TiO2 powder was assessed by testing the photocatalytic degradation of solutions of different pollutants, under different parameters (see Table 1). All the photocatalytic tests were conducted at room temperature and pH = 6. The results are illustrated based on the pollutant used, with Figure 8, Figure 9 and Figure 10 corresponding to Rhodamine B, Methylene Blue, and Brilliant Green, respectively. In every figure, the photolysis of the pollutant is also included.
It is observed that Rhodamine B is a pollutant with high resistance to the catalyst, as its final degradation value reaches only 50% for 200 min irradiation. Even at 10 g/L, a catalyst load that is considered high, the degradation curve is similar to the one for the 1 g/L load. The stability of Rhodamine B is also evident in photolysis (no use of catalyst), as for 150 min of irradiation in visible light, the degradation is up to 10%. The other pollutants, Brilliant Green and Methylene Blue, as shown in Figure 9 and Figure 10, respectively, both approach a degradation of ~35% for a total time duration of 150 min.
Regarding the Methylene Blue pollutant, which is widely used in photocatalytic tests, the results in Figure 9 prove that it is an unstable pollutant that degrades very easily, even in a small load of catalyst. Therefore, this makes it ineligible for photocatalytic tests and investigation of catalyst activity. The instability of Methylene Blue becomes apparent by its photolysis (no use of a catalyst), where there is a degradation of 35% for 150 min irradiation, a percentage almost equal to when a load of 0.1 g catalyst/L pollutant is tested. Furthermore, it is observed that in both 1 g/L and 10 g/L loads of catalyst, the degradation reaches ~80% at 200 min and 150 min of irradiation, respectively, followed by an almost visual complete discoloration of the pollutant.
Brilliant Green is also an unstable pollutant and ineligible for photocatalysis, as it is observed in Figure 10 due to the phenomenon of photolysis up to 40% at 150 min of irradiation. In addition, in the presence of a catalyst of 0.1 g/L of pollutant (a relatively small amount), it decomposes to a greater extent, reaching a 60% degradation at 200 min. Another noteworthy observation regarding Brilliant Green is that in the case of a catalyst to a pollutant load of 10 g/L at 10 cm distance of the sample from the radiation source, there is an immediate 70% degradation of the pollutant in the first 10 min. At 50 min, it is 80% and then it plateaus, which occurs due to the absorption of the dye from the catalyst.
The preliminary conclusions from these graphs are that, first of all, the chosen pollutant is one of the main factors influencing photocatalytic degradation. Rhodamine B is much more resistant to the catalyst, i.e., it degrades to a lower scale than the other two organic dyes, Brilliant Green and Methylene Blue. This indicates a stability that makes it suitable to be the main pollutant in photocatalytic tests. As for the load of catalyst to pollutant, it was observed that as the amount of catalyst increases, the degradation of the pollutant increases. However, in some cases it is observed that in the case of 1 g/L catalyst per pollutant load, a degradation is reached that is relatively similar to that of 10 g/L, after a period of time. Therefore, the choice of 10 g/L is considered economically unprofitable. It is noteworthy that the value of 0.1 g/L, although actually considered a very small amount compared to the other two loads, appears to degrade pollutants satisfactorily in the cases of Rhodamine B and Brilliant Green. For the irradiation time and the time protocols chosen, no clear conclusions can be drawn except that at 150 min total irradiation with a measuring gap of 30 min, there is a smoother degradation curve with fewer fluctuations and errors in all used pollutants. Therefore, the effect of this parameter and that of the cell distance from the reactor lamps will be individually extracted from the application of the Taguchi method.
To further examine these results, the photocatalysis kinetics were extracted according to:
ln Co C = k app t     ln C C ο = k app t  
Figure 11 presents the photocatalytic kinetics of the experiments for the three different pollutants. Almost all nine experiments show moderate-to-satisfactory adaptation to pseudo-first-order kinetics. According to the Langmuir–Hinshelwood model, this is the type of kinetics that azo dyes usually follow when photodegraded [53].
When a kinetics model is studied, the R2 value is used to ensure a good fitting of the model to the data. R2 can vary between 0 and 1, with the data having a better fit the closer R2 is to 1. Models that have an R2 > 0.9 are generally considered to be good in adaptation [54,55]. Thus, the only experiment not presenting a very good fit compared to the others is that of Brilliant Green, with a load of 10 g/L at a 10 cm distance from the radiation source, with R2 = 0.86439. On the other hand, the best fit is on the experiment using Rhodamine B, with a load of 1 g/L at a distance of 15 cm from the radiation source, with k = 0.00593 and R2 = 0.97383. In general, it is observed that Rhodamine B shows a better adaptation to linearity compared to the other two pollutants. In all cases of pollutants, it is concluded that at 10 g/L, the reaction rate constant, k, is higher than that of 0.1 and 1 g/L. When using Brilliant Green, the reaction rate constant at 10 g/L is 3.5 times higher compared to the corresponding value at 0.1 g/L, 2.7 times higher in the case of Methylene Blue, and only 2 times higher for Rhodamine B.

3.3. Taguchi Methods Results

The statistical processing of the results with the Taguchi method can quantify the effect of each variable on the parameter under consideration. This is achieved by applying the technique of Analysis of Variance (ANOVA). More precisely, “One-Way Analysis of Variance” (or One-Factor Analysis of Variance, or ANOVA-One for short) is applied. In this study, One-Factor Variance Analysis is chosen, because the experimental data are distinguished by only one characteristic: the achieved rate of degradation. Table 3 summarizes the (%) effect of each parameter (factor) on the photocatalysis process.
It is observed that the choice of pollutant plays the most important role in the photocatalytic tests, since it affects photocatalysis at a rate of 52.21%. Therefore, to investigate the catalyst’s action in photocatalysis, it is necessary to choose the proper type of pollutant, which will be stable and not degrade easily. The amount of catalyst used, while expected to be the main affecting factor, comes in second, by approximately 30%. The other two factors, cell distance from the radiation source and total radiation time, are almost at the same effect levels of approximately 10%.
From the Minitab software, graphs which actively illustrate the qualitative effect of the variables and their levels on the measured parameter are also extracted. Figure 12 shows the level of each variable and to which photocatalytic degradation (C/C0) they lead.
The Taguchi method is a solidly built experimental design that aims to derive the best combination set of factors/levels together with the lowest economical solution, in order to satisfy a product’s quality specifications [56]. It is applied in the catalysis field for optimizing the synthesis of NPs and TiO2. Most of these studies investigate 3–5 different factors with 3–4 levels each, which is in correspondence with this study. For example, TiO2 NPs synthesis is optimized by researching the factors that lead to a low crystallite size [28] and the ZnO-TiO2 composite catalyst is optimized taking into account its photocatalytic activity in MB under visible light irradiation for 120 min duration and 30 min time interval [57]. Similar studies are found on other NPs, including optimizing the synthesis of ZnO doped with various metals (Al, Fe, Cr) regarding the photocatalytic degradation on MB under visible light [58]. The present study takes the application of the Taguchi methods to the next level, investigating the photocatalytic process on N-TiO2 NPs.
When evaluating the statistical results of a Taguchi experiment, there is a philosophy of “the larger the better”, “the smaller the better”, or “the on-target, minimum-variation” [30]. In this study, it is preferable to choose the level that leads to higher C/C0 for all the factors, ensuring that the choice is simultaneously low cost. It should also be noted that the inclination of each graph indicates the degree of influence of each variable on the final degradation. The higher the inclination of the graph, the greater the influence of the variable. Taking into account the abovementioned, a photocatalytic protocol is proposed for testing the degradation of azo dyes in the presence of N-TiO2 nanoparticles under visible light irradiation.
For Factor A, the ratio of photocatalyst to pollutant load (g/L), it is revealed that as the amount of catalyst increases, so does the degradation of the pollutant. The 10 g/L choice results in the highest degradation of the pollutant, though this is not considered to be an economical choice. Therefore, the amount of 1 g/L is preferable and proposed for the protocol, as it exhibits a similar final degradation. It is obvious that the third level of 0.1 g/L leads to a low degradation of the pollutant, sometimes equivalent to photolysis results.
Regarding Factor B, pollutant, the intrinsic effect of each pollutant should be investigated in order to choose. As the photocatalysis results showed, BG and MB exhibit a high percentage of photolysis. Consequently, their final results of C/C0 degradation are fictitious. It is clear that Rhodamine B is more stable, has a lower photo-sensitivity, and exhibits a better fitting to the pseudo-first-order kinetics model among the three tested pollutants. The choice of Rhodamine B will ensure that the results of the photocatalysis are connected as much as possible with the effect of the catalyst itself.
For Factor C, distance from the irradiation source, while a higher degradation would be expected at 5 cm distance, the exact opposite is observed. At 5 cm, the lowest degradation is recorded. This is probably due to the lack of light reflecting on the walls of the reactor and reaching back to the cell, resulting in enhanced radiation. At 10 cm, the degradation is slightly greater than that achieved at 15 cm distance from the light source, so the level of 10 cm is chosen for the proposed protocol.
Finally, Factor D, irradiation time, affects the process as expected. That is, the more time the pollutant is irradiated, the more the degradation proceeds. The chosen level for the protocol is that of 150/30 min, as the choice of 200/20 min is not cost beneficial.
The proposed protocol of photocatalytic tests regarding the degradation of azo dyes in the presence of N-TiO2 nanoparticles under visible light irradiation is summarized in Table 4. The protocol applies to a batch, horizontal, rectangular, vis-LED equipped reactor with reflective walls. The main contribution of the Taguchi method lies in the economic benefit it offers, as proved in this study where 9 experiments provided the optimized parameters of photocatalysis, whereas all possible combinations of parameters and levels would require the realization of 34 = 81 experiments in total.
Similar studies adopting the Taguchi method can be found in the literature for photocatalysis under UV irradiation, with a design of 4–5 factors with 3–4 different levels, as well. These studies focus mainly on ZnO-composite NPs, for degrading Lidocaine HCl [59] and reducing Cr(VI) [60]. In the case of Lidocaine HCl, photocatalysis of CuO/ZnO NPs was studied and the four factors were the irradiation time, pH, catalyst load, and concentration of drug and dosage of H2O2 (for promoting photocatalytic degradation). The findings showed a pH of 6–8, 360 min of irradiation, 0.48 g/l catalyst load, 20–30 mg/L Lidocaine HCl, and 7 mM H2O2 are the optimum conditions. Regarding the reduction of Cr (VI), ZnO/Todorokite nanocatalyst was synthesized and the catalysis process was optimized, analyzing the pH, Cr concentration, catalyst load, and irradiation. The optimum results were 100 mg/l catalyst load, pH 2, 7.63 W/m2 irradiation intensity, and 15 ppm Cr concentration. Studies on visible light irradiation are only found for composite materials with TiO2 on pollutants not commonly used. For instance, CoFe2O4-TiO2 (p-n catalyst) was used for optimizing the Malachite Green degradation process, using a Taguchi experiment of four factors and five levels. The tested parameters were the catalyst load, the irradiation time, the pH, and the stirring speed, and the optimum results were 0.1 g/l catalyst load, 10 min irradiation time, pH 7, and 300 rpm stirring speed [61]. Fe2O3/TiO2/clinoptilolite catalyst was tested on optimizing Acid Black 172 dye, on a 4-factor and 3-level Taguchi experiment. The pH, the catalyst load, the dye concentration, and the irradiation time were investigated, resulting in the optimum conditions of pH 2, 1 g/l load, 60 min irradiation time, and 50 mg/l dye concentration [62]. Our research contributes to the photocatalytic process investigation because the choice of pollutant is one factor that has not been tested until now. The same applies to the distance from the irradiation source, as only the irradiation intensity was previously tested. The irradiation time and the catalyst load parameters are of great significance in a photocatalytic process, so they were also included in the Taguchi experiment of N-TiO2. The findings of this study are close to the findings of the abovementioned literature [59,60,61,62]. The pH was not studied, as it has been widely studied before, and was fixed at 6, which is adjacent to the result from most of the relevant publications.
In this study, the chosen set of variables does not correspond to any of the experiments performed. Therefore, the degradation of the pollutant when following the proposed photocatalytic protocol is presented in Figure 13.
It is evident that after 150 min of visible light irradiation, Rhodamine B degrades up to 60%. Therefore, the photocatalytic activity of the N-doped TiO2 catalyst is profound and the protocol is suitable for testing various photocatalysts. The photocatalytic kinetics of the experiment shows satisfactory adaptation to pseudo-first-order kinetics, with k = 0.00637 and R2 = 0.98285.

4. Conclusions

In this study, a photocatalytic protocol testing TiO2 nano-powder activity under visible light irradiation is proposed by using a batch, horizontal, rectangular, vis-LED equipped reactor with reflective walls. For this, N-doped TiO2 powder was synthesized, fully characterized by XRD, micro-Raman, XPS, FESEM, TEM, and UV-Vis, and its photocatalytic behavior was studied. The results showed the powder consists mainly of crystalline anatase phase (62.1%) with the presence of a smaller percentage of rutile (37.9%). The mean nanocrystalline size is ~14 nm and the powder is morphologically homogeneous, with a particle size ranging between 5–15 nm. Furthermore, the presence of the N dopant is verified and there was a significant reduction in the energy gap from 3.2 eV to 2.7 eV, which allows the catalyst to be active in visible light.
The chosen basic factors affecting photocatalysis were examined in order to create an optimal protocol of photocatalytic testing. Nine experiments (L9) were conducted by applying the Taguchi statistical method, for the control of four factors (pollutant, photocatalyst/pollutant load (g/L), distance from the irradiation source (cm), irradiation time (total min/measuring gap time)), with three levels (options) each.
The results revealed that the type of pollutant is the most important factor affecting photocatalysis. Among the three pollutants studied, Rhodamine B shows the greatest stability under visible light irradiation, focusing on the intrinsic catalytic performance excluding the dye-sensitized phenomena. Regarding the amount of catalyst, that is the second factor mostly affecting the photocatalytic process; 1 g catalyst per L pollutant was the most preferable for photocatalytic testing, taking into account the cost effect apart from the highest degradation rate. For the distance of the cell from the radiation source, affecting the photocatalysis by 11%, a 10 cm distance is preferred. For the irradiation time, 150 min total time with absorbance testing every 30 min was chosen. Radiation time affects the final degradation by only 8%.
The proposed photocatalytic protocol led to the nano-sized N-TiO2 catalyst degrading the RhB pollutant at 60% after 150 min of visible light irradiation.

Author Contributions

Conceptualization, M.-E.K. and E.A.P.; methodology, M.-E.K.; software, M.-E.K.; validation, M.-E.K. and E.A.P.; formal analysis, M.-E.K. and Z.N.; investigation, Z.N.; resources, E.A.P.; data curation, M.-E.K.; writing—original draft preparation, M.-E.K.; writing—review and editing, E.A.P.; visualization, M.-E.K.; supervision, E.A.P.; project administration, E.A.P. All authors have read and agreed to the published version of the manuscript.

Funding

This research received no external funding.

Institutional Review Board Statement

Not applicable.

Informed Consent Statement

Not applicable.

Data Availability Statement

Not applicable.

Acknowledgments

For the XPS measurements, the authors would like to acknowledge Labrini Sygellou from Surface Science Laboratory, Foundation of Research and Technology Hellas, Institute of Chemical Engineering and High Temperature Chemical Processes (FORTH/ICE-HT). The authors would also like to acknowledge Elias Sakellis and Nikolaos Boukos from the Institute of Nanoscience and Nanotechnology, National Center for Scientific Research “Demokritos”, Agia Paraskevi, Greece, for the TEM analysis. Maria-Emmanouela Kassalia would like to acknowledge Research Committee of N.T.U.A. for supporting her with a doctoral scholarship during the realization of this research.

Conflicts of Interest

The authors declare no conflict of interest.

References

  1. Aziz, A.A.; Khatun, F.; Monir, M.U.; Ching, S.L. Photocatalyst. In Titanium Dioxide—Advances and Applications; IntechOpen: London, UK, 2021; pp. 1–16. [Google Scholar]
  2. Wold, A. Photocatalytic Properties of TiO2. Chem. Mater. 1993, 5, 280–283. [Google Scholar] [CrossRef]
  3. Hoffmann, M.R.; Martin, S.; Choi, W.; Bahnemann, D.W. Environmental Applications of Semiconductor Photocatalysis. Chem. Rev. 1995, 95, 69–96. [Google Scholar] [CrossRef]
  4. Tang, H.; Prasad, K.; Sanjines, R.; Schmid, P.; Levy, F. Electrical and optical properties of TiO2 anatase thin films. J. Appl. Phys. 1994, 75, 2042–2047. [Google Scholar] [CrossRef]
  5. Bavykin, D.; Friedrich, J.; Walsh, F. Protonated Titanates and TiO2 Nanostructured Materials: Synthesis. Properties and Applications. Adv. Materials. 2006, 18, 2807–2824. [Google Scholar] [CrossRef]
  6. Hashimoto, K.; Irie, H.; Fujishima, A. TiO2 Photocatalysis: A Historical Overview and Future Prospects. Jpn. J. Appl. Phys. 2005, 44, 8269–8285. [Google Scholar] [CrossRef]
  7. Ansari, S.A.; Khan, M.; Ansari, M.; Cho, M.H. Nitrogen-doped titanium dioxide (N-doped TiO2) for visible light photocatalysis. N. J. Chem. 2016, 40, 3000–3009. [Google Scholar] [CrossRef]
  8. Al-Mamun, M.; Kader, S.; Islam, M.; Khan, M. Photocatalytic activity improvement and application of UV-TiO2 photocatalysis in textile wastewater treatment: A review. J. Environ. Chem. Eng. 2019, 7, 103248. [Google Scholar] [CrossRef]
  9. Pelaez, M.; Nolan, N.; Pillai, S.; Seery, M.; Falaras, P.; Kontos, A.; Dunlop, P.; Hamilton, J.; Byrne, J.; O’Shea, K. Review: A review on the visible light active titanium dioxide photocatalysts for environmental applications. Appl. Catal. B Environ. 2012, 125, 331–349. [Google Scholar] [CrossRef] [Green Version]
  10. Khaki, M.; Shafeeyan, M.; Raman, A.; Daud, W. Application of doped photocatalysts for organic pollutant degradation—A review. J. Environ. Manag. 2017, 198, 78–94. [Google Scholar] [CrossRef]
  11. Munusamy, S.; Aparna, R.S.L.; Prasad, R.G.S.V. Photocatalytic effect of TiO2 and the effect of dopants on degradation of brilliant green. Sustain. Chem. Process. 2013, 1, 4. [Google Scholar] [CrossRef]
  12. Kaur, S.; Singh, V. Visible light induced sonophotocatalytic degradation of Reactive Red dye 198 using dye sensitized TiO2. Ultrason. Sonochem. 2007, 14, 531–537. [Google Scholar] [CrossRef] [PubMed]
  13. Begum, R.; Najeeb, J.; Sattar, A.; Naseem, K.; Irfan, A.; Al-Sehemi, A.; Farooqi, Z.H. Chemical reduction of methylene blue in the presence of nanocatalysts: A critical review. Rev. Chem. Eng 2019, 36, 749–770. [Google Scholar] [CrossRef]
  14. Naseem, K.; Farooqi, Z.; Begum, R.; Irfan, A. Removal of Congo red dye from aqueous medium by its catalytic reduction using sodium borohydride in the presence of various inorganic nano-catalysts: A review. J. Clean. Prod. 2018, 187, 296–307. [Google Scholar] [CrossRef]
  15. Arif, M.; Farooqi, Z.; Irfan, A.; Begum, R. Gold nanoparticles and polymer microgels: Last five years of their happy and successful marriage. J. Mol. Liq. 2021, 336, 116270. [Google Scholar] [CrossRef]
  16. Arif, M. Complete life of cobalt nanoparticles loaded into cross-linked organic polymers: A review. RSC Adv. 2022, 12, 15447–15460. [Google Scholar] [CrossRef] [PubMed]
  17. Ajmal, M.; Anwar, S.; Naeem, H.; Zia, M.; Siddiq, M. Poly(acrylic acid) hydrogel microparticles fabricated with silver nanoparticles: Synthesis, characterization, and catalytic applications. Polym. Eng. Sci. 2020, 60, 2918–2929. [Google Scholar] [CrossRef]
  18. Javed, M.; Abid, M.; Hussain, S.; Shahwar, D.; Arshad, S.; Ahmad, N.; Arif, M.; Khan, H.; Nadeem, S.; Raza, H.; et al. Synthesis, characterization and photocatalytic applications of s-doped graphitic carbon nitride nanocomposites with nickel doped zinc oxide nanoparticles. Dig. J. Nanomater. Biostruct. 2020, 15, 1097–1105. [Google Scholar]
  19. Al-hamoud, K.; Shaik, M.; Khan, M.; Alkhathlan, H.Z.; Adil, S.; Kuniyil, M.; Assal, M.; Al-Warthan, A.; Siddiqui, M.H.; Tahir, M.; et al. Pulicaria undulata Extract-Mediated Eco-Friendly Preparation of TiO2 Nanoparticles for Photocatalytic Degradation of Methylene Blue and Methyl Orange. ACS Omega 2022, 7, 4812–4820. [Google Scholar] [CrossRef]
  20. Adil, S.F.; Ashraf, M.; Khan, M.; Assal, M.; Shaik, M.; Kuniyil, M.; Al-Warthan, A.; Siddiqui, M.H.; Tremel, W.; Tahir, M.N. Advances in Graphene/Inorganic Nanoparticle Composites for Catalytic Applications. Review. Chem. Rec. 2022, 22, e202100274. [Google Scholar] [CrossRef]
  21. Kuniyil, M.; Kumar, J.; Adil, S.; Shaik, M.; Khan, M.; Assal, M.; Siddiqui, M.; Al-Warthan, A. One-Pot Synthesized Pd@N-Doped Graphene: An Efficient Catalyst for Suzuki–Miyaura Couplings. Catalysts 2019, 9, 469. [Google Scholar] [CrossRef] [Green Version]
  22. Khan, M.; Adil, S.; Assal, M.; Alharthi, A.; Shaik, M.; Kuniyil, M.; Al-Warthan, A.; Khan, A.; Nawaz, Z.; Shaikh, H.; et al. Solventless Mechanochemical Fabrication of ZnO–MnCO3/N-Doped Graphene Nanocomposite: Efficacious and Recoverable Catalyst for Selective Aerobic Dehydrogenation of Alcohols under Alkali-Free Conditions. Catalysts 2021, 11, 760. [Google Scholar] [CrossRef]
  23. Natarajan, T.S.; Mozhiara, V.; Tayade, R.J. Review: Nitrogen Doped Titanium Dioxide (N-TiO2): Synopsis of Synthesis Methodologies, Doping Mechanisms, Property Evaluation and Visible Light Photocatalytic Applications. Photochem 2021, 1, 371–410. [Google Scholar] [CrossRef]
  24. Kumar, A.; Pandey, G.A. Review on the Factors Affecting the Photocatalytic Degradation of Hazardous Materials. Mater. Sci. Eng. Int. J. 2017, 1, 106–114. [Google Scholar] [CrossRef] [Green Version]
  25. Oliveira, G.H.; Galante, M.; Martins, T.; Santos, L.; Ely, F.; Longo, C.; Gonçalves, R.; Muniz, S.; Nome, R.A. Real time single TiO2 nanoparticle monitoring of the photodegradation of methylene blue. Sol. Energy 2019, 190, 239–245. [Google Scholar] [CrossRef]
  26. Pouretedal, H.R.; Fallahgar, M.; Pourhasan, F.; Nasiri, M. Taguchi optimization of photodegradation of yellow water of trinitrotoluene production catalyzed by nanoparticles TiO2/N under visible light. Iran. J. Catal. 2017, 7, 317–326. [Google Scholar]
  27. Casado, C.; Timmers, R.; Sergejevs, A.; Clarke, C.; Allsopp, D.; Bowen, C.; van Grieken, R.; Marugán, J. Design and validation of a LED-based high intensity photocatalytic reactor for quantifying activity measurements. Chem. Eng. J. 2017, 327, 1043–1055. [Google Scholar] [CrossRef]
  28. Naghibi, S.; Sani, M.F.; Hosseini, H.R.M. Application of the statistical Taguchi method to optimize TiO2 nanoparticles synthesis by the hydrothermal assisted sol–gel technique. Ceram. Int. 2014, 40, 4193–4201. [Google Scholar] [CrossRef]
  29. Kuo, Y.-L.; Su, T.-L.; Kung, F.-C.; Wu, T.-J. A study of parameter setting and characterization of visible-light driven nitrogen-modified commercial TiO2 photocatalysts. J. Hazard. Mater. 2011, 190, 938–944. [Google Scholar] [CrossRef]
  30. Karna, S.K.; Sahai, R. An Overview on Taguchi Method. Int. J. Eng. Math. Sci. 2012, 1, 11–18. [Google Scholar]
  31. Montgomery, D.C. Design and Analysis of Experiments; John Wiley & Sons: Hoboken, NJ, USA, 2017. [Google Scholar]
  32. Krishnaiah, K.; Shahabudeen, P. Applied design of experiments and Taguchi methods; PHI Learning Private Limited: New Delhi, India, 2012. [Google Scholar]
  33. Galata, E.; Georgakopoulou, E.; Kassalia, M.-E.; Papadopoulou-Fermeli, N.; Pavlatou, E.A. Development of Smart Composites Based on Doped-TiO2 Nanoparticles with Visible Light Anticancer Properties. Materials 2019, 12, 2589. [Google Scholar] [CrossRef] [Green Version]
  34. Thamaphat, K.; Limsuwan, P.; Ngotawornchai, B. Phase Characterization of TiO2 Powder by XRD and TEM. Nat. Sci. 2008, 42, 357–361. [Google Scholar]
  35. Tayade, R.J.; Surolia, P.; Kulkarni, R.; Jasra, R.V. Photocatalytic degradation of dyes and organic contaminants in water using nanocrystalline anatase and rutile TiO2. Sci. Technol. Adv. Mater. 2007, 8, 455–462. [Google Scholar] [CrossRef] [Green Version]
  36. Zhang, H.; Banfield, J.F. Understanding Polymorphic Phase Transformation Behavior during Growth of Nanocrystalline Aggregates: Insights from TiO2. J. Phys. Chem. B 2000, 104, 3481–3487. [Google Scholar] [CrossRef]
  37. Hanaor, D.; Sorrell, C. Review of the anatase to rutile phase transformation. J. Mater. Sci. 2011, 46, 855–874. [Google Scholar] [CrossRef]
  38. Bacsa, R.R.; Kiwi, J. Effect of rutile phase on the photocatalytic properties of nanocrystalline titania during the degradation ofp-coumaric acid. Appl. Catal. B Environ. 1998, 16, 19–29. [Google Scholar] [CrossRef]
  39. Liu, G.; Wanga, X.; Chen, Z.; Cheng, H.-M.; Lu, G.Q. The role of crystal phase in determining photocatalytic activity of nitrogen doped TiO2. J. Colloid Interface Sci. 2009, 329, 331–338. [Google Scholar] [CrossRef]
  40. Wang, W.-K.; Chen, J.-J.; Zhang, X.; Huang, Y.-X.; Li, W.-W.; Yu, H.-Q. Self-induced synthesis of phase-junction TiO2 with a tailored rutile to anatase ratio below phase transition temperature. Nat. Sci. Rep. 2016, 6, 20491. [Google Scholar] [CrossRef] [Green Version]
  41. Patterson, L.A. The Scherrer Formula for I-Ray Particle Size Determination. Phys. Rev. 1939, 56, 978–982. [Google Scholar] [CrossRef]
  42. Cheng, X.; Yu, X.; Xing, Z.; Yang, L. Synthesis and characterization of N-doped TiO2 and its enhanced visible-light photocatalytic activity. Arab. J. Chem. 2016, 9, S1706–S1711. [Google Scholar] [CrossRef]
  43. Tuschel, D. Raman Spectroscopy and Polymorphism. Spectroscopy 2019, 34, 10–21. [Google Scholar]
  44. Zhang, W.F.; He, Y.; Zhang, M.; Yin, Z.; Chen, Q. Raman scattering study on anatase TiO2. J. Phys. D Appl. Phys. 2000, 33, 912–916. [Google Scholar] [CrossRef]
  45. Ohsaka, T.; Izumi, F.; Fujiki, Y. Raman Spectrum of Anatase, TiO2. J. Raman Spectrosc. 1978, 7, 321–324. [Google Scholar] [CrossRef]
  46. Zaky, A.A.; Christopoulos, E.; Gkini, K.; Arfanis, M.; Sygellou, L.; Kaltzoglou, A.; Stergiou, A.; Tagmatarchis, N.; Balis, N.; Falaras, P. Enhancing efficiency and decreasing photocatalytic degradation of perovskite solar cells using a hydrophobic copper-modified titania electron transport layer. Appl. Catal. B Environ. 2021, 284, 119714. [Google Scholar] [CrossRef]
  47. Batalovic, K.; Bundaleski, N.; Radakovic, J.; Abazovic, N.; Mitric, M.; Silva, R.; Savic, M.; Belosevic, J.; Rakocevic, Z.; Rangel, C.M. Modification of N-doped TiO2 photocatalysts using noble metals (Pt, Pd)—A combined XPS and DFT study. Phys. Chem. Chem. Phys. 2017, 19, 7062–7071. [Google Scholar] [CrossRef] [PubMed]
  48. Myrick, M.L.; Simcock, M.; Baranowski, M.; Brooke, H.; Morgan, S.; McCutcheon, J.N. The Kubelka-Munk Diffuse Reflectance Formula Revisited. Appl. Spectrosc. Rev. 2011, 46, 140–165. [Google Scholar] [CrossRef]
  49. Lopez, R.; Gomez, R. Band-gap energy estimation from diffuse reflectance measurements on sol–gel and commercial TiO2: A comparative study. J. Sol-Gel Sci. Technol. 2012, 61, 1–7. [Google Scholar] [CrossRef]
  50. Kubelka, P.; Munk, F. An Article on Optics of Paint Layers. Physik 1931, 12, 593–609. [Google Scholar]
  51. Kubelka, P. New Contributions to the Optics of Intensely Light-Scattering Materials. Part I. J. Opt. Soc. Am. 1948, 38, 448–457. [Google Scholar] [CrossRef]
  52. Makuła, P.; Pacia, M.; Macyk, W. How To Correctly Determine the Band Gap Energy of Modified Semiconductor Photocatalysts Based on UV−Vis Spectra. J. Phys. Chem. Lett. 2018, 9, 6814–6817. [Google Scholar] [CrossRef] [Green Version]
  53. Konstantinou, I.K.; Albanis, T.A. TiO2-assisted photocatalytic degradation of azo dyes in aqueous solution: Kinetic and mechanistic investigations. A review. Appl. Catal. B Environ. 2004, 49, 1–14. [Google Scholar] [CrossRef]
  54. Vadivelan, V.; Kumar, K.V. Equilibrium, kinetics, mechanism, and process design for the sorption of methylene blue onto rice husk. J. Colloid Interface Sci. 2005, 286, 90–100. [Google Scholar] [CrossRef] [PubMed]
  55. Turner, B.D.; Henley, B.; Sleap, S.; Sloan, S.W. Kinetic model selection and the Hill model in geochemistry. Int. J. Environ. Sci. Technol. 2015, 12, 2545–2558. [Google Scholar] [CrossRef] [Green Version]
  56. Fei, N.C.; Mehat, N.; Kamar, S. Practical Applications of Taguchi Method for Optimization of Processing Parameters for Plastic Injection Moulding: A Retrospective Review. ISRN Ind. Eng. 2013, 2013, 462174. [Google Scholar] [CrossRef] [Green Version]
  57. Zalani, N.M.; Kaleji, B.; Mazinani, B. Synthesis and characterisation of the mesoporous ZnO-TiO2 nanocomposite; Taguchi optimisation and photocatalytic methylene blue degradation under visible light. Mater. Technol. 2020, 35, 281–289. [Google Scholar] [CrossRef]
  58. Manjunatha, C.; Abhishek, B.; Shivaraj, B.; Ashoka, S.; Shashank, M.; Nagaraju, G. Engineering the MxZn1−xO (M = Al3+, Fe3+, Cr3+) nanoparticles for visible light-assisted catalytic mineralization of methylene blue dye using Taguchi design. Chem. Pap. 2020, 74, 2719–2731. [Google Scholar] [CrossRef]
  59. Giahi, M.; Badalpoor, N.; Habibi, S.; Taghavi, H. Synthesis of CuO/ZnO Nanoparticles and Their Application for Photocatalytic Degradation of Lidocaine HCl by the Trial-and-error and Taguchi Methods. Bull. Korean Chem. Soc. 2013, 34, 2176–2182. [Google Scholar] [CrossRef]
  60. Sabonian, M.; Mahanpoor, K. Optimization of Photocatalytic Reduction of Cr(VI) in Water with Nano ZnO/Todorokite as a Catalyst: Using Taguchi Experimental Design. Iran. J. Chem. Chem. Eng. 2019, 38, 105–113. [Google Scholar]
  61. Chandrika, K.C.; Anantharamaiah, P.; Krishna, R.H.; Jineesh, A.; Prabhu, T.N. CoFe2O4-TiO2 a Lethal P-n heterogeneous catalyst for malachite green degradation under visible light and optimisation of parameters by the Taguchi Method. Mater. Technol. 2022, 37, 1877–1889. [Google Scholar] [CrossRef]
  62. Arimi, A.; Farhadian, M.; Nazar, A.S.; Homayoonfal, M. Assessment of operating parameters for photocatalytic degradation of a textile dye by Fe2O3/TiO2/clinoptilolite nanocatalyst using Taguchi experimental design. Res. Chem. Intermed. 2016, 42, 4021–4040. [Google Scholar] [CrossRef]
Figure 1. XRD spectrum of N-doped TiO2 powder.
Applsci 13 00774 g001
Figure 2. Raman spectra of N-doped TiO2 powder and pure anatase.
Applsci 13 00774 g002
Figure 3. XPS spectra of N-TiO2 particles: (a) survey scan, (b) high resolution of Ti2p peak, (c) high resolution of deconvoluted O1s peaks, and (d) high resolution of N1s peak.
Applsci 13 00774 g003
Figure 4. Reflection F(R) to wavelength (nm) graph for N-doped TiO2 powder.
Applsci 13 00774 g004
Figure 5. Energy band gap graph for N-doped TiO2 powder.
Applsci 13 00774 g005
Figure 6. FESEM analysis on N-doped TiO2 powder in (a) ×100,000 and (b) ×150,000 magnification.
Applsci 13 00774 g006
Figure 7. TEM images of the as prepared N-TiO2 nanoparticles in (a) ×190,000, (b) ×245,000, and (c) ×500,000 magnification.
Applsci 13 00774 g007aApplsci 13 00774 g007b
Figure 8. Degradation curves of Rhodamine B for different amounts of catalyst and irradiation time, under visible light irradiation. Photolysis of the pollutant is also included.
Applsci 13 00774 g008
Figure 9. Degradation curves of Methylene Blue for different amounts of catalyst and irradiation time, under visible light irradiation. Photolysis of the pollutant is also included.
Applsci 13 00774 g009
Figure 10. Degradation curves of Brilliant Green for different amounts of catalyst and irradiation time, under visible light irradiation. Photolysis of the pollutant is also included.
Applsci 13 00774 g010
Figure 11. Photocatalytic kinetics under visible light irradiation for (a) Rhodamine B, (b) Methylene Blue, and (c) Brilliant Green.
Applsci 13 00774 g011aApplsci 13 00774 g011b
Figure 12. Qualitative effect of each factor on the final degradation of C/Co, where A is the amount of catalyst/pollutant (g/L), B is the pollutant, C is the distance from the light source and, D is the time protocol.
Applsci 13 00774 g012
Figure 13. Experimental results when following the proposed photocatalytic protocol in (a) degradation rate and (b) photocatalytic kinetics.
Applsci 13 00774 g013
Table 1. Taguchi orthogonal array L9 factors and their levels.
LevelsParameters (Factors)
A-Photocatalyst/Pollutant (g/L)B-PollutantC-Distance from Light Source (cm)D-Irradiation Time (Total min/Measuring Gap Time)
10.1Methylene Blue5100/10
21Rhodamine B10150/30
310Brilliant Green15200/20
Table 2. Modified L9 orthogonal array.
Experiment No.Control Factors
ABCD
10.1 g/LMethylene Blue5 cm100 min/10 min
20.1 g/LRhodamine B10 cm150 min/30 min
30.1 g/LBrilliant Green15 cm200 min/20 min
41 g/LMethylene Blue10 cm200 min/20 min
51 g/LRhodamine B15 cm100 min/10 min
61 g/LBrilliant Green5 cm150 min/30 min
710 g/LMethylene Blue15 cm150 min/30 min
810 g/LRhodamine B5 cm200 min/20 min
910 g/LBrilliant Green10 cm100 min/10 min
Table 3. Percentage of effect of each factor on the final degradation according to Taguchi method.
FactorEffect %
A-Photocatalyst/pollutant (g/L)28.78
B-Pollutant52.21
C-Distance from light source (cm)10.95
D-Irradiation time (total min/measuring gap time)8.07
Table 4. Proposed photocatalysis protocol.
FactorLevel for Protocol
A-Photocatalyst/pollutant (g/L)1
B-PollutantRhodamine B
C-Distance from light source (cm)10
D-Irradiation time (total min/measuring gap time)150/30
Disclaimer/Publisher’s Note: The statements, opinions and data contained in all publications are solely those of the individual author(s) and contributor(s) and not of MDPI and/or the editor(s). MDPI and/or the editor(s) disclaim responsibility for any injury to people or property resulting from any ideas, methods, instructions or products referred to in the content.

