Article

Revalidation Technique on Landslide Susceptibility Modelling: An Approach to Local Level Disaster Risk Management in Kuala Lumpur, Malaysia

1
Department of Geology, University of Malaya, Kuala Lumpur 50603, Malaysia
2
Southeast Asia Disaster Prevention Research Initiative (SEADPRI-UKM), Universiti Kebangsaan Malaysia, Bangi 43600, Malaysia
3
Technical Services Division, Department of Mineral and Geoscience Malaysia, Jalan Sultan Azlan Shah, Ipoh 31400, Malaysia
4
British Geological Survey, Nicker Hill, Keyworth, Nottingham NG12 5GG, UK
*
Author to whom correspondence should be addressed.
Appl. Sci. 2023, 13(2), 768; https://doi.org/10.3390/app13020768
Submission received: 2 December 2022 / Revised: 21 December 2022 / Accepted: 28 December 2022 / Published: 5 January 2023
(This article belongs to the Special Issue Geohazards: Risk Assessment, Mitigation and Prevention)

Abstract

:
Landslide susceptibility modelling in tropical climates is hindered by incomplete inventory due to rapid development and natural processes that obliterate field evidence, making validation a challenge. Susceptibility modelling was conducted in Kuala Lumpur, Malaysia using a new spatial partitioning technique for cross-validation. This involved a series of two alternating east-west linear zones, where the first zone served as the training dataset and the second zone was the test dataset, and vice versa. The results show that the susceptibility models have good compatibility with the selected landslide conditioning factors and high predictive accuracy. The model with the highest area under curve (AUC) values (SRC = 0.92, PRC = 0.90) was submitted to the City Council of Kuala Lumpur for land use planning and development control. Rainfall-induced landslides are prominent within the study area, especially during the monsoon period. An extreme rainfall event in December 2021 that triggered 122 landslides provided an opportunity to conduct retrospective validation of the model; the high predictive capability (AUC of PRC = 0.93) was reaffirmed. The findings proved that retrospective validation is vital for landslide susceptibility modelling, especially where the inventory is not of the best quality. This is to encourage wider usage and acceptance among end users, especially decision-makers in cities, to support disaster risk management in a changing climate.

1. Introduction

Landslides triggered by rainfall have resulted in the highest number of fatalities in Asia, and whilst its attribution to climate change is limited by deficient records, landslide occurrence is expected to increase in many regions [1,2]. Development in steep hills and unstable slopes, in combination with seasonally dry periods followed by excessive rainfall are contributing factors for frequent landslides in Southeast Asia [3]. The number of people in cities and urban settlements that will be exposed to landslides is expected to increase in Southeast Asia due to increased monsoon rainfall as a result of climate change [1,4]. The expected increase of landslides calls for reliable demarcation of areas susceptible to this hazard for supporting disaster risk management in cities.
Quantitative techniques predominate in landslide susceptibility modelling. The techniques could be deterministic (analytically driven), heuristic (knowledge-driven), or data-driven statistics, encompassing bivariate, multivariate, and machine learning approaches [5,6]. The use of statistical approaches in actual practice is dependent on a reliable inventory that reflects the actual factors that cause a slope to fail [7,8]. Statistical approaches are reliable for shallow landslides when drawing on inventories that integrate field investigation, high resolution digital elevation models (DEM) and images, combined with expert inputs for more nuanced representation of local conditions [9,10,11,12].
Validation is critical for susceptibility modelling to ensure the quality and reliability of outputs for wider usage among the decision makers [13,14,15]. Model validation generally involves two aspects, evaluating compatibility and assessing predictive capability [5,16,17]. The area under curve (AUC) is computed from the receiver operating characteristics (ROC) curve to report results. The evaluation of compatibility (i.e., agreement between the outputs and observed data) is from success rate curves (SRC) while the assessment of predictive capability is through prediction rate curves (PRC). Partitioning of the inventory into test and training datasets is the basis for validation [15,18].
Partitioning of the inventory is handled using three types of techniques. These are random, spatial, and temporal techniques [13,14,19,20]. Temporal validation uses dataset of landslides that occurred at different time periods to assess the predicted model capability. Random partitioning involves separation of the landslide inventory into two subsets, where one subset is arbitrarily removed to assess predictability. Spatial partitioning is a comparison of two mutually exclusive sub-regions of the area under investigation, or to another area with similar setting. This technique has limitations in lithologically heterogeneous areas, where some parameters that influence landslides may be absent in one of the sub-regions, leading to low predictive capability [15,21]. Retrospective validation has recently been introduced to assess the actual accuracy of prediction from susceptibility modelling [18]. The application of this approach is expected to increase the reliability, transparency, and acceptance of susceptibility modelling.
Malaysia has tropical climate with mean daily temperatures of between 26 °C to 28 °C and annual average rainfall ranging from 2000 mm to 4000 mm, with two distinct monsoon seasons [22]. The hot and humid conditions have resulted in deep weathered soil profiles that are prone to landslides. Rainfall-induced shallow landslides are common in cities primarily due to land use change and other human activity, and several have been observed to be reactivated failures [23,24,25]. In some cases, failures have been linked to inadequate engineering design during construction and poor slope maintenance [23]. Landslide mapping is a challenge due to vegetation growth, active erosion, and rapid development that obliterates evidence of landslide occurrence. This is compounded by inadequate public records, which is a prevailing issue for many developing countries due to limited resources [26].
Landslide susceptibility modelling has been conducted sporadically in Malaysia over the past decade. Statistical approaches are prevalent in areas where inventories are available such as Cameron Highlands, Penang, Putrajaya, and eastern Selangor [27,28,29,30,31,32,33,34,35,36]. Generally, the inventories are limited, and the best available data are utilised. More recently, a bivariate statistics approach combined with expert inputs was used to improve the susceptibility model [9]. In many cases, model validation is not mentioned [28,29,30,32,33], while in others only the success rates are reported [9,34]. Investigations that report on predictive capability have relied on random partitioning and spatial correlation techniques [27,31,35,36]. All the investigations have been conducted for academic purposes and retrospective validation has not been reported.
Kuala Lumpur, the capital city of Malaysia, suffers from numerous slope failures especially after a severe rainfall episode, where residential infrastructure and business complexes are most affected [23]. Many of the incidents occur in cut and fill slopes, road embankments, highways, and hill slope development projects [28,37,38]. The situation is expected to worsen with climate change and continuous expansion of the city. This paper highlights a new spatial partitioning technique for landslide susceptibility modelling that was conducted in Kuala Lumpur, Malaysia. The technique is introduced for assessing the predictive capability of landslides, to overcome the limitations associated with lithological heterogeneity. The ensuing landslide susceptibility map was then formally submitted to the City Council of Kuala Lumpur (DBKL) to support decision-making. An extreme rainfall event with a recorded precipitation of more than 250 mm occurred in December 2021 exceeding the monthly rainfall in over a day. The unusual phenomenon was caused by the northeast monsoon flow factors and a low-pressure weather system which caused continuous heavy rain over the west coast of peninsula regions besides the usually affected central east coast and northern peninsula regions. The event caused massive flooding of 100-year return period and triggered 122 landslides in the city. This provided an opportunity to conduct retrospective validation to confirm the robustness of the partitioning technique and increase confidence in the landslide susceptibility map.

2. Materials and Methods

2.1. Study Area

Kuala Lumpur covers an area of 243 km2 and is the most urbanised and densely populated territory in Malaysia. The city is located in west-central Peninsular Malaysia, underlain by a variety of rock types, geological structures and geomorphological features [39]. The Dinding Schist present in northeastern Kuala Lumpur consists of meta-volcanics and quartz-mica schist (Figure 1). It is overlain by the Hawthornden Schist comprising mainly of graphitic quartz-mica schist. The schistosity of these two rock units is trending approximately north-south. The northern and east-central area is underlain by the Kuala Lumpur Limestone. The limestone is fully covered by alluvium, fill material, and mine tailing with thickness up to 66 m. Kenny Hill Formation is mainly found in the southern and central parts of the city. It comprises interbedded phyllite and quartzite, and the strata are mainly trending north–south. All the above metasedimentary sequences were intruded by granite, which is present mainly in the western and southeastern Kuala Lumpur. Soils developed over the schists, Kenny Hill Formation, and granite average 13 m, 9 m, and 15 m thick, respectively. The ground elevation obtained from the digital terrain model (DTM) of Kuala Lumpur ranges from 9 m to 320 m; about 90% of the city is below 100 m. Flat alluvial plains occur along the Kelang River and its tributaries. The alluvium has been largely mined for tin in the past. The alluvial plain is flanked by hills at the east and west. The hills in the Kenny Hill Formation areas have low relief (~50 m) and are generally elongated in the north–south direction. The hills in the granite and schist areas have higher relief (~100 m) and are also elongated in the north–south direction.

2.2. Input Data

The landslide inventory consists of 650 landslide points sourced from Department of Mineral and Geoscience Malaysia (JMG). It is the sole official landslide repository that was established in 2014 through field mapping and includes only rainfall-triggered landslides. Although it contains only partial information on location and type of slope failure (man-made or natural), the original landslide points were refined through quality assessment to ensure the evidence of landslides location and its accuracy. The points were overlain on the DTM, orthorectified aerial photographs and satellite imageries from Google Earth, and repositioned at the crown of the landslides.
The DTM was derived from LiDAR data from DBKL. The 2014 LiDAR data have a resolution of 1 m, and they were resampled to a pixel size of 5 m for the study. Aerial photographs were acquired from the Department of Survey and Mapping Malaysia (JUPEM) and DBKL. Topographic maps used were at the scales of 1:50,000, 1:25,000 and 1:10,000 published by JUPEM. Bedrock geology maps obtained from JMG were updated to incorporate information on surface geology and geological structures. The additional data were obtained from boreholes and field visits as well as interpretation from aerial photographs and topographic maps.

2.3. Landslide Conditioning Factors

A total of fourteen intrinsic landslide conditioning factors were prepared from the geological maps, DTM, topographic maps, and satellite imageries. All the geoprocessing was done using the software ArcGIS 10.5. Bedrock geology and surface geology were extracted from the geological data. Geomorphological factors such as slope gradient, slope aspect, and slope curvature were derived directly from the DTM. The standard deviation of elevation calculated from a 10 m by 10 m moving window was used to derive the surface roughness [40]. The topographical position index (TPI) [41,42] was calculated as the difference between the elevation at a point and the mean elevation within a 250 m radius circular moving window.
The topographic wetness index (TWI) is a contributing factor that affects the topography and used to quantify the topographic control on hydrological processes, expressed by Equation (1), whereas the stream power index (SPI) measures the erosive power of water flow as defined by Equation (2). The value α is calculated by multiplying the flow accumulation with the cell area. The distance to stream, distance to road and distance to lineament maps were created by making multiple ring buffer around the streams, roads and lineament, respectively. Landsat 8 imagery was used to produce the normalised difference vegetation index (NDVI) map. The value can be calculated using Equation (3).
TWI = ln ( α tan β )
SPI = ln ( α . tan β )
where α is the local upslope contributing area, and β is the slope [43].
NDVI = N I R R e d N I R + R e d
where NIR is the near-infrared band, and Red is the red band.
An expert consultation process was carried out to select the best landslide conditioning factors for the area [9]. The conditioning factors went through an iterative selection and elimination procedure by experts with experience working on landslides in tropical terrain. The evaluation was based on redundancy and relevance of the factors to the local geological and terrain conditions, as well as the initial results of bivariate statistical analysis. Only seven of the original conditioning factors were selected as shown in Table 1. They are surface geology, slope gradient, elevation, distance to lineament, distance to road, surface roughness, and TPI (Figure 2 and Figure 3).
Most of the ground is covered by surface geology and shows a strong influence towards landslide initiation compared to bedrock geology, caused by the deep weathering profile which generates thick residual soil over most area [44]. The residual soil of Kenny Hill formation holds the highest weightage of 1.00 with 68.7% of total landslide, due to the interlayering of metasedimentary rocks of variable strength and properties while the granite represents 127 (20%) landslides with a weightage value of −0.18. Slope gradient is usually regarded as the primary causative factor for the onset of slope failure associated to shear strength of the material on slope [45]. The analysis of the parameter indicates that the landslide density and weightage values increase with increasing slope gradient. Elevation of the slope is not a conditioning factor by itself but affects the overall surface of the terrain and topographic features which controls the vegetation distribution [31]. The highest weightage is represented by the 100–150 m class with a value of 0.55 and has 10% of the total landslides while 50–100 m class represents 68.8% of the total landslides with a lower weightage of 0.49 due to the larger area. The correlation between distance to lineament parameter and landslides is explained by weakened earth material by deformation along faults. The structural stability of the surrounding area is reduced by induced regional perturbations in the fracturing occurrence and enhanced weathering in the rocks [46]. The distance to lineament factor and landslide shows direct correlation with the highest weightage (0.93) is within 0–250 m proximity. Slope which has closer proximity to roads especially near cut and fill slope could affect the stability by increase of stress in its base and accumulation of water from nearby slope [47,48]. The highest weightage of 0.18 produced from the 25–50 m class interval representing 25% of total landslides while the majority of landslides (47%) occurs within 0–25 m distance from a roadway yields a low weightage of 0.02 due to larger class area. Surface roughness generally correlates to excavation, surface erosion and the density of vegetation cover and could signify the type of land cover of that particular area and has been classified into high, moderate and low values [46]. Half of the landslides (53%) are categorised as having moderate surface roughness with a weightage of 0.07, however the highest weightage of 0.29 represented by slope with high roughness due to smaller areal class. TPI gives an indication to where the landslide point is located with reference to the topographical position or sometimes expressed as landscape position [49,50]. The highest percentage and weightage of landslides is within the middle slope with a value of 61.17% and 1.13, respectively, with the upper slope class having a weightage of −0.01 with 15.08% of total landslides.

2.4. Bivariate Statistical Analysis

Landslide susceptibility modelling was conducted using the bivariate statistical approach that relies on the correlation between landslide population and the landslide conditioning factors. Each conditioning factor is subdivided into several classes, and a weight is calculated for each class from its statistical spatial relationship with landslide distribution [5,12,51,52].
The method proposed by [53] involves calculation of the natural logarithm of landslide density of each class within each factor divided by the overall landslide density in the area expressed as the Equation (4).
W i =   ln ( D e n s c l a s s D e n s m a p ) = ln ( N p i x ( S i ) N p i x ( N i ) N p i x ( S i ) N p i x ( N i ) )
where, Wi = the weight given to a certain factor class. Densclass = the landslide density within the factor class. Densmap = the landslide density within the entire map. N p i x ( S i ) = the number of pixels with landslide occurrence in a certain factor class. N p i x ( N i ) = total number of pixels in a certain factor class.
The weight indicates the correlation of the class factor with the landslide occurrence and refers to landslide density of each factor class. Negative weights indicate that the landslide density is lower than average, while a positive value signifies that it is higher. A zero weight is obtained when there is an absence of landslide occurrences within a parameter class [53]. Since the analysis is based on statistical calculation of the pixels in a map, raster maps are required for the processing. Vector maps in the form of polygon shapefiles were converted into raster files for further processing.
The raster factor maps were reclassified by assigning the weight to all the factor classes. The landslide susceptibility is a summation of the reclassified factor maps. The susceptibility classes can be defined based on the landslide density [54,55]. The classification was carried out manually based on the percentage of landslide points within each class. The classes are very high (>50%), high (20–50%), moderate (10–20%), low (2–10%) and very low (<2%) susceptibility, respectively.

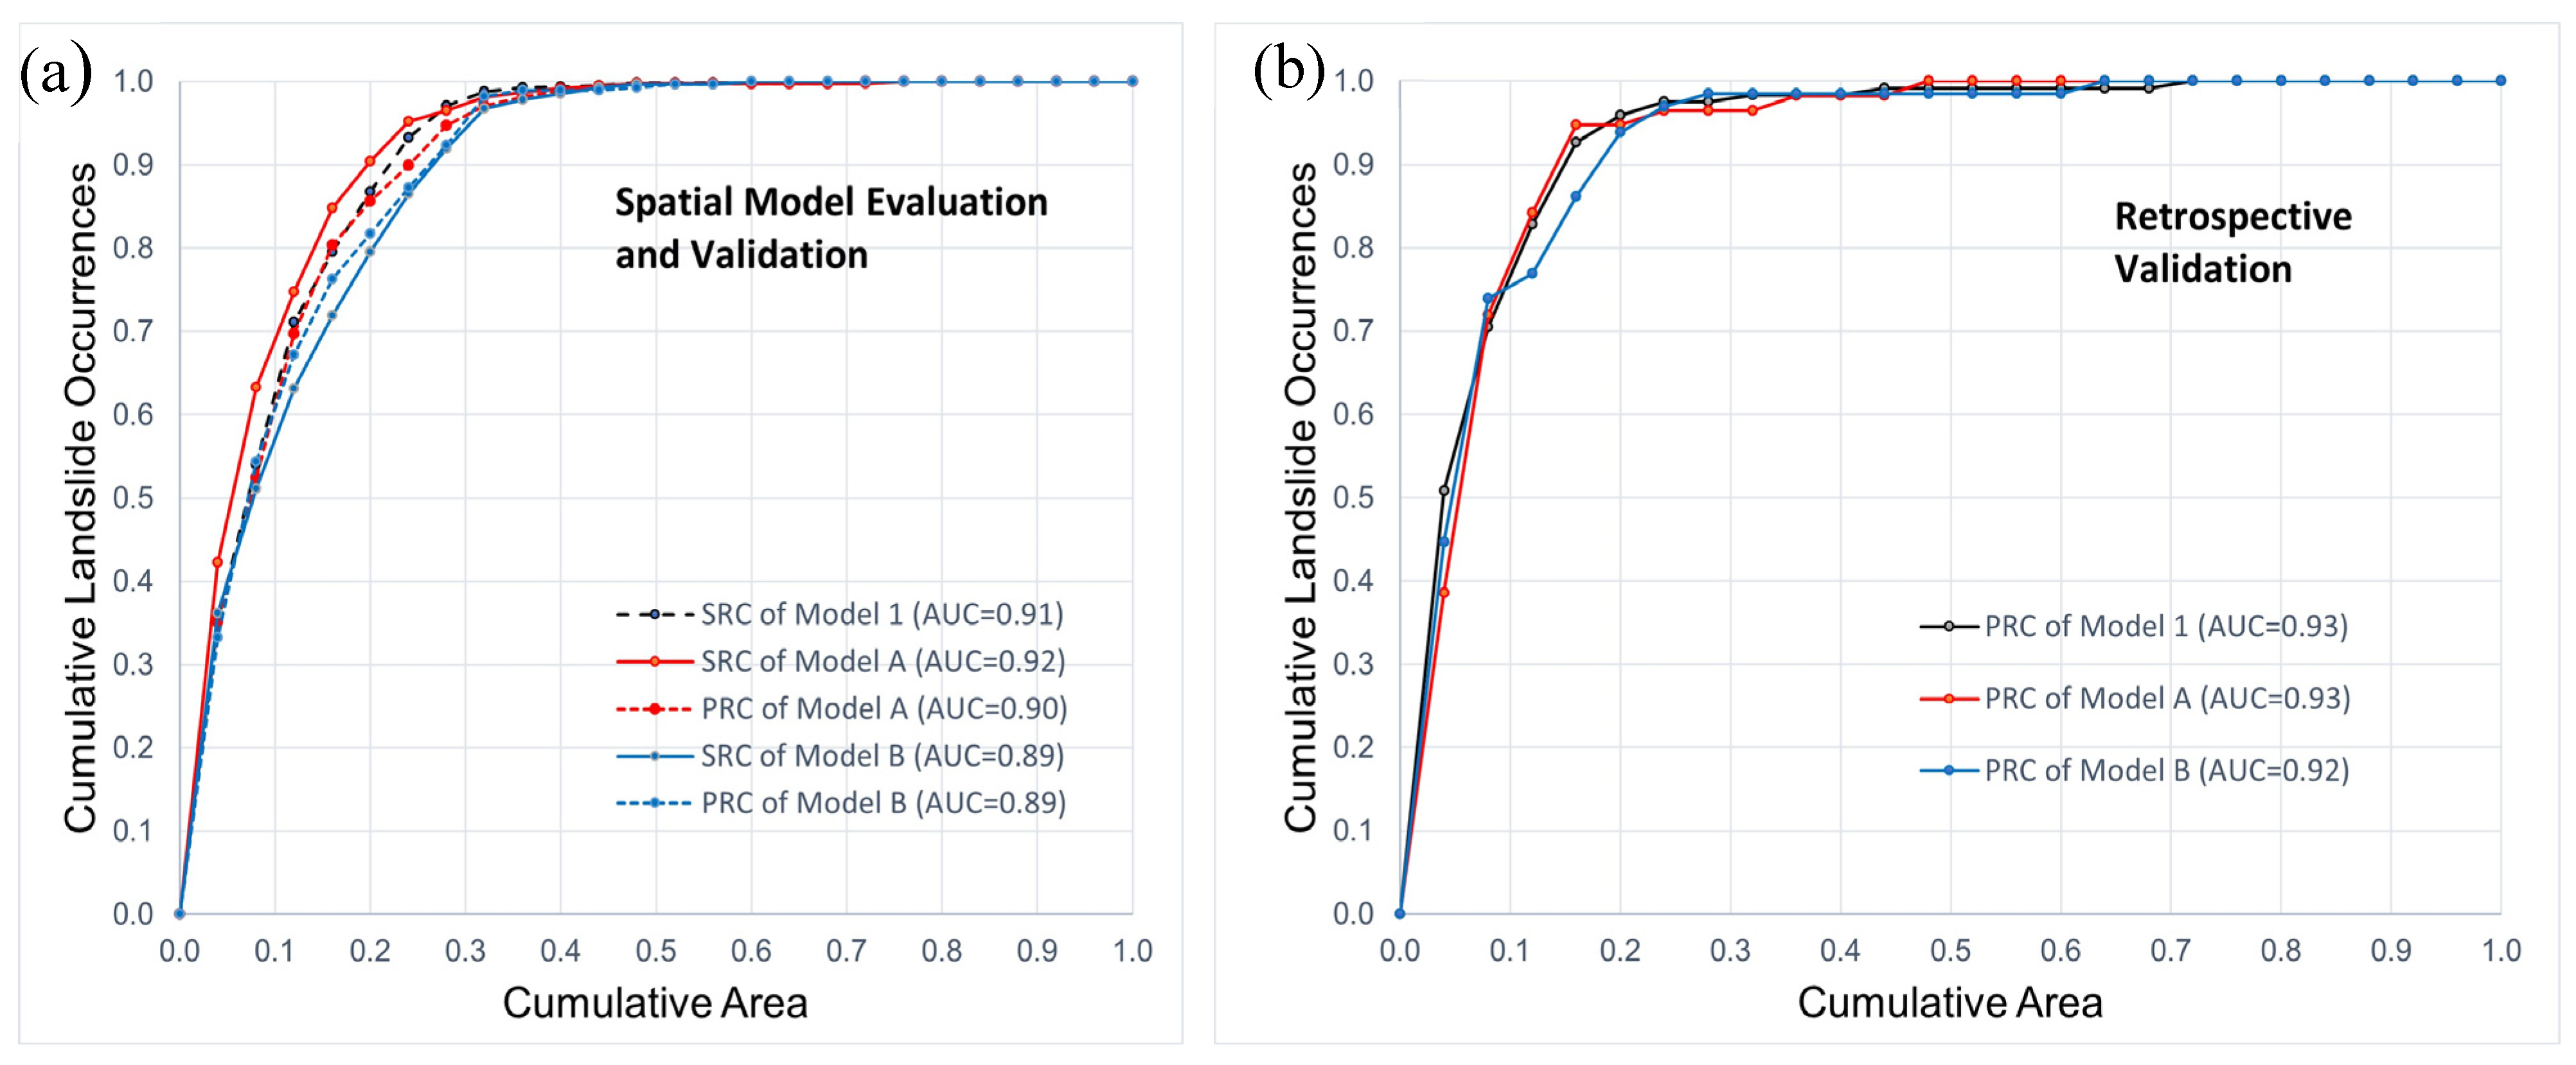
2.5. Model Evaluation and Validation

The study employed the ROC method for model evaluation and validation. The AUC is used as the metric to evaluate the quality of the model. The susceptibility map was divided into 25 equal area classes with decreasing susceptibility and the percentage of landslide in each of class is calculated. The cumulative landslide percentage was plotted against the cumulative area to derive the ROC curve.
The landslide inventory was partitioned into two groups, i.e., training dataset and test dataset. The SRC is acquired when ROC curve of the same susceptibility map is plotted against the training set. The PRC is generated from the ROC curve derived from the susceptibility map generated from the training set against landslide points in the test set. The performance of the model is represented by a value range under the curve of 0.5 to 1.0, where 0.5 represents a test with accuracy no better than chance while value close to 1.0 which suggests an ideal model with a perfect fit [19].
The whole 2014 landslide inventory was used to generate a landslide susceptibility map and the SRC is plotted to assess the model’s compatibility. Spatial cross-validation was done on the same inventory. The study area was partitioned into alternating linear zones (zone A and zone B) measuring 1 km in width as to represent the smallest geological unit in Kuala Lumpur known as schist. Another reason for the selection of the dimension is to ensure consistency since the topographic map of Malaysia has a 1 km grid. The zones are orientated east–west, perpendicular to the north-south geological and geomorphological trend. This is to ensure the inclusivity of the factors involved in both sub-regions. The validation was done twice. First zone A was used as the training set and zone B as the test set, and in second validation, the role of zones A and B is reversed. The SRC and PRC were plotted for both cases.

2.6. Retrospective Validation

In December 2021, an extreme rainfall event occurred in Kuala Lumpur and its surrounding areas causing massive flood events. The event also triggered widespread landslides. Fieldwork was carried out in January 2022 to record the landslides. The research team mapped 122 landslides more precisely than the older events in the original inventory. The position of the landslides was recorded directly in the field using the application Avenza Maps, where the DTM used as the base map. Retrospective validation was conducted using a quantitative approach. The susceptibility maps and the landslide points were compared by calculating the AUC values of PRC to evaluate the performance of the landslide susceptibility maps that was generated from the original inventory.

3. Results

3.1. Landslide Inventories

The 2014 landslide inventory comprising 650 events is represented mainly by small rotational landslides that occurred in the Kuala Lumpur granite and rotational to translational failures observed in the Kenny Hill formation. The mechanism of the landslides is recognised as similar as they often occur together and caused sliding of material, but data for each location are not available in the inventory. The landslides within the area are rainfall-induced which occurred on both natural and man-made slope. About 70% of the landslide are less than 10 m in length, 27% between 10 m and 20 m, and only 3% are more than 20 m. The landslides occurred mainly in areas under the Kenny Hill Formation (70%) and granite (20%). Landslides are common in the hilly areas on slope with gradient of 15–25° (35%) and 25–35° (31%), in the west-central, south, and northeast Kuala Lumpur. The distribution of the 2021 landslides is similar, but there is a noticeable increase of landslides in granite (31%). Spatially partitioning the 2014 inventory for model validation revealed that 58% of landslides occurred in the first subset (zone A) while the remaining 42% were in the second subset (zone B).

3.2. Landslide Susceptibility Models

Three landslide susceptibility models were produced from bivariate statistical analysis using 7 landslide conditioning factors (Figure 2 and Figure 3). The weights calculated for these three models are listed in Table S1. In the first model (model 1), all the landslide points from the 2014 inventory were used and there was no spatial partitioning of the dataset (Figure 4a). The AUC of the SRC of this model is 0.91 (Figure 5a). The areas classified as very high and high susceptibility cover 7% and 9% of the city, respectively. These two susceptibility classes are concentrated in the northeastern, west-central, and southern parts of Kuala Lumpur; much of this area is not developed. About 7% of the area is classified as moderately susceptible. The moderately susceptible areas are distributed mainly in the vicinity of the two earlier classes. The low susceptibility areas (20%) are scattered around the earlier classes and within the very low susceptibility class. Covering 57% of the area, the very low susceptibility class is the largest. It is distributed mainly in the northern and eastern Kuala Lumpur, in relatively flat areas underlain by alluvium and mine tailings.
The next two models were used for spatial cross-validation, where the study area is partitioned into a series of two alternating linear zones (zones A and B) trending east-west. In the initial partitioned model (model A), the susceptibility map is generated using landslide points in zone A as the training dataset and landslide points in zone B as the test dataset (Figure 4b). The role of landslide points in zones A and B are reversed in the next model (model B) (Figure 4c). The distribution of the very high to moderate susceptibility classes of these two models are similar to the unpartitioned model (model 1), which obtained using the entire dataset of the inventory (Figure 4a–c). Compared to model 1, the low susceptibility areas of both models A and B are higher (27%), and the very low susceptibility areas are lower (48%).

3.3. Model Evaluation and Validation

The spatial cross-validation produced results that are similar. The AUC of the SRC for model A and model B is 0.92 and 0.89, respectively (Figure 5a). The high AUC values of these two models and the model 1 indicate good compatibility of the models derived from the 7 selected landslide conditioning factors. It also indicates a high level of inclusivity where all the parameter classes are well represented in the three models. Model 1 and model A produced similar high SRC values, which indicates excellent model fitness. Although the 0.01 difference may not be statistically significant, a possible explanation for this finding is the higher distribution of landslides within zone A subset (58%) generated a model with the closest SRC value to that of model 1.
The PRC for model A and model B also produced AUC values of 0.90 and 0.89, respectively, indicating that both models have similarly high predictive capability (Figure 5a). The similar AUC values show that the spatial partitioning method used is suitable for model validation. The AUC of model A is marginally better than model B. In 2020, this model was selected to be formally submitted to DBKL, the local council of Kuala Lumpur, to support decision-making on land use planning and development control.
The retrospective validation of all the three models using the 122 landslide events that occurred in 2021 showed a slight increase in confidence level (Figure 4d). The AUC of the PRC for model 1, model A and model B is 0.93, 0.93, and 0.92, respectively (Figure 5b). The values proved to be marginally higher than the spatial partitioning method. Comparing the PRC to that of model 1, the same AUC values could be attributed to the small sample size of the 2021 landslide events and similar landslide distribution in both models. The revalidation using the retrospective method reaffirms the high predictive ability of all three landslide susceptibility models. This indicates that the product that was submitted to the city council is reliable for decision-making purposes.

4. Discussion

The sole official landslide inventory established in 2014 contained only 650 landslide points that could be verified despite the numerous slope failures have been reported in Kuala Lumpur for decades, especially after a severe rainfall. This is primarily because much of the evidence in the field was obliterated. In comparison, after one unusually heavy rainfall incident, 122 events were recorded by the research team. This indicates that the number of historical landslides is most likely higher and has gone unrecorded. Furthermore, information in the original 2014 landslide inventory was limited to event locations, while more complete information was obtained from the fresh landslide scars in 2021; indicating the need for urgency in field data collection. Though the 2014 inventory was manually improved to correctly position and interpret the type and size of landslides using DTM and orthorectified aerial photographs; much time and expertise on local conditions was required. An automated approach has been advocated for the identification of landslides using high resolution DEM [7]. However, the accuracy of this method in cities is yet to be reported. In order to obtain complete and better-quality datasets, landslide inventories in tropical cities need to be routinely updated after heavy rainfalls.
Landslide inventories with information on landslide masses reportedly produced more accurate susceptibility maps compared to the use of landslide mass centre point [7]. However, it has also been reported that the scarp has higher predictive accuracy than the mass centre as it closely represents the pre-failure conditions [56]. The 2014 inventory utilised the position of the landslide scarp centre as it was a more prominent feature that was more readily identified. In most cases, the body and toe of the landslide is not clear due to erosion and vegetation. In this study, the inventory sourced from JMG was not of the best quality with respect to data on the type and extent of the landslides. Notwithstanding, a consistent sampling technique using information on landslide scarp resulted in sufficiently accurate susceptibility models.
The landslide conditioning factors used for modelling were restricted to 7, although a total of 14 factors were initially produced. This smaller selection was considered appropriate through expert consultation and resulted in a susceptibility model that had high prediction accuracy. In this investigation, the high resolution (1 m) Light Detection and Ranging (LiDAR) derived DTM was resampled to 5 m, to reduce the noise, artifacts, and processing time. This was also considered sufficient as the topographic data (DTM) was of relatively high resolution. It has been demonstrated that finer resolution of topographic data leads to more accurate and precise susceptibility models. This study supports recent findings that as long as suitable input data and techniques are selected based on the data quality and purpose, most landslide susceptibility models result in sound overall prediction accuracy regardless of the approach [7].
Retrospective validation conducted in this study indicates that the spatial partitioning technique along alternating linear zones trending east–west that was used to cross validate the susceptibility models is able to resolve the issue of heterogeneity caused by north–south trending geological and geomorphological features. All the landslide conditioning factor classes were represented in both zones A and B (Supplementary, Table S1). The difference in the area for 70% of the factor classes between the two zones is less than 10% (Supplementary Table S2). It appears that spatial partitioning techniques that are context specific, taking into account local geological and geomorphological features, result in high confidence susceptibility maps. Nevertheless, additional analysis is required using linear zones trending in other directions to confirm this outcome. Other random partitioning and spatial correlation techniques that have been previously reported in the country should also be investigated [27,31,35,36].
Notwithstanding, the landslide susceptibility map that was submitted to DBKL is reliable for decision-making as indicated by the high predictive value (AUC = 0.93) from retrospective validation. The map indicates that that 16% of the Kuala Lumpur area has very high to high susceptibility. Fortunately, much of this comprises rugged terrain that is currently not developed. The population density map of district level produced using the 2020 census data indicates the highest population per km2 is distributed at the northwest region found in Wangsa Maju followed by the second highest class represented by Setiawangsa, Batu and Seputeh in southwest region (Figure 6) [57]. With reference to the landslide susceptibility model, we recognise that part of the hilly areas in Wangsa Maju, Setiawangsa and Seputeh located in high to very high susceptibility class, requiring urgent effort in hazard mitigation, disaster preparedness, and stringent actions for development. In the current scenario, targeted disaster risk management strategies could be formulated by DBKL to manage the zones that have already been developed and the vulnerable areas. This could include investing in monitoring and early warning measures and conducting preparedness programs which aim to build the resilience of communities. The undeveloped areas could be either be gazetted for protection or stringent development, where developers are required to conduct detailed geological and geotechnical investigation, with provision of appropriate disaster mitigation measures.
Resource constraints are a contributing factor to the lack of effort to maintain and regularly update the inventory in Kuala Lumpur. A complete and frequently updated inventory would facilitate further investigation including the development of hazard maps to determine the probability of landslide events. To evaluate the accuracy of bivariate statistical model in comparison with other established methods, future work using a semi-quantitative approach, namely the analytic hierarchy process (AHP), is recommended to further improve the findings. In addition, the determination of rainfall threshold values that trigger landslides could be used to establish early warning for disaster risk management [58,59]. Further investigation is also required in Kuala Lumpur to understand the significant increase of landslides in areas underlain by granites in 2021, whether this is due to unevenness in rainfall distribution or inherent characteristics of the terrain. This is critical in light of the worsening situation expected with climate change and continuous expansion of the city. Innovative partnerships could be considered, encompassing academia, the government agencies, and the local council, with involvement of the insurance and banking sectors, to maintain and conduct further investigation of landslide risks in Kuala Lumpur. Such public–private partnerships could be scaled up to cover more cities in the country, if successful.

5. Conclusions

The projected intensification of monsoon rainfall over Southeast Asia and continuous growth of the city is expected to increase landslide incidents in Kuala Lumpur, Malaysia. This calls for reliable demarcation of areas within the city that are susceptible to landslides to support disaster risk management. Kuala Lumpur is underlain by heterogeneous lithology and north–south trending geological structures and geomorphological features, which limits the effectiveness of conventional spatial partitioning techniques for validation in landslide susceptibility modelling. This limitation was overcome by employing a new spatial partitioning technique using a series of two alternating east–west linear zones, where the first zone served as the training dataset and the second zone was the test dataset, and vice versa. The portioning resulted in an inclusive distribution of landslide conditioning factor classes; the difference in the area of factor classes between the two zones is mainly less than 10%. The ROC curves show that the susceptibility models have good compatibility with the selected landslide conditioning factors and have high predictive accuracy. Model A with the highest AUC values (SRC = 0.92, PRC = 0.90) was submitted to DBKL for land use planning and development control. Retrospective revalidation reaffirmed the high predictive ability (AUC of PRC = 0.93) of the landslide susceptibility model. The findings indicates that the product is reliable for decision-making purposes, supporting local level hazard and risk mitigation efforts and better ground prediction in future city development The authors suggest future work to be done using other established methods where comparison of the findings can be done, as data acquisition of landslide occurrences and precipitation data within the study area improves.

Supplementary Materials

The following supporting information can be downloaded at: https://www.mdpi.com/article/10.3390/app13020768/s1, Table S1: (a) The weights of the 14 landslide conditioning factors. Only the first seven factors were used in model 1. (b) The weights for model A where all the 377 landslide points in zone A were used as the training dataset. (c) The weights for model B where all the 274 landslide points in zone B were used as the training dataset. Table S2: Comparison of the area extent of the landslide conditioning factor classes in zone A and zone B.

Author Contributions

Funding acquisition, J.J.P.; resources, J.J.P.; conceptualisation, T.F.N., E.A., V.J.B. and F.A.; data collection (2014 landslide inventory), F.A.; field investigation, E.A. and T.F.N.; data analysis, E.A.; writing, E.A., T.F.N. and J.J.P.; editing, T.F.N., J.J.P. and V.J.B. All authors have read and agreed to the published version of the manuscript.

Funding

The authors would like to thank the Newton-Ungku Omar Fund (Application ID: 59348-455144, UM Project No. IF002–2017, UKM Project No. XX-2017-002) for supporting this research.

Institutional Review Board Statement

Not applicable.

Informed Consent Statement

Not applicable.

Data Availability Statement

The datasets generated during and analysed are available from the corresponding author on reasonable request.

Acknowledgments

The authors would like to thank the Editor for the opportunity to be part of this special issue. The assistance of project members from multiple institutions is gratefully acknowledged.

Conflicts of Interest

The authors declare no conflict of interests.

References

  1. IPCC. Summary for Policymakers. In Climate Change 2021: The Physical Science Basis. Contribution of Working Group I to the Sixth Assessment Report of the Intergovernmental Panel on Climate Change; Masson-Delmotte, V., Zhai, P., Pirani, A., Connors, S., Péan, C., Berger, S., Caud, N., Chen, Y., Goldfarb, L., Gomis, M., et al., Eds.; Cambridge University Press: Cambridge, UK, 2021. [Google Scholar]
  2. Froude, M.J.; Petley, D.N. Global fatal landslide occurrence from 2004 to 2016. Nat. Hazard Earth Sys. 2018, 18, 2161–2181. [Google Scholar] [CrossRef] [Green Version]
  3. Douglas, I. The urban environment in southeast Asia. In The Physical Geography of Southeast Asia; Gupta, A., Ed.; Oxford University Press: Oxford, UK, 2005; pp. 314–334. [Google Scholar]
  4. Gariano, S.L.; Guzzetti, F. Landslides in a changing climate. Earth Sci. Rev. 2016, 162, 227–252. [Google Scholar] [CrossRef] [Green Version]
  5. Reichenbach, P.; Rossi, M.; Malamud, B.D.; Mihir, M.; Guzzetti, F. A review of statistically-based landslide susceptibility models. Earth Sci. Rev. 2018, 180, 60–91. [Google Scholar] [CrossRef]
  6. Soeters, R.; Van Westen, C. Slope instability recognition, analysis and zonation. In Landslides: Investigation and Mitigation. Special Report No. 247. Transportation Research Board National Research Council; Turner, K., Schuster, R., Eds.; National Academy Press: Washington, DC, USA, 1996; Volume 247, pp. 129–177. [Google Scholar]
  7. Gaidzik, K.; Ramírez-Herrera, M.T. The importance of input data on landslide susceptibility mapping. Sci. Rep. 2021, 11, 19334. [Google Scholar] [CrossRef] [PubMed]
  8. Hearn, G.; Hart, A. Landslide susceptibility mapping: A practitioner’s view. Bull. Eng. Geol. Environ. 2019, 78, 5811–5826. [Google Scholar] [CrossRef]
  9. Daniel, M.T.; Ng, T.F.; Kadir, A.; Farid, M.; Pereira, J.J. Landslide Susceptibility Modeling Using a Hybrid Bivariate Statistical and Expert Consultation Approach in Canada Hill, Sarawak, Malaysia. Front. Earth Sci. 2021, 9, 71. [Google Scholar] [CrossRef]
  10. Bordoni, M.; Galanti, Y.; Bartelletti, C.; Persichillo, M.G.; Barsanti, M.; Giannecchini, R.; Avanzi, G.D.A.; Cevasco, A.; Brandolini, P.; Galve, J.P.; et al. The influence of the inventory on the determination of the rainfall-induced shallow landslides susceptibility using generalized additive models. Catena 2020, 193, 104630. [Google Scholar] [CrossRef]
  11. Merghadi, A.; Yunus, A.P.; Dou, J.; Whiteley, J.; ThaiPham, B.; Bui, D.T.; Avtar, R.; Abderrahmane, B. Machine learning methods for landslide susceptibility studies: A comparative overview of algorithm performance. Earth Sci. Rev. 2020, 207, 103225. [Google Scholar] [CrossRef]
  12. Van Westen, C.; Rengers, N.; Soeters, R. Use of geomorphological information in indirect landslide susceptibility assessment. Nat Hazards 2003, 30, 399–419. [Google Scholar] [CrossRef]
  13. Chung, C.-J.; Fabbri, A.G. Validation of spatial prediction models for landslide hazard mapping. Nat Hazards 2003, 30, 451–472. [Google Scholar] [CrossRef]
  14. Chung, C.-J.; Fabbri, A.G. Predicting landslides for risk analysis—Spatial models tested by a cross-validation technique. Geomorphology 2008, 94, 438–452. [Google Scholar] [CrossRef]
  15. Remondo, J.; Gonzalez, A.; De Teran, J.R.D.; Cendrero, A.; Fabbri, A.; Chung, C.J.F. Validation of landslide susceptibility maps; Examples and applications from a case study in northern Spain. Nat Hazards 2003, 30, 437–449. [Google Scholar] [CrossRef]
  16. Corominas, J.; van Westen, C.; Frattini, P.; Cascini, L.; Malet, J.P.; Fotopoulou, S.; Catani, F.; Van Den Eeckhaut, M.; Mavrouli, O.; Agliardi, F.; et al. Recommendations for the quantitative analysis of landslide risk. Bull. Eng. Geol. Environ. 2014, 73, 209–263. [Google Scholar] [CrossRef] [Green Version]
  17. Frattini, P.; Crosta, G.; Carrara, A. Techniques for evaluating the performance of landslide susceptibility models. Eng. Geol. 2010, 111, 62–72. [Google Scholar] [CrossRef]
  18. Fleuchaus, P.; Blum, P.; Wilde, M.; Terhorst, B.; Butscher, C. Retrospective evaluation of landslide susceptibility maps and review of validation practice. Environ. Earth Sci. 2021, 80, 485. [Google Scholar] [CrossRef]
  19. Deng, X.; Li, L.; Tan, Y. Validation of spatial prediction models for landslide susceptibility mapping by considering structural similarity. ISPRS Int. J. Geo-Inf. 2017, 6, 103. [Google Scholar] [CrossRef] [Green Version]
  20. Lee, S.; Ryu, J.-H.; Kim, L. Landslide susceptibility analysis and its verification using likelihood ratio, logistic regression, and artificial neural network models: Case study of Youngin, Korea. Landslides 2007, 4, 327–338. [Google Scholar] [CrossRef]
  21. Dornik, A.; Drăguţ, L.; Oguchi, T.; Hayakawa, Y.; Micu, M. Influence of sampling design on landslide susceptibility modeling in lithologically heterogeneous areas. Sci. Rep. 2022, 12, 2106. [Google Scholar] [CrossRef]
  22. NC3 Malaysia. Third National Communication and Second Biennial Update Report to the UNFCCC. Available online: https://unfccc.int/documents/182748 (accessed on 25 June 2022).
  23. Majid, N.; Taha, M.; Selamat, S. Historical landslide events in Malaysia 1993–2019. Indian J. Sci. Technol. 2020, 13, 3387–3399. [Google Scholar] [CrossRef]
  24. Alnaimat, A.; Choy, L.K.; Jaafar, M. An assessment of current practices on landslides risk management: A case of Kuala Lumpur territory. Geografia 2017, 13, 1–12. [Google Scholar]
  25. Saadatkhah, N.; Kassim, A.; Lee, L.M.; Rahnamarad, J. Spatiotemporal regional modeling of rainfall-induced slope failure in Hulu Kelang, Malaysia. Environ. Earth Sci. 2015, 73, 8425–8441. [Google Scholar] [CrossRef]
  26. Gariano, S.L.; Rianna, G.; Petrucci, O.; Guzzetti, F. Assessing future changes in the occurrence of rainfall-induced landslides at a regional scale. Sci. Total Environ. 2017, 596–597, 417–426. [Google Scholar] [CrossRef] [PubMed]
  27. Sameen, M.I.; Pradhan, B.; Bui, D.T.; Alamri, A.M. Systematic sample subdividing strategy for training landslide susceptibility models. Catena 2020, 187, 104358. [Google Scholar] [CrossRef]
  28. Sulaiman, M.S.; Nazaruddin, A.; Salleh, N.M.; Abidin, R.Z.; Miniandi, N.D.; Yusoff, A.H. Landslide occurrences in Malaysia based on soil series and lithology factors. Int. J. Adv. Sci. Technol. 2019, 28, 1–26. [Google Scholar]
  29. Althuwaynee, O.F.; Pradhan, B.; Mahmud, A.R.; Yusoff, Z.M. Prediction of Slope Failures Using Bivariate Statistical Based Index of Entropy Model. In Proceedings of the 2012 IEEE Colloquium on Humanities, Science & Engineering Research (CHUSER), Kota Kinabalu, Malaysia, 3–4 December 2012; pp. 362–367. [Google Scholar]
  30. Althuwaynee, O.F.; Pradhan, B. Semi-quantitative landslide risk assessment using GIS-based exposure analysis in Kuala Lumpur City. Geomat. Nat. Haz. Risk. 2017, 8, 706–732. [Google Scholar] [CrossRef] [Green Version]
  31. Saadatkhah, N.; Kassim, A.; Lee, L.M.; Yunusa, G.H. Quantitative hazard analysis for landslides in Hulu Kelang area, Malaysia. Jurnal Teknologi 2015, 73. [Google Scholar] [CrossRef] [Green Version]
  32. Elmahdy, S.I.; Mostafa, M.M. Natural hazards susceptibility mapping in Kuala Lumpur, Malaysia: An assessment using remote sensing and geographic information system (GIS). Geomat. Nat. Haz. Risk. 2013, 4, 71–91. [Google Scholar] [CrossRef]
  33. Mahmud, A.R.; Awad, A.; Billa, R. Landslide susceptibility mapping using averaged weightage score and GIS: A case study at Kuala Lumpur. Pertanika J. Sci. Technol. 2013, 21, 473–486. [Google Scholar]
  34. Sezer, E.A.; Pradhan, B.; Gokceoglu, C. Manifestation of an adaptive neuro-fuzzy model on landslide susceptibility mapping: Klang valley, Malaysia (vol 38, pg 8208, 2011). Expert Syst. Appl. 2013, 40, 2360. [Google Scholar] [CrossRef]
  35. Pradhan, B.; Lee, B.; Buchroithner, M.F. Remote Sensing and GIS-based Landslide Susceptibility Analysis and its Cross-validation in Three Test Areas Using a Frequency Ratio Model. Photogramm. Fernerkun. 2010, 1, 17–32. [Google Scholar] [CrossRef]
  36. Pradhan, B. Remote sensing and GIS-based landslide hazard analysis and cross-validation using multivariate logistic regression model on three test areas in Malaysia. Adv. Space. Res. 2010, 45, 1244–1256. [Google Scholar] [CrossRef]
  37. Jamaluddin, T. Human factors and slope failures in Malaysia. Bull. Geol. Soc. Malays. 2006, 52, 75–84. [Google Scholar] [CrossRef]
  38. Tan, B.K.; Komoo, I. Urban geology: Case study of Kuala Lumpur, Malaysia. Eng. Geol. 1990, 28, 71–94. [Google Scholar] [CrossRef]
  39. Leslie, A.G.; Dobbs, M.R.; Fatt, N.T.; Rosle, Q.A.; Noh, M.R.M.; Dodd, T.J.; Gillespie, M.R. The Ukay Perdana Shear Zone in Kuala Lumpur: A crustal-scale marker of early Jurassic orogenic deformation in Peninsular Malaysia. Bull. Geol. Soc. Malays. 2020, 69, 135–147. [Google Scholar] [CrossRef]
  40. Tian, B.; Wang, L.; Koike, K. Spatial statistics of surface roughness change derived from multi-scale digital elevation models. Procedia Environ. Sci. 2011, 7, 252–257. [Google Scholar] [CrossRef] [Green Version]
  41. De Reu, J.; Bourgeois, J.; Bats, M.; Zwertvaegher, A.; Gelorini, V.; De Smedt, P.; Chu, W.; Antrop, M.; De Maeyer, P.; Finke, P.; et al. Application of the topographic position index to heterogeneous landscapes. Geomorphology 2013, 186, 39–49. [Google Scholar] [CrossRef]
  42. Gallant, J.; Wilson, J. Primary topographic attributes. In Terrain Analysis: Principles and Applications; Wilson, J., Gallant, J., Eds.; Wiley: New York, NY, USA, 2000; pp. 51–85. [Google Scholar]
  43. Beven, K.J.; Kirkby, M.J. A physically based, variable contributing area model of basin hydrology. Hydrol. Sci. B 1979, 24, 43–69. [Google Scholar] [CrossRef] [Green Version]
  44. Paramananthan, S.; Muhamad, N.; Pereira, J.J. Soil related factors controlling erosion and landslides in Malaysia. Bull. Geol. Soc. Malays. 2021, 72, 165–175. [Google Scholar]
  45. Dai, F.C.; Lee, C.F. Landslide characteristics and slope instability modeling using GIS, Lantau Island, Hong Kong. Geomorphology 2002, 42, 213–228. [Google Scholar] [CrossRef]
  46. Yusof, N.M.; Pradhan, B. Landslide susceptibility mapping along PLUS expressways in Malaysia using probabilistic based model in GIS. IOP Conf. Ser. Earth Environ. Sci. 2014, 20, 012031. [Google Scholar] [CrossRef] [Green Version]
  47. Yalcin, A. GIS-based landslide susceptibility mapping using analytical hierarchy process and bivariate statistics in Ardesen (Turkey): Comparisons of results and confirmations. Catena 2008, 72, 1–12. [Google Scholar] [CrossRef]
  48. Althuwaynee, O.F.; Pradhan, B.; Lee, S. Application of an evidential belief function model in landslide susceptibility mapping. Comput. Geosci. 2012, 44, 120–135. [Google Scholar] [CrossRef]
  49. Jebur, M.N.; Pradhan, B.; Tehrany, M.S. Optimization of landslide conditioning factors using very high-resolution airborne laser scanning (LiDAR) data at catchment scale. Remote Sens. Environ. 2014, 152, 150–165. [Google Scholar] [CrossRef]
  50. Pourghasemi, H.; Moradi, H.; Fatemi Aghda, S.; Gokceoglu, C.; Pradhan, B. GIS-based landslide susceptibility mapping with probabilistic likelihood ratio and spatial multi-criteria evaluation models (North of Tehran, Iran). Arab. J. Geosci. 2014, 7, 1857–1878. [Google Scholar] [CrossRef]
  51. Guzzetti, F.; Carrara, A.; Cardinali, M.; Reichenbach, P. Landslide hazard evaluation: A review of current techniques and their application in a multi-scale study, Central Italy. Geomorphology 1999, 31, 181–216. [Google Scholar] [CrossRef]
  52. Carrara, A. Multivariate models for landslide hazard evaluation. J. Int. Assoc. Math. Geol. 1983, 15, 403–426. [Google Scholar] [CrossRef]
  53. Van Westen, C. Statistical landslide hazard analysis, ILWIS 2.1 For Windows Application Guide. ITC Publ. Enschede 1997, 2, 73–84. [Google Scholar]
  54. Fell, R.; Corominas, J.; Bonnard, C.; Cascini, L.; Leroi, E.; Savage, W.Z.; Eng, J.-J.T.C.L. Guidelines for landslide susceptibility, hazard and risk zoning for land-use planning Commentary. Eng. Geol. 2008, 102, 99–111. [Google Scholar] [CrossRef] [Green Version]
  55. Flentje, P.N.; Miner, A.; Whitt, G.; Fell, R. Guidelines for landslide Susceptibility, Hazard and Risk Zoning for Land Use Planning. Available online: https://ro.uow.edu.au/engpapers/2823 (accessed on 25 January 2021).
  56. Regmi, N.R.; McDonald, E.V.; Giardino, J.R.; Vitek, J.D. A comparison of logistic regression-based models of susceptibility to landslides in western Colorado, USA. Landslides 2014, 11, 247–262. [Google Scholar] [CrossRef]
  57. Department of Statistics Malaysia. Key Findings: Population and Housing Census of Malaysia 2020; Department of Statistics Malaysia: Putrajaya, Malaysia, 2020; pp. 86–87.
  58. Wu, Y.-m.; Lan, H.-x.; Gao, X.; Li, L.-p.; Yang, Z.-h. A simplified physically based coupled rainfall threshold model for triggering landslides. Eng. Geol. 2015, 195, 63–69. [Google Scholar] [CrossRef]
  59. Luca, D.L.D.; Versace, P. A General Formulation to Describe Empirical Rainfall Thresholds for Landslides. Procedia Earth Planet. Sci. 2016, 16, 98–107. [Google Scholar] [CrossRef]
Figure 1. Geological map of the Kuala Lumpur area. The city of Kuala Lumpur is located within the Selangor state, in central-west Peninsular Malaysia.
Applsci 13 00768 g001
Figure 2. Seven landslide conditioning factors were selected according to the steps highlighted in the flow chart (a). The factors are surface geology (b), slope gradient (c), and elevation (d).
Applsci 13 00768 g002
Figure 3. Map of the landslide conditioning factors on distance to lineaments (a), distance to roads (b), topographic position index (c), and surface roughness (d).
Applsci 13 00768 g003
Figure 4. (a) Landslide susceptibility map of model 1, where all the landslide points in the 2014 inventory were used to generate the model. (b) Landslide susceptibility map of model A, where landslides in zone A were used as training dataset and landslides in zone B as test dataset. (c) Landslide susceptibility map of model B where landslides in zone B were used as training dataset and landslides in zone A as test dataset. (d) Landslides occurred in 2021 that were used for retrospective validation are plotted on model A.
Applsci 13 00768 g004
Figure 5. (a) ROC curves of spatial model evaluation and validation with associated AUC values for model 1, model A, and model B. (b) ROC curves of retrospective validation with associated AUC values for the same models.
Applsci 13 00768 g005
Figure 6. Population density map of Kuala Lumpur at district level based on 2020 census data.
Applsci 13 00768 g006
Table 1. Landslide conditioning factors and their definition as used in the bivariate statistical analysis.
No.Landslide Conditioning FactorsDefinitionSource
1Topographic Position Index (TPI)Relative slope position or landform category based on relative relief valuesDTM
2Slope GradientDegree of inclination of the slopeDTM
3Distance to LineamentDistance to fault and lineament in metresDTM, air photo
4Distance to RoadDistance to major roads in metresDBKL road map
5Surface GeologyRecent material deposit on the groundTopographic map, geological map, air photo and borehole
6ElevationHeight above sea levelDTM
7Surface RoughnessDegree of variation of surface elevationDTM
Disclaimer/Publisher’s Note: The statements, opinions and data contained in all publications are solely those of the individual author(s) and contributor(s) and not of MDPI and/or the editor(s). MDPI and/or the editor(s) disclaim responsibility for any injury to people or property resulting from any ideas, methods, instructions or products referred to in the content.

