Article

A Modeling Design Method for Complex Products Based on LSTM Neural Network and Kansei Engineering

1
School of Wedding Culture & Media Arts, Beijing College of Social Administration, Beijing 102600, China
2
School of Mechanical Engineering, Tiangong University, Tianjin 300387, China
3
School of Literature, Nankai University, Tianjin 300371, China
4
School of Mechanical Engineering, Tianjin University, Tianjin 300350, China
*
Author to whom correspondence should be addressed.
Appl. Sci. 2023, 13(2), 710; https://doi.org/10.3390/app13020710
Submission received: 19 October 2022 / Revised: 22 November 2022 / Accepted: 6 December 2022 / Published: 4 January 2023
(This article belongs to the Special Issue Affective Computing and Recommender Systems)

Abstract

:

Featured Application

The proposed CP-KEDL system is supposed to evaluate and predict users’ perceptual preferences of complex products accurately and comprehensively and quickly generate a set of modeling feature elements that meet the perceptual needs of users to provide design inspiration for complex products for designers.

Abstract

Complex products (CPs) modeling design has a long development cycle and high cost, and it is difficult to accurately meet the needs of enterprises and users. At present, the Kansei Engineering (KE) method based on back-propagated (BP) neural networks is applied to solve the modeling design problem that meets users’ affective preferences for simple products quickly and effectively. However, the modeling feature data of CPs have a wide range of dimensions, long parameter codes, and the characteristics of time series. As a result, it is difficult for BP neural networks to recognize the affective preferences of CPs from an overall visual perception level as humans do. To address the problems above and assist designers with efficient and high-quality design, a CP modeling design method based on Long Short-Term Memory (LSTM) neural network and KE (CP-KEDL) was proposed. Firstly, the improved MA method was carried out to transform the product modeling features into feature codes with sequence characteristics. Secondly, the mapping model between perceptual images and modeling features was established based on the LSTM neural network to predict the evaluation value of the product’s perceptual images. Finally, the optimal feature sets were calculated by a Genetic Algorithm (GA). The experimental results show that the MSE of the LSTM model is only 0.02, whereas the MSE of the traditional Deep Neural Networks (DNN) and Convolutional Neural Networks (CNN) neural network models are 0.30 and 0.23, respectively. The results verified that the proposed method can effectively grapple with the CP modeling design problem with the timing factor, improve design satisfaction and shorten the R&D cycle of CP industrial design.

1. Introduction

Complex products (CPs), such as aircraft and automobiles, are products that involve complex structures and technologies and complex development, manufacturing and service processes [1,2]. It is necessary to meet the needs of specific users, the diversity of product structure, and product design innovation during the design process [3]. Currently, research on CP design mainly focuses on the mechanical structure. For example, Zhang et al. applied complex network theory and proposed an improved GN algorithm (crowd detection algorithm) to achieve the module division of complex mechanical products [4]. Xue et al. introduced a new CP optimization design framework based on three aspects, modeling, simulation, and optimization. This design framework can effectively determine the optimal design structure configuration and optimal functional parameter values of CPs [5]. Wang et al. proposed a design optimization method for CPs, which can improve the design optimization efficiency based on Multidisciplinary Design Optimization (MDO) technology [6]. Nevertheless, there are few studies on CP modeling design, which mainly focus on appearance design innovation. For example, Zhu et al. proposed a method for the appearance design of Numerical Control (NC) equipment based on product identification [7]. Chen et al. proposed a novel method for the appearance design of mechanical and electrical products based on entity pattern genes [8]. However, the above methods failed to take affective factors into account in the design process of CPs and are not suitable for the affective design of CPs.
As the economy evolves, customers pay more attention to affective experience than functional performance and usability when purchasing and using products [9]. Users’ affective experiences are closely related to their perceptual needs for CPs [10,11]. Compared with simple products, the design of CPs has a longer cycle [12] and a higher cost [13]. Moreover, it is difficult to effectively meet the perceptual needs of enterprises and users [14]. Therefore, it is a challenge for industrial designers to quickly and efficiently perform CP modeling design that meets the perceptual needs of enterprises and users.
Kansei Engineering (KE) [15] has been widely used as a quantitative analysis method for affective design and new product development. KE has three core modules: acquisition of perceptual requirements, the establishment of the mapping models between modeling features and perceptual images, and design execution [16]. Among them, the mapping model between the product modeling features and the perceptual images is the key to affective designs [17]. Based on these mapping models, GAs [18], Tabu search (TS) algorithm [19], NSGA-II [20], and other methods can be carried out to quickly and effectively obtain the recommendation strategy of innovative modeling design that meet the perceptual needs of enterprises and users. In addition, the mapping models are also the basis for building an emotion preference computing and recommendation systems [21]. For example, Hong et al. proposed a mapping models of Kansei knowledge and emotional color image words to help designers and consumers to obtain the most appropriate color ranges of consumer products [22]. Xue et al. established a user-personalized clothing-recommendation system through the relationship model between emotional vocabulary and clothing elements to improve the recommendation accuracy [23]. Zhang et al. proposed a new fashion evaluation method on the basis of the appearance to build a clothing-recommendation system with higher accuracy [24]. Using online product click data and offline product sales data to reflect customers’ online and offline preferences, Hwangbo et al. built a recommendation system to improve product sales and website click rates [25]. The above studies inspire us by building relationship mapping models between user emotional preferences and design elements, and user emotion-aware recommender systems can be established to estimate user emotional preferences, recommend satisfactory products to users, and provide product development strategies that meet the users’ preference to designers.
There are two different types of KE methods applied to established the mapping models. The first one includes methods based on statistical theory, such as polynomial regression (PR), support vector (SVR), etc. For example, Yu et al. evaluated the product perceptual value through PR [26]. Fan et al. applied SVR to establish the mapping models between user emotion and car contour and achieved good results in a specific dimension [27]. This type of method has good interoperability but still has the following shortcomings: poor model performance and low generalization when dealing with complex multi-dimensional features and ignoring the multi-dimensional variables and potential nonlinear relationships in product perceptual images [28]. Therefore, they were difficult to use to describe the multivariate mapping relationship between CP perceptual images and modeling parameters accurately.
The second type includes methods based on artificial intelligence (AI). By analyzing the features and structures of data, excavating the hidden information of data, and preserving the correlation among data, deep learning based on artificial neural networks can effectively solve the nonlinear problems among variables and deal with high-dimensional variables. For example, Guo et al. proposed an affective design method for a multi-dimensional variable based on the BP neural network, which can effectively grapple with the mapping relationship between short-sequence features and perceptual images [28]. Fu et al. constructed a Convolutional Neural Networks (CNN) neural network to establish the relationship mapping model between modeling features and perceptual images and achieve ideal results in processing a small number of feature data [29]. The above neural network can effectively establish the relationship model between perceptual images and the modeling features of simple products. However, CPs have complicated modeling features and a wide range of visual-influence factors [30], which are difficult to transform into deep learning data comprehensively and accurately. The methods above cannot recognize the affective preference of CPs from an overall visual perception level like human beings [31]. Therefore, establishing a mapping model between perceptual images and modeling features of CPs has become a challenge for designers.
A Long Short-Term Memory (LSTM) network is a variant of the cyclic neural network [32]. The connection among units of LSTM forms a directed cycle. The introduction of a gate structure enables the network to capture the long-term dependence and nonlinear modeling parameter characteristics between timing data points, which makes it excellent in processing timing characteristics [33]. Since users generate an overall perceptual cognition of CPs through continuous visual perception, it is crucial for computers to learn how to observe the continuous feature relationship of products like human eyes and establish an accurate correlation model between perceptual images and modeling features. To address the question mentioned above, regarding the acquisition of perceptual evaluation as a sequence problem based on the LSTM neural network and eye movement test, a modeling design method was proposed to establish a more comprehensive and effective relationship model between perceptual images and modeling features of CPs. This paper presents a proposed method that can meet users’ perceptual images more compressively and effectively based on the LSTM neural network and KE for the rapid modeling design of CPs (CP-KEDL).
The main contributions of this paper are summarized as follows:
(1) The CP-KEDL method is proposed, which combines KE and deep learning technology for innovative concept generation to effectively improve the affective design process of CPs. It has two core modules, the perceptual evaluation and recognition module of CPs based on an LSTM neural network and KE and a product-feature-optimization module based on a Genetic Algorithm (GA).
(2) Users’ perceptual image acquisition of CPs is regarded as a behavior with a visual sequence. It is proven that the user’s perceptual image acquisition of CPs is a continuous process, and the user’s visual tracking line of observing CPs is obtained through an eye-movement experiment. The modeling features of CPs are deconstructed by an improved morphological analysis (MA), which helps to solve the problem of the accurate extraction of modeling features.
(3) The proposed CP-KEDL method is applied to the design process of a truck crane to illustrate the method in detail and validate its feasibility and usefulness.
The rest of the paper is structured as follows. The overarching research framework is introduced in Section 2. The KE technique, the LSTM neural network, and the GA are discussed next. An empirical study of truck-crane affective design to demonstrate the feasibility and usefulness of the proposed method, as well as the relevant experimental data, is provided in Section 3. In Section 4, we introduced the DNN and CNN models to conduct comparative experiments, which verified that the proposed KE–LSTM model has better performance and reliability, and discussed the reasons. Finally, we present the research conclusions and contributions in Section 5 and pointed out the research limitations.

2. Methods

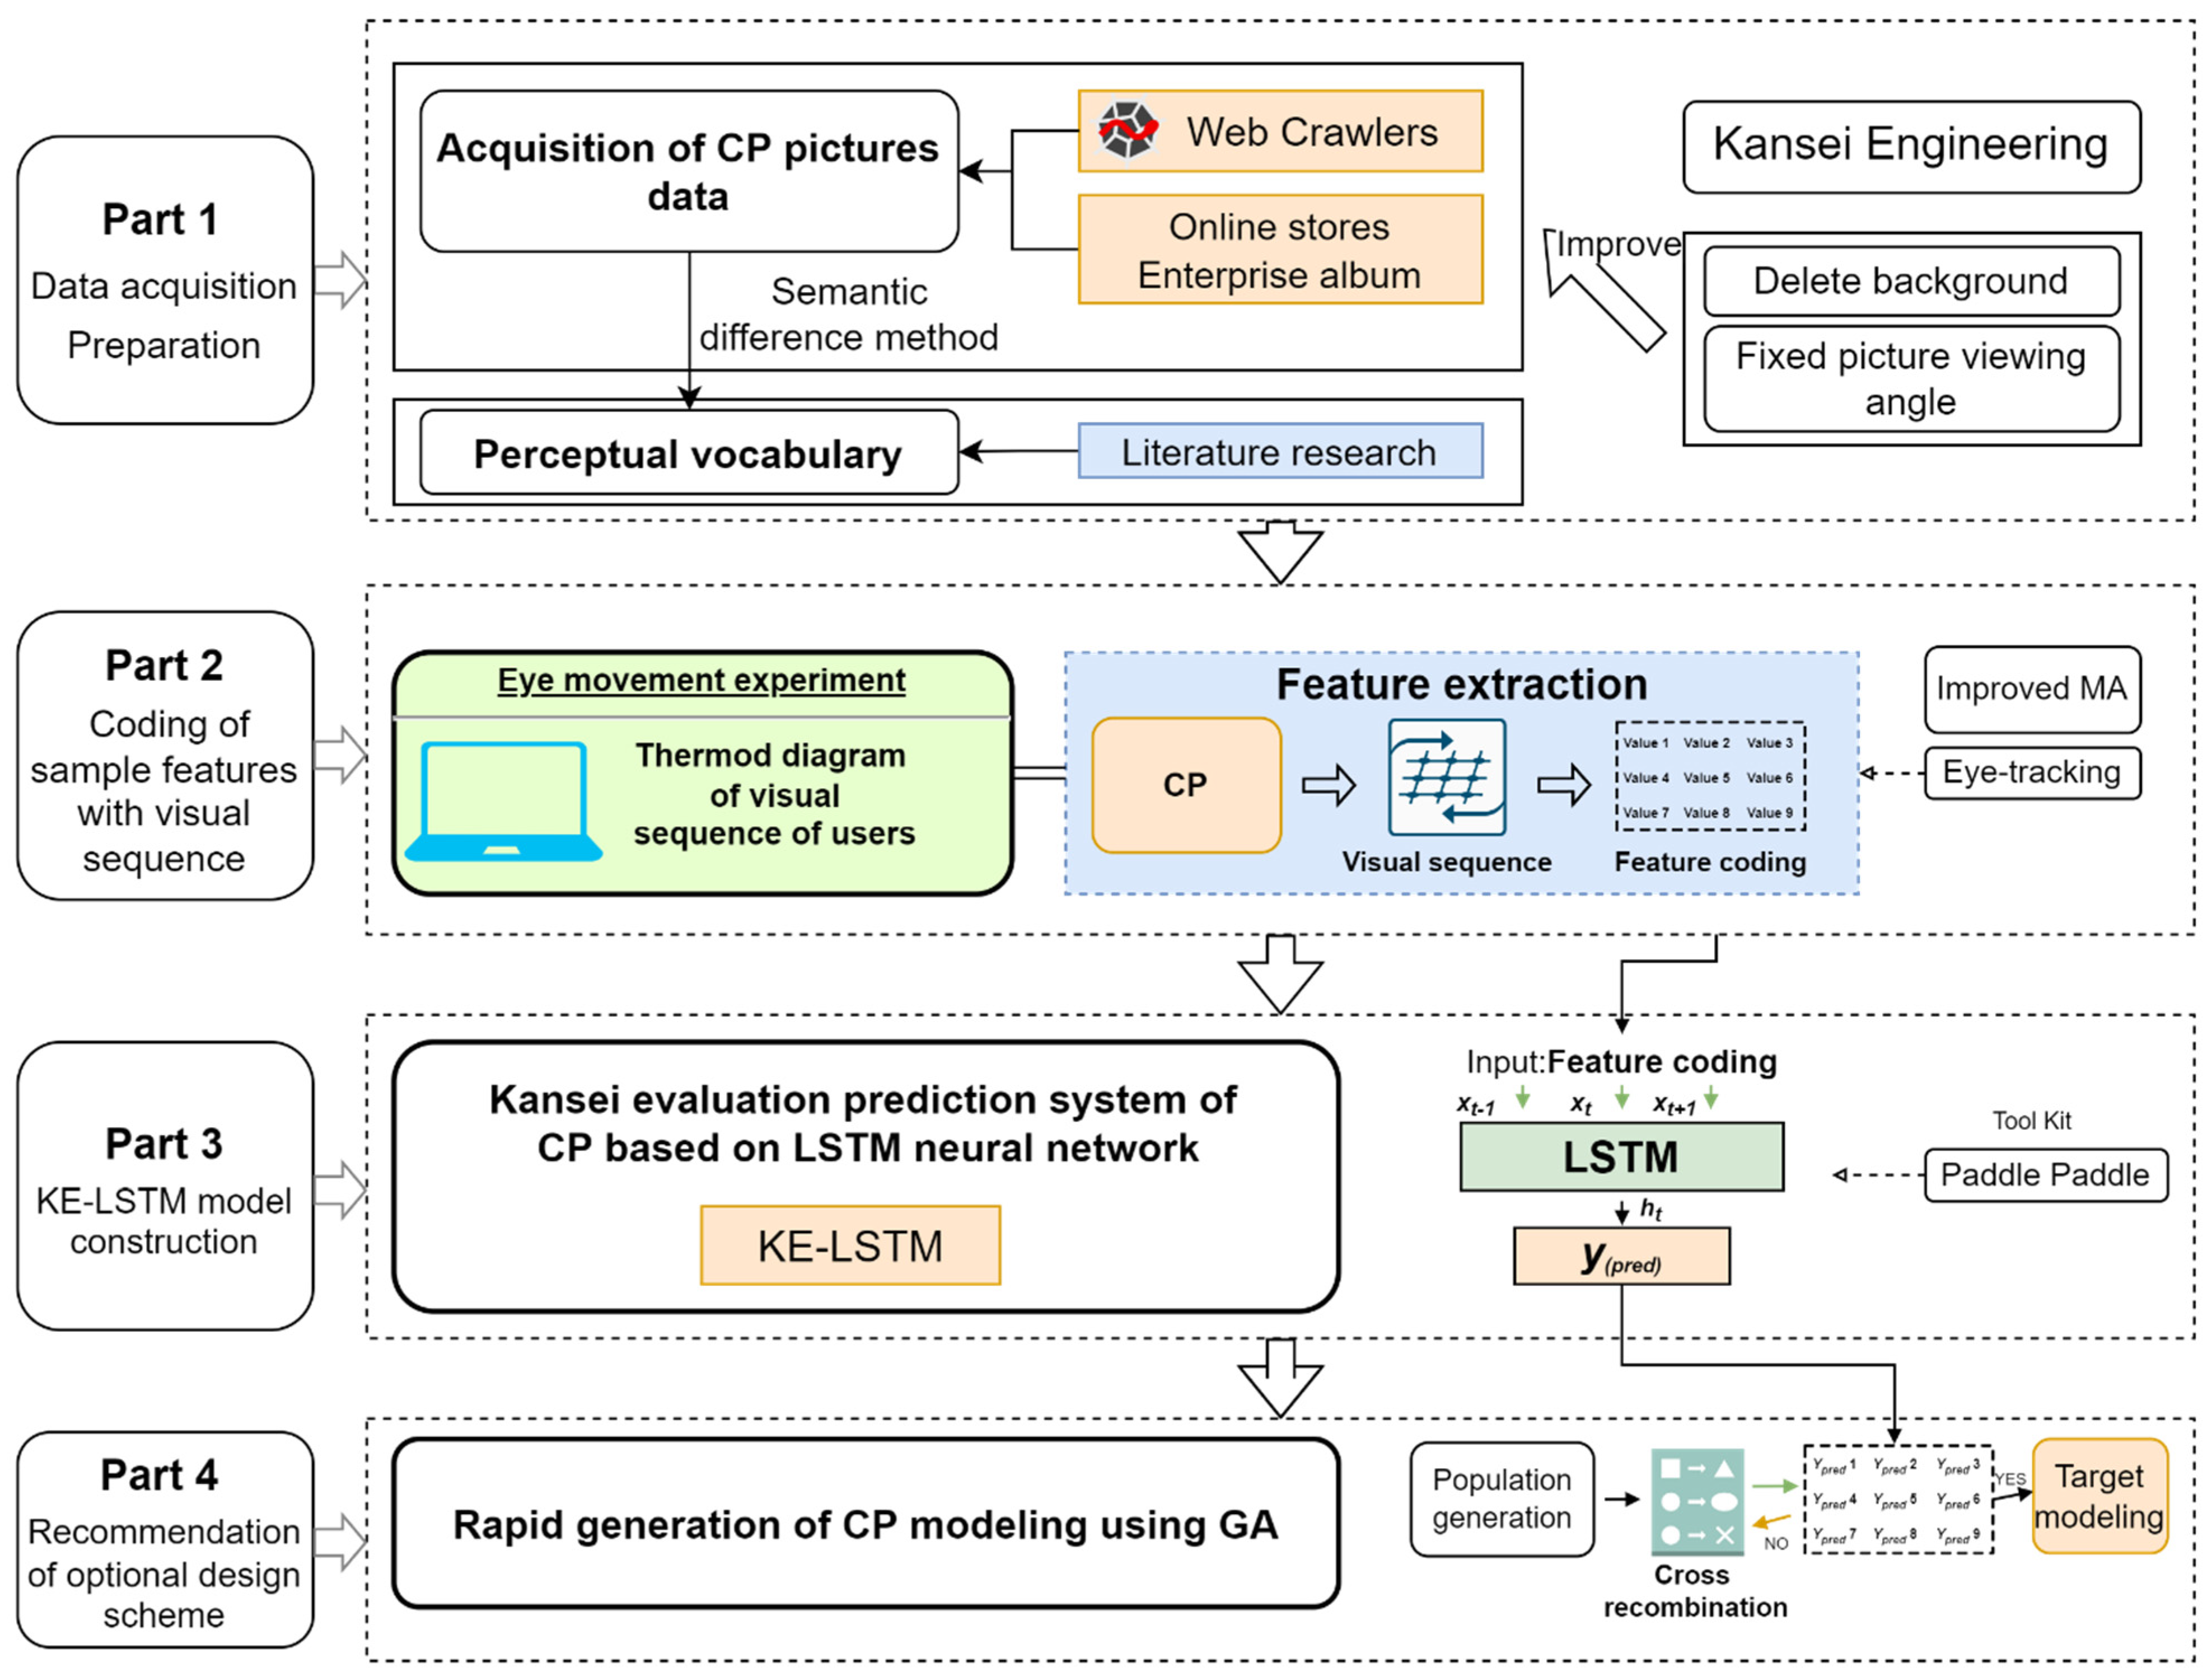
2.1. Research Framework

As shown in Figure 1, the proposed CP-KEDL method consists of four parts. The first part is data preparation, including the collection of product picture data and perceptual vocabulary pairs. The purpose is to achieve the original sample data of the target product and the user’s perceptual needs. At this step, product pictures are crawled from the target websites and the original data are preprocessed to obtain clean picture data. Based on this part, we can achieve clean and unified product images for perceptual evaluation and feature extraction. In the second part, aiming to obtain the appropriate data set, the user’s visual sequence when observing CPs is obtained through an eye-movement experiment, and the improved MA method is used to manually extract the sample features, including the sequence. In the third part, KE and LSTM neural networks are used construct the mapping model between the modeling features and the perceptual evaluations of CPs, which is named the KE–LSTM model. The model is trained with the perceptual evaluation data set to predict the perceptual evaluation value of CPs. In the fourth part, GA is applied to search the product-feature sets that meet the expected perceptual image evaluation value and to guide the modeling design practice for new products.

2.2. Acquisition of Sample Picture Data

Data is one of the three key components of artificial intelligence (big data, computing power, and algorithm). Moreover, KE needs a large number of samples to establish the mapping relationship models between modeling features and perceptual images. Previous works [28,34] have shown that extracting product features from high-quality picture data is more effective. However, few open-source datasets provide high-definition image data. To obtain high-quality image data, the original product pictures are collected from the target websites through web crawlers. In addition, the original pictures are processed by deleting the background and unifying the picture perspective with a 45-degree angle of view to avoid the influence of irrelevant features and to make it easier and more effective to extract product features.

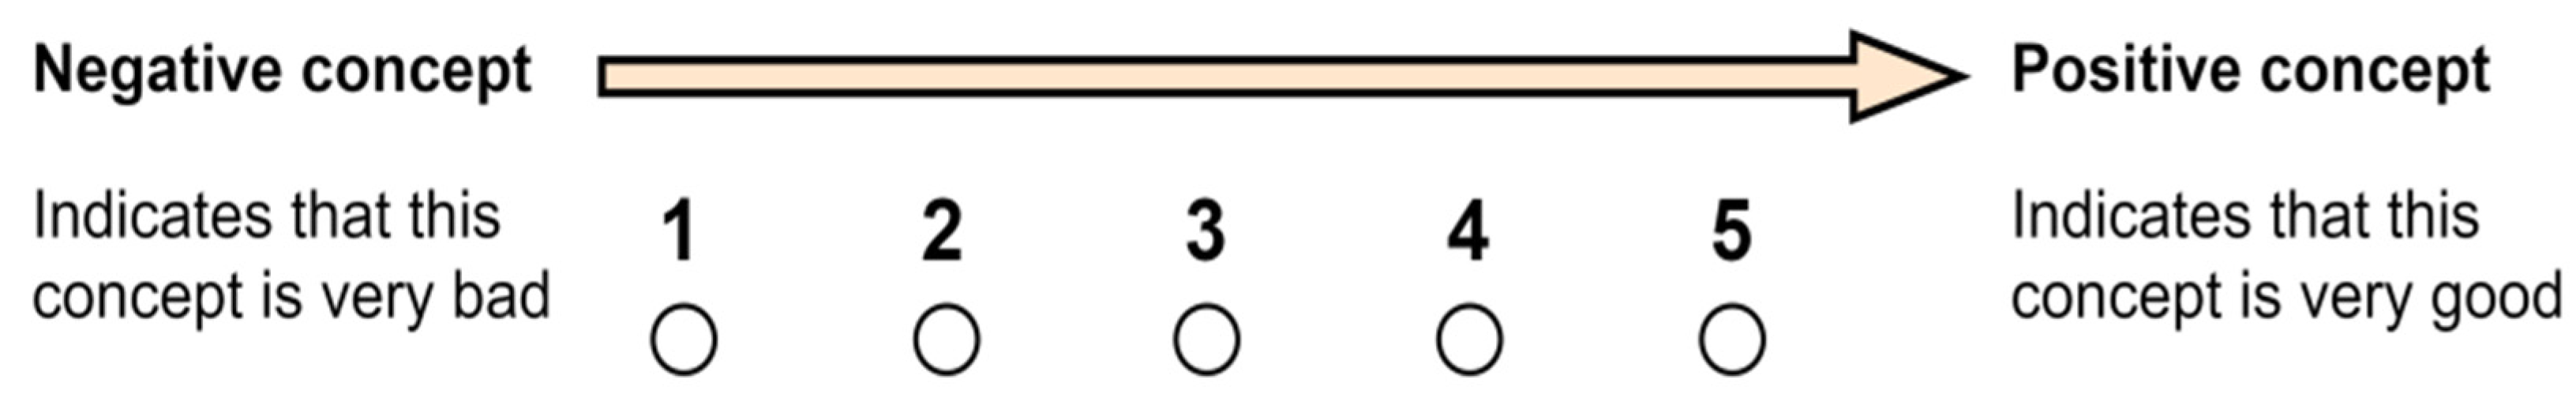
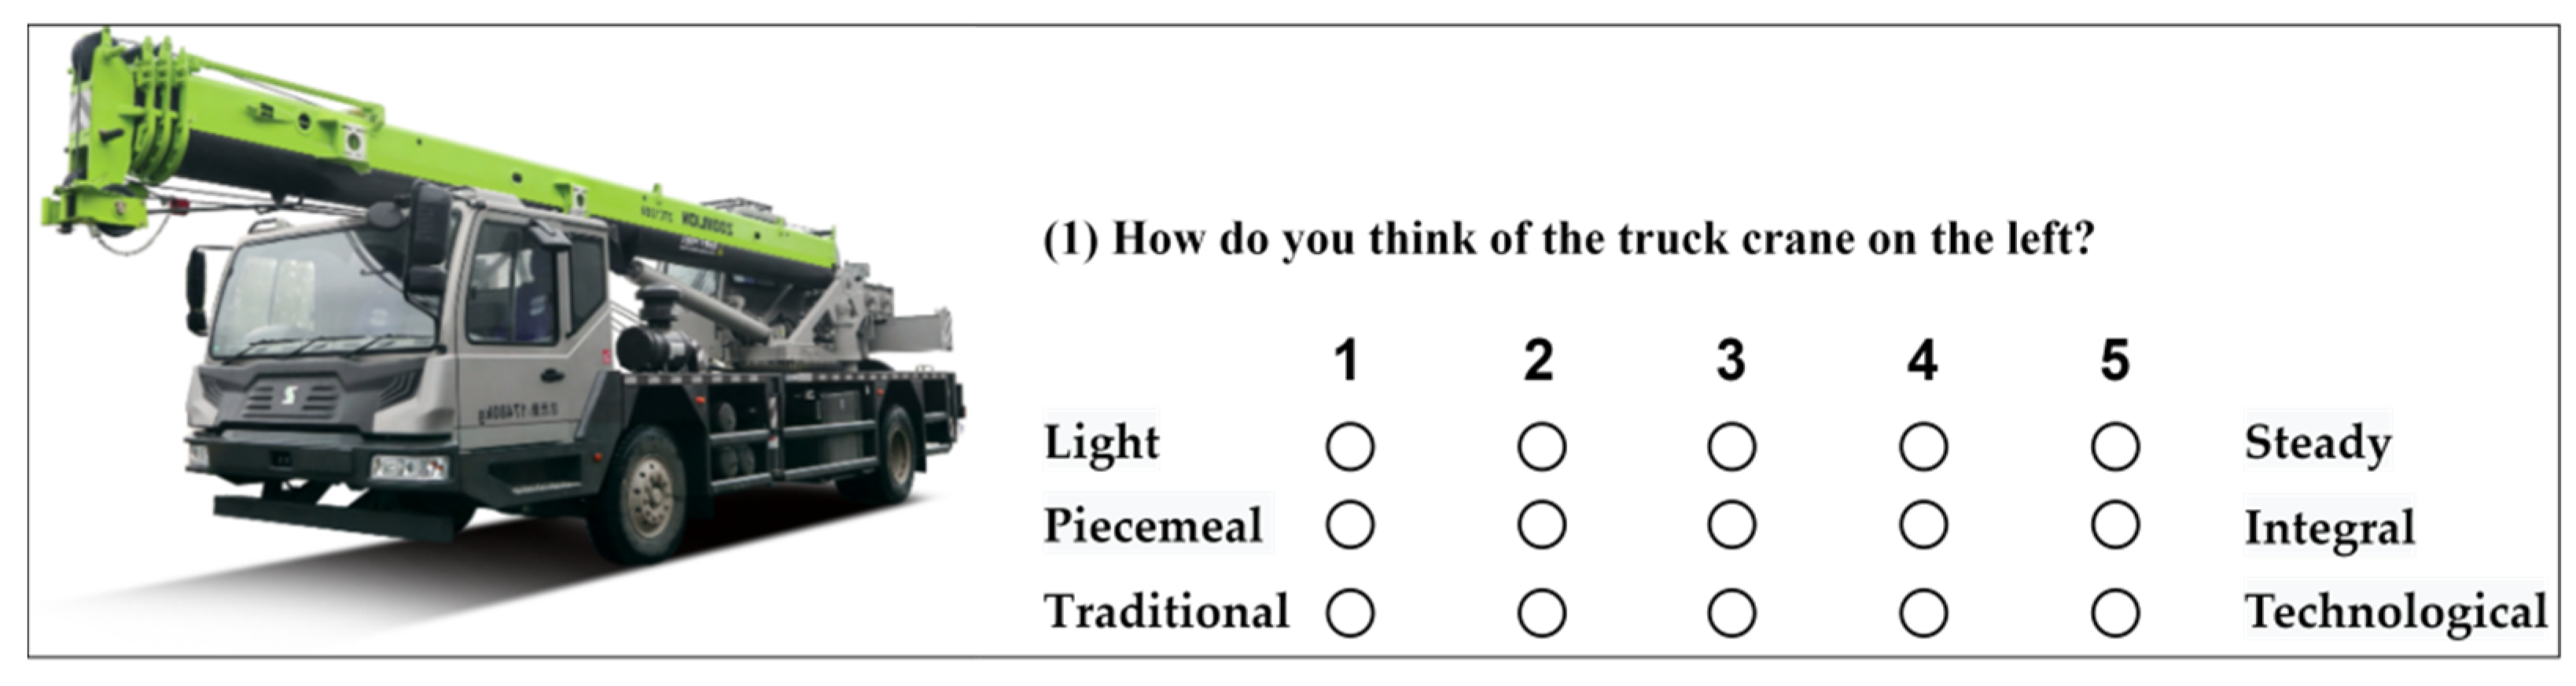
2.3. Acquisition of Perceptual Evaluation Data

The acquisition of perceptual evaluation data has two key parts, namely perceptual vocabulary collection and perceptual evaluation values collection.
Perceptual vocabularies are the adjectives used to describe people’s perceptual feelings. Perceptual vocabularies can be collected through various channels, such as magazines, academic papers, product test reports, product manuals, expert comments, user online comments, and customer interviews, etc. [35]. In addition, representative perceptual vocabularies can also be collected from relevant academic literature and the Internet.
Firstly, perceptual vocabularies are collected. Next, all collected perceptual vocabularies are clustered to obtain the affective preference attributes. This process is called perceptual clustering. In current research, the perceptual clustering methods for affective design are relatively mature, mainly including the clustering method based on fuzzy equivalence [35], the clustering method based on a design structure matrix (DSM) [36], and the clustering method based on a rough set [37]. Among those methods, the clustering research on the perceptual vocabularies of truck cranes is relatively rich, so our research uses the collected vocabularies that have been clustered in the relevant studies.
The semantic difference (SD) method [38] is applied to quantify users’ preference evaluations of CPs. As shown in Figure 2, a five-point semantic scale is used to quantify the affective preferences of participants: each point showing the preference level of customers and users, ranging from 1 to 5. For example, 1 and 5 represent a pair of bipolar adjectives, while 3 represents a medium level.
The Internet and smartphones have become indispensable parts of human lives. Distributing questionnaires via networks can greatly improve the efficiency and ensure the authenticity of the survey [31]. Based on the SD method, a questionnaire was constructed by combining the identified representative perceptual vocabulary pairs and the product representative pictures, and was distributed online. Finally, we obtain the users’ perceptual evaluation datasets.

2.4. Acquisition of Sample Feature Visual Sequence

MA is the most common method to parameterize product modeling in the manual extraction of product features. For example, Han et al. established the Unmanned Aerial Vehicle (UAV) model evaluation system using the KJ method (named for its inventor, Jiro Kawakita, and sometimes referred to as the affinity diagram method) and decomposed the UAV appearance, modeling it into three first-class indices: overall appearance, single piece, and detail [34]. Using MA, Wu et al. disassembled and encoded the form of an electric motorcycle and produced a product form design system based on a BP neural network [39]. However, there were complex relationships among the components of CPs [40]. Only using MA ignored the correlation between product morphological features and the relationship among product components.
To extract the modeling features of CPs more accurately and effectively, we propose an improved MA method based on an eye-movement experiment that is divided into two steps. In the first step, the users’ observation trace and thermal map of CPs are achieved, which proves that the user’s acquisition of perceptual images of CPs is a continuous visual behavior. Furthermore, the visual sequence is obtained through an analysis of the eye-movement tracking map. In the second step, the MA method is improved, and the product modeling feature data P = (PA, PC, PC…), (PA = Pa1, Pa2…) is combined with the visual sequence relationship obtained in the first step, as shown in Formulas (1) and (2).
P = ( p 1 , p 2 , p t , p T )
In Formula (1). P is the overall set of product modeling features; pt is the modeling feature set of a component, and t is the visual sequence number of the component when the user observing the CP.
p t = ( p 1 t , p 2 t , , p n t )
In Formula (2), pnt is the specific modeling feature of pt.

2.5. Coding of Samples’ Modeling Features

Based on the formulas in Section 2.4, we can define the coding principle of the CP modeling feature set including visual sequence, extract the modeling features, and obtain a high-quality training data set for the model establishment in the next stage. The modeling feature extraction work is conducted by experienced designers.
When extracting the modeling features, we found that some modeling features appear repeatedly, which strengthened the users’ visual experience and accelerated their visual perception process. This is in line with the law of rhythm in industrial design [41]. This discovery was exciting and gave us great confidence in the manual extraction of CP modeling features based on MA. In the proposed research, a method for the coding of modeling features with the visual sequence is proposed. Firstly, we identify the users’ visual sequence and key modeling features of CPs through eye-movement experiments and manual extraction to establish the model-features set. Each sample consists of the modeling features in the set. When a sample has repetitive features, we use the same feature code to represent the relationship. Secondly, according to Formulas (1) and (2), the modeling features of each sample are transformed into feature codes. An improved modeling feature set of CPs is constructed after the two steps, which is the basis of the product perceptual evaluation prediction and population generation in the following steps.

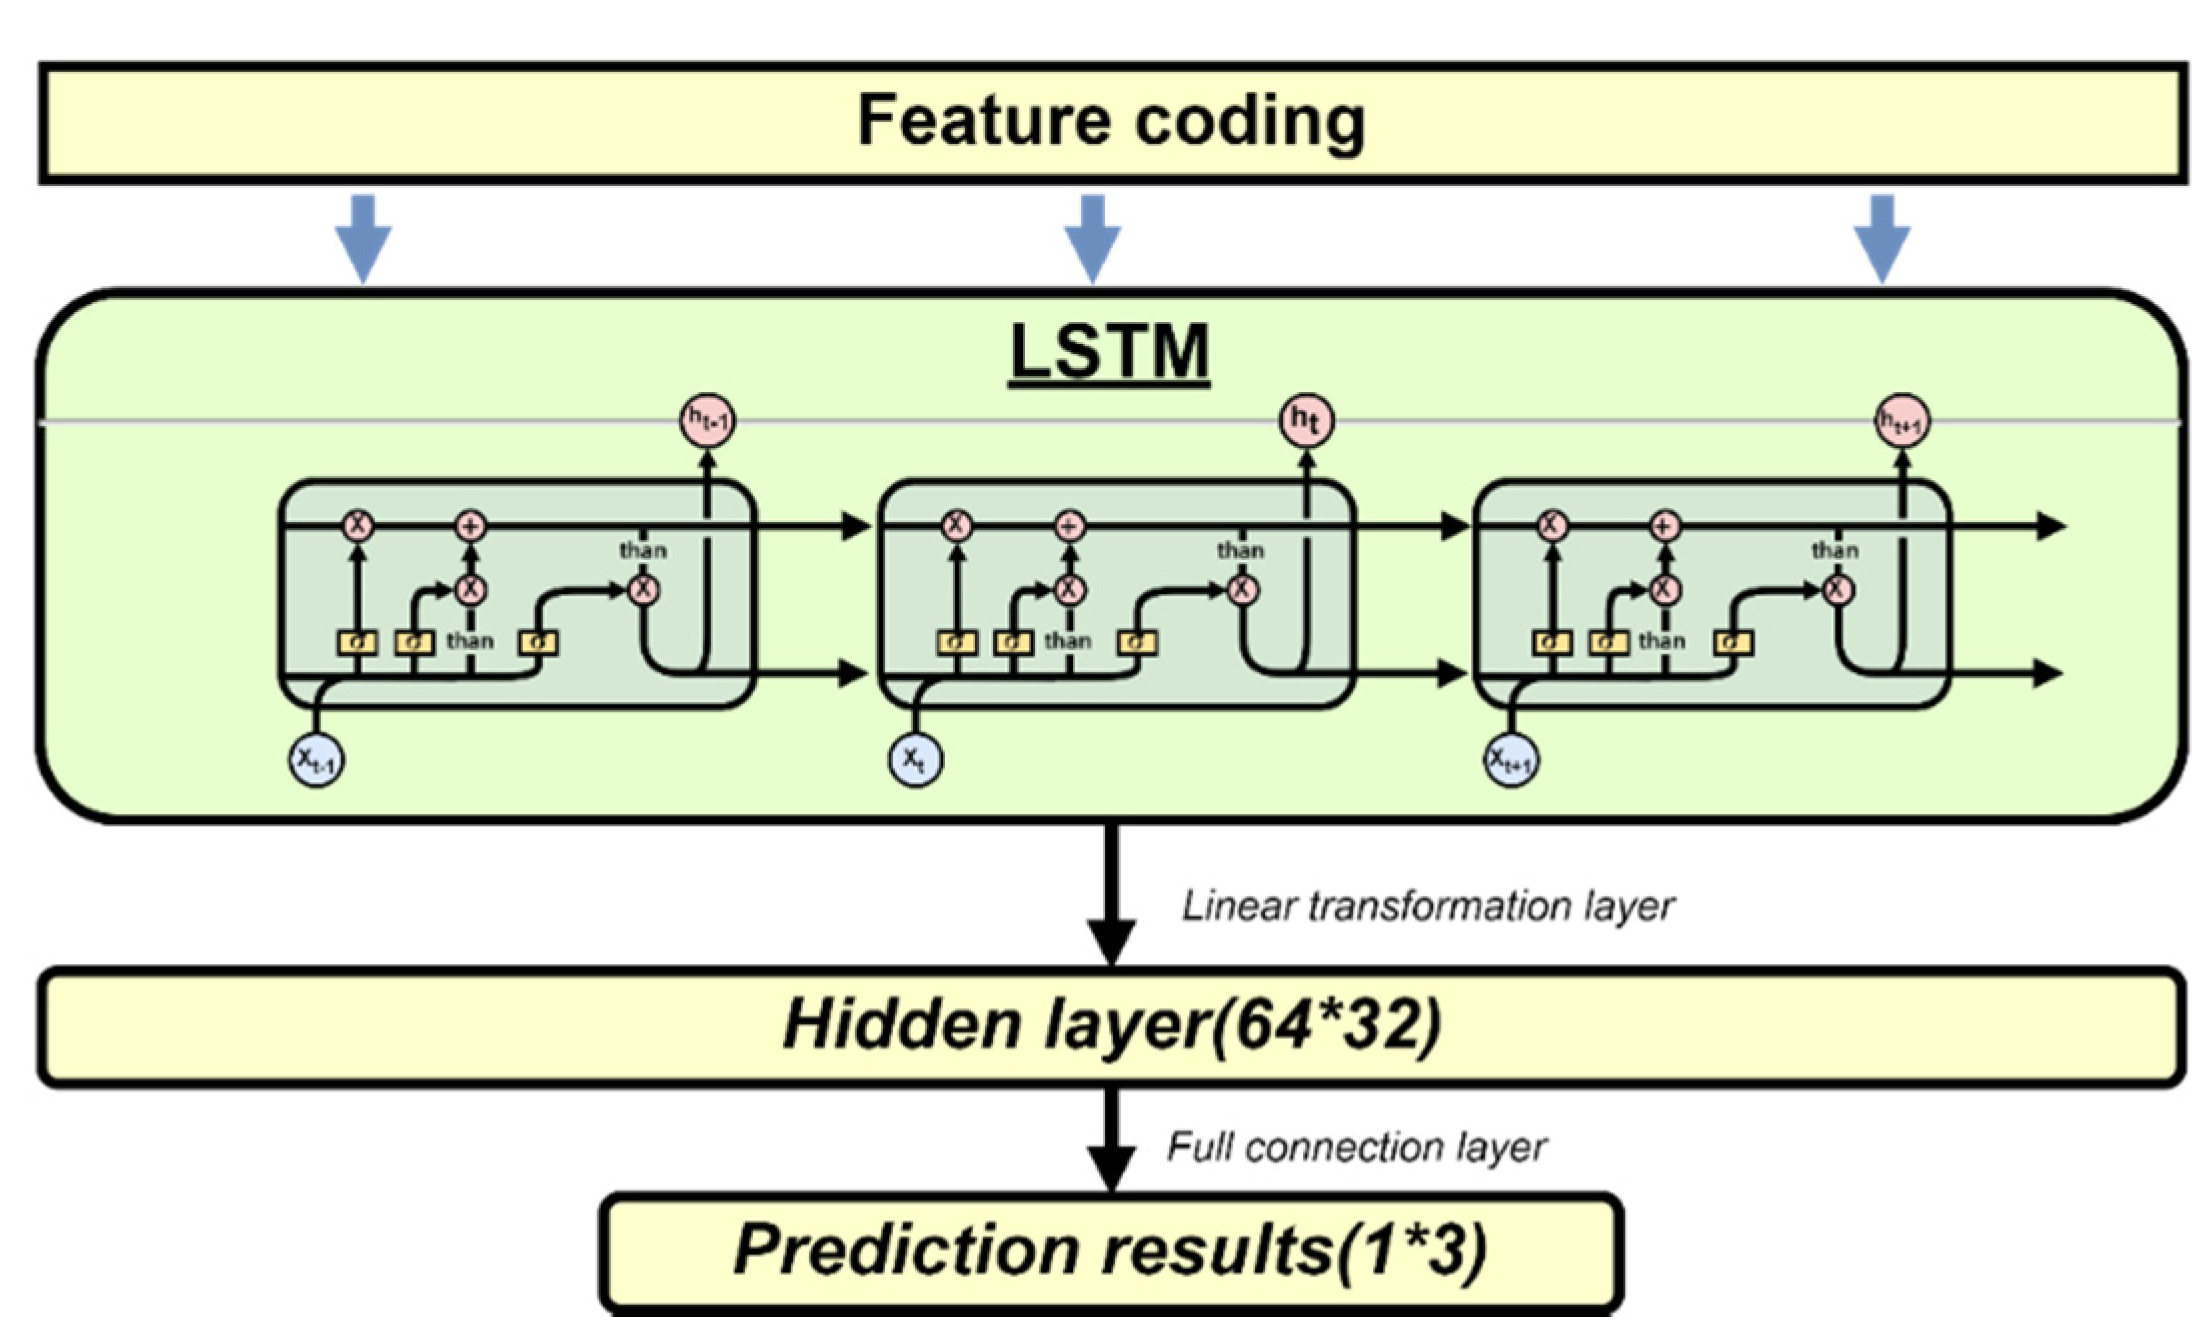
2.6. Construction of the LSTM Model

In order to quickly and effectively obtain the optimal CP modeling feature set that meet the needs of the target perceptual image, it is necessary to establish an effective perceptual evaluation and prediction model. As the modeling features of CPs are taken as a combination modeling feature set including visual sequence, the mapping relationship models between modeling features and perceptual images are established based on LSTM neural network. The LSTM neural network can transport information from one step to the next, precisely imitate the visual sequence tracking on CPs of human eyes, and deal with CP features successfully. The gate structure of LSTM allows information to pass through selectively, change the state each time in the cyclic neural network, and delete or add information to the cell state [42]. To safeguard and control the cell state, the LSTM has three gates, each has a sigmoid neural network layer and a point-wise multiplication operation.
The model construction includes data segmentation and LSTM neural network training process [43]. The training process attempts to establish a deep learning model between the modeling-feature data extracted by the experienced designers mentioned in Section 2.5 and the perceptual evaluation values of CPs by learning the training-set data. With the growth of data, the network is constantly updated. Finally, an affective preference recognition system based on LSTM is obtained to help designers predict users’ perceptual evaluation scores.

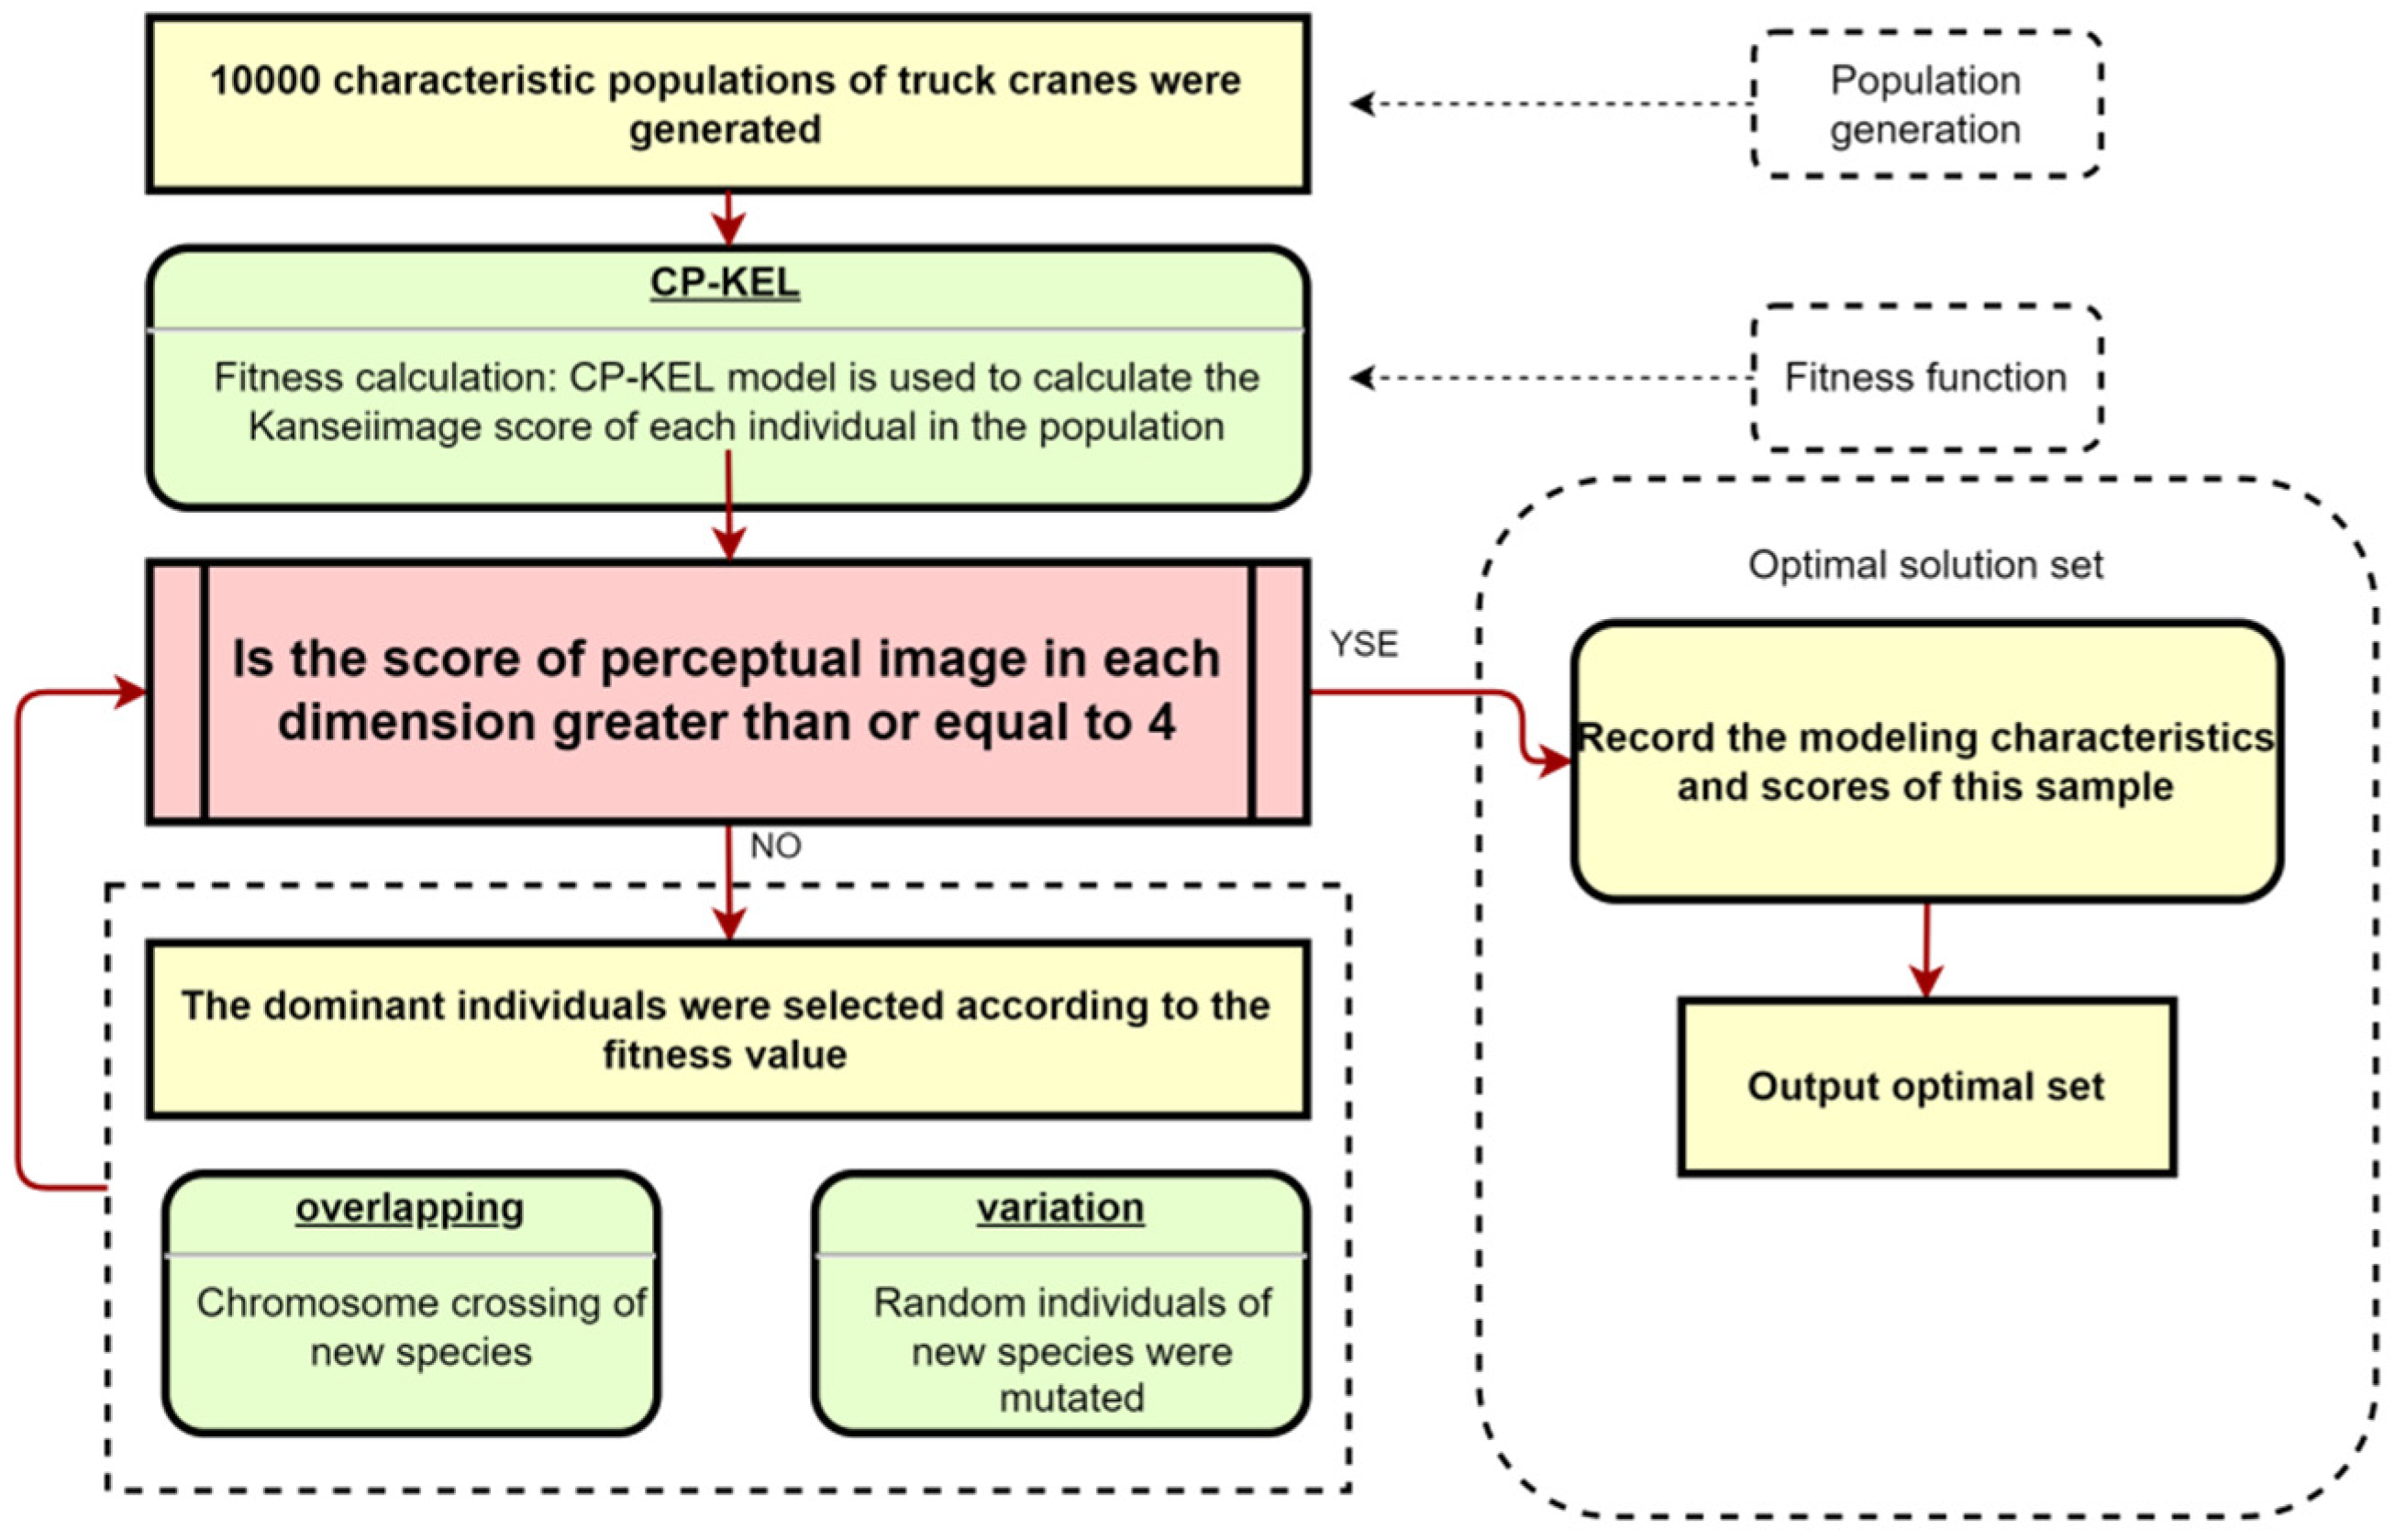
2.7. Construction of GA Model

GA is applied to quickly carry out CP modeling design to meet the target of perceptual images through the relationship model. GA is a classical global class optimization method [34]. It does not need the properties of the continuous differentiation of function, and can calculate the fitness in parallel easily. The GA calculating the optimal CP modeling feature set has five main components: initial population (chromosome), evaluation function, selection function, crossover function, and mutation function [44].
Firstly, the individuals in the initial population are randomly generated, and each represents a possible CP modeling feature set.
Secondly, the evaluation function executed the KE–LSTM model established in Section 2.6 to calculate the perceptual evaluation value of each individual.
Thirdly, the selection function is executed to select individuals with high fitness as alternatives and parents of the next-generation population.
Fourthly, the cross function is executed to calculate and generate the next-generation population. Individuals with high fitness are selected, and their codes are randomly exchanged at the same location to generate the next generation.
Finally, the variogram is executed to maintain the diversity of the next-generation population. The generated sample individuals are selected according to the set probability. The codes of their random location are changed, which can ensure the global search ability of GA.

3. Empirical Study

Truck cranes, as a kind of CPs, have many components and long lengths, and the head and the operation bin are set separately. Therefore, the modeling design of truck cranes was taken as an example to verify the feasibility and effectiveness of the proposed method. The research includes the following steps: (1) Data acquisition and preprocessing. To obtain high-quality sample data, a series of combined steps and methods were carried out to collect and process the original data through web crawlers. (2) Product-feature extraction. In order to accurately extract the modeling features of CPs, the eye-movement experiment and the improved MA method were applied to obtain the visual tracking of users when observing CPs. In addition, the representative samples were encoded into modeling feature sets including visual sequence. (3) The KE–LSTM model was constructed and trained to quickly predict the perceptual evaluation of different feature combinations of CPs. (4) GA was applied to quickly generate the optimal CP modeling feature set that meets the target perceptual images to assist designers in CP modeling design.
The proposed CP-KEDL method was developed with Python. The LSTM module is developed based on the Python PaddlePaddle framework. All experiments were run on AI studio (Baidu), equipped with Intel 4 cores 32 GB, Tesla V100 32 g, and Windows operating system.

3.1. Acquisition of Truck Cranes Picture Data

To ensure the validity of the samples, truck cranes currently on sale in the market were selected as the sample source. Sample pictures were collected based on the methods mentioned in Section 2.2. Firstly, truck-crane pictures were crawled from the construction machinery portal using web-crawler tools. The websites include D1CM, the China Road Machinery Network, and the official websites of construction machinery enterprises. Secondly, all collected pictures were manually checked, and the unnecessary and duplicate pictures were deleted. Thirdly, we selected the left 45-degree angle view pictures of each sample, removed the background of these pictures, and adjusted them to unified pixels to reduce the interference in the evaluation and to reduce errors. Finally, 206 product samples were preserved, and parts of them are shown in Figure 3.

3.2. Acquisition of the Perceptual Evaluation Data of Truck Cranes

We obtained the perceptual evaluation data by the method proposed in Section 2.3. In order to identify the customers’ perceptual needs for truck-crane modeling, we collected perceptual vocabulary related to the truck crane from the available literature. Wang D put forward the perceptual vocabularies of simple, atmospheric, full, and sporty [45]. Xiao synthesized the semantic vocabulary of lifting equipment perceptual images into six pairs: masculine–feminine, solemn–frivolous, future–past, solid–flimsy, technological–conservative, and rational–perceptual [46]. Wang et al. added three pairs of words: introverted–publicized, complete–fragmented, and dynamic–steady [47]. Based on the above research, six pairs of relative perceptual words: steady–light, integral–piecemeal, technological–traditional, safe–dangerous, simple–complex, and dynamic–static were summarized as representative perceptual vocabulary. Furthermore, steady–light, integral–piecemeal, and technological–traditional were randomly selected as three pairs of target perceptual vocabulary for the proposed research, as shown in Table 1.

3.3. Acquisition of Perceptual Evaluation Data

In order to obtain the perceptual evaluation value of the sample pictures, the selected three pairs of perceptual vocabulary were combined with 206 representative samples. To make the evaluation of focus groups obvious, the SD method was carried out to make the evaluation questionnaire shown in Figure 4.
A focus group was formed, including three designers with construction machinery design experience, two non-design professionals, one product manager of construction machinery enterprises, and three construction machinery operators. The participants were recruited from experts or expert users of truck cranes and varied from designers, managers, engineers and operators. This expert-recruitment method helps us to collect data from different perspectives; avoid the limitations of a single perspective; and enhance the comprehensiveness, efficiency and credibility of the research results.
First, the meaning of perceptual vocabularies was further explained to participants to promote for them a more consistent judgment standard of perceptual images. For example, steady refers to the visual sense of stability, heaviness, and the feeling of not tipping, while light is the opposite, representing lightness and thinness; integral refers to the visual integrity, completeness, and visual unity of the car crane, while piecemeal is the opposite, representing a sense of visual fragmentation and messiness. Technological refers to the image of future science and technology, while traditional is the opposite, representing a state of non-advanced technology. After that, each participant was invited to evaluate the sample picture in the given three perceptual dimensions according to his/her first impression. Finally, the evaluation mean values of each sample in each perceptual dimension were calculated, as shown in Table 2.
Although an expert evaluation method was used for data acquisition, there may be statistical reliability errors due to the limitation of the small size of participants and the large energy and time cost of the questionnaires. Therefore, a reliability test and retest method were applied to validate the reliability of the collected data. Kendall’s concordance coefficient (W) is an expert evaluation indicator of question reliability [48] and is commonly used to measure the degree of concordance of designers in ranking design goals [49]. Relevant studies have used Kendall’s concordance coefficient (W) to test the scoring reliability of data with a small size of experts [50,51,52]. The data in Table 2 was imported to SPSS to calculate Kendall’s concordance coefficient (W) [53]. As shown in Table 3, the Kendall’s concordance coefficient test showed significance (p = 0.000 < 0.05), implying that the evaluations of the invited experts were highly correlated, i.e., indicating that the evaluations are consistent; Kendall’s W coefficient is 0.608, which is between 0.6 and 0.8, indicating a strong consistency. Therefore, the collected data is verified as reliable and valid.
In the meanwhile, test–retest reliability has been used for reliability testing in some studies with a small number of participants [54,55]. To further test the reliability and validity and avoid the possible errors in a small sample size, the same group of experts was invited for a second experiment with the same questionnaire [56]. The retest was carried out two months after the first experiment, which ensured that the participants were less interfered with by the previous test and could use the first impression to evaluate the perceptual image of the samples again. The mean evaluation values of the second experiment results were calculated and imported to SPSS to test the reliability. Results show that the Kendall’s W coefficient is 0.603, and p is 0.000, which indicates that the results of the second experiment passed the reliability and validity test and are reliable and effective data. In addition, the Pearson correlation coefficient of the two experiment results is 0.917, i.e., indicating that the two experiments’ results are highly correlated [57]. Therefore, the retest experiment verified that the data in Table 2 have good reliability and validity. As the evaluation data in Table 2 was verified to be reliable and valid and was collected by the first evaluation experiment, it was considered to be closer to the participants’ first intuition and impression than the retest result. Therefore, the data in Table 2 was used to establish the perceptual evaluation dataset in Section 3.6.

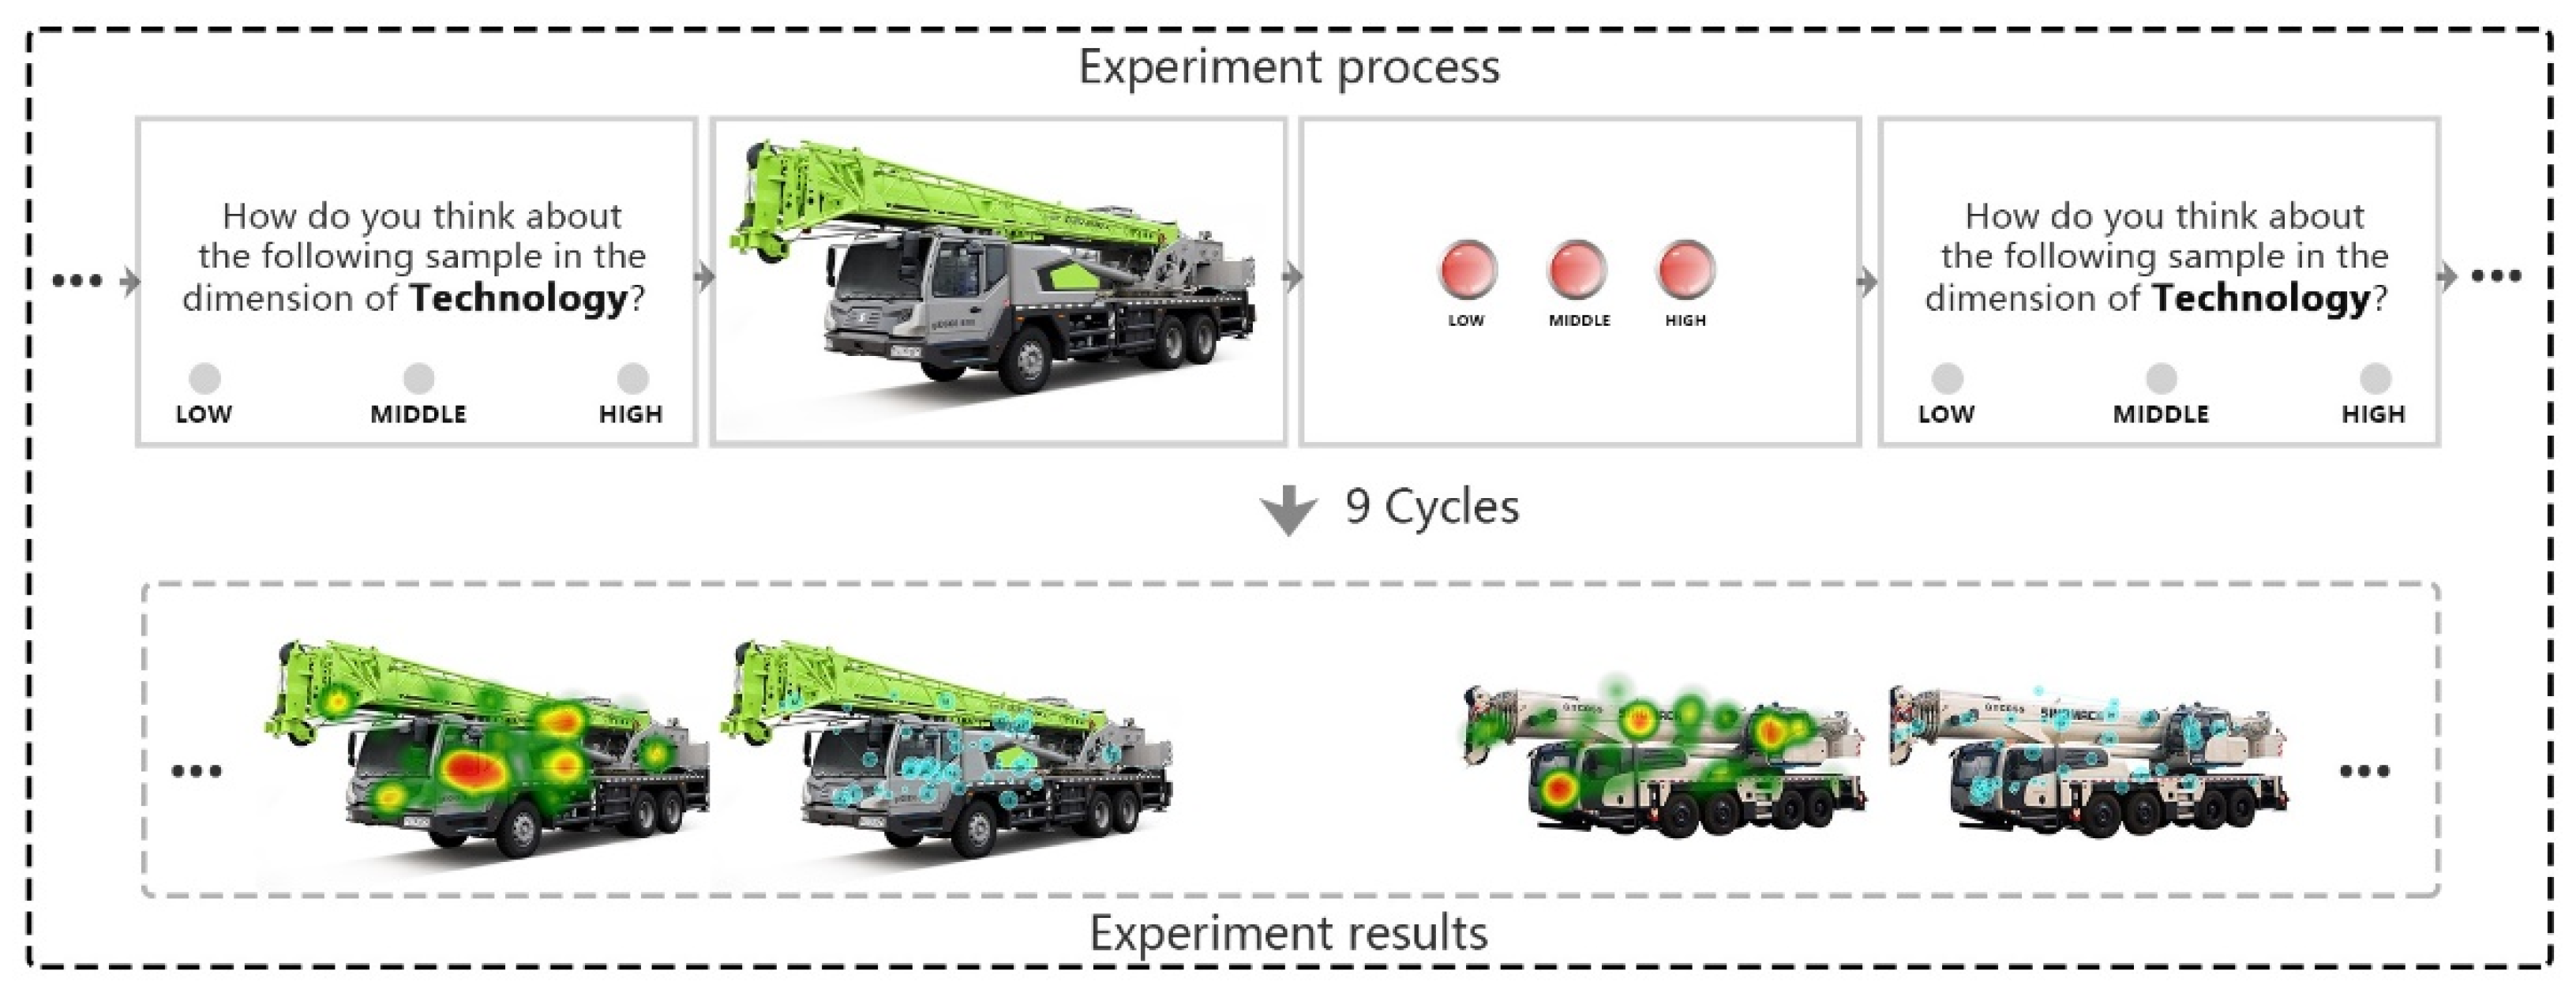
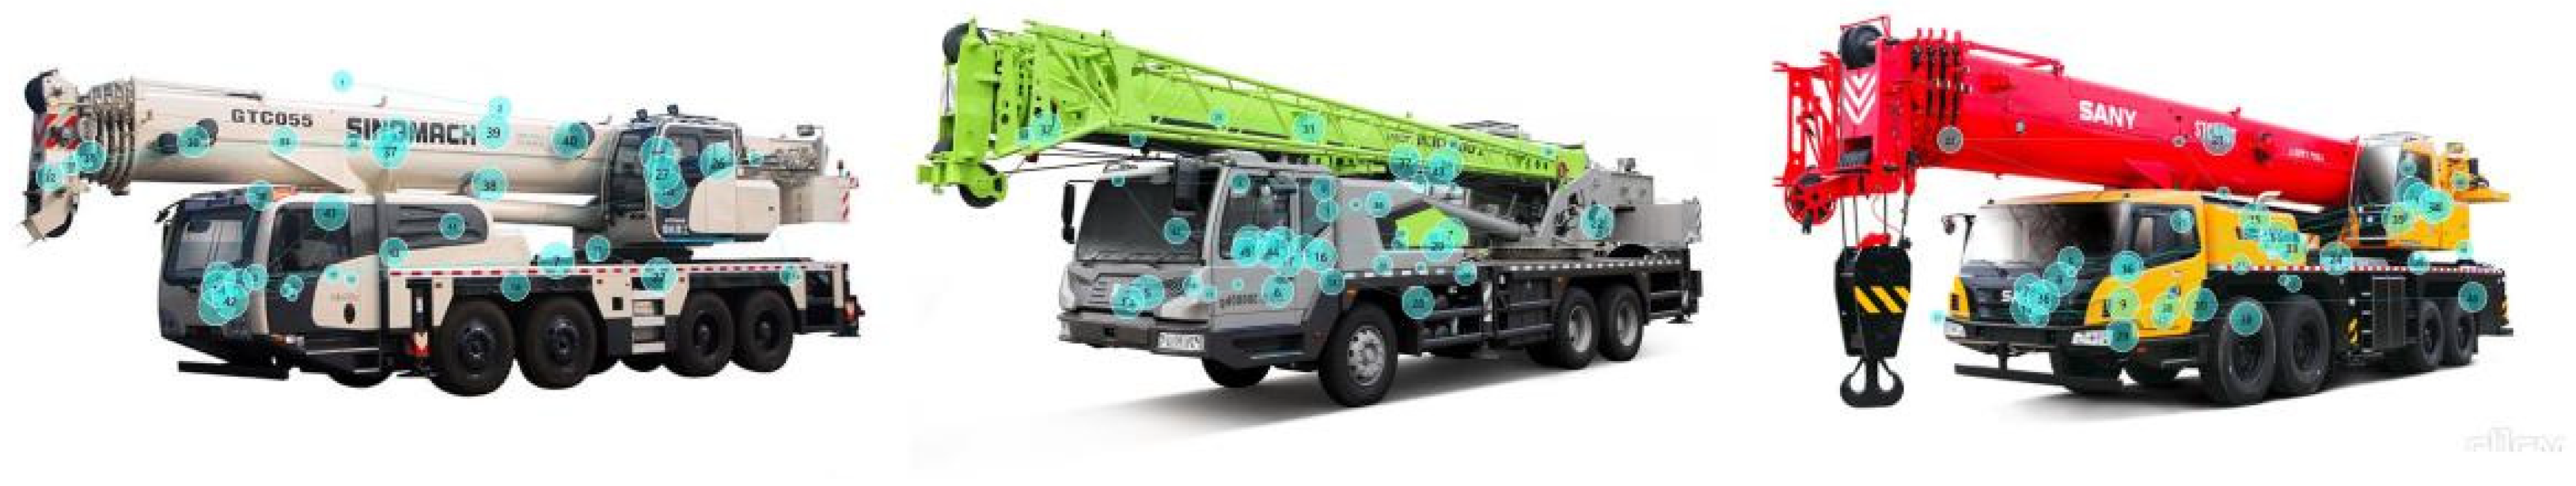
3.4. Acquisition of Sample Feature Visual Sequence

To obtain the visual sequence of user perceptual evaluation, an eye-movement experiment was conducted. A thermal map area and the observation sequence of user observation forklift samples were obtained through experiments.
The experiment was designed as follows.
(1)
Samples
According to the scores in Table 2, the samples were divided into three groups in each perceptual dimension: high score, middle score, and low score. A sample picture was randomly selected from each group, and a total of nine sample pictures were collected, as shown in Table 4. Furthermore, in order to obtain the process of users’ observing and evaluating the perceptual image of samples, the product sample pictures were combined with three pairs of perceptual vocabularies to design the observation object of the experiment.
(2)
Participants
Twelve graduate students (6 males, 6 females) majoring in design at Tianjin University were invited as participants. Neither the shape of the truck crane nor the relevant text prompts were given before and during the test to avoid affecting participants’ subjective feelings.
(3)
Devices
The devices include a Tobii Pro Nano eye tracker, a 21-inch computer monitor, and a game controller with three selection buttons.
(4)
Experiment procedure
(1) When the participant entered the laboratory, he/she was informed of the experimental procedures and precautions. After becoming familiar with the environment, the participant sat about 64 cm away from the display, with eyes staring toward the center of the screen and head keeping still.
(2) The equipment calibration and pre-test were conducted to ensure the accuracy of the experimental data.
(3) Participants began the experiment by pressing the confirmation button on the game controller while looking at the center of the screen. First, a description page appeared, telling the user which image dimension to evaluate and the evaluation options. Second, a sample picture of the truck crane in the figure appeared randomly in the center of the screen for 30 s. At this time, the participant determined the score range (high, middle, low) of the sample picture in the specific perceptual image dimension and pressed the corresponding button on the game controller.
(4) A blank gray screen appeared, and the experiment was repeated a total of nine times (As shown in Figure 5).
(5)
Results and analysis
The visual thermal diagram and the visual trace of the truck crane were obtained through eye-movement experiments, as shown in Figure 6.
Based on the analysis of the visual thermal diagrams and the discussion with the designers of the focus group, the truck crane was finally divided into five components: the head, body, boom, chassis, and operation cabin. Each sample picture was divided into corresponding five visual-interest regions.
The visual trace of each participant observing different samples was analyzed. The first visual-interest region that the participant observed and stayed for more than 1 s was recorded and scored five points, four points for the second region, three points for the third region, and so on. In addition, the mean score of each region was calculated, as shown in Table 5.
According to Table 5, the visual sequence was determined as P = (Head (P1), Boom (P2), Body–Chassis (P3), Operation bin (P4)).
Most participants observed the head of the truck crane at first sight, followed by the body, boom, operation bin, and chassis. We interviewed the participants after the test and found that the users’ vision become used to moving from left to right. What is more, the observers’ attention to the base is low, and the body is closely connected with the chassis, so we combined the body and the chassis as one area. Therefore, the users’ general visual trace when observing the truck crane was summarized, as shown in Figure 7.

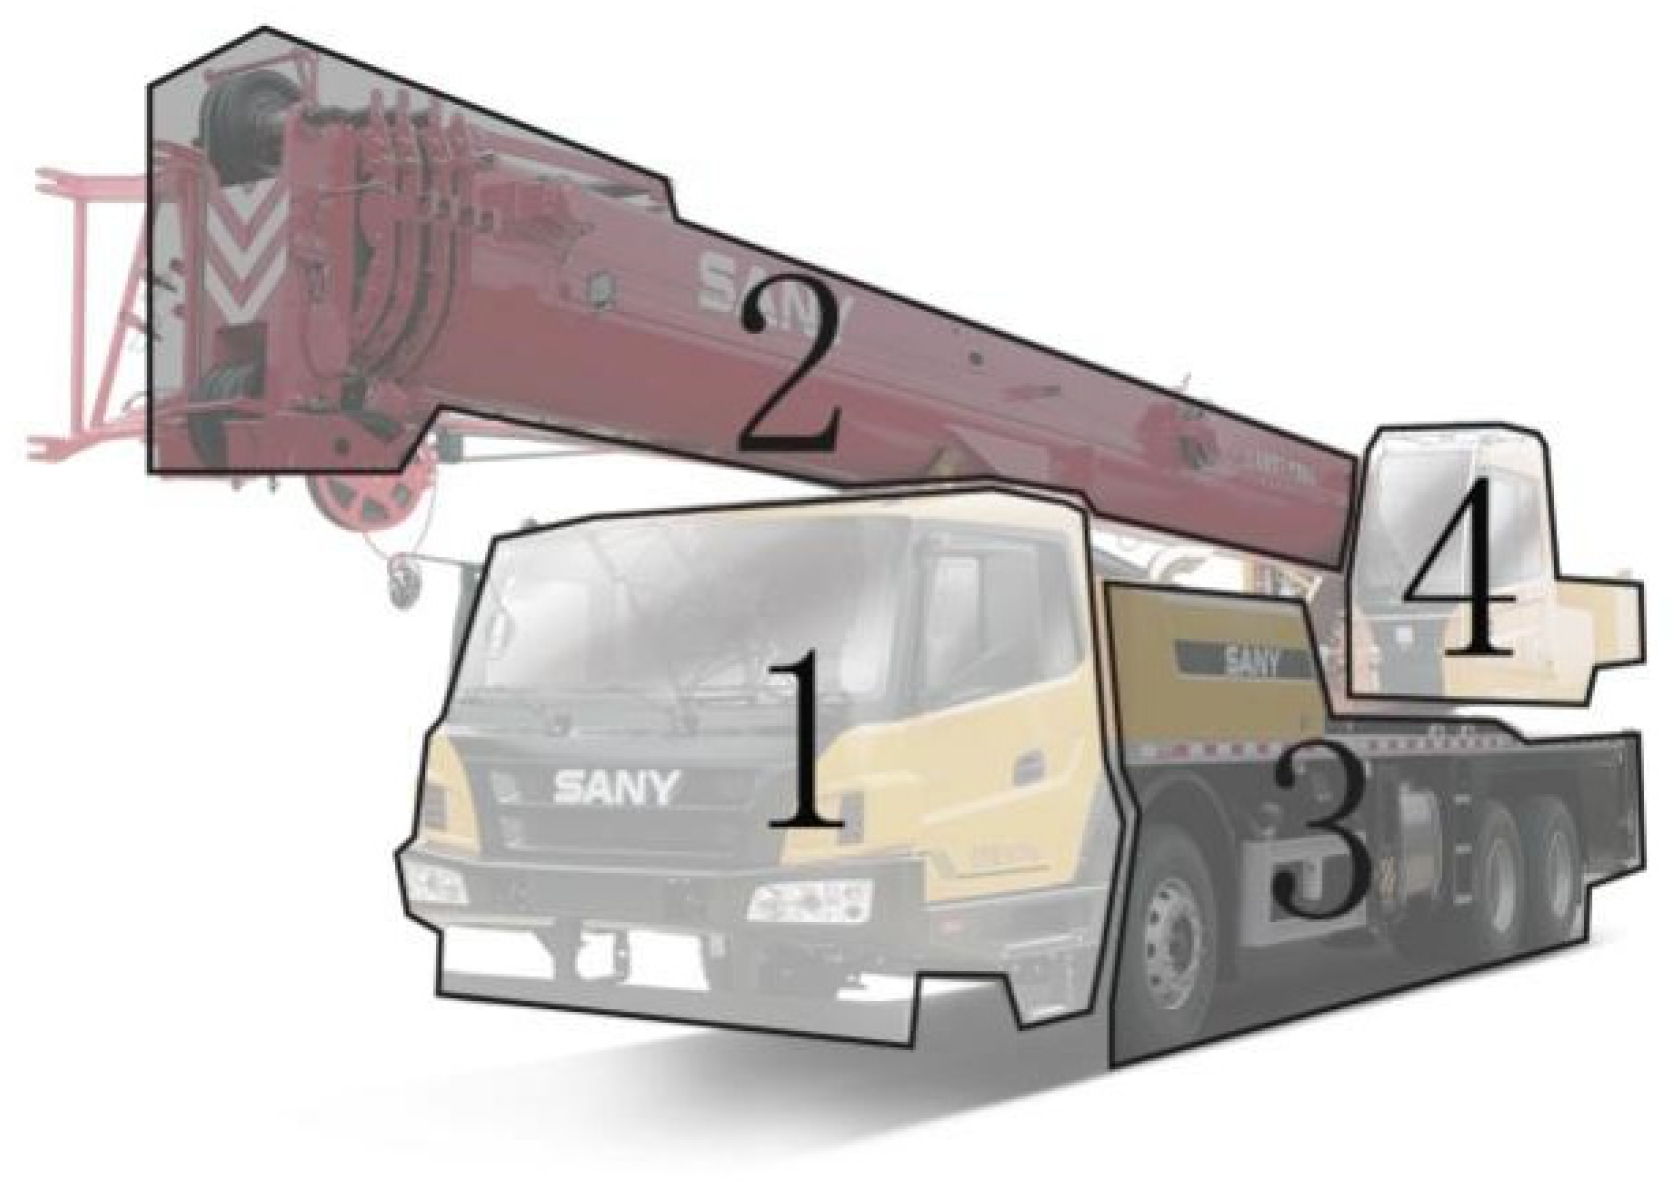
3.5. Coding of Sample’s Modeling Features

Using the coding method of modeling feature proposed in Section 2.5, five designers formed a focus group, including three designers with five years of design experience and two construction-machinery-design decision-makers. Name each part that affects the perceptual image of a component as an item and each modeling feature of items as a +category. The improved MA method and aesthetic principles were applied to reconstruct and analyze the items, enumerate the design feature of each item, and establish the modeling-feature category set of truck crane.
Each category represents a feature index, and the repetitive categories use the same location index. As shown in Table 6, each component has several items wherein category features have occurred repeatedly.
Based on Table 6, each sample was deconstructed into the modeling feature category set and encoded into the feature vector, as shown in Table 7. During this process, we found that the visual relationships among items are further demonstrated by the fact that some different components have the same categories. Finally, as shown in Table 7, we translated the product categories into 4 × 8 feature matrices as neural network input codes. For vectors less than 8 bits, fill in 0 at the empty bit.

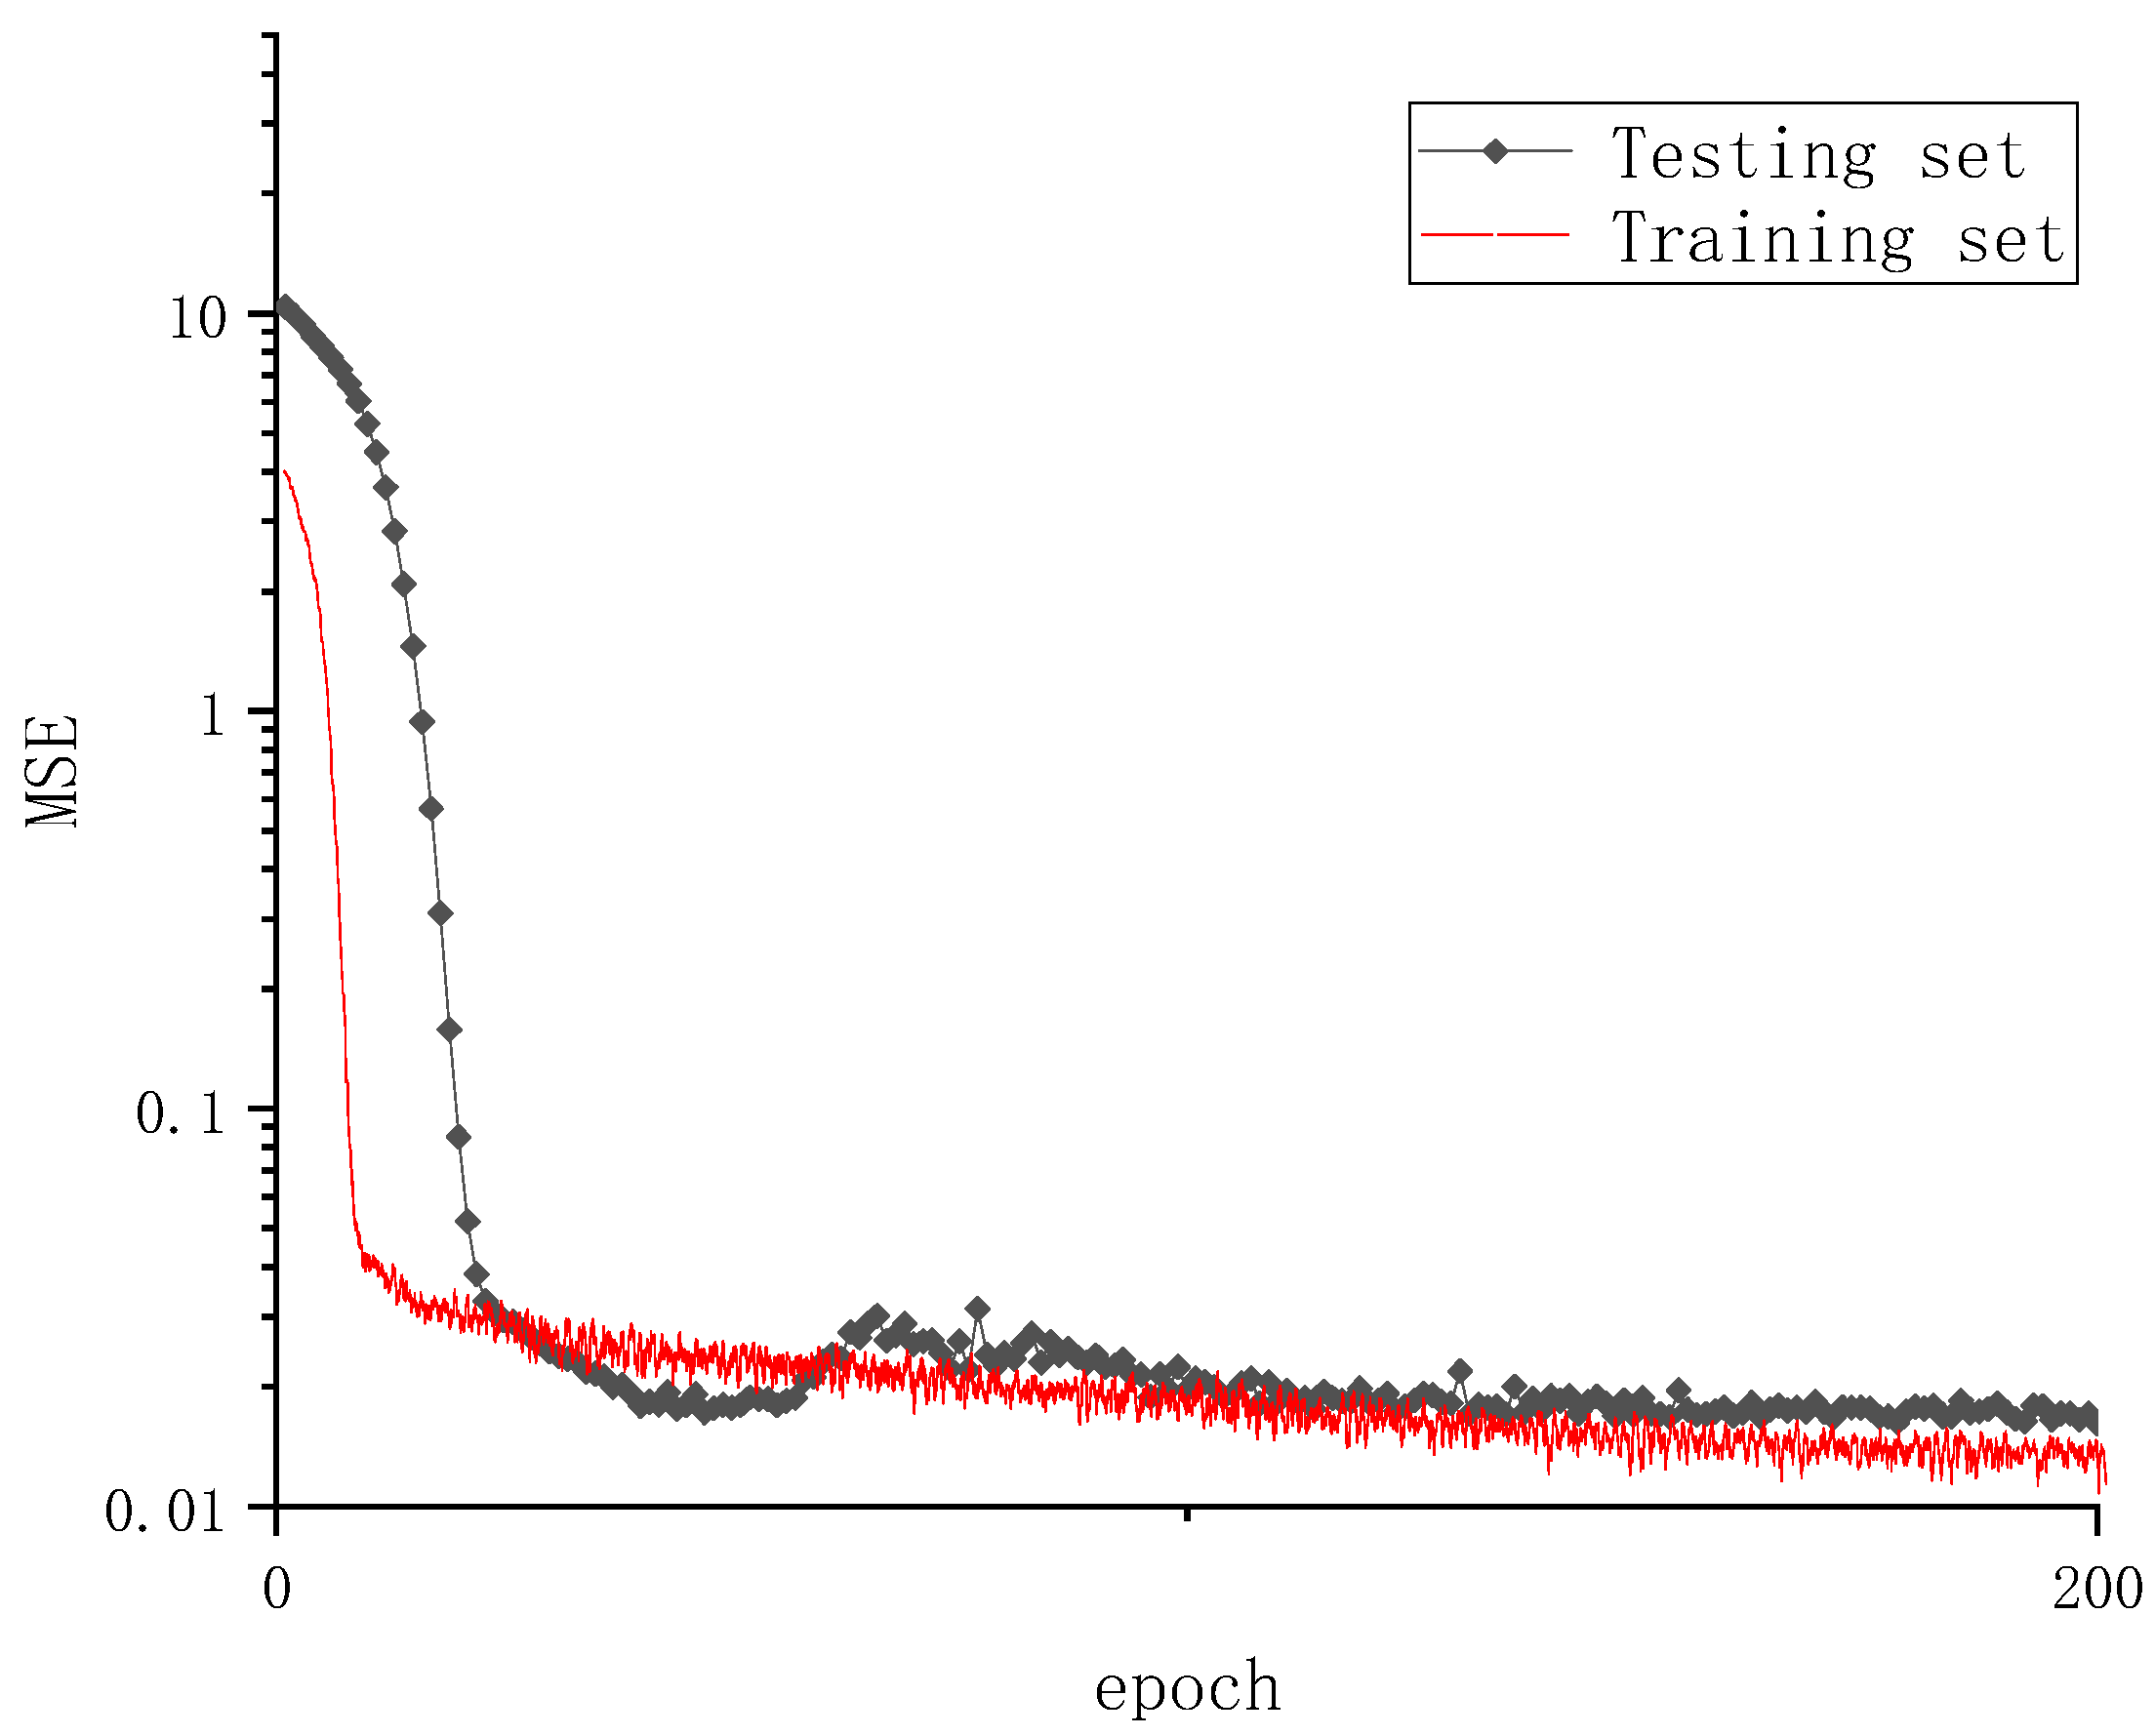
3.6. Model Construction and Perceptual Evaluation

After the feature-category coding and perceptual evaluation, a dataset of truck crane modeling evaluation was established, which includes modeling-feature-category coding with visual sequence (Table 7) and the mean perceptual evaluation values (Table 2).
The modeling-feature-category coding data in Table 7 was used as the input layer, and the user’s mean perceptual evaluation values on the perceptual dimension of the sense of technological–traditional, steady–Light, and integral–piecemeal in Table 2 were used as the output layer to train the KE–LSTM model.
The structure of the LSTM neural network was shown in Figure 8. In the data processing stage, it was found that the dimension of a CP sequence encoded by one-hot was enormous. In order to enable the computer to accurately understand the meaning of the features extracted manually, we referred to a skip-gram to convert the CP sequence features p n ( t ) = ( p n t , p n t + 1 , , p n t + l 1 ) R l × m into low-dimensional vectors.
In the encoding stage, the vector with dimension (l, m) is received as the input, p n ( t ) = ( p n t , p n t + 1 , , p n t + l 1 ) R l × m , and the number of LSTM neurons in the hidden layer is determined by L. According to the structure shown in Figure 8, the inputs of a single LSTM neuron are the p n t  of the current observation time and the hidden representation h E t 1 of the previous moment input vector encoded by the LSTM neurons. After encoding, the hidden representation h E t at this time is obtained as one of the inputs of LSTM neurons at the next moment.
Training performance was assessed using the mean square error (MSE) [43], as shown in Formula (3).
loss = 1 n y y p 2
The data were divided into the training set and test set, accounting for 80% and 20%, respectively. MSE was reduced continuously during the training process. The parameters of the KE–LSTM model were as follows: network structure is two layers; LSTM neuron hidden state size was 32; target error was less than 0.03; the optimizer was Adam; the learning rate was 0.001; dropout was 0.2; model metrics were the loss function shown as Formula (3), and the remaining parameters were set as default values [58].
Model training was implemented through the PaddlePaddle package of Python 3.8 (64-bit).
The experimental results are shown in Figure 9. When the number of iterations exceeded 100, the error curves of the training set and the testing set tended to be flat, which met the accuracy requirements of the model. Therefore, the KE–LSTM model can be used for the prediction of the perceptual evaluation score of truck cranes.

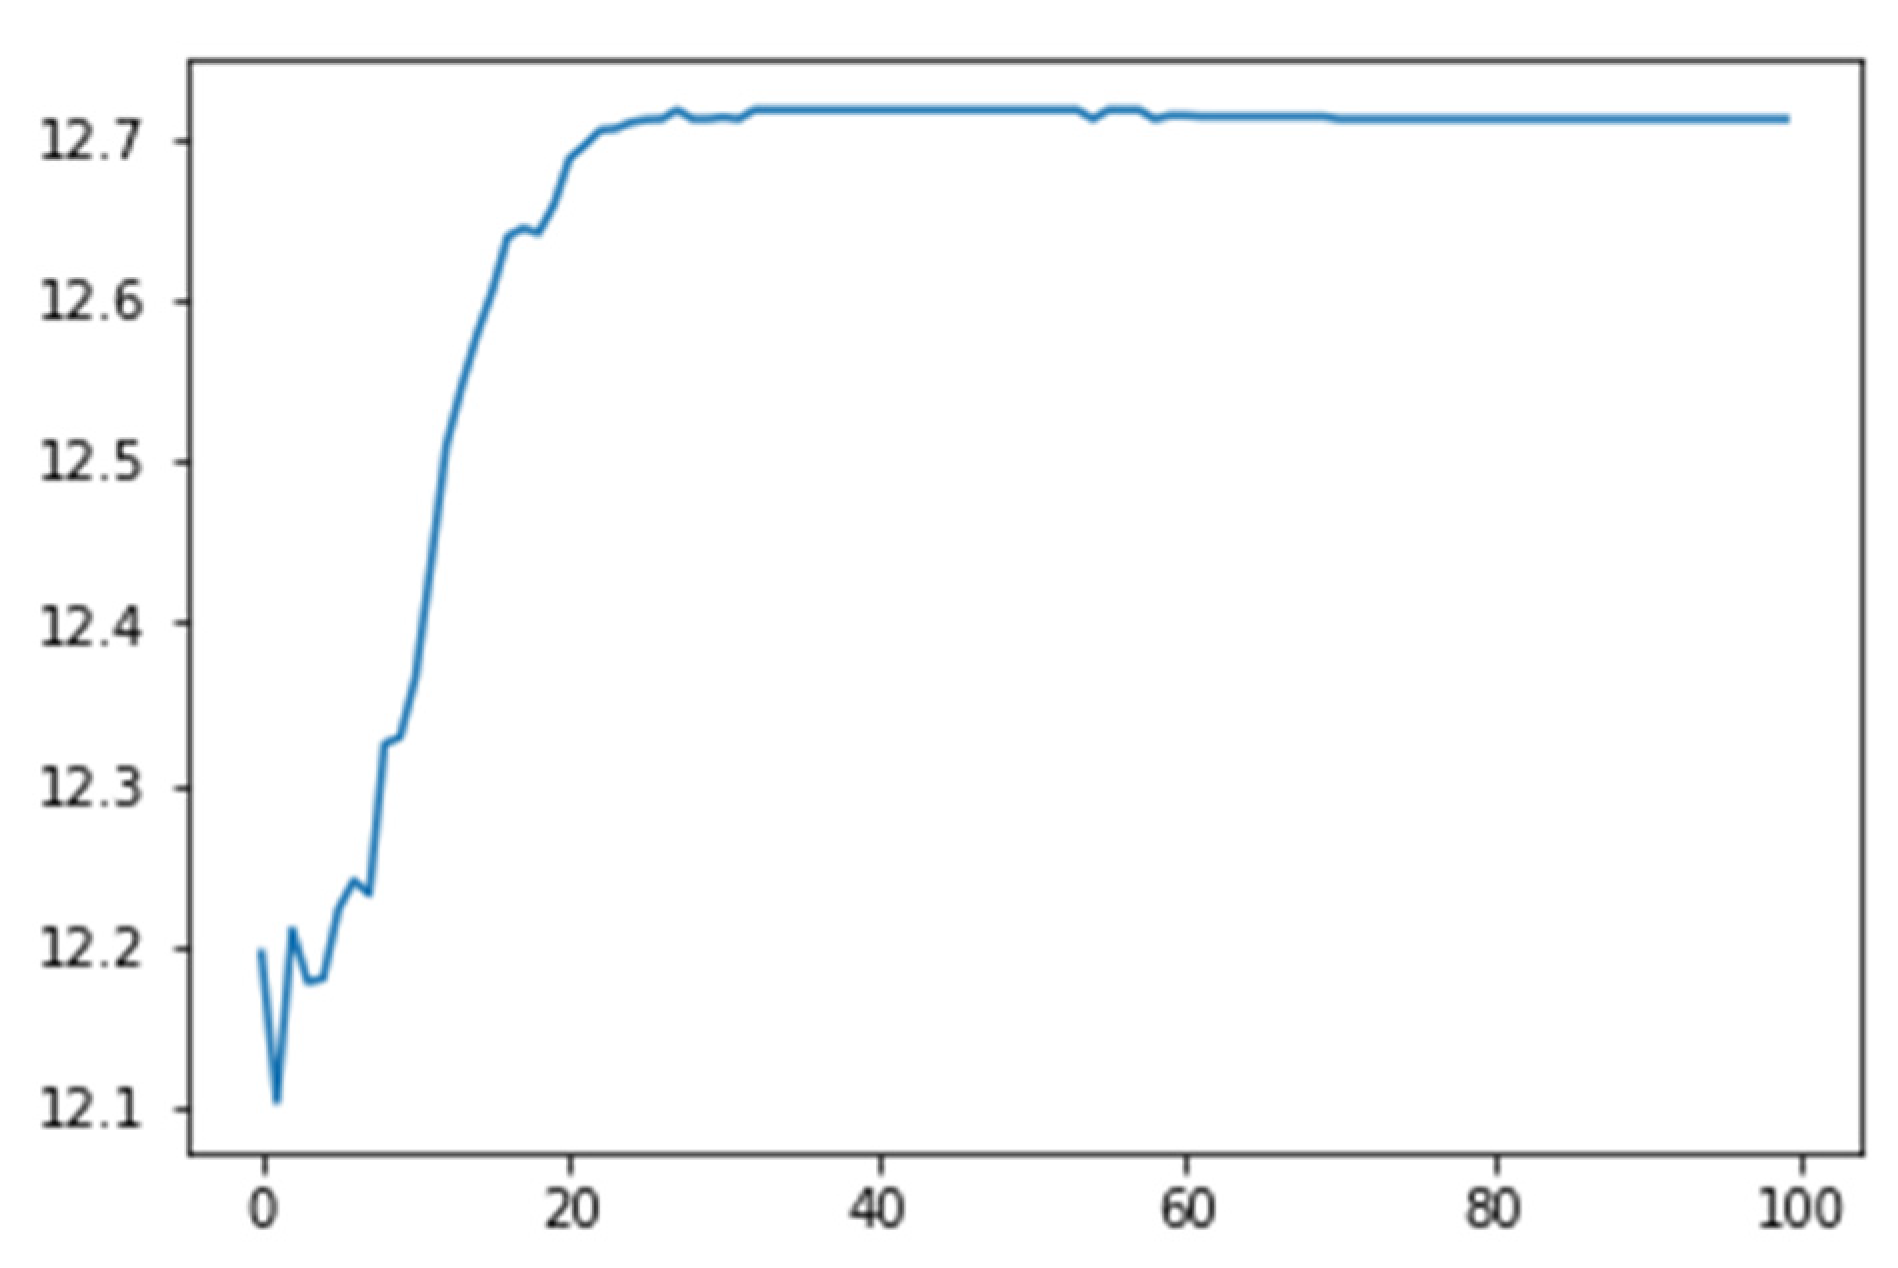
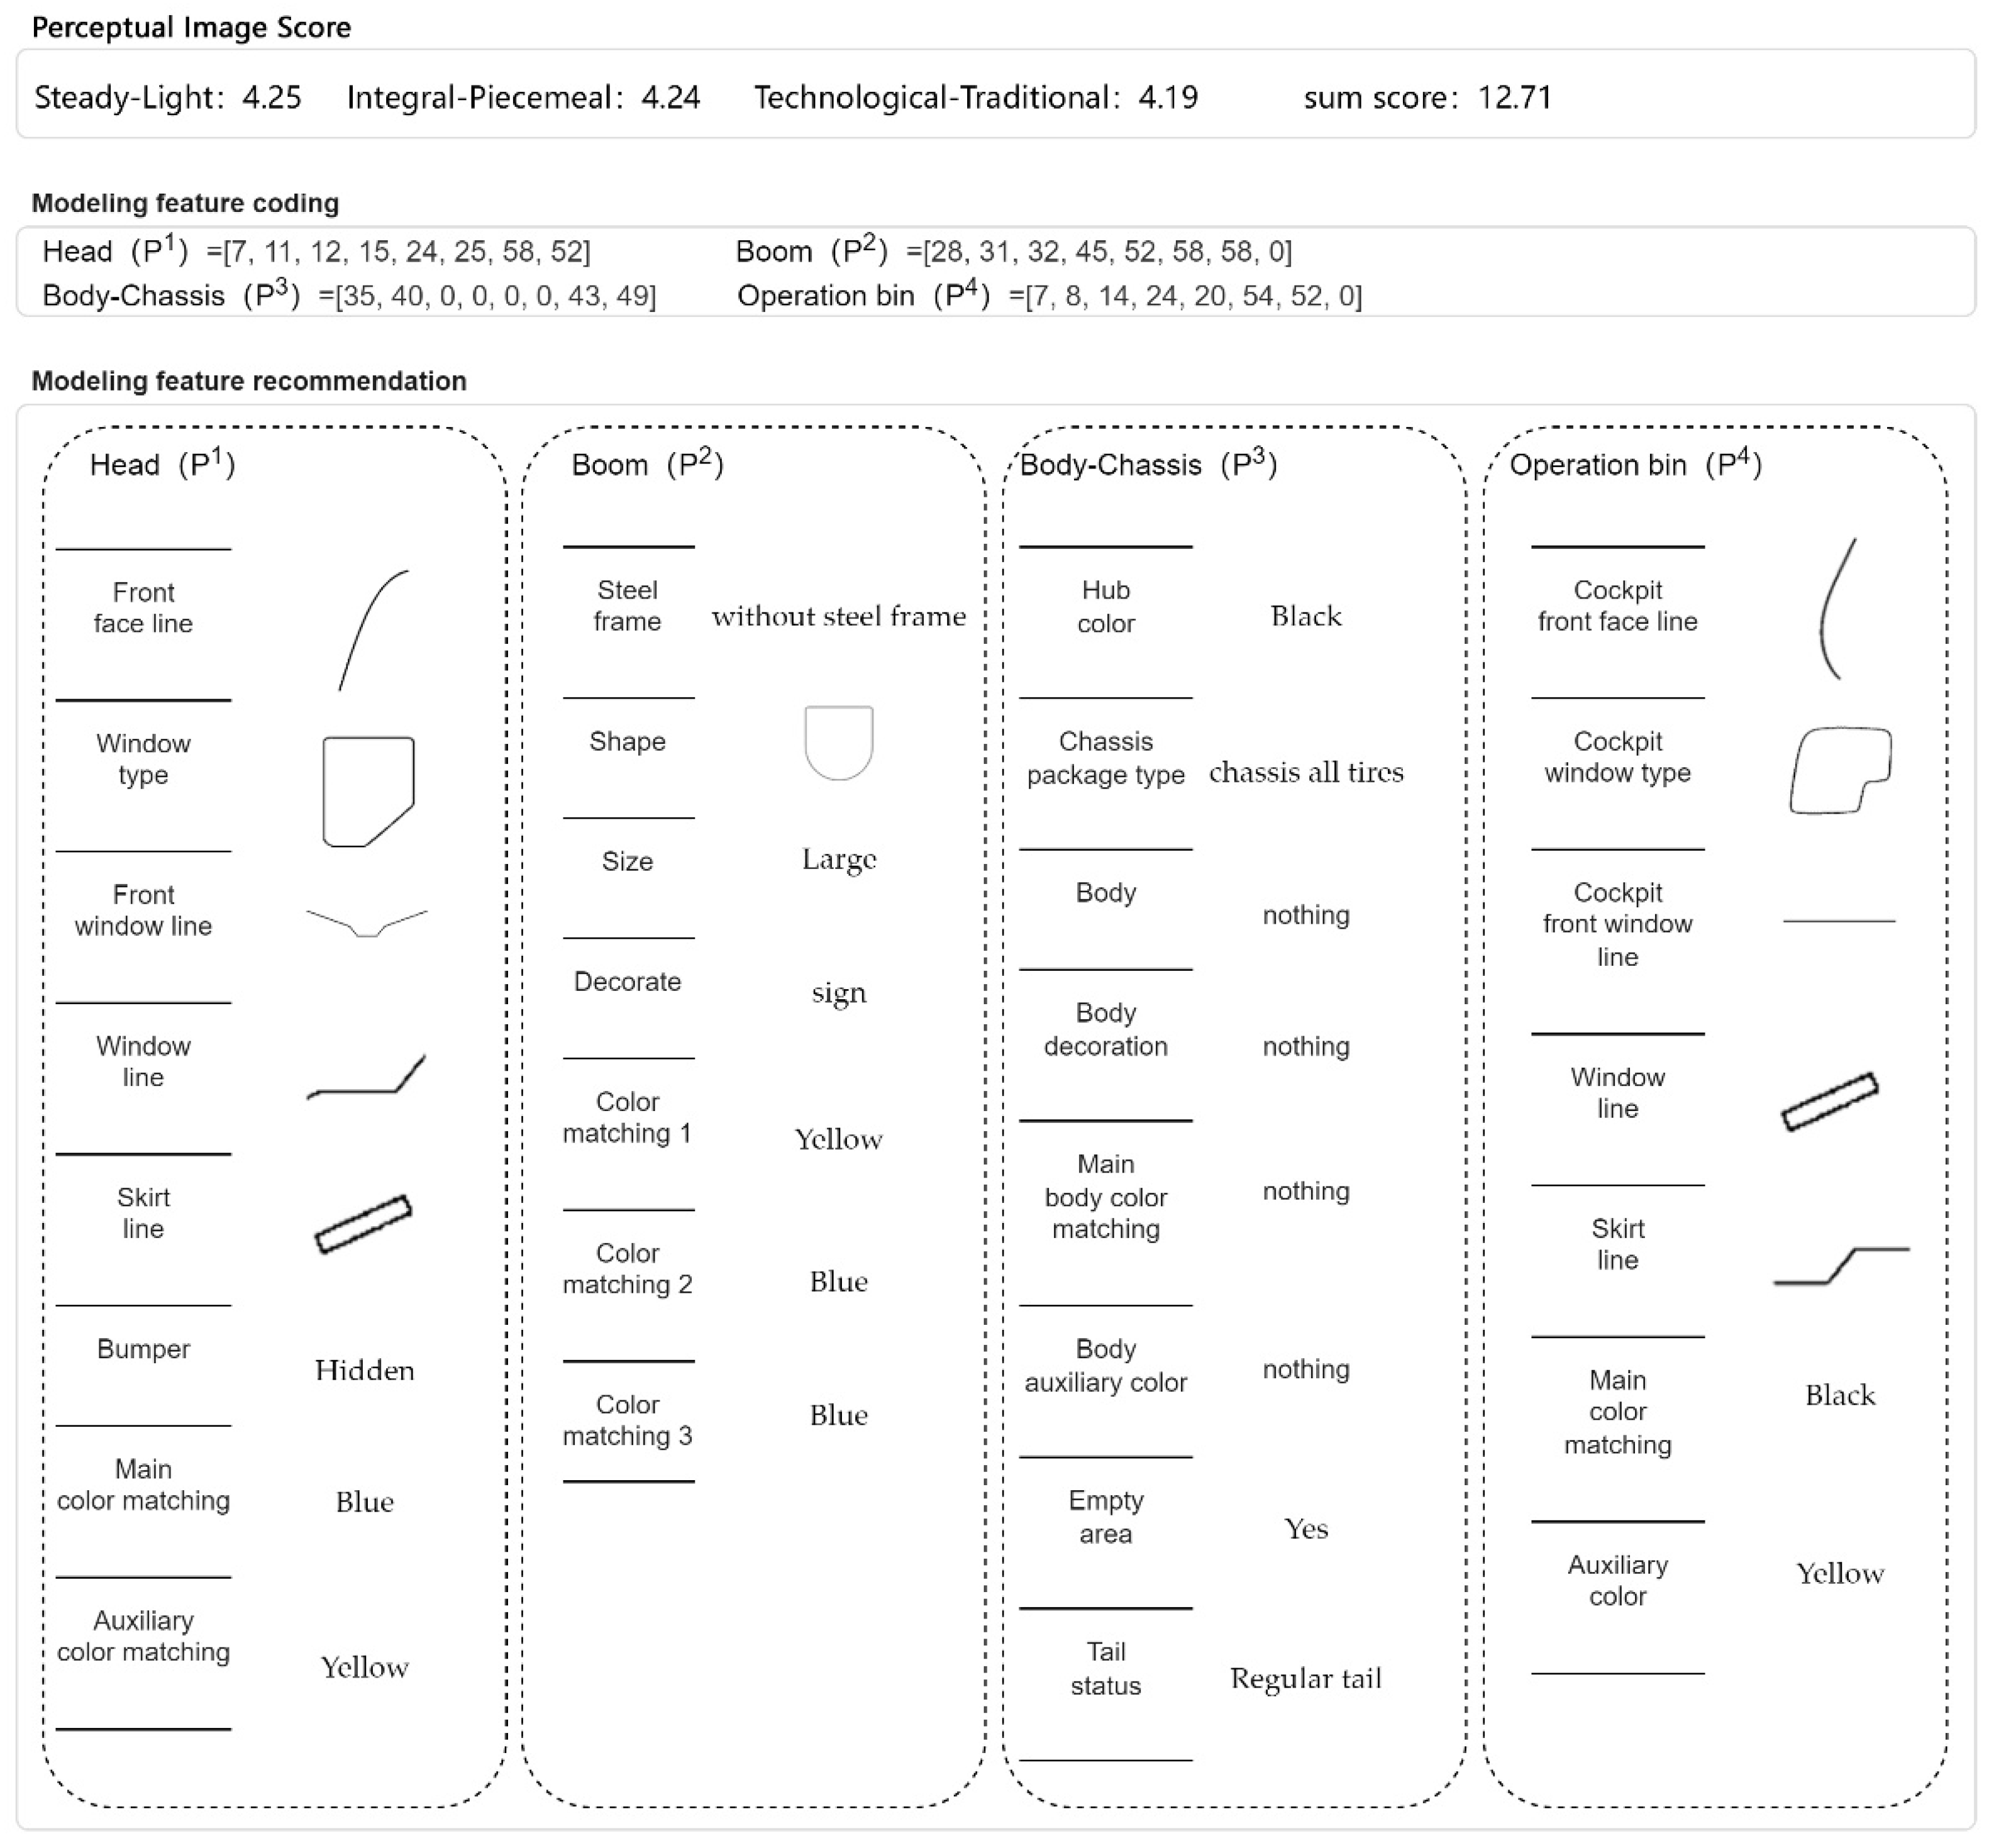
3.7. Establishment of the GA Model

Based on the KE–LSTM model, the GA model described in Section 2.7 was established to optimize the schemes. The experimental process is shown in Figure 10. Firstly, 10,000 original feature-combination populations were generated according to the feature set in Table 6 through the population generation function. Secondly, the KE–LSTM model was executed as a fitness function to evaluate and predict the score of each individual in the population to solve the individual fitness problem. Finally, the dominant population was chosen for hybrid recombination using the roulette method. Different modeling-feature-category codes belonging to the same part of the truck crane were hybridized to generate a new generation. In the process of population generation, the variation ratio was controlled to 0.01. The target fitness was set as 4 points; that is, the sum of the 3 perceptual dimension scores was more than 12 points. If the target fitness was not satisfied, the model will be cycled in the same way.
As shown in Figure 11, after 20 rounds of iteration, the design scheme that met the perceptual evaluation target was optimized. According to Table 2, the mean values of the collected samples in the perceptual dimension of steady–Light, integral–piecemeal, and technological–traditional are 3.15, 3.42, and 2.91 respectively. As shown in Figure 12, the evaluations of optimal design schemes are all higher than four points in three perceptual dimensions, which are also far higher than the mean values of the collected samples. Therefore, based on the KE–LSTM model, the GA model can quickly push the modeling-feature-category set in line with the target perceptual images, assist designers to conduct creative design practice of CPs quickly and effectively, and improve design quality and satisfaction.

4. Discussion

The perceptual evaluation model based on the LSTM neural network (KE–LSTM) is the basis of the proposed CP modeling design method (CP-KEDL). In order to verify the validity of the LSTM neural network, two kinds of neural networks were built as controlled experiments to compare the evaluation results. As a well-known basic traditional machine learning tool [59], Deep Neural Networks (DNNs) have been applied in many controlled experiments to validate the efficiency of research [59,60,61]. In addition, CNNs were reported that have good performance in processing data that come in the form of multiple arrays [62]; for example, many data modalities are in the form of multiple arrays: 1D for signals and sequences, including language [63,64]; 2D for images or audio spectrograms [65]; and 3D for video or volumetric images [66]. Therefore, DNN and CNN were chosen to be the compared models. The structures of the two networks were set as follows:
(1) DNN, a two-layer network structure, has 32, 24, and 3 neurons in the input, hidden and output layers, respectively.
(2) CNN has two convolution layers and two pooling layers and finally outputs the results through the full connection layer.
During training and testing, both DNN and CNN used the same coded number data in Table 7 as LSTM, and the training set and test set of each model are consistent with LSTM. Both of them used Formula (3) in Section 3.6 as the performance evaluation index.
In order to quantitatively evaluate the performance of the above models, the root mean square error (RMSE) [67] and MSE were used to evaluate the error between the model output and the measured value. The smaller RMSE and MSE, the smaller the model deviation and the better effect of performance evaluation. The formulas of RMSE and MSE are as follows:
R M S E = 1 m i = 1 m ( y i y ^ i ) 2
M S E = 1 m i = 1 m ( y i y ^ i ) 2
where y ^ i and y i are the output value and the actual value of model, respectively. The evaluation results of the testing set are shown in Table 8.
According to Table 8 and Figure 13, the LSTM neural network performs best in evaluating and predicting the users’ perceptual preference of CPs, followed by the CNN, and DNN is the worst. We suppose the reason is that, compared with CNN and DNN models, LSTM model takes more product modeling features into account when modeling and adds an observation time sequence so that the product-feature-coding set can be more comprehensive and multi-dimensional. Therefore, the results show that, after adding users’ visual observation sequence features of CPs to product-modeling-feature data, the neural network can better grasp product-modeling features, showing better accuracy and efficiency. In addition, the results also verified the necessity of adding the visual sequence to the feature processing of CPs.

5. Conclusions

This paper presents a CP-modeling design method (CP-KEDL) based on the LSTM neural network and KE. Compared with the traditional KE methods or neural networks, CP-KEDL regards the user’s observation behaviors of CPs as a visual process, which can be obtained through eye-movement experiments, so that CPs can be decomposed into modeling-feature sets, including visual observation sequence data. The experiment results show that adding the visual sequence to neural-network modeling makes the input features more comprehensive and more consistent with the objective laws of user observation and perception, so as to obtain a more comprehensive and accurate sample-modeling feature coding. It can more effectively solve the problem of the mapping model of CP perceptual images and modeling features and generate the optimal recommended modeling feature set. With this method, designers can be assisted in meeting users’ perceptual image needs more accurately and conduct the modeling design of CPs more quickly and effectively. The main contributions of the article are as follows:
(1)
We argue that users’ visual sequence will affect their perception and evaluation when observing CPs, and the user’s observation sequence should be taken into account when establishing the mapping relationship model between the product modeling features and the perceptual images.
(2)
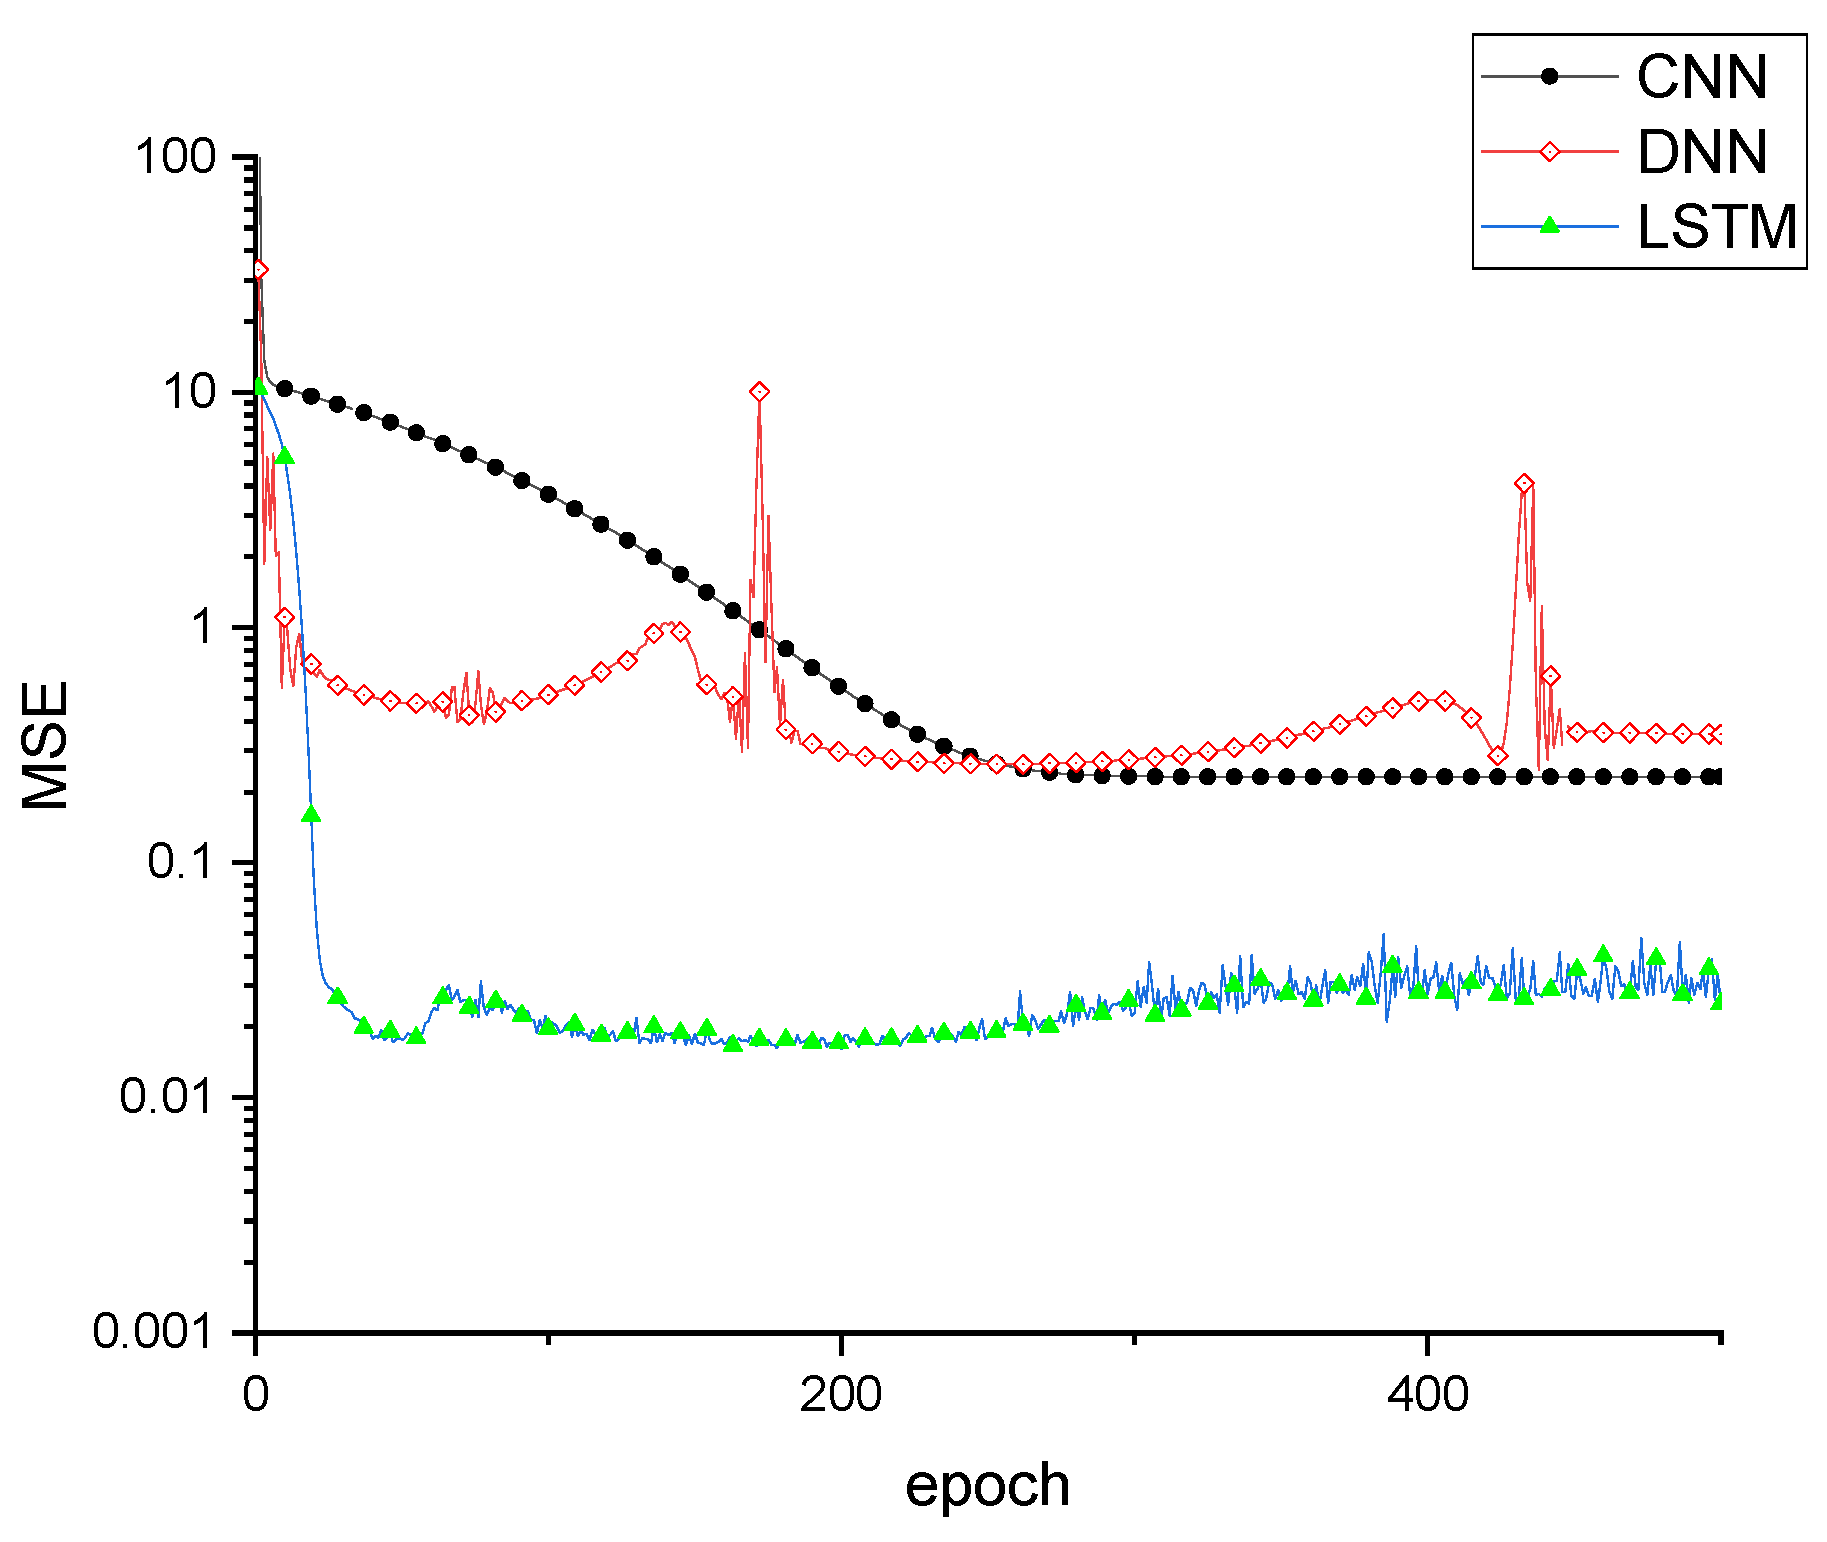
The neural network of LSTM was applied to construct a perceptual evaluation model (KE–LSTM) in order to effectively handle the timing data. It could simulate the visual sequence of CPs observed by human eyes, effectively process the modeling information of CPs with temporal characteristics, and improve the robustness of the model. Moreover, KE–LSTM has a higher model accuracy than DNN and CNN.
(3)
To deconstruct the modeling features of CPs, we propose an improved MA method based on the temporal-association function. It encodes the representative samples into a modeling feature set including visual sequence data and facilitate the input of the LSTM neural network to mine its timing information and improve the accuracy of the model.
The modeling design of CPs is always restricted by its functions, so the establishment of perceptual evaluation models can only be applied to a variable range of modeling features. Future research can be the construction of a mapping model between function modeling and perceptual evaluation based on the actual needs of customers. In the meanwhile, as the accuracy of machine learning always depends on the size of samples to be evaluated, the participants have to spend great energy and time scanning and evaluating the large number of samples, which limit inviting more experts to participate in the evaluation experiment. The authors guess that the evaluation data may be more accurate and appropriate if we could invite more experts as our participants. This will be our future direction and motivation.

Author Contributions

Conceptualization, J.-J.D. and P.-S.L.; methodology, J.-J.D.; software, P.-S.L.; validation, F.-A.S., Q.L. and P.-S.L.; formal analysis, P.-S.L.; investigation, F.-A.S.; resources, L.-M.Z.; data curation, J.-J.D.; writing—original draft preparation, J.-J.D. and Q.L.; writing—review and editing, J.-J.D.; visualization, P.-S.L.; supervision, J.-J.D.; project administration, J.-J.D.; funding acquisition, J.-J.D. All authors have read and agreed to the published version of the manuscript.

Funding

This research was funded by Chinese Ministry of Education’s Collaborative Education Project of Production and Education, grant number 202102071001.

Informed Consent Statement

Informed consent was obtained from all participants involved in the study.

Data Availability Statement

The data presented in this study are openly available in Aistudio of BAIDU at https://aistudio.baidu.com/aistudio/projectdetail/3932147?contributionType=1&sUid=639868&shared=1&ts=1666093425885 (accessed on 1 December 2022).

Conflicts of Interest

The authors declare no conflict of interest.

References

  1. Davies, A.; Hobday, M. The Business of Projects: Managing Innovation in Complex Products and Systems. In The Business of Projects: Managing Innovation in Complex Products and Systems; Cambridge University Press: Cambridge, UK, 2005. [Google Scholar]
  2. Rocca, G.L.; Tooren, M.J.L.V. Enabling distributed multi-disciplinary design of complex products: A knowledge based engineering approach. J. Des. Res. 2007, 5, 333–352. [Google Scholar] [CrossRef]
  3. Gann, D.M.; Salter, A.J. Innovation in project-based, service-enhanced firms: The construction of complex products and systems. Res. Policy 2000, 29, 955–972. [Google Scholar] [CrossRef]
  4. Zhang, N.; Yang, Y.; Zheng, Y.; Su, J. Module partition of complex mechanical products based on weighted complex networks. J. Intell. Manuf. 2017, 30, 1973–1998. [Google Scholar] [CrossRef]
  5. Xue, D.Y.; Imaniyan, D. An Integrated Framework for Optimal Design of Complex Mechanical Products. J. Comput. Inf. Sci. Eng. 2021, 21, 041004. [Google Scholar] [CrossRef]
  6. Wang, W.; Fan, W.H.; Chang, T.Q.; Xiong, G.L. Design Optimization Process of Complex Product Based on MDO. Appl. Mech. Mater. 2014, 10–12, 155–159. [Google Scholar] [CrossRef]
  7. Zhu, Z.; Zhou, Q.; Li, B.; Visser, S. A Method of Numerical Control Equipment Appearance Design Based on Product Identity. In Mechanical Engineering and Control Systems—Proceedings of 2015 International Conference on Mechanical Engineering and Control Systems (MECS2015); World Scientific: Singapore, 2016. [Google Scholar]
  8. Chen, S.-B.; Yu, N.; Yao, Y.-S.; Liu, H.-F.; Zhang, W.-S.; Liu, J.-H.; Gu, R.; Li, K.; Yang, Y.-P. A New Design Method of Mechanical and Electrical Products Appearance Modeling Based on Entity Patterns Gene. In Proceedings of the 2017 International Conference on Mathematics, Modelling and Simulation Technologies and Applications (MMSTA 2017), Xiamen, China, 24–25 December 2017; pp. 212–218. [Google Scholar]
  9. Zhang, Q.; Lu, X.; Peng, Z.; Ren, M. Perspective: A review of lifecycle management research on complex products in smart-connected environments. Int. J. Prod. Res. 2019, 57, 6758–6779. [Google Scholar] [CrossRef]
  10. Kim, S.; Kandampully, J.; Bilgihan, A. The influence of eWOM communications: An application of online social network framework. Comput. Hum. Behav. 2018, 80, 243–254. [Google Scholar] [CrossRef]
  11. Sahoo, N.; Dellarocas, C.; Srinivasan, S. The Impact of Online Product Reviews on Product Returns. Inf. Syst. Res. 2018, 29, 723–738. [Google Scholar] [CrossRef]
  12. Gu, P.; Sosale, S. Product modularization for life cycle engineering. Robot. Comput. -Integr. Manuf. 1999, 15, 387–401. [Google Scholar] [CrossRef]
  13. Agard, B.; Bassetto, S. Modular Design for Quality and Cost. In Proceedings of the Systems Conference (SysCon), 2012 IEEE International, Vancouver, BC, Canada, 19–22 March 2012. [Google Scholar]
  14. ElMaraghy, H.A.; Mahmoudi, N. Concurrent design of product modules structure and global supply chain configurations. Int. J. Comput. Integr. Manuf. 2009, 22, 483–493. [Google Scholar] [CrossRef]
  15. Nagamachi, M. Kansei engineering as a powerful consumer-oriented technology for product development. Appl. Ergon. 2002, 33, 289–294. [Google Scholar] [CrossRef] [PubMed]
  16. Nagamachi, M. Kansei Engineering: A new ergonomic consumer-oriented technology for product development. Int. J. Ind. Ergon. 1995, 15, 3–11. [Google Scholar] [CrossRef]
  17. Zhao, W.; Qiang, L.; Li, W.; Yang, C. Research on Evaluation Method of Product Style Semantics Based on Neural Network. Res. J. Appl. Sci. Eng. Technol. 2013, 6, 4330–4335. [Google Scholar] [CrossRef]
  18. Hsiao, S.W.; Tsai, H.C. Applying a hybrid approach based on fuzzy neural network and genetic algorithm to product form design. Int. J. Ind. Ergon. 2014, 35, 411–428. [Google Scholar] [CrossRef]
  19. Lin, Y.C.; Lai, H.H.; Yeh, C.H.; Hung, C.H. A Hybrid Approach to Determining the Best Combination on Product Form Design. In Proceedings of the International Conference on Knowledge-Based and Intelligent Information and Engineering Systems, Melbourne, Australia, 14–16 September 2005; Springer: Berlin/Heidelberg, Germany, 2005. [Google Scholar]
  20. Jiang, H.; Kwong, C.K.; Liu, Y.; Ip, W.H. A methodology of integrating affective design with defining engineering specifications for product design. Int. J. Prod. Res. 2015, 53, 2472–2488. [Google Scholar] [CrossRef]
  21. Polignano, M.; Narducci, F.; de Gemmis, M.; Semeraro, G. Towards Emotion-aware Recommender Systems: An Affective Coherence Model based on Emotion-driven Behaviors. Expert Syst. Appl. 2021, 170, 114382. [Google Scholar] [CrossRef]
  22. Hong, Y.; Zeng, X.Y.; Wang, Y.Y.; Bruniaux, P.; Chen, Y. CBCRS: An open case-based color recommendation system. Knowl.-Based Syst. 2018, 141, 113–128. [Google Scholar] [CrossRef] [Green Version]
  23. Xue, L.; Jin, Z.Y.; Yan, H.; Pan, Z.J. Development of novel fashion design knowledge base by integrating conflict rule processing mechanism and its application in personalized fashion recommendations. Text. Res. J. 2022, 004051752211298. [Google Scholar] [CrossRef]
  24. Zhang, Y.; Liu, X.; Shi, Y.Y.; Guo, Y.Q.; Xu, C.Q.; Zhang, E.W.; Tang, J.X.; Fang, Z.J. Fashion Evaluation Method for Clothing Recommendation Based on Weak Appearance Feature. Sci. Program. 2017, 2017, 1–12. [Google Scholar] [CrossRef] [Green Version]
  25. Hwangbo, H.; Kim, Y.S.; Cha, K.J. Recommendation system development for fashion retail e-commerce. Electron. Commer. Res. Appl. 2018, 28, 94–101. [Google Scholar] [CrossRef]
  26. Chen, H.-Y.; Yang, C.-C.; Ko, Y.-T.; Chang, Y.-M.; Chang, H.-C. Product form feature selection methodology based on numerical definition-based design. Concurr. Eng. Res. Appl. 2014, 22, 183–196. [Google Scholar] [CrossRef]
  27. Fan, K.K.; Chiu, C.H.; Yang, C.C. Green technology automotive shape design based on neural networks and support vector regression. Eng. Comput. Int. J. Comput. Aided Eng. Softw. 2014, 31, 1732–1745. [Google Scholar]
  28. Guo, F.; Liu, W.L.; Liu, F.T.; Wang, H.; Wang, T.B. Emotional design method of product presented in multi-dimensional variables based on Kansei Engineering. J. Eng. Des. 2014, 25, 194–212. [Google Scholar] [CrossRef]
  29. Fu, Q.; Lv, J.; Tang, S.; Xie, Q. Optimal Design of Virtual Reality Visualization Interface Based on Kansei Engineering Image Space Research. Symmetry 2020, 12, 1722. [Google Scholar] [CrossRef]
  30. Kwapień, J.; Drozdz, S. Physical approach to complex systems. Phys. Rep. A Rev. Sect. Phys. Lett. Sect. C 2012, 515, 115–226. [Google Scholar] [CrossRef]
  31. Quan, H.; Li, S.; Hu, J. Product Innovation Design Based on Deep Learning and Kansei Engineering. Appl. Sci. 2018, 8, 2397. [Google Scholar] [CrossRef] [Green Version]
  32. Schmidhuber, J. Deep learning in neural networks: An overview. Neural Netw. 2015, 61, 85–117. [Google Scholar] [CrossRef] [Green Version]
  33. Qin, Z.; Hui, W.; Dong, J.; Zhong, G.; Xin, S. Prediction of Sea Surface Temperature using Long Short-Term Memory. IEEE Geosci. Remote Sens. Lett. 2017, 14, 1745–1749. [Google Scholar]
  34. Han, J.X.; Ma, M.Y.; Wang, K. Product modeling design based on genetic algorithm and BP neural network. Neural Comput. Appl. 2021, 33, 4111–4117. [Google Scholar] [CrossRef]
  35. Chou, J.R. A Kansei evaluation approach based on the technique of computing with words. Adv. Eng. Inform. 2016, 30, 1–15. [Google Scholar] [CrossRef]
  36. Huang, Y.; Chen, C.H.; Li, P.K. Kansei clustering for emotional design using a combined design structure matrix. Int. J. Ind. Ergon. 2012, 42, 416–427. [Google Scholar] [CrossRef]
  37. Zhai, L.Y.; Khoo, L.P.; Zhong, Z.W. A rough set based decision support approach to improving consumer affective satisfaction in product design. Int. J. Ind. Ergon. 2009, 39, 295–302. [Google Scholar] [CrossRef]
  38. Osgood, C.E. Exploration in semantic space: A personal diary. J. Soc. Issues 1971, 27, 5–64. [Google Scholar] [CrossRef]
  39. Wu, Y.X. Product form evolutionary design system construction based on neural network model and multi-objective optimization. J. Intell. Fuzzy Syst. 2020, 39, 7977–7991. [Google Scholar] [CrossRef]
  40. Li, Y.; Wang, Z.; Zhang, L.; Chu, X.; Xue, D. Function Module Partition for Complex Products and Systems Based on Weighted and Directed Complex Networks. J. Mech. Des. 2016, 139, 021101. [Google Scholar] [CrossRef]
  41. Chen, W. Research and Application of "Rhythm and Rhyme" in the Modelling Design on Agricultural Machinery Product. In Proceedings of the 2020 4th International Conference on Electrical, Automation and Mechanical Engineering (EAME2020), Beijing, China, 21–22 June 2020; pp. 908–912. [Google Scholar]
  42. Gers, F.A.; Schraudolph, N.N.; Schmidhuber, J. Learning precise timing with LSTM recurrent networks. J. Mach. Learn. Res. 2003, 3, 115–143. [Google Scholar] [CrossRef]
  43. Kumar, S. Neural Networks: A Classroom Approach; Tata McGraw-Hill Education: NewYork, NY, USA, 2004. [Google Scholar]
  44. Boryczko, J.; Blachnik, M.; Golak, S. Optimization of Warehouse Operations with Genetic Algorithms. Appl. Sci. 2020, 10, 4817. [Google Scholar]
  45. Wang, D. Zoomlion Truck Crane Design; Hunan University: Changsha, China, 2014. [Google Scholar]
  46. Xiao, H. A Research on the Form Feature of Truck Crane Base on the Perceptual Intention; Hunan University: Changsha, China, 2012. [Google Scholar]
  47. Wang, Y.H.; Yu, S.H.; Chen, D.K.; Chu, J.N.; Liu, Z.; Wang, J.L.; Ma, N. Artificial intelligence design decision making model based on deep learning. Comput. Integr. Manuf. Syst. 2019, 25, 9. [Google Scholar]
  48. Franceschini, F.; Maisano, D. Decision concordance with incomplete expert rankings in manufacturing applications. Res. Eng. Des. 2020, 31, 471–490. [Google Scholar] [CrossRef]
  49. Gunay Molu, N.; Ozkan, B. Adaptation into Turkish of Fear and Behavioral Intentions Scale. Anadolu Psikiyatr. Derg.-Anatol. J. Psychiatry 2018, 19, 80–86. [Google Scholar] [CrossRef]
  50. Gearhart, A.; Booth, D.T.; Sedivec, K.; Schauer, C. Use of Kendall’s coefficient of concordance to assess agreement among observers of very high resolution imagery. Geocarto Int. 2013, 28, 517–526. [Google Scholar] [CrossRef]
  51. Girzadas, D.V.; Harwood, R.C.; Dearie, J.; Garrett, S. A comparison of standardized and narrative letters of recommendation. Acad. Emerg. Med. 1998, 5, 1101–1104. [Google Scholar] [CrossRef] [PubMed]
  52. Beckman, T.J.; Lee, M.C.; Rohren, C.H.; Pankratz, V.S. Evaluating an instrument for the peer review of inpatient teaching. Med. Teach. 2003, 25, 131–135. [Google Scholar] [CrossRef] [PubMed]
  53. Kendall, M.G.; Smith, B.B. The problem of m rankings. Ann. Math. Stat. 1939, 10, 275–287. [Google Scholar] [CrossRef]
  54. Friedman, L.; Stern, H.; Brown, G.G.; Mathalon, D.H.; Turner, J.; Glover, G.H.; Gollub, R.L.; Lauriello, J.; Lim, K.O.; Cannon, T.; et al. Test-retest and between-site reliability in a multicenter fMRI study. Hum. Brain Mapp. 2008, 29, 958–972. [Google Scholar] [CrossRef] [Green Version]
  55. Stephens, J.P.; Vos, G.A.; Stevens, E.M.; Moore, J.S. Test-retest repeatability of the Strain Index. Appl. Ergon. 2006, 37, 275–281. [Google Scholar] [CrossRef] [Green Version]
  56. Lane, H.G.; Driessen, R.; Campbell, K.; Deitch, R.; Turner, L.; Parker, E.A.; Hager, E.R. Development of the PEA-PODS (Perceptions of the Environment and Patterns of Diet at School) Survey for Students. Prev. Chronic Dis. 2018, 15, E88. [Google Scholar] [CrossRef] [Green Version]
  57. Dhakal, P.; Gamble, J.; Creedy, D.K.; Newnham, E. Development of a tool to assess students’ perceptions of respectful maternity care. Midwifery 2022, 105, 103228. [Google Scholar] [CrossRef]
  58. Haykin, S. Neural Networks and Learning Machines, 3/E; Pearson Education India: Delhi, India, 2009. [Google Scholar]
  59. Cai, M.; Liu, J. Maxout neurons for deep convolutional and LSTM neural networks in speech recognition. Speech Commun. 2016, 77, 53–64. [Google Scholar] [CrossRef]
  60. Lee, K.; Choi, C.; Shin, D.H.; Kim, H.S. Prediction of Heavy Rain Damage Using Deep Learning. Water 2020, 12, 1942. [Google Scholar] [CrossRef]
  61. Do, N.Q.; Selamat, A.; Krejcar, O.; Yokoi, T.; Fujita, H. Phishing Webpage Classification via Deep Learning-Based Algorithms: An Empirical Study. Appl. Sci. 2021, 11, 9210. [Google Scholar] [CrossRef]
  62. LeCun, Y.; Bengio, Y.; Hinton, G. Deep learning. Nature 2015, 521, 436–444. [Google Scholar] [CrossRef] [PubMed]
  63. Noreen, S.; Ashraf, M.A.; Ya-nan, Q. Multi-Lingual Language Variety Identification using Conventional Deep Learning and Transfer Learning Approaches. Int. Arab J. Inf. Technol. 2022, 19, 705–712. [Google Scholar] [CrossRef]
  64. Huang, L.; Zhang, Y.; Pan, W.J.; Chen, J.Y.; Qian, L.P.; Wu, Y. Visualizing Deep Learning-Based Radio Modulation Classifier. IEEE Trans. Cogn. Commun. Netw. 2021, 7, 47–58. [Google Scholar] [CrossRef]
  65. Saranya, N.; Srinivasan, K.; Kumar, S.K.P. Banana ripeness stage identification: A deep learning approach. J. Ambient. Intell. Humaniz. Comput. 2021, 13, 4033–4039. [Google Scholar] [CrossRef]
  66. Liu, D.; Li, Y.; Lin, J.P.; Li, H.Q.; Wu, F. Deep Learning-Based Video Coding: A Review and a Case Study. Acm Comput. Surv. 2020, 53, 1–35. [Google Scholar] [CrossRef] [Green Version]
  67. Hodson, T.O. Root-mean-square error (RMSE) or mean absolute error (MAE): When to use them or not. Geosci. Model Dev. 2022, 15, 5481–5487. [Google Scholar] [CrossRef]
Figure 1. Framework diagram of the CP-KEDL method.
Applsci 13 00710 g001
Figure 2. 5-point semantic difference scale.
Applsci 13 00710 g002
Figure 3. Partial sample pictures.
Applsci 13 00710 g003
Figure 4. Excerpts from the questionnaire of truck-crane perceptual image evaluation.
Applsci 13 00710 g004
Figure 5. Procedures and results of the eye-movement experiment.
Applsci 13 00710 g005
Figure 6. Partial visual trace of participants.
Applsci 13 00710 g006
Figure 7. Users’ visual trace when observing the truck crane.
Applsci 13 00710 g007
Figure 8. Perceptual evaluation and prediction model of truck cranes based on LSTM (KE–LSTM).
Applsci 13 00710 g008
Figure 9. Training loss gradient diagram of the KE–LSTM model.
Applsci 13 00710 g009
Figure 10. Flow chart of the GA model establishment.
Applsci 13 00710 g010
Figure 11. Iteration diagram of the GA model.
Applsci 13 00710 g011
Figure 12. Modeling feature set of the optimal truck-crane design scheme.
Applsci 13 00710 g012
Figure 13. Comparison of the training losses of DNN, CNN, and LSTM models.
Applsci 13 00710 g013
Table 1. The selected perceptual vocabularies of truck cranes.
Perceptual Vocabularies
Steady–light Integral–piecemealTechnological–traditional
Table 2. The result and analysis of the first experiment.
SampleTechnological–
Traditional
Steady–LightIntegral–Piecemeal
Mean Evaluation
Values
X144.43.9
X23.23.83.9
X34.34.44
X44.33.93.7
X53.83.73.4
X2064.34.34.3
Reliability and validity testKendall’s concordance coefficient (W)0.608
p0.000
Table 3. The result and analysis of the retest experiment.
SampleTechnological-
Traditional
Steady–LightIntegral–piecemeal
Mean Evaluation
Values
X14.14.24
X22.83.93.8
X34.24.64.4
X44.23.93.8
X53.73.83.6
X2064.44.24.8
Reliability and validity testKendall’s concordance coefficient (W)0.603
p0.000
Pearson correlation coefficient of the two experiment results0.917
Table 4. Eye-movement experiment samples.
Technological–TraditionalIntegral–PiecemealSteady–Light
High scoreApplsci 13 00710 i001Applsci 13 00710 i002Applsci 13 00710 i003
4.3 points4.3 points4.0 points
Middle scoreApplsci 13 00710 i004Applsci 13 00710 i005Applsci 13 00710 i006
3.0 points3.5 points3.4 points
Low scoreApplsci 13 00710 i007Applsci 13 00710 i008Applsci 13 00710 i009
2.8 points2.7 points2.7 points
Table 5. The mean score of each visual-interest region.
Visual-Interest RegionMean Score
Head4.75
Body3.08
Boom3.09
Operation bin2.58
Chassis1.5
Table 6. The modeling-feature-category set of truck crane.
ComponentItemCategory
CodeName
Head (P1)P11Front face lineNoneApplsci 13 00710 i010Applsci 13 00710 i011Applsci 13 00710 i012Applsci 13 00710 i013Applsci 13 00710 i014Applsci 13 00710 i015
01020304050607
P12Window typeApplsci 13 00710 i016Applsci 13 00710 i017Applsci 13 00710 i018Applsci 13 00710 i019
08091011
P13Front window lineApplsci 13 00710 i020Applsci 13 00710 i021Applsci 13 00710 i022
121314
P14Window lineApplsci 13 00710 i023Applsci 13 00710 i024Applsci 13 00710 i025Applsci 13 00710 i026Applsci 13 00710 i027Applsci 13 00710 i028Applsci 13 00710 i029Applsci 13 00710 i030Applsci 13 00710 i031Applsci 13 00710 i032
15161718192021222324
P15Skirt lineApplsci 13 00710 i033Applsci 13 00710 i034Applsci 13 00710 i035Applsci 13 00710 i036Applsci 13 00710 i037Applsci 13 00710 i038Applsci 13 00710 i039Applsci 13 00710 i040Applsci 13 00710 i041Applsci 13 00710 i042
15161718192021222324
P16BumperHiddenExposed
2526
P17Main color matchingYellowGreenBlackGrayWhiteRedBlue
52535455565758
P18Auxiliary color matchingYellowGreenBlackGrayWhiteRedBlue
52535455565758
Boom (P2)P21Steel frameWith steel frameWithout steel frame
2728
P22ShapeApplsci 13 00710 i043Applsci 13 00710 i044Applsci 13 00710 i045
293031
P23SizeLargeMediumSmall
323334
P24DecorateStructureSignNone
454647
P25Color matching 1Yellow Green Black Gray WhiteRedBlue
52535455565758
P26Color matching 2Yellow Green Black Gray WhiteRedBlue
52535455565758
P27Color matching 3Yellow Green Black Gray WhiteRedBlue
52535455565758
Body-Chassis (P3)P31Hub colorBlackWhite
5456
P32Chassis package typeChassis bread wrappingChassis line wrappingChassis warning line wrappingChassis all tires
37383940
P33BodyYesNo
4142
P34Body decorationColor divisionStructure division Mark/logo DivisionNo decoration
45464748
P35Main body color matchingYellow Green Black Gray WhiteRedBlue
52535455565758
P36Body auxiliary colorYellow Green Black Gray WhiteRedBlue
52535455565758
P37Empty areaYesNo
4344
P38Tail statusRegular tailMessy tail No tail
495051
Operation bin (P4)P41Cockpit front face lineNoneApplsci 13 00710 i046Applsci 13 00710 i047Applsci 13 00710 i048Applsci 13 00710 i049Applsci 13 00710 i050Applsci 13 00710 i051
01020304050607
P42Cockpit window typeApplsci 13 00710 i052Applsci 13 00710 i053Applsci 13 00710 i054Applsci 13 00710 i055
08091011
P43Cockpit front window lineApplsci 13 00710 i056Applsci 13 00710 i057Applsci 13 00710 i058
121314
P44Window lineApplsci 13 00710 i059Applsci 13 00710 i060Applsci 13 00710 i061Applsci 13 00710 i062Applsci 13 00710 i063Applsci 13 00710 i064Applsci 13 00710 i065Applsci 13 00710 i066Applsci 13 00710 i067Applsci 13 00710 i068
15161718192021222324
P45Skirt lineApplsci 13 00710 i069Applsci 13 00710 i070Applsci 13 00710 i071Applsci 13 00710 i072Applsci 13 00710 i073Applsci 13 00710 i074Applsci 13 00710 i075Applsci 13 00710 i076Applsci 13 00710 i077Applsci 13 00710 i078
15161718192021222324
P46Main color matchingYellow Green Black Gray WhiteRedBlue
52535455565758
P47Auxiliary colorYellow Green Black Gray WhiteRedBlue
52535455565758
Table 7. Modeling-feature-category coding of truck cranes with visual sequence.
SampleHead (P1)Boom (P2)Body–Chassis (P3)Operation bin (P4)
X1[1,11,13,15,15,25,54,55][28,31,34,45,53,53,54][36,39,42,0,0,0,44,50][1,11,14,15,15,55,54]
X2[1,8,14,19,15,26,52,54][28,31,33,47,52,52,52][36,39,41,47,54,52,44,49][4,8,14,19,15,54,52]
X3[1,8,14,19,23,26,56,58][28,30,32,47,57,56,56][35,37,41,46,58,56,44,49][1,8,14,19,23,56,58]
X4[3,11,13,15,16,26,56,54][27,31,34,45,53,53,54][36,38,41,46,56,53,44,50][1,11,14,15,15,56,54]
X5[1,9,13,15,23,26,55,54][27,31,33,45,53,53,54][36,38,41,46,55,53,44,49][1,9,14,15,15,55,54]
X206[5,8,14,21,22,26,56,54][28,30,32,47,57,56,56][36,37,41,46,56,54,43,49][1,8,14,21,22,56,54]
Table 8. Evaluation results of LSTM, CNN, and DNN models.
Model StructureMSERMSE
LSTM0.020.14
CNN0.230.48
DNN0.300.55
Disclaimer/Publisher’s Note: The statements, opinions and data contained in all publications are solely those of the individual author(s) and contributor(s) and not of MDPI and/or the editor(s). MDPI and/or the editor(s) disclaim responsibility for any injury to people or property resulting from any ideas, methods, instructions or products referred to in the content.

