Article

Influence of Normal Stiffness and Shear Rate on the Shear Behaviors and Acoustic Emissions Characteristics of Artificial Rock Joints

1
College of Energy and Mining Engineering, Shandong University of Science and Technology, Qingdao 266590, China
2
Shandong Provincial Key Laboratory of Civil Engineering Disaster Prevention and Mitigation, Shandong University of Science and Technology, Qingdao 266590, China
3
School of Engineering, Nagasaki University, Nagasaki 852-8521, Japan
4
College of Resources, Shandong University of Science and Technology, Tai’an 271019, China
*
Author to whom correspondence should be addressed.
Appl. Sci. 2023, 13(2), 1189; https://doi.org/10.3390/app13021189
Submission received: 17 November 2022 / Revised: 7 January 2023 / Accepted: 8 January 2023 / Published: 16 January 2023
(This article belongs to the Special Issue Fracture and Failure of Jointed Rock Mass)

Abstract

:
Understanding the asperity damage behaviors of joints during shearing is critical for evaluating the stability of deep underground engineering structures. In this paper, we prepared plaster joints and used them for direct shear tests under different normal stiffness (0–7 MPa/mm) and various shear rate (0.5–20 mm/min) conditions. The effects of normal stiffness and shear rate on mechanical behavior and AE characteristics were studied. With the increase of normal stiffness, the damaged area of the surface of the joint and the weight of the damaged, rough body basically show a linear increase. With the increase of the shear rate, the peak shear stress and the final shear stress of the joint are non-linearly decreased (the decrease rate at the shear rate of 0.5–5 mm/min is much larger than that at the shear rate of 5–20 mm/min), more local cracks appear on the surface of the joint, and the dilatancy of the joint slightly decreases. More than 60% of the acoustic emission signals in the shearing process of the joint are concentrated in the post-peak phase. With the increase of normal stiffness, the cumulative number of acoustic emission impacts and cumulative energy both increase. With the increase in shear rate, the accumulated acoustic emission impact number decreases, and the accumulated AE energy tends to increase when the shear rate is 0.5–5 mm/min and decreases when the shear rate increases to 5–20 mm/min.

1. Introduction

Different discontinuous structural planes exist in rock masses, including joints, beds, faults, and fissures. In most cases, the existence of discontinuities weakens a rock mass, which significantly affects its mechanical behavior and influences the safety of geotechnical structures like underground works and excavations in slopes [1,2,3,4,5]. At present, lots of previous researchers [6,7,8,9,10] have investigated the shear behavior of joints through experiments and numerical simulations in terms of shear strength, shear failure characteristics, and changes in fracture permeability. Studies by many scholars [11,12] show that the degradation of joint surface roughness is one of the main reasons for the change in joint shear characteristics. Therefore, it is important to accurately describe the degradation of joint surface roughness during shearing.
Acoustic emission (AE) technology can dynamically and non-destructively monitor micro-failure signals of rock and has been widely used in the study of joint surface roughness degradation law. For example, Moradian et al. [13] applying the AE technique, characterized the location of an asperity failure zone and the failure intensity in a joint surface during shearing. Their results reveal that the AE method provides sufficient precision to capture the asperity damage process. Meng et al. [14] performed a direct shear to look at the effect of normal stress on the AE indicators of joints. It indicated that the AE energy rate of joints was more active under a high normal stress condition. Chai et al. [15] identified and predicted fatigue crack growth (FCG) of 316LN stainless steel under various tension proportions by drawing out several AE specifications from AE waves and associating AE indicates with FCG under various tons proportions. The study of Muir et al. [16] found that there were encoded features in the frequency domain of waveform which linked acoustic emission with damage mode. Wang et al. [17], by embracing the electronic picture correlation, showed a collection of heterogeneous CJB designs were developed. The constant fracture procedure and acoustic emissions are caught numerically under differing side pressures. The load contours under different joint range proportions and design limits are evaluated. Gong et al. [18] have studied the influence of rock heterogeneity and cylindrical irregularity on the AE energy evolution of CJB faults under lateral pressure. Wang et al. [19] studied the non-linear mechanical response and failure mechanism of articulated cylindrical basalt with transversal joints using a meso-mechanical model, statistical damage theory, and continuous mechanics. Jiang et al. [20] used AE to analyze the damages development system of joints under various roughness as well as normal stress. Liu et al. [21] used acoustic emission signal data to put forward shear failure and tensile failure judgment criteria and systematically analyzed the time and type of joint failure in the shear process. However, this aforementioned research has targeted the joints sheared beneath constant normal loading (CNL) boundary conditions. This boundary condition is only applicable to surface or shallowly buried works for deep underground engineering conditions. However, the normal stress of the joints may be changed due to the stiffness of the surrounding rock. Under this scenario, the constant normal stiffness (CNS) status is more suitable than the CNL condition [22,23,24]. To date, few studies have studied the AE qualities of the sheared joints beneath CNS circumstances. Rim et al. [25] investigated the AE characteristics of artificial joints during shear under CNS conditions. However, the AE characteristics of joints under variations of normal stiffness were not presented. Liu et al. [8] analyzed AE signals during joint cyclic shear, and the results showed that the accumulated AE energy gradually decreased with the increase in the number of cycles. It indicated that a high normal stiffness could significantly increase the number of AE signals. However, the relationship between failure modes of joint surfaces and AE characteristics has not been further discussed.
Additionally, under the action of vibrant tons such as quake, blasting, and mechanical resonance, the architectural plane will create shear motion at various rates [26,27,28]. According to Ahola et al. [29], for high-level nuclear waste repositories and dam construction, more stringent design criteria should be required, and the rate-dependent mechanical behaviors of rock joints need to be taken into account. Some previous researchers have examined the factors which impact the rate-dependent shear habits of joints, including shear rate range [30], rock type [31], and normal loading rate [32]. The shear rate affects not only the shear strength of the rock joint but also the failure modes of the joint during shear. Wang et al. [33,34] investigated the rate-dependent shear actions of rough joints during shear. The outcomes suggested that the damaged areas of joints decrease with increasing shear rate, and the corresponding cumulative AE signals are inversely proportional to the shear rate. However, the above studies were only carried out under CNL boundary status.
As aforementioned, the evolution of AE characteristics for the sheared joint under CNL condition has been widely studied. However, experimental tests that consider the effect of normal stiffness and shear rate on AE characteristics of joints have yet to be conducted. In the present study, a series of CNS direct shear tests were performed on artificial plaster joints. The effects of normal stiffness and shear rate on the mechanical behavior and AE characteristics of joints are discussed.

2. Methodology

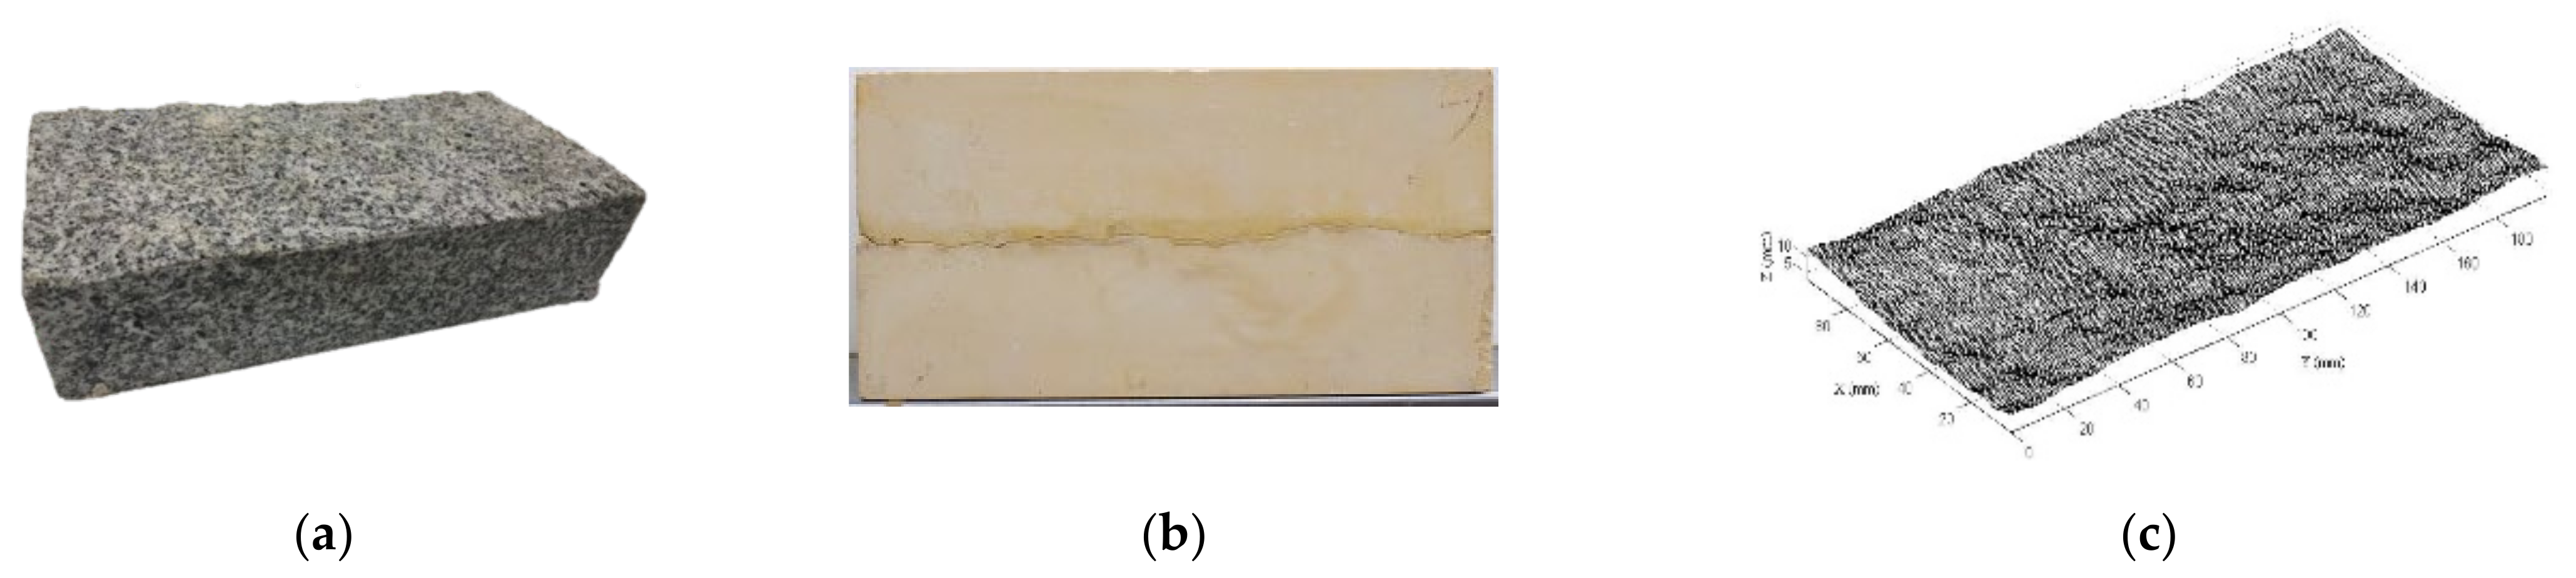
2.1. Specimen Preparation

A specimen with a size of 20 × 10 × 10 cm was cut from an intact grain granite. Then, the artificial splitting method was used to generate a fresh tensile joint. Considering the anisotropy of real rock joints, plaster joints with the same roughness are chosen to describe rock joints’ shear behaviors. The plaster reproductions were made by a mix of plaster, water, and retardant in the weight proportion of 1:0.2:0.05, which has a similar mechanical property to those of sandstone. The mechanical properties of the plaster specimen are shown in Table 1 [35], and the specimen is shown in Figure 1a,b.
The joint surface was obtained using a 3D scanning laser profile meter. Figure 1c shows the digitized joint surface. Based on scanning data, the joint roughness coefficient (JRC) was calculated using the method proposed by Tse and Cruden [36]. The calculation formula is as follows:
Z 2 = 1 ( n 1 ) ( Δ x ) 2 i = 1 n 1 ( Z i + 1 Z i ) 2 J C R = 32 + 32.47 log Z 2
In Equation (1), Z 2 is the root mean square of slope; Δ x is interval between data points, mm; n is the number of data points on each line; Z i is the coordinate of each curve, mm.
Finally, the calculated JRC of the structural plane is 7.36.

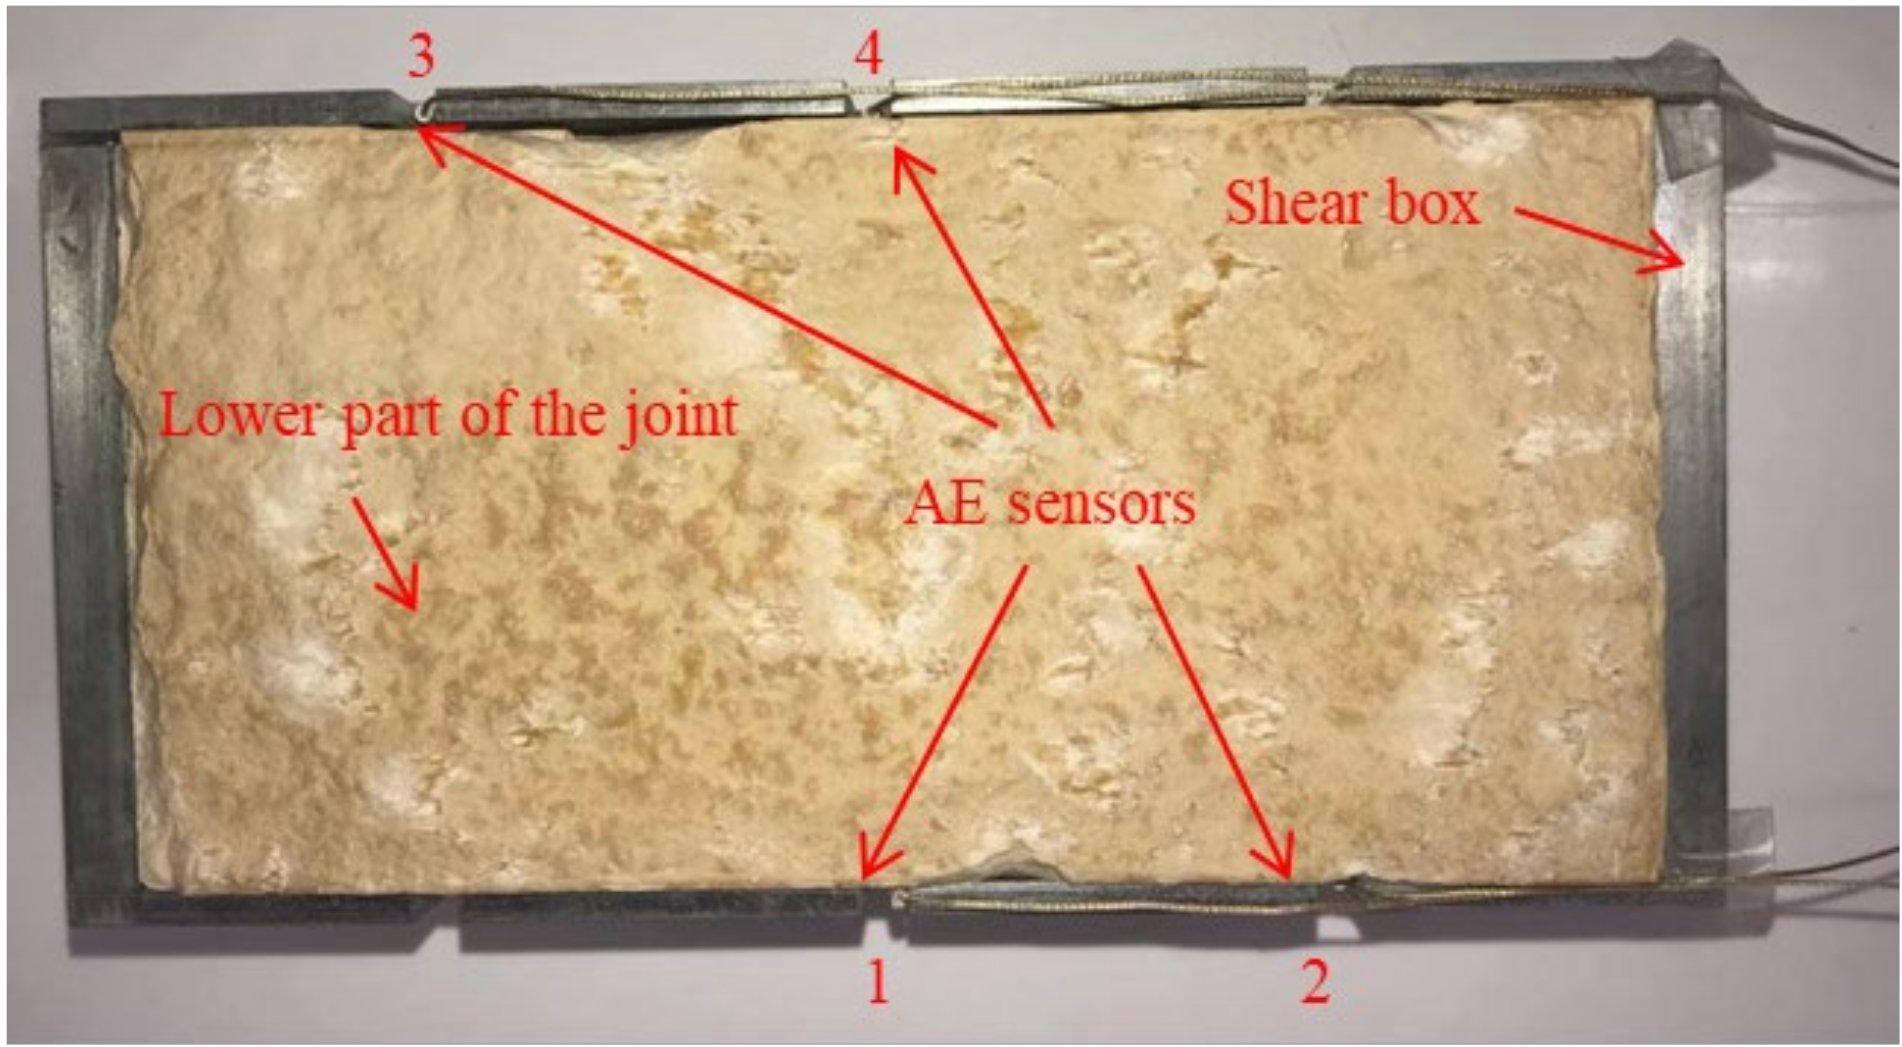
2.2. Experimental System and Procedure

We used the servo-controlled direct shearing device for tests in the present research, as shown in Figure 2. This apparatus is composed of a mechanical loading system, a control system, and a data processing system. This apparatus can be servo-controlled to achieve various normal stiffness conditions with good precision. More detail of the configuration of the apparatus was reported by Jiang et al. [23].
Before the shear test, a normal stress of 2 MPa was applied to the shear case at one rate of 0.5 MPa/min. After the predetermined normal stress was reached, the required normal stiffness value was set with the LabVIEW interface on a personal computer. Then, the shear load was applied after the normal stress remained constant. The terminated shear displacement was 10 mm. During shearing, the acoustic emissions were detected with an 8-channel PAC-AE system. Four PICO sensors were employed to discern the AE single, as displayed in Figure 3. The AE sensors have an operating frequency from 200 to 750 kHz, and the full-waveform data were measured at a rate of 1 MHz. Forty dB was selected as the trigger threshold of the preamplifier. The test cases and their respective threshold conditions are shown in Table 2. For each test case, at least 2 pairs of replicas were prepared for replicate testing until fairly close results were obtained.

2.3. Experimental Design

The loading scheme adopted in the test is shown in Table 2, which is as follows: the initial normal stress (σn) is 2 MPa to simulate stress conditions of common underground tunnels, chambers, and other surrounding rocks [37]. The normal stiffness (kn) is 0,1,3,5 and 7 MPa/mm, respectively, and the shear rate (v) is 0.5 mm/min. The shear rates are 0.5, 2.5, 5,10, and 20 mm/min, respectively, and the vertical stiffness is 3 MPa/mm.

3. Shear Behaviors

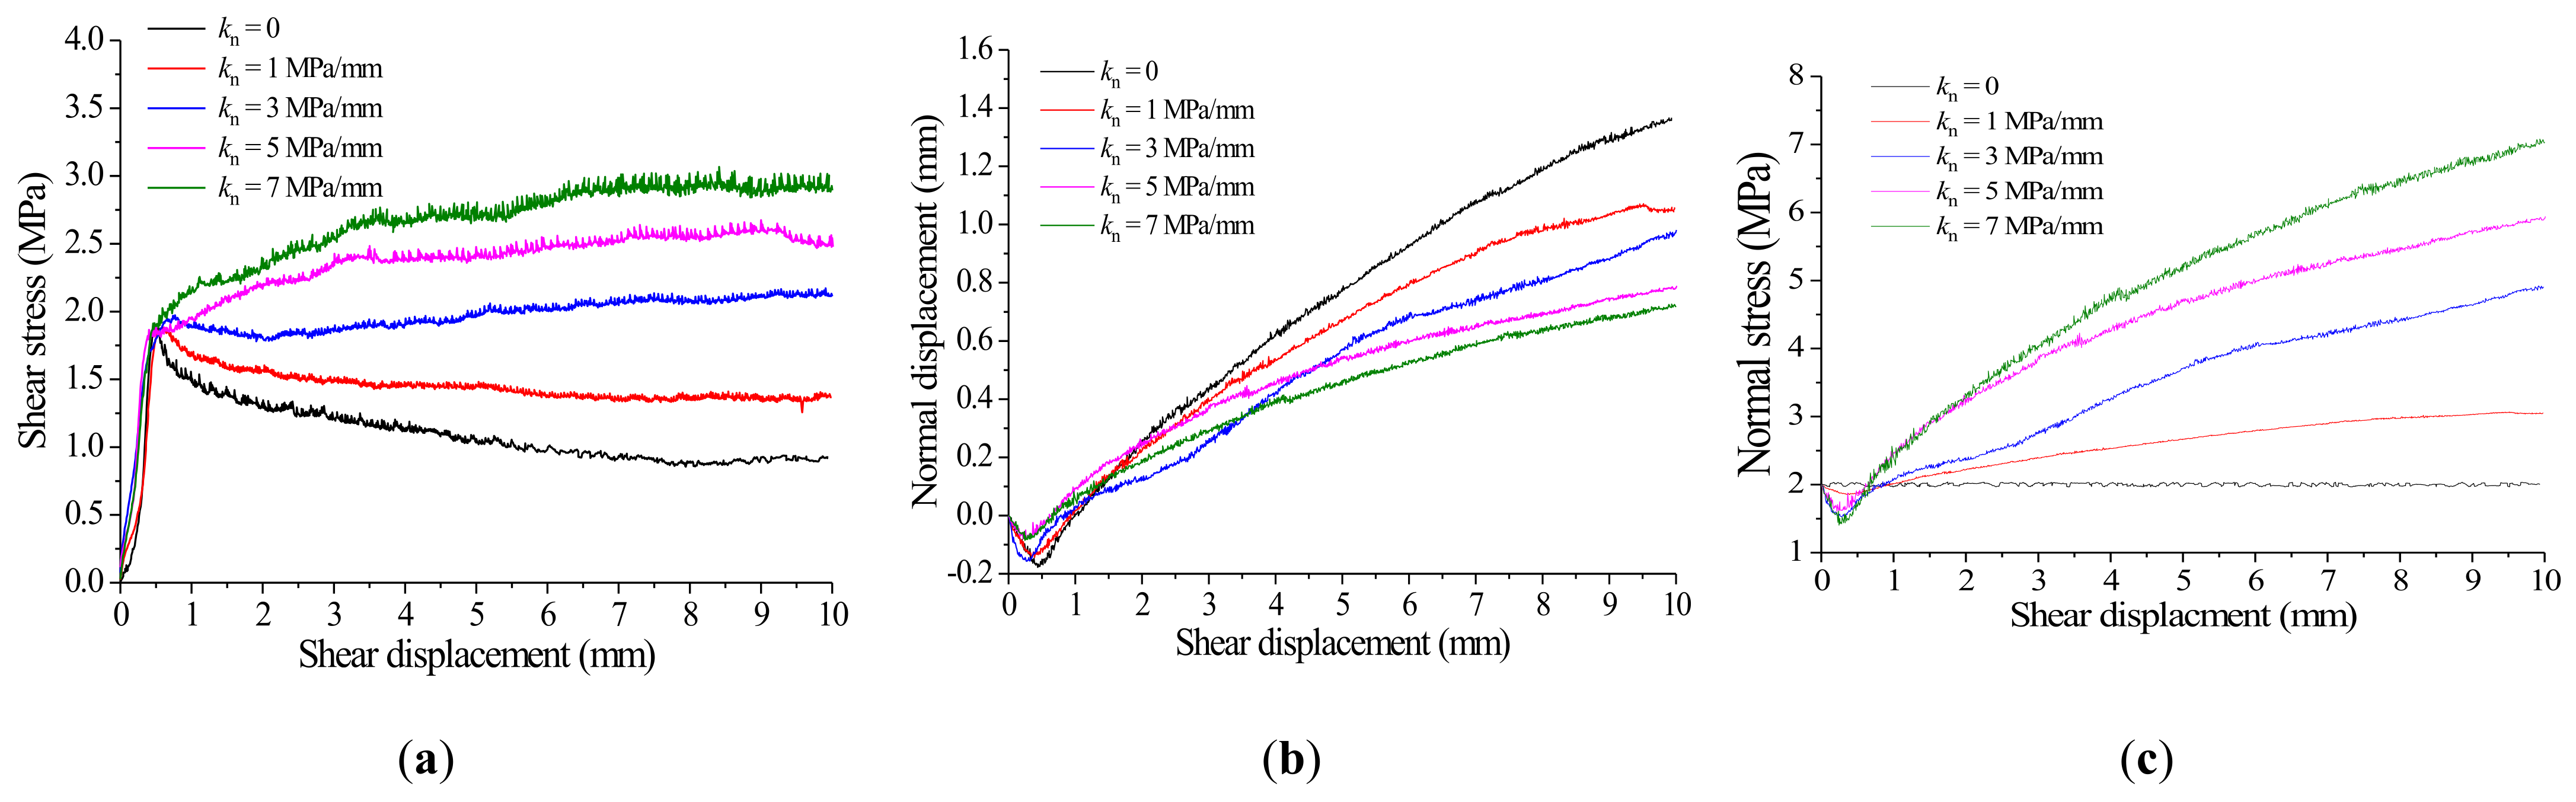
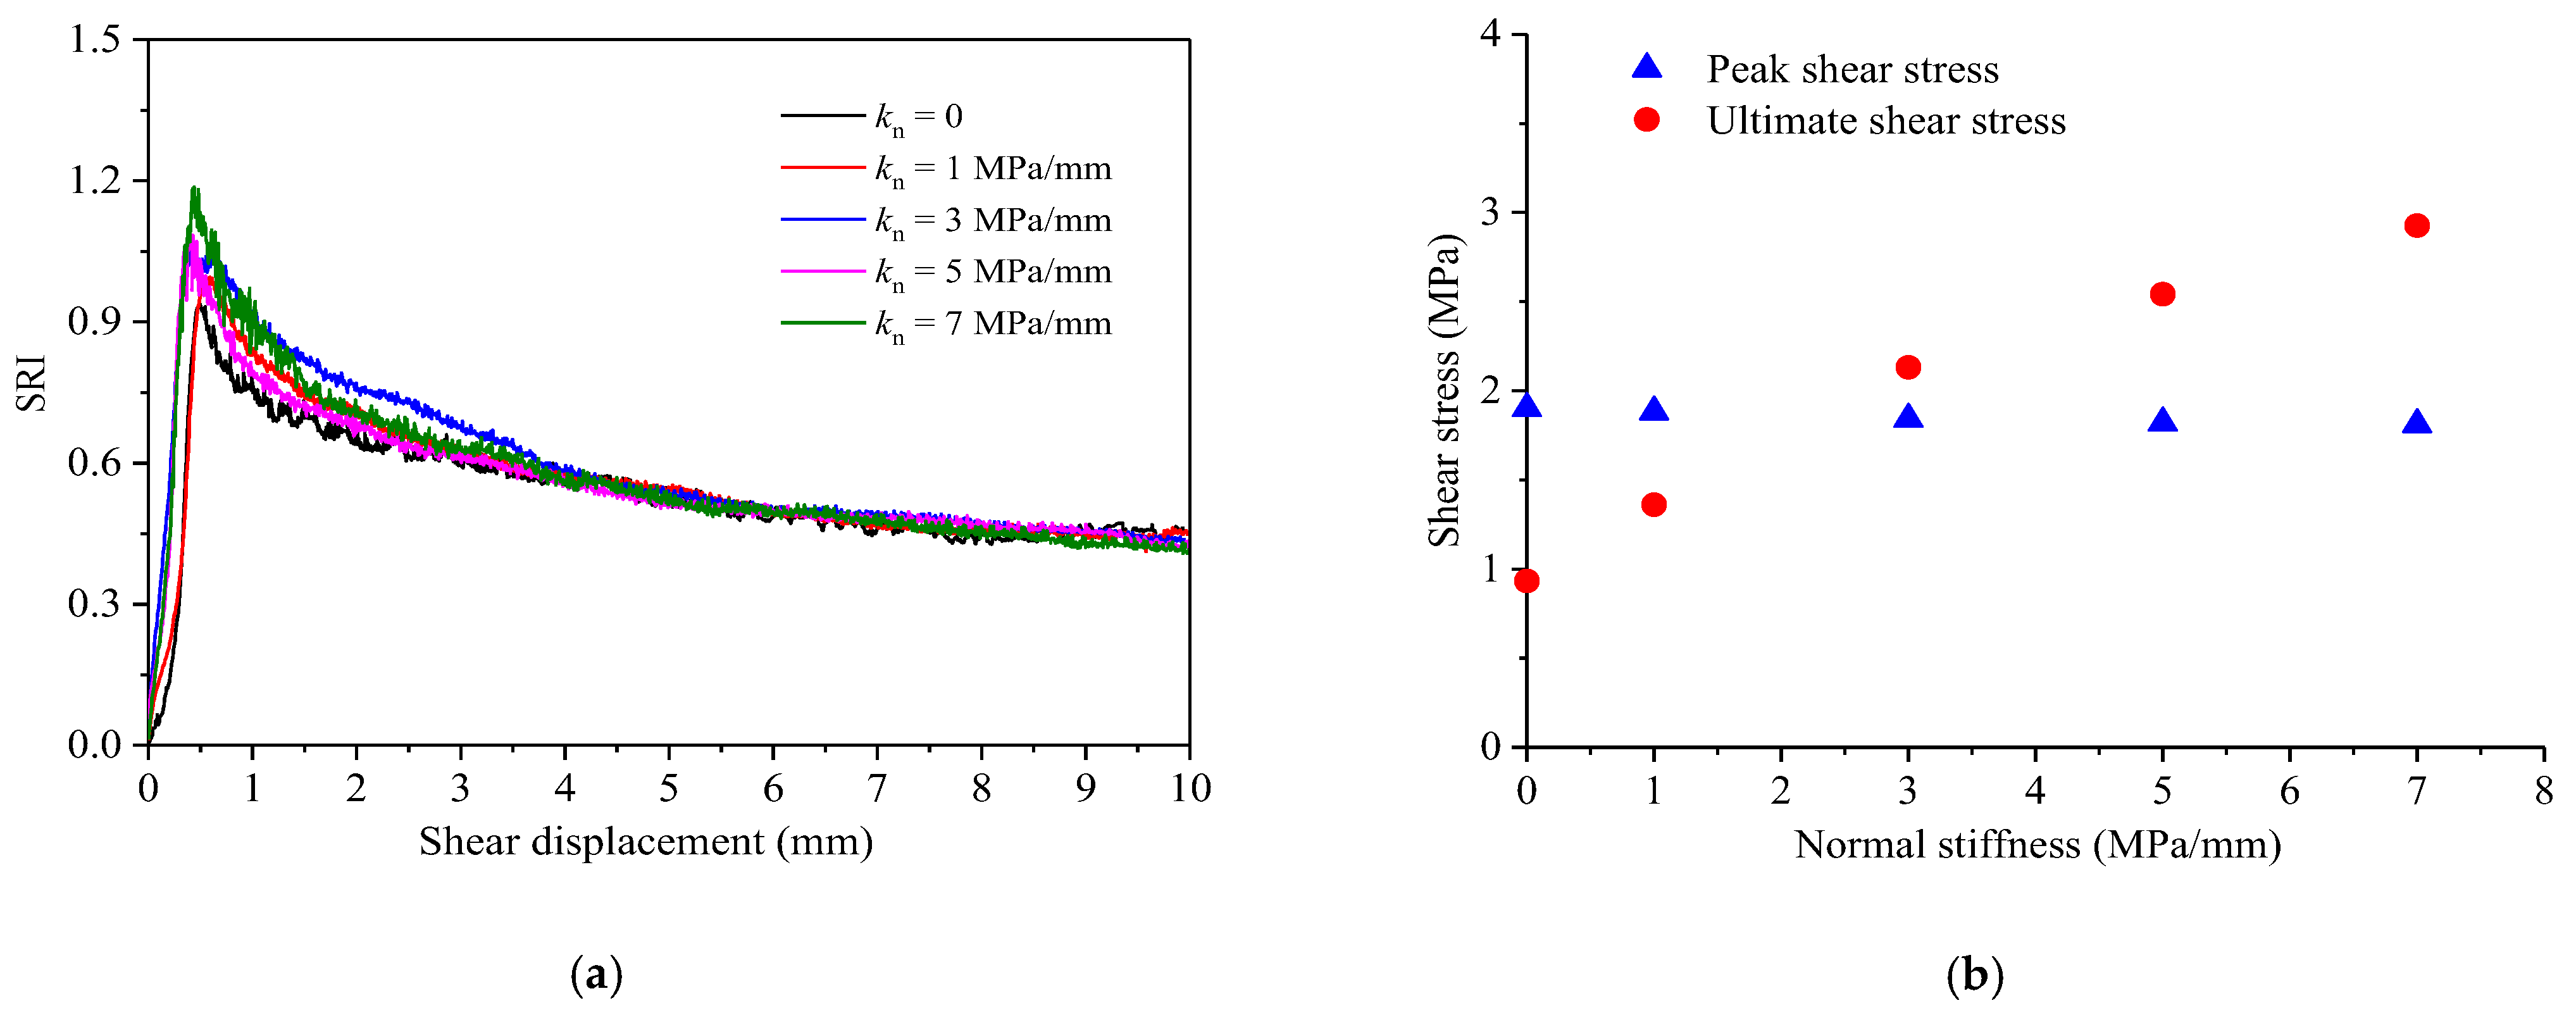
3.1. Effect of Normal Stiffness

Figure 4 demonstrates the shear actions of the joint at diverse normal stiffness. As displayed in Figure 4a, for the CNL condition (kn = 0), the curves of shear stress versus displacement can be split into three stages. In stage I, the shear stress rapidly increases with a linear concern with the shear displacement up till it achieves the peak. In stage II, the curve displays stress-softening conduct, characterized by a rapid decrease in shear stress. Finally, the variation of shear stress tends to be stable at approximately 5 mm of shear displacement, indicating the residual stage has reached. Under a low level of normal stiffness (kn < 3 MPa/mm), the shear behavior shows stress-softening behavior. When the normal stiffness progresses (kn > 3 MPa/mm), the shear stress shows stress-hardening behavior, during which the shear stress increases with an increase in shear displacement.
Figure 4b shows the normal displacement versus shear displacement curves. The normal displacement decreases to negative values at initial shearing; after the minimum normal displacement is reached, shear dilation occurs until the shear displacement reaches 10 mm. The dilation was decreased by increasing normal stiffness. This is because the increase of normal stress induced by normal stiffness restrains the increment of dilation. The bows of normal stress against shear displacement are shown in Figure 4c. For CNL conditions, the normal stress remains unchanged during shear, while the variations in normal stress are proportional to the case of normal shift at the CNS status.
According to the throwing distance and throwing height, the initial velocities of the broken blocks in different throwing distances were calculated by combining the equations of the flat throwing motion, see Table 3.
Although the shear stress shows a clear peak value for joints under a low normal stiffness, there are no distinct peak values for joints under a high normal stiffness. To better understand the shear strength of plaster joints under higher normal stiffness, the curves of the surface resistance index (SRI) are used to analyze the relative shearing resistance [38]. The SRI is defined as the ratio of shear stress to normal stress. The variations in SRI against shear displacement are plotted in Figure 5a. The normal stiffness has little influence on joint SRI. The five SRI curves have little difference and almost coincide in the Ⅲ stage, while there is a separation between the shear stress peak and the Ⅱ stage, but the maximum difference is only 0.2. This is due to the reality that the shear stress addition of the joint is comparable to the normal stress increment in the shear process under CNS border conditions [38]. Figure 5b displays the peak shear stress and final shear stress of joints under various normal stiffness statuses. With the rise of normal stiffness, the peak shear stress of the joint declines slightly. This is because the normal displacement of the joint is negative in the initial shear stage, which leads to a decrease in the normal stress on the joint. The final shear stress rises linearly with the rise of normal stiffness.
After shearing, the failure modes of joints under various normal stiffness are shown in Figure 6. The white part in the figure is the rough body that was nibbled or destroyed by friction in the shearing process. In this paper, image recognition technology is used to extract the damaged part and mark it with a red line. It can also be found that in addition to the rough body failure, many local cracks will occur on the joint surface, which are marked by blue lines in the figure. The failure locations on the joint surface are generally the same, and they are all in the position with a large convex degree. However, with the rise of normal stiffness, the failure area and the number of cracks of the rough body on the joint surface increase. In order to quantitatively analyze the influence of stiffness on the joint surface failure area, the red line in the figure was imported into CAD to calculate the joint surface failure area. When the normal stiffness is 0,1,3,5 and 7 MPa/mm, the failure areas of the joint surface are 58.4, 62.35, 69.22, 72.18, and 78.26 cm2, respectively, as displayed in Figure 7. With the increase of normal stiffness, the failure area of the joint surface increases linearly. This is mainly because the greater the normal stiffness, the greater the normal stress on the joint, the greater the friction force on the joint surface, and the more easily the rough body on the joint surface is destroyed.
After the test, the gnawed rough body and friction-based fine powder on the joint surface were collected and weighed to obtain the joint failure rough weight under diverse normal stiffness statuses, as displayed in Figure 7. When the normal stiffness is 0,1,3,5 and 7 MPa/mm, the weight of the joint failure rough body is 9.88, 11.24, 17.74, 20.02, and 24.35 g, respectively. With the increase of normal stiffness, the weight of joint failure roughness increases linearly.

3.2. Effect of Shear Rate

The stress and displacement curves of joint shear under diverse shear rates are displayed in Figure 8. With the rise of the shear rate, the shear stress bend of joints gradually moves downward, indicating that the larger the shear rate is, the shear strength of joints gradually decreases. This is mainly due to the joint surface roughness deformation failure and the different contact forces caused by it. When the shear rate is small, there are more time transfer forces in the shear process of the joint, which can fully mobilize the shear performance of the joint. However, when the shear rate is large, the shear process time is short, and the force is mainly concentrated on the part of the rough body that fails to transfer in time. The shear stress curve under different rates has the same trend of change, which is also divided into three stages, that is, within a small shear displacement (0.372–0.74 mm), the shear stress rapidly rises to the peak, after the peak, the shear stress decreases slightly, and then rises steadily. However, the corresponding shear displacement range of each stage of the shear stress curve is different with different shear rates. With the rise of the shear rate, the range of stage Ⅰ is smaller; that is, the corresponding peak shear displacement is smaller. This is mainly caused by the decrease of joint peak strength and shear stiffness with the rise of shear rate [39]. In the Ⅱ stage, the smaller the shear rate is the slower the shear stress curve of the joint drops, which indicates that the smaller the shear rate is in this stage, the less the surface roughness failure of the same shear displacement. Then, under the action of constant normal stiffness, the shear stress gradually rises, and when the shear displacement is greater than 7 mm, the slope of the five shear stress curves under different shear rates is similar, but when the shear displacement is greater than 7 mm, the shear stress curves with shear rates of 5.0, 10.0 and 20.0 mm/min gradually flatten out. The shear stress of joints basically no longer rises, while the shear stress curves continue to rise when the shear rate is 0.5 and 2.5 mm/min, which again confirms the view that the greater the shear rate, the more serious the roughness failure of the surface.
Figure 8b shows the curves of normal joint displacements and shear displacements under different shear rates. The shear rate is roughly inversely proportional to the joint dilatancy value; that is, the joint dilatancy gradually decreases with the increase of shear rate, but the influence is limited, and the maximum difference is less than 0.1 mm. Figure 8c displays the normal stress-shear displacement curves of joints at different shear rates. It can be seen from the figure that the influence law of shear rate on the normal stress of joints is consistent with that of joint dilatancy. This is because, under the status of CNS, the normal stress of the joint is mainly caused by the joint dilatancy control, as shown in reference [22].
The peak shear stress and final shear stress of joints under different shear rates were counted in Figure 9. The peak shear stress, final shear stress, and shear rate of the joint are obviously power functions (the exponent is negative). When the shear rate is between 0.5 mm/min and 5 mm/min, the peak shear stress and final shear stress falling rate of the joint are much higher than those when the shear rate is between 5 mm/min. This result is consistent with that of Atapour et al. [31], Tang et al. [32], and Wang et al. [33]. This indicates that when the shear rate reaches a certain value, its effect on the shear strength of the joint is no longer significant.
Figure 10 shows the surface failure diagram after joint shear at diverse shear rates. When the shear rate is 0.5–5 mm/min, the joint failure area has little difference, but when the shear rate is 5–20 mm/min, the joint failure area increases obviously. This is caused by the different shear rates and the different contact times of the rough body of the above and below joints, which leads to the different deformation degrees of the rough body. When the shear rate of the joint is low, the rough body on the steep joint surface has enough time to deform during the shear process, and the joint can climb and slide along these rough bodies, and the failure mostly occurs at the convex tip. However, when the shear rate is high, the deformation time of the joint rough body is short, and the force cannot be transferred, which is easy to cause the shear force to concentrate only on the part of the rough body, resulting in the gnawing of these rough bodies from the root. Moreover, since the rock-like specimens made of gypsum are brittle [40] when the rough body is gnawed, it even drives the nearby rough bodies to fall off together. As a result, when the shear rate is high, the rough body is broken on a large scale.
Figure 11 shows the joint failure area and the weight of the damaged, rough quilt under different shear rates. When the shear rate is 0.5–5 mm/min, the joint failure area has little difference, which are 69.22, 71.06, and 69.35 cm2, respectively. Similarly, there was no significant difference in the roughness weight of joint failure, which was 17.74, 18.11, and 18.39 g, respectively. When the shear rate increases to 5–20 mm/min, the joint failure area and the joint failure rough weight increase significantly, and the joint failure area is 75.89 and 82.11 cm2, respectively. The joint failure rough weights were 20.06 and 25.24 g, respectively. This also indicates that the joint roughness has less failure when the shear rate is small (0.5–5 mm/min) but larger failure when the shear rate is enormous (5–20 mm/min). With the rise of the shear rate, the failure area of the joint surface and the weight of the failure roughness increase nonlinearly.

4. AE Characteristics

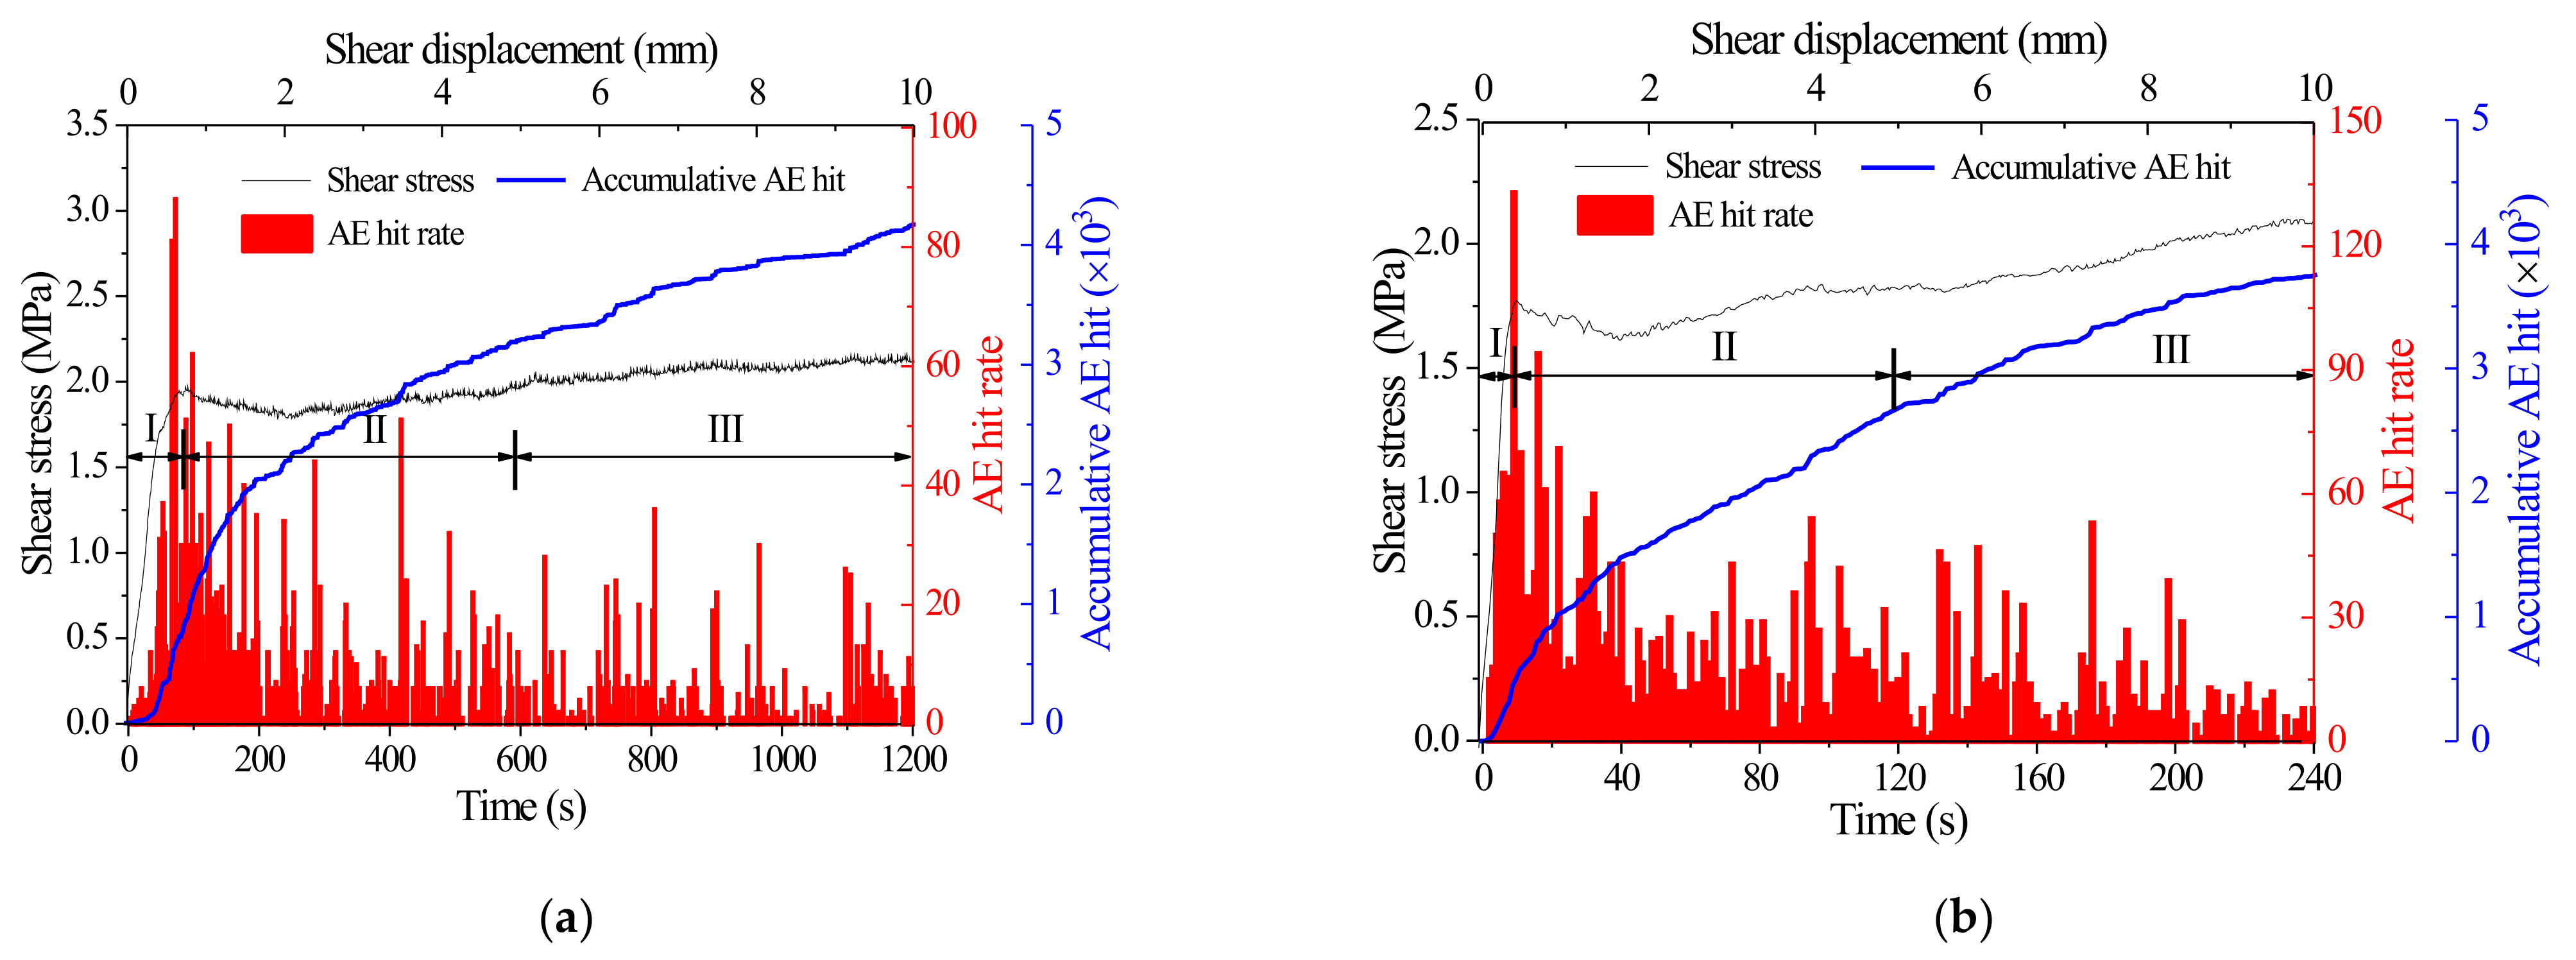
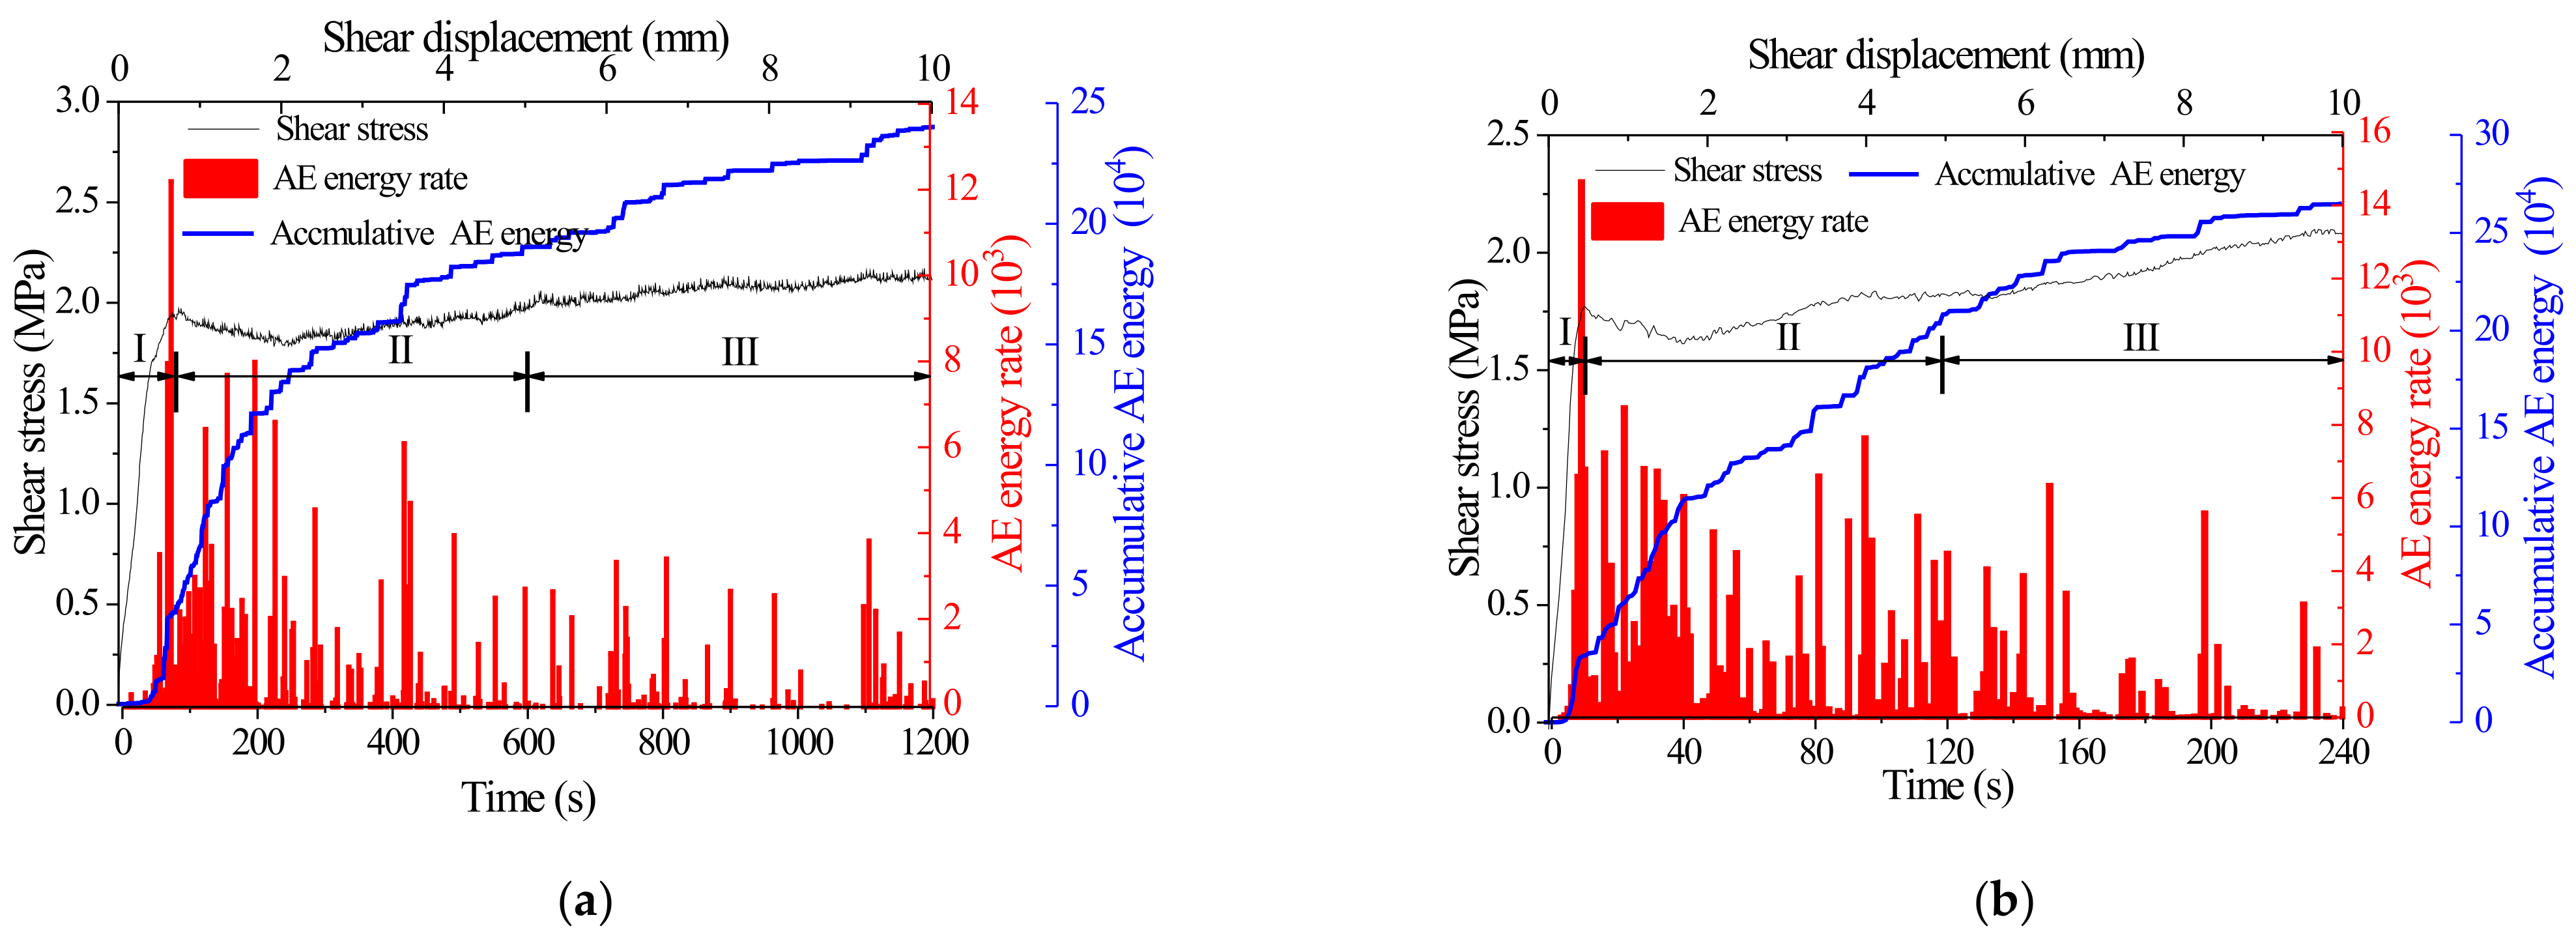
4.1. Effect of Normal Stiffness on AE Characteristics of the Sheared Joints

During joint shearing, the source of AE signals mainly comes from asperity degradation, including the breaking, rolling, squashing, and moving of asperities on the joint surface. Figure 12 and Figure 13 show the evolution of AE signals and the accumulative AE signals for joints undergoing shear under various normal stiffness, respectively. The AE energy is defined as the area enclosed by the signal envelope (unit of voltage is mv) and axial of abscissas (unit of time is us), which represents the relative intensity of AE signals. In the pre-peak stage (Stage I), the AE signals are relatively quiet at the initial shear stage (approximately 0.7 times the peak shear displacement) due to the elastic deformation of asperities. In this phase, the accumulative AE energy is almost negligible. With the further increase of shear displacement, the AE impact signal increases rapidly and peak at the maximum shear stress. This is because when the shear stress reaches the peak, the surface roughness of the structural plane is chewed off in a large number of moments. Then, as the shear continued, the acoustic emission impact signal began to decline in the Ⅱ stage. However, the acoustic emission impact signal remained at a high level because there were still rough bodies on the surface of the structural plane at this stage. Finally, in the Ⅲ stage, there is almost no nibbling failure on the surface of the structural plane, and the AE impact signal is generated by the friction of the structural surface, so the AE impact signal is maintained at a low level. It must be noted that in the post-peak stage, there are still relatively high values of AE impact signals, which may be caused by the secondary crushing of some nibbled bulges. These results are consistent with those of Meng [12] and Wang et al. [33].
The joint acoustic emission energy signal and acoustic emission impact signal have the same development trend, which will not be repeated here. By comparing the AE energy signals at the post-peak stage under different normal stiffness conditions, it can be found that when the normal stiffness is higher, the more AE energy signals the joint is, the denser it will be. This also confirms the phenomenon that the larger the normal stiffness is, the larger the failure range of the joint surface and the greater the weight of the damaged, rough body.
In order to further analyze the AE response characteristics in the process of structural plane shear, the AE impact number, and energy at the peak of shear stress, as well as the AE impact number and energy in each stage of the process of structural plane shear, were counted. Meanwhile, the cumulative AE impact number and energy in the whole process of shear were also counted. The percentage of AE signals generated in each stage of the shearing process was obtained, as shown in Table 3. The acoustic impact signal generated in the Ⅰ stage is less than 12.8% of the total signal, which further indicates that most of the rough structure of the structural plane has elastic deformation, and only a few damages occur in this stage. The AE impact signals at the peak of shear stress are not different, and there is no obvious rule. In the Ⅱ stage, more than 61.5% of AE signals were detected, indicating that a large number of structural plane failures occurred in this stage. With the rise of normal stiffness, the AE signal ratio of the Ⅱ stage increases. It is confirmed that more structural plane failure occurs under high normal stiffness conditions. In the Ⅲ stage, the AE signal is lower than 27.8%, which is significantly lower than that in the Ⅱ stage, because the main source of the AE signal is the friction of the structural plane, and there is no large number of gnawing failure of the rough body. Similarly, as the normal stiffness increases, the AE signal ratio also increases.

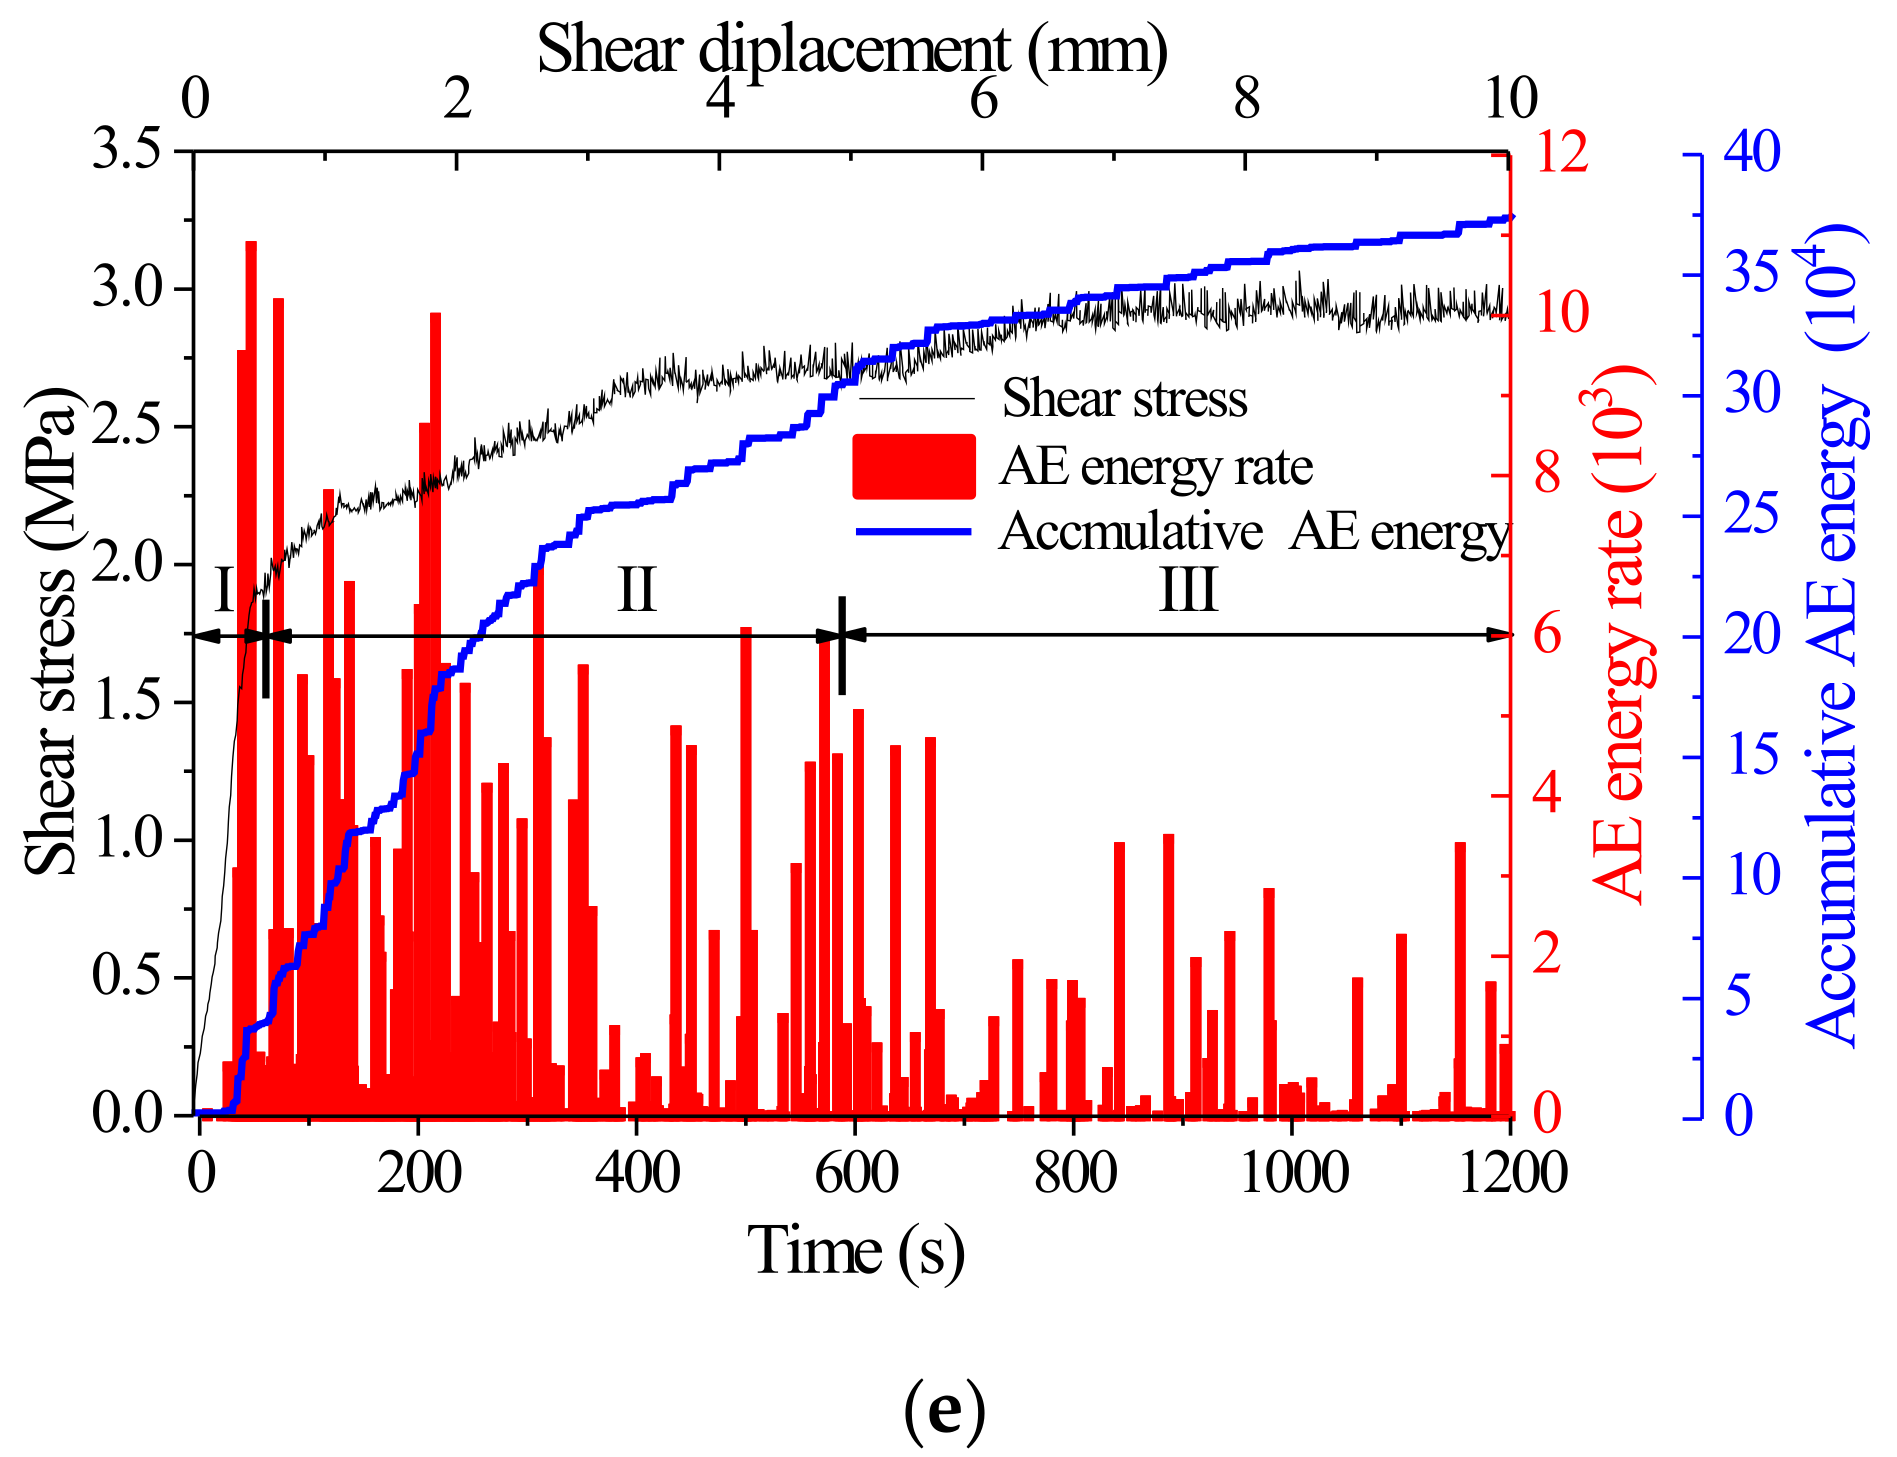
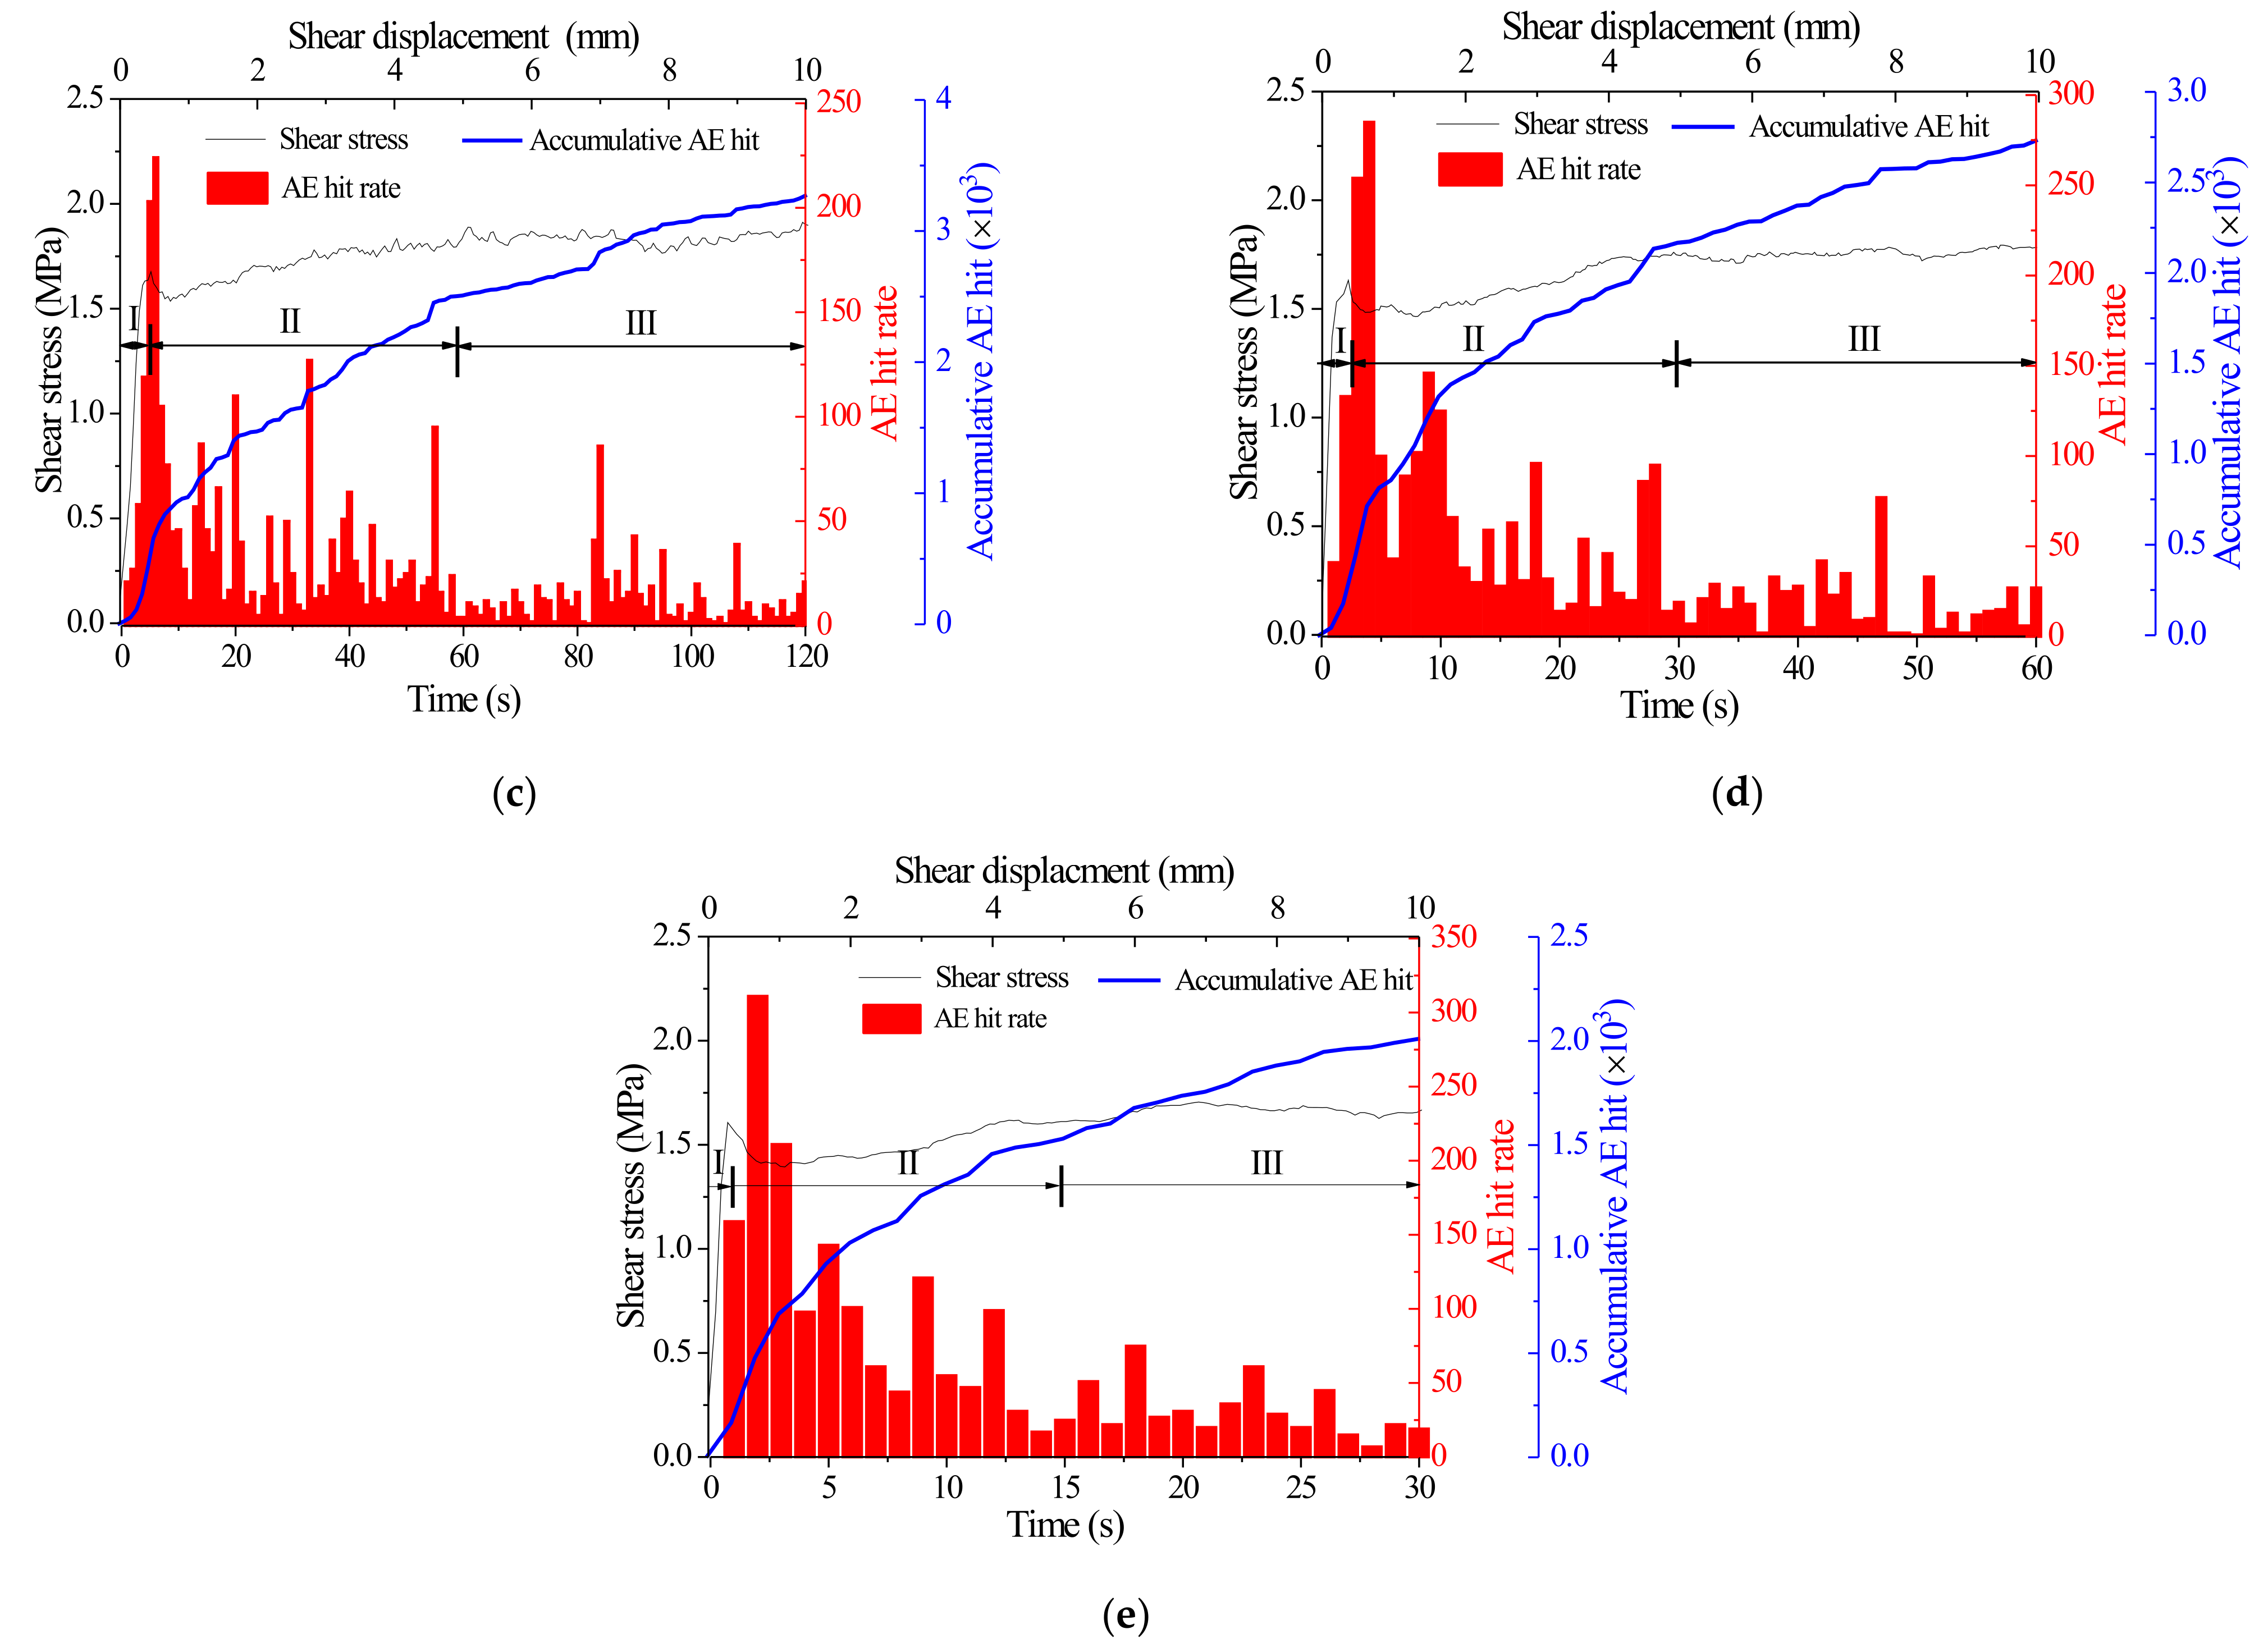
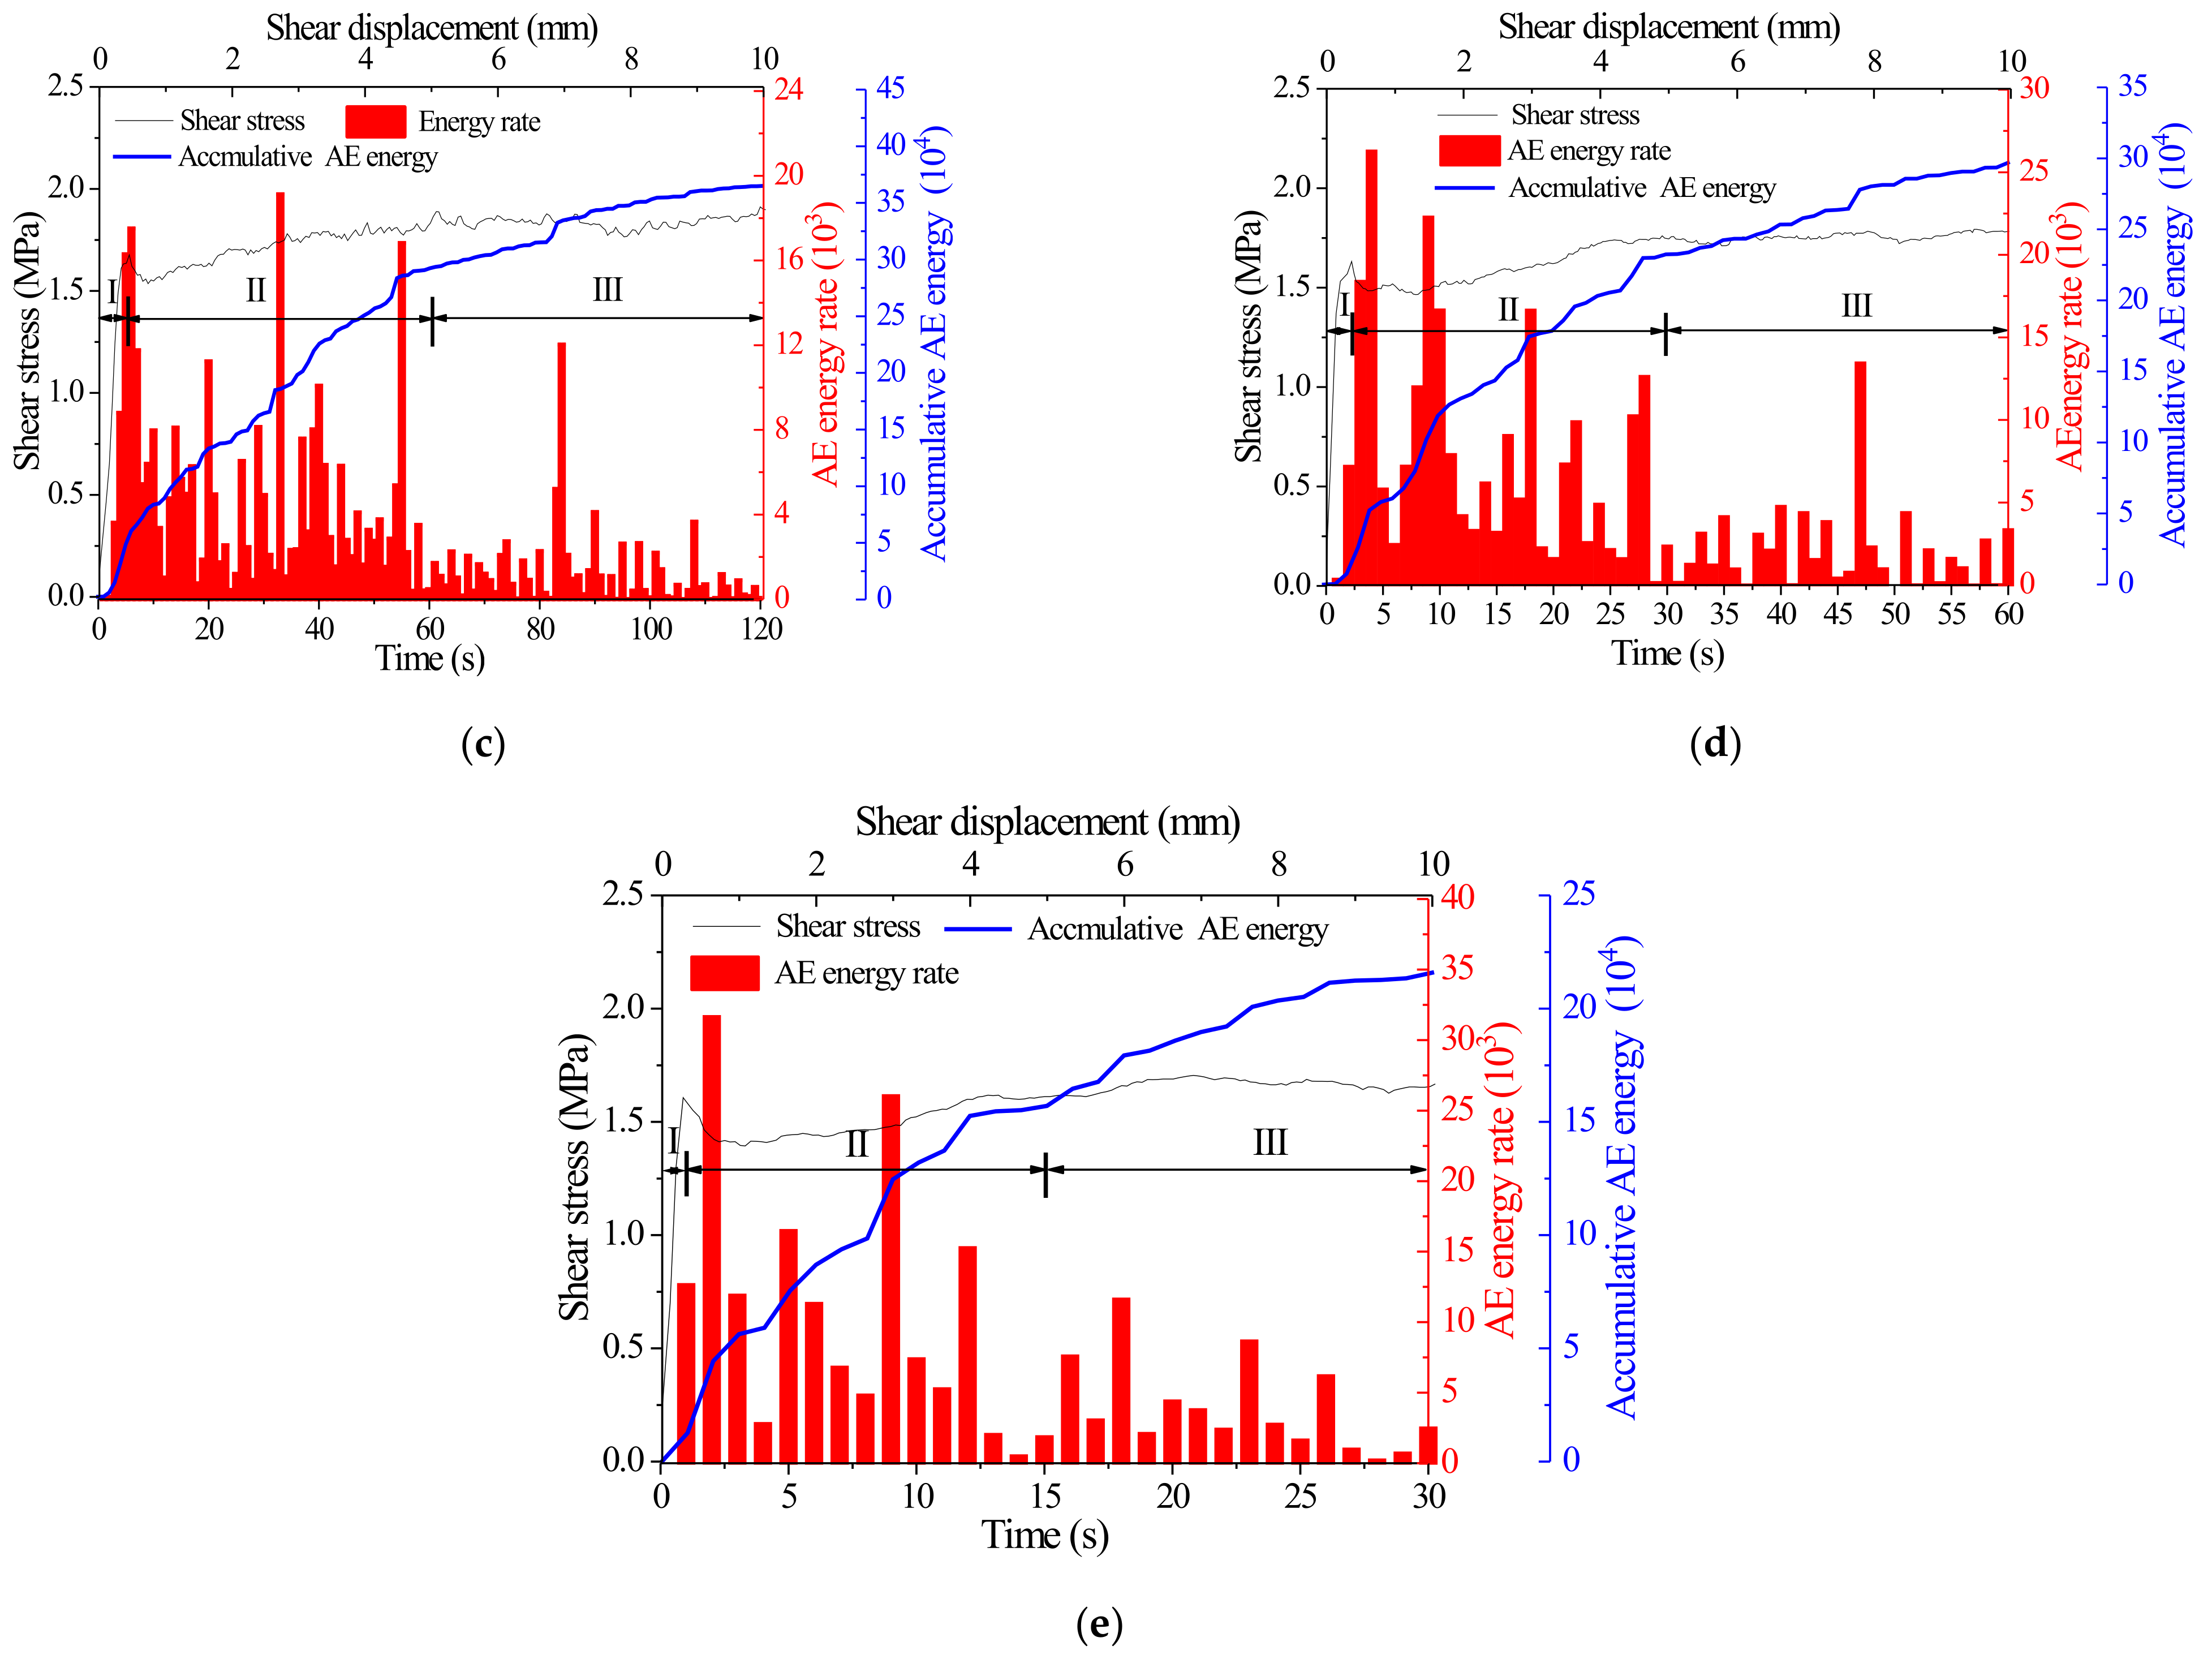
4.2. Effect of Shear Rate on AE Characteristics of Joints

Figure 14 and Figure 15 show the acoustic emission signals during the shear process of the structural plane under the condition of normal stiffness of 3 MPa/mm and a shear rate of 0.5–20 mm/min. Under different shear rate conditions, AE signals have the same variation trend, but the data volume of AE signals is different; that is, the AE signal histogram with a small shear rate is finer and denser, while the AE signal histogram with a large shear rate is thicker and thinner. This is because the shear rate is different and the shear time is different, resulting in different amounts of AE data monitored. When the shear rate is high (10–20 mm/min), the loudest emission energy appears after the shear stress peak, and the AE energy exceeds 103 more times, which is mainly because the rough structure of the structural plane is broken in large pieces and more local cracks occur at the high shear rate. The AE hit rate and energy rate trends rise with a rise in shear rate, which indicates a larger energy release of the joint when the shear rate is large. This conclusion shows agreement with the observation of Meng et al. [12].
The values of the peak AE hit/energy rate, the total number of AE hits/energy, and the number of hits/energy at three stages of joints under different shear rates are shown in Table 3. It is worth noting that less than 12.2% of the total AE signals are detected in stage Ⅰ. The peak AE hit rate and energy rate tend to rise with a rise in shear rate, which indicates that more damage occurs for joint sheared under a higher shear rate at the moments of peak shear stress. Similar to the results of joints sheared under different normal stiffness conditions, more than 60% of the total number of AE signals was measured at stage II, and less than 30% of the total number of AE signals was generated at stage III. Overall, with the enhancement of the shear rate, the additive AE impact number declines. The additive AE energy rises with the rise of the shear rate at 0.5–5 mm/min but decreases with the rise of the shear rate at 10–20 mm/min. This is primarily since when the shear rate is higher than a specific worth, the surface roughness of the structure is nibbled instantaneously, and the shear duration is short.

5. Conclusions

In this paper, we conducted a series of direct shear tests on artificial plaster joints, and the influences of normal stiffness and shear rate on peak and residual shear stress and AE characteristics were analyzed and discussed. From the test results, the main conclusions can be drawn.
(1)
With the increase of normal stiffness, the peak shear stress of the joint decreases slightly, but the final shear stress increases linearly. With the increase of normal stiffness, the joint dilatancy decreases significantly, and normal stress increases significantly. The normal stiffness has little influence on the joint surface resistance index.
(2)
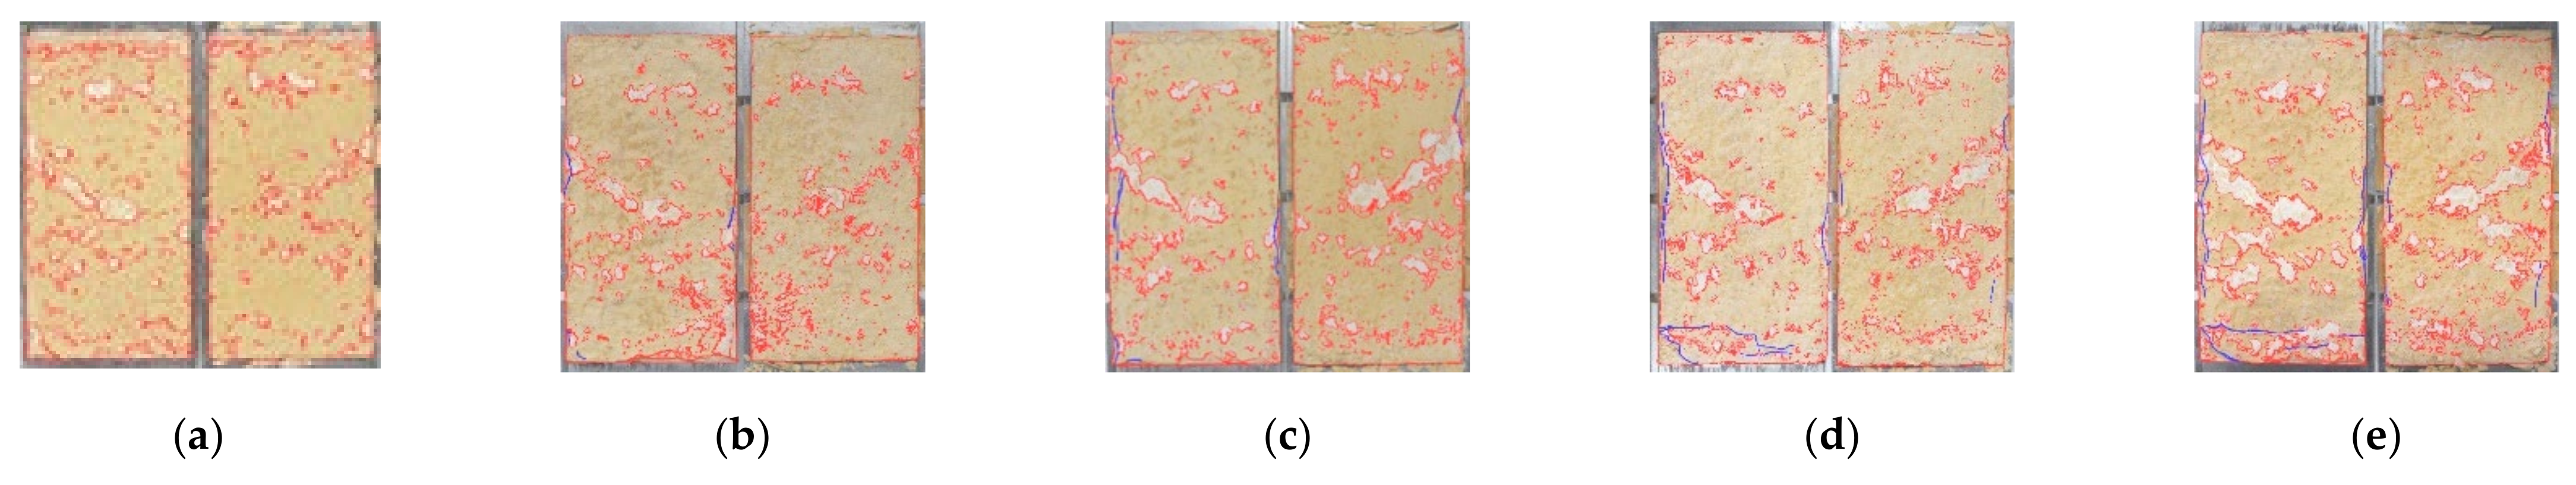
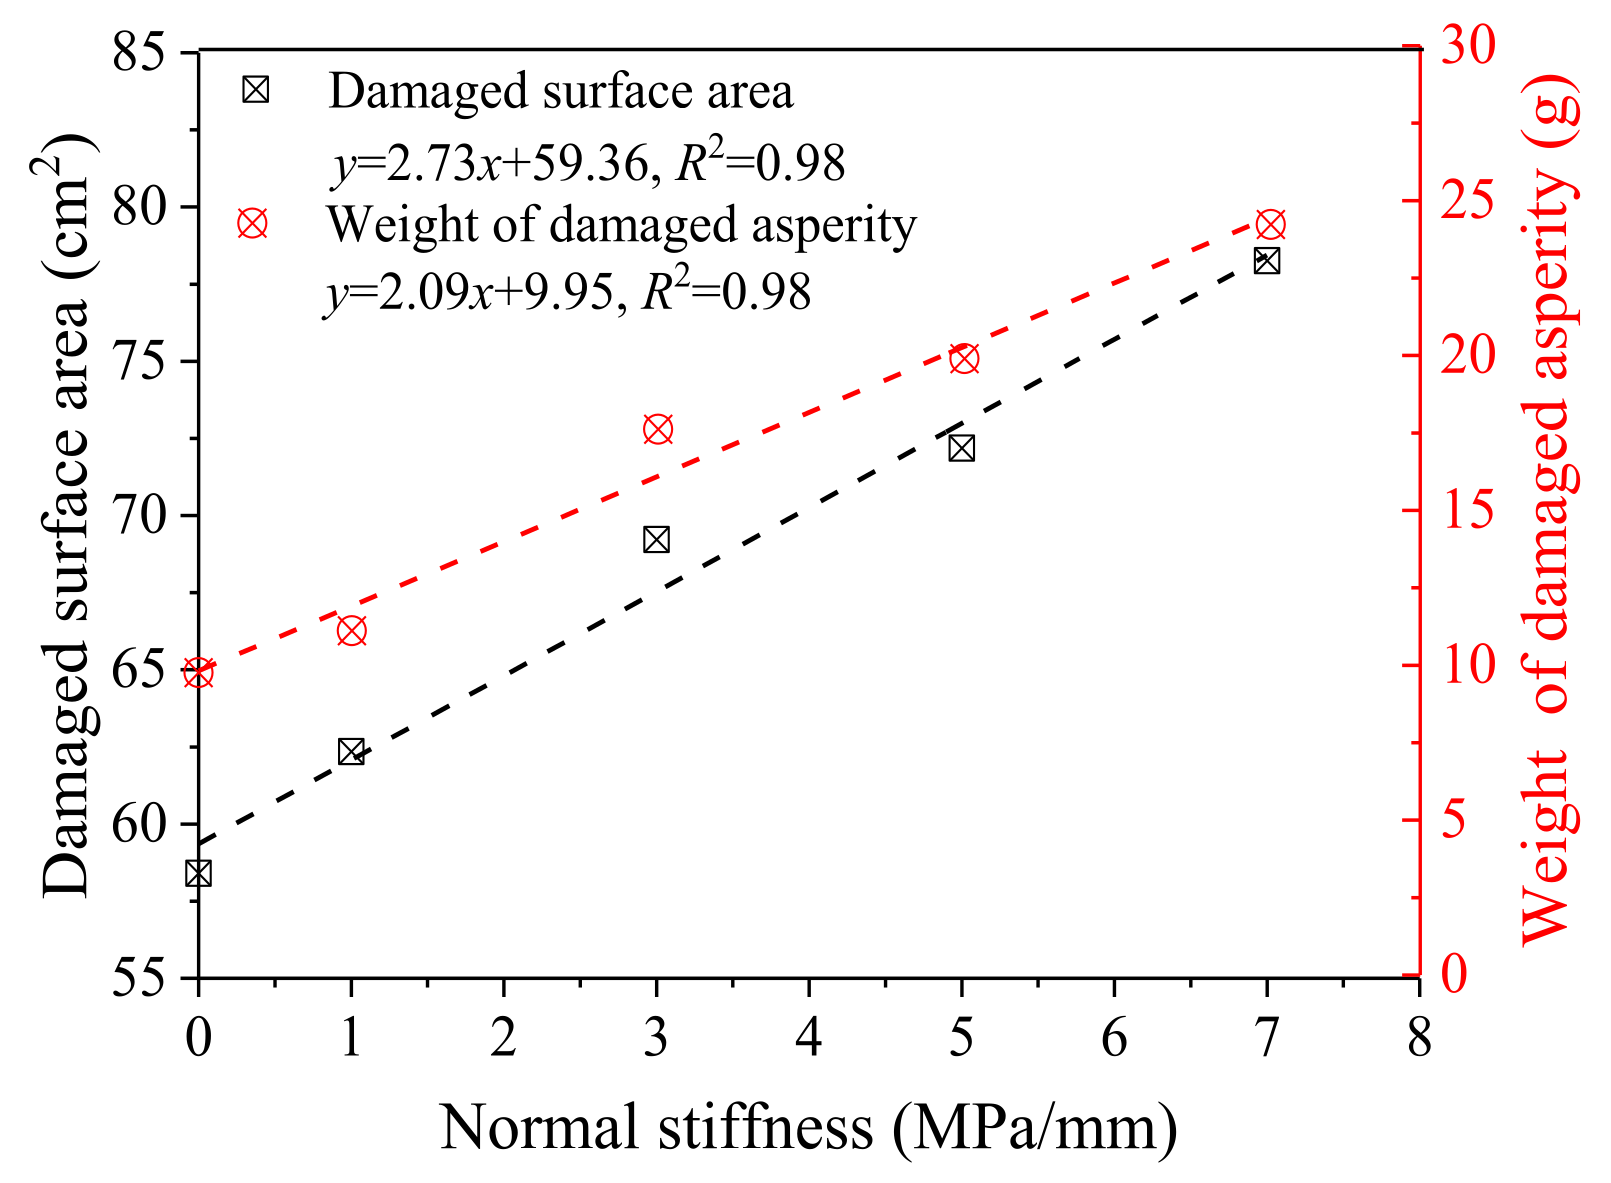
With the increase of normal stiffness, both the failure area and the failure roughness weight of the joint surface show a linear increase trend, which indicates that under the condition of high normal stress, more failure occurs to the roughness of the joint surface, which is the main reason for the significant increase of final shear stress.
(3)
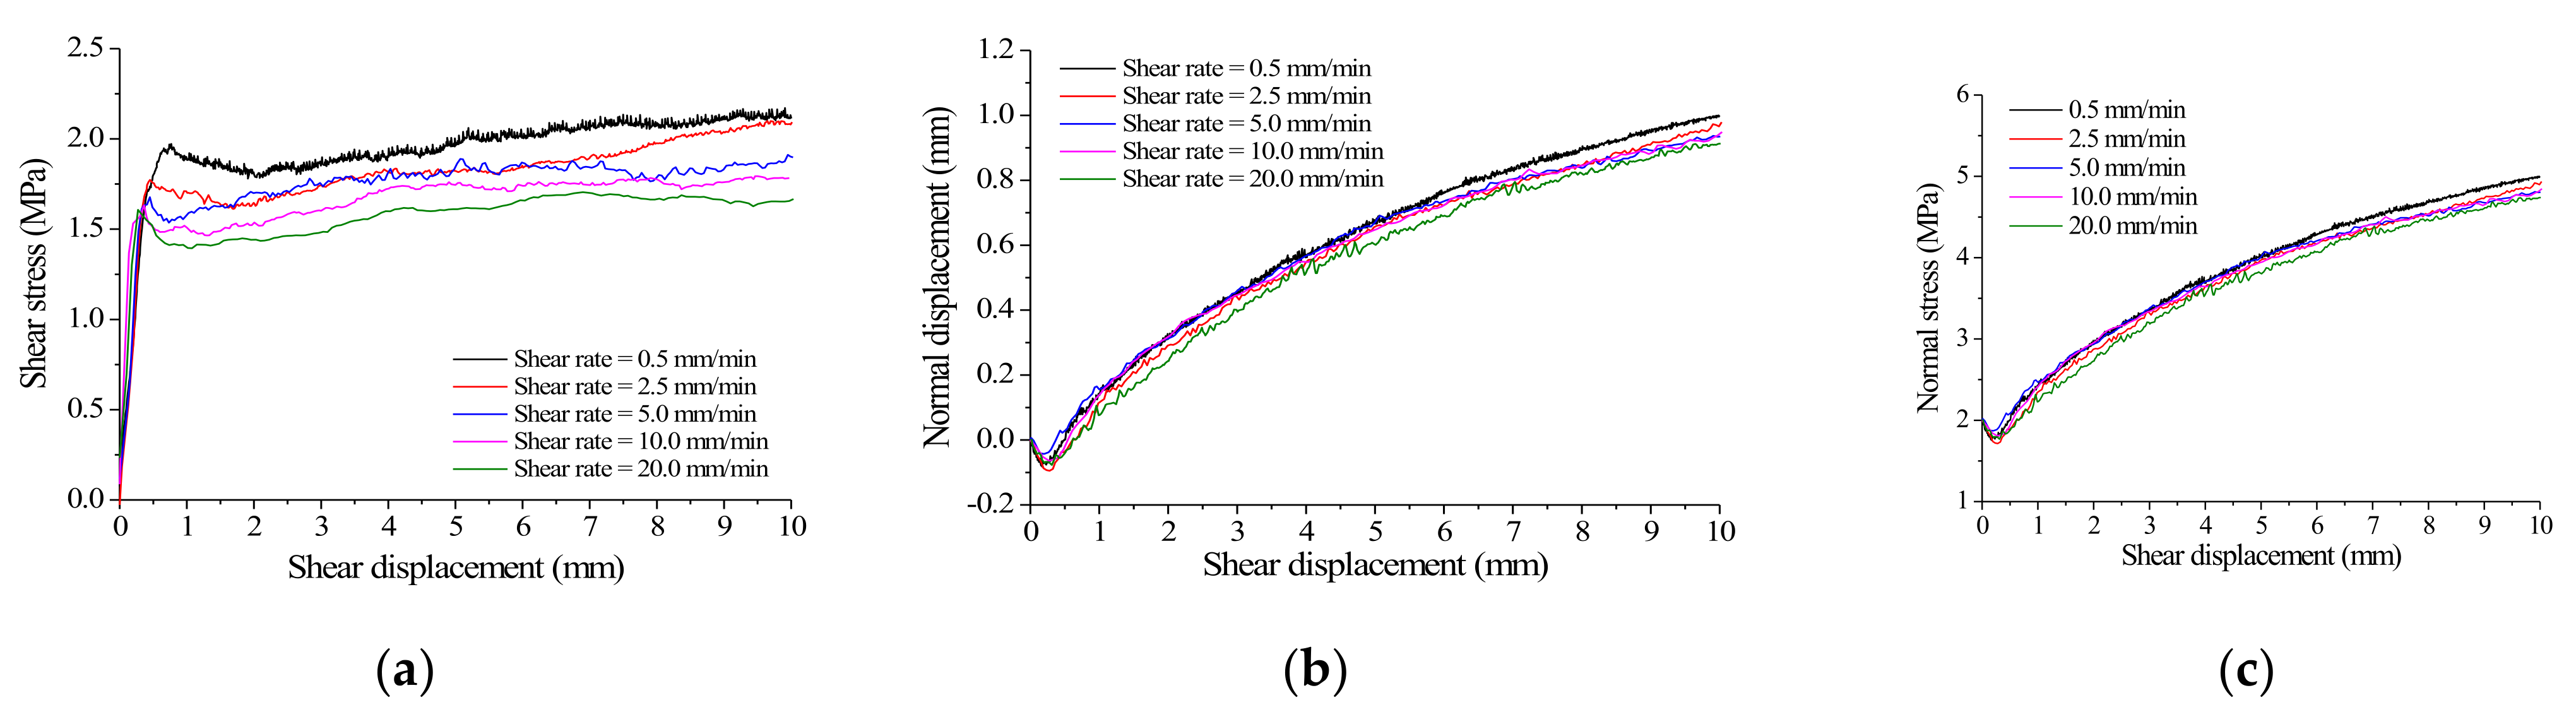
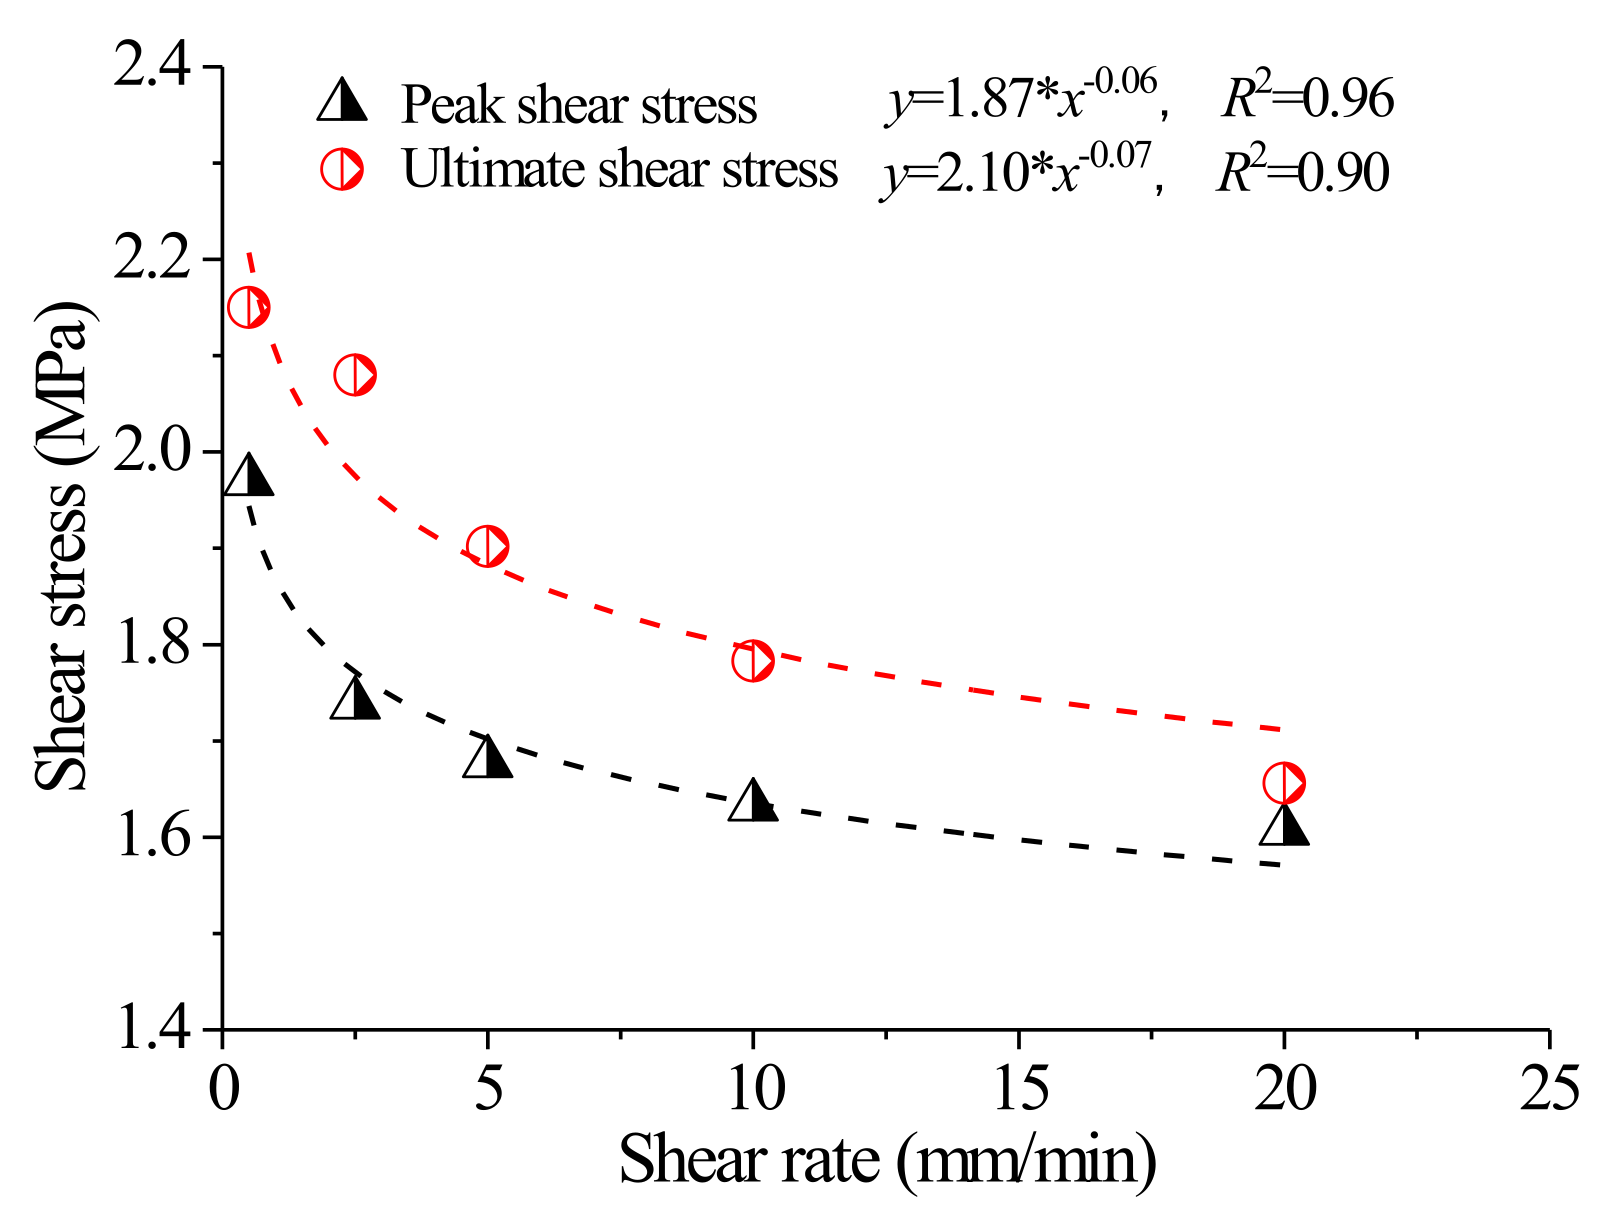
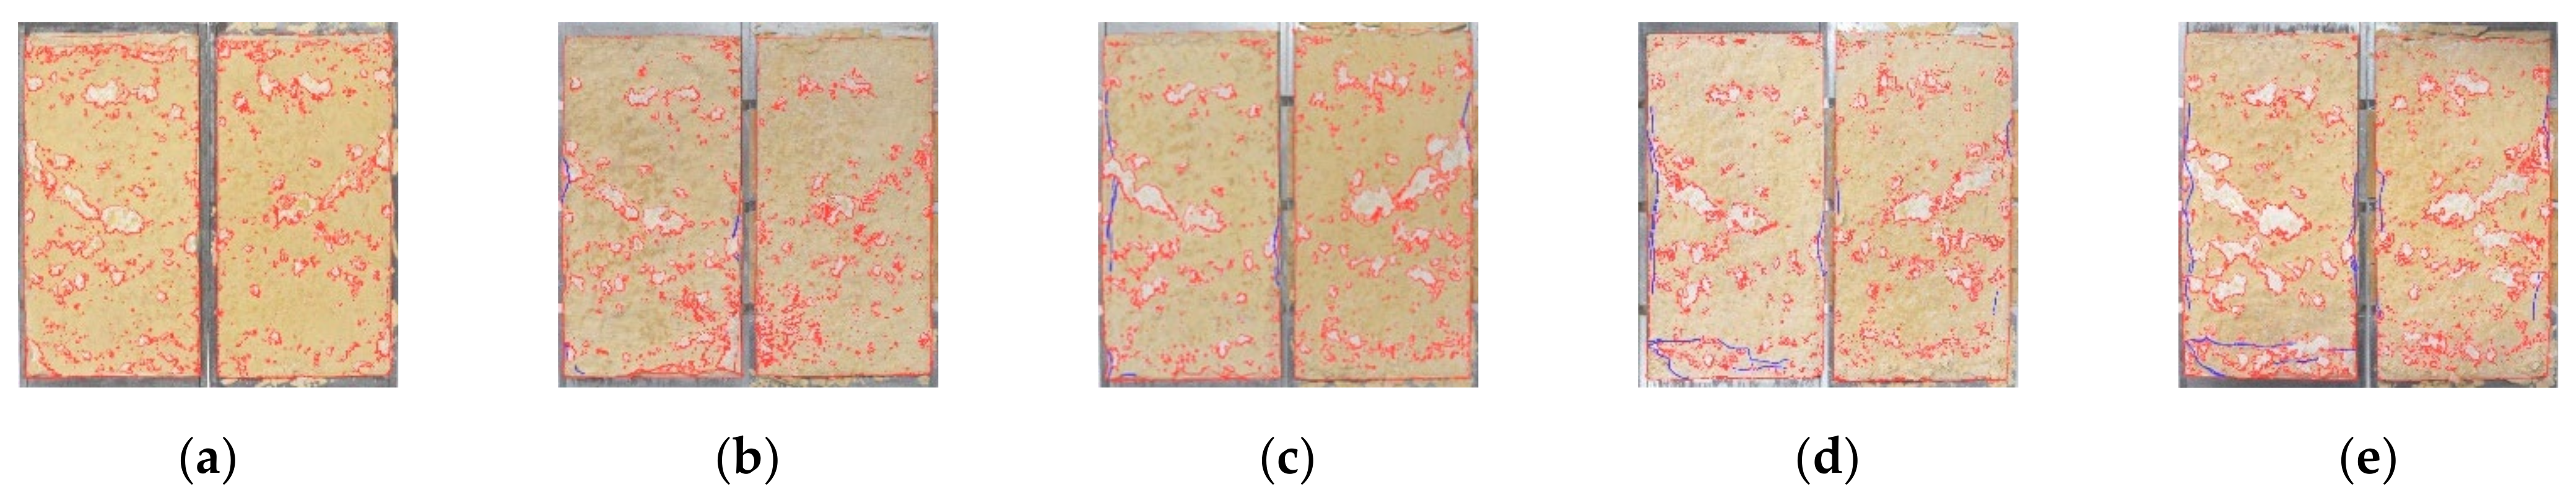
With the increase in shear rate, both the peak shear stress and the final shear stress decrease, and both have a nonlinear relationship with shear rate. When the shear rate is 0.5–5 mm/min, the decline rate of the curve is much higher than that of the curve when the shear rate is 5–20 mm/min. The shear rate has little effect on joint dilatancy, and with the increase of shear rate, the joint dilatancy decreases slightly.
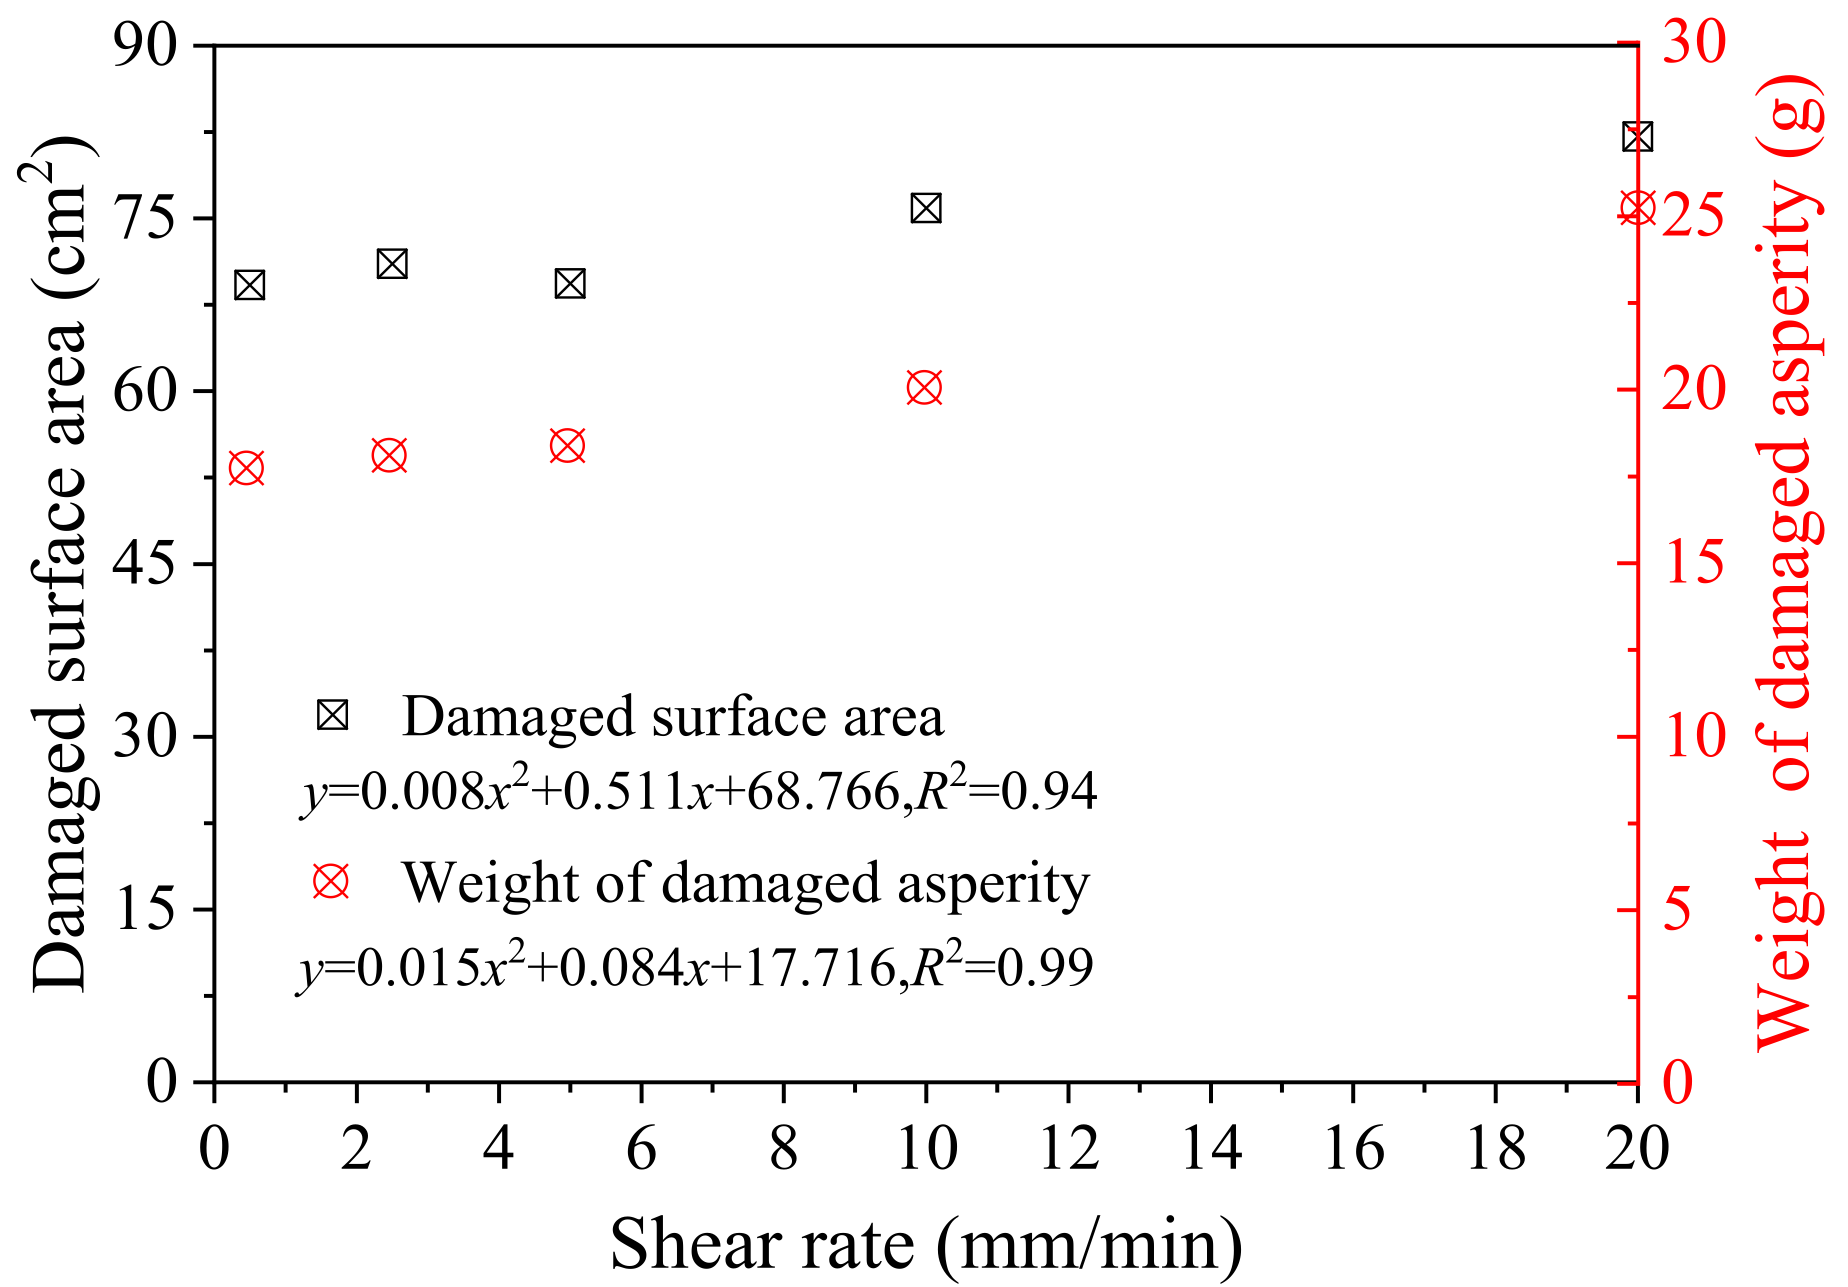
(4)
When the shear rate is between 0.5 mm/min and 5 mm/min, the joint failure area and the weight of the damaged, rough body have little difference, but when the shear rate is between 5 mm/min and 20 mm/min, the joint failure area and the weight of the damaged, rough body increase obviously.
(5)
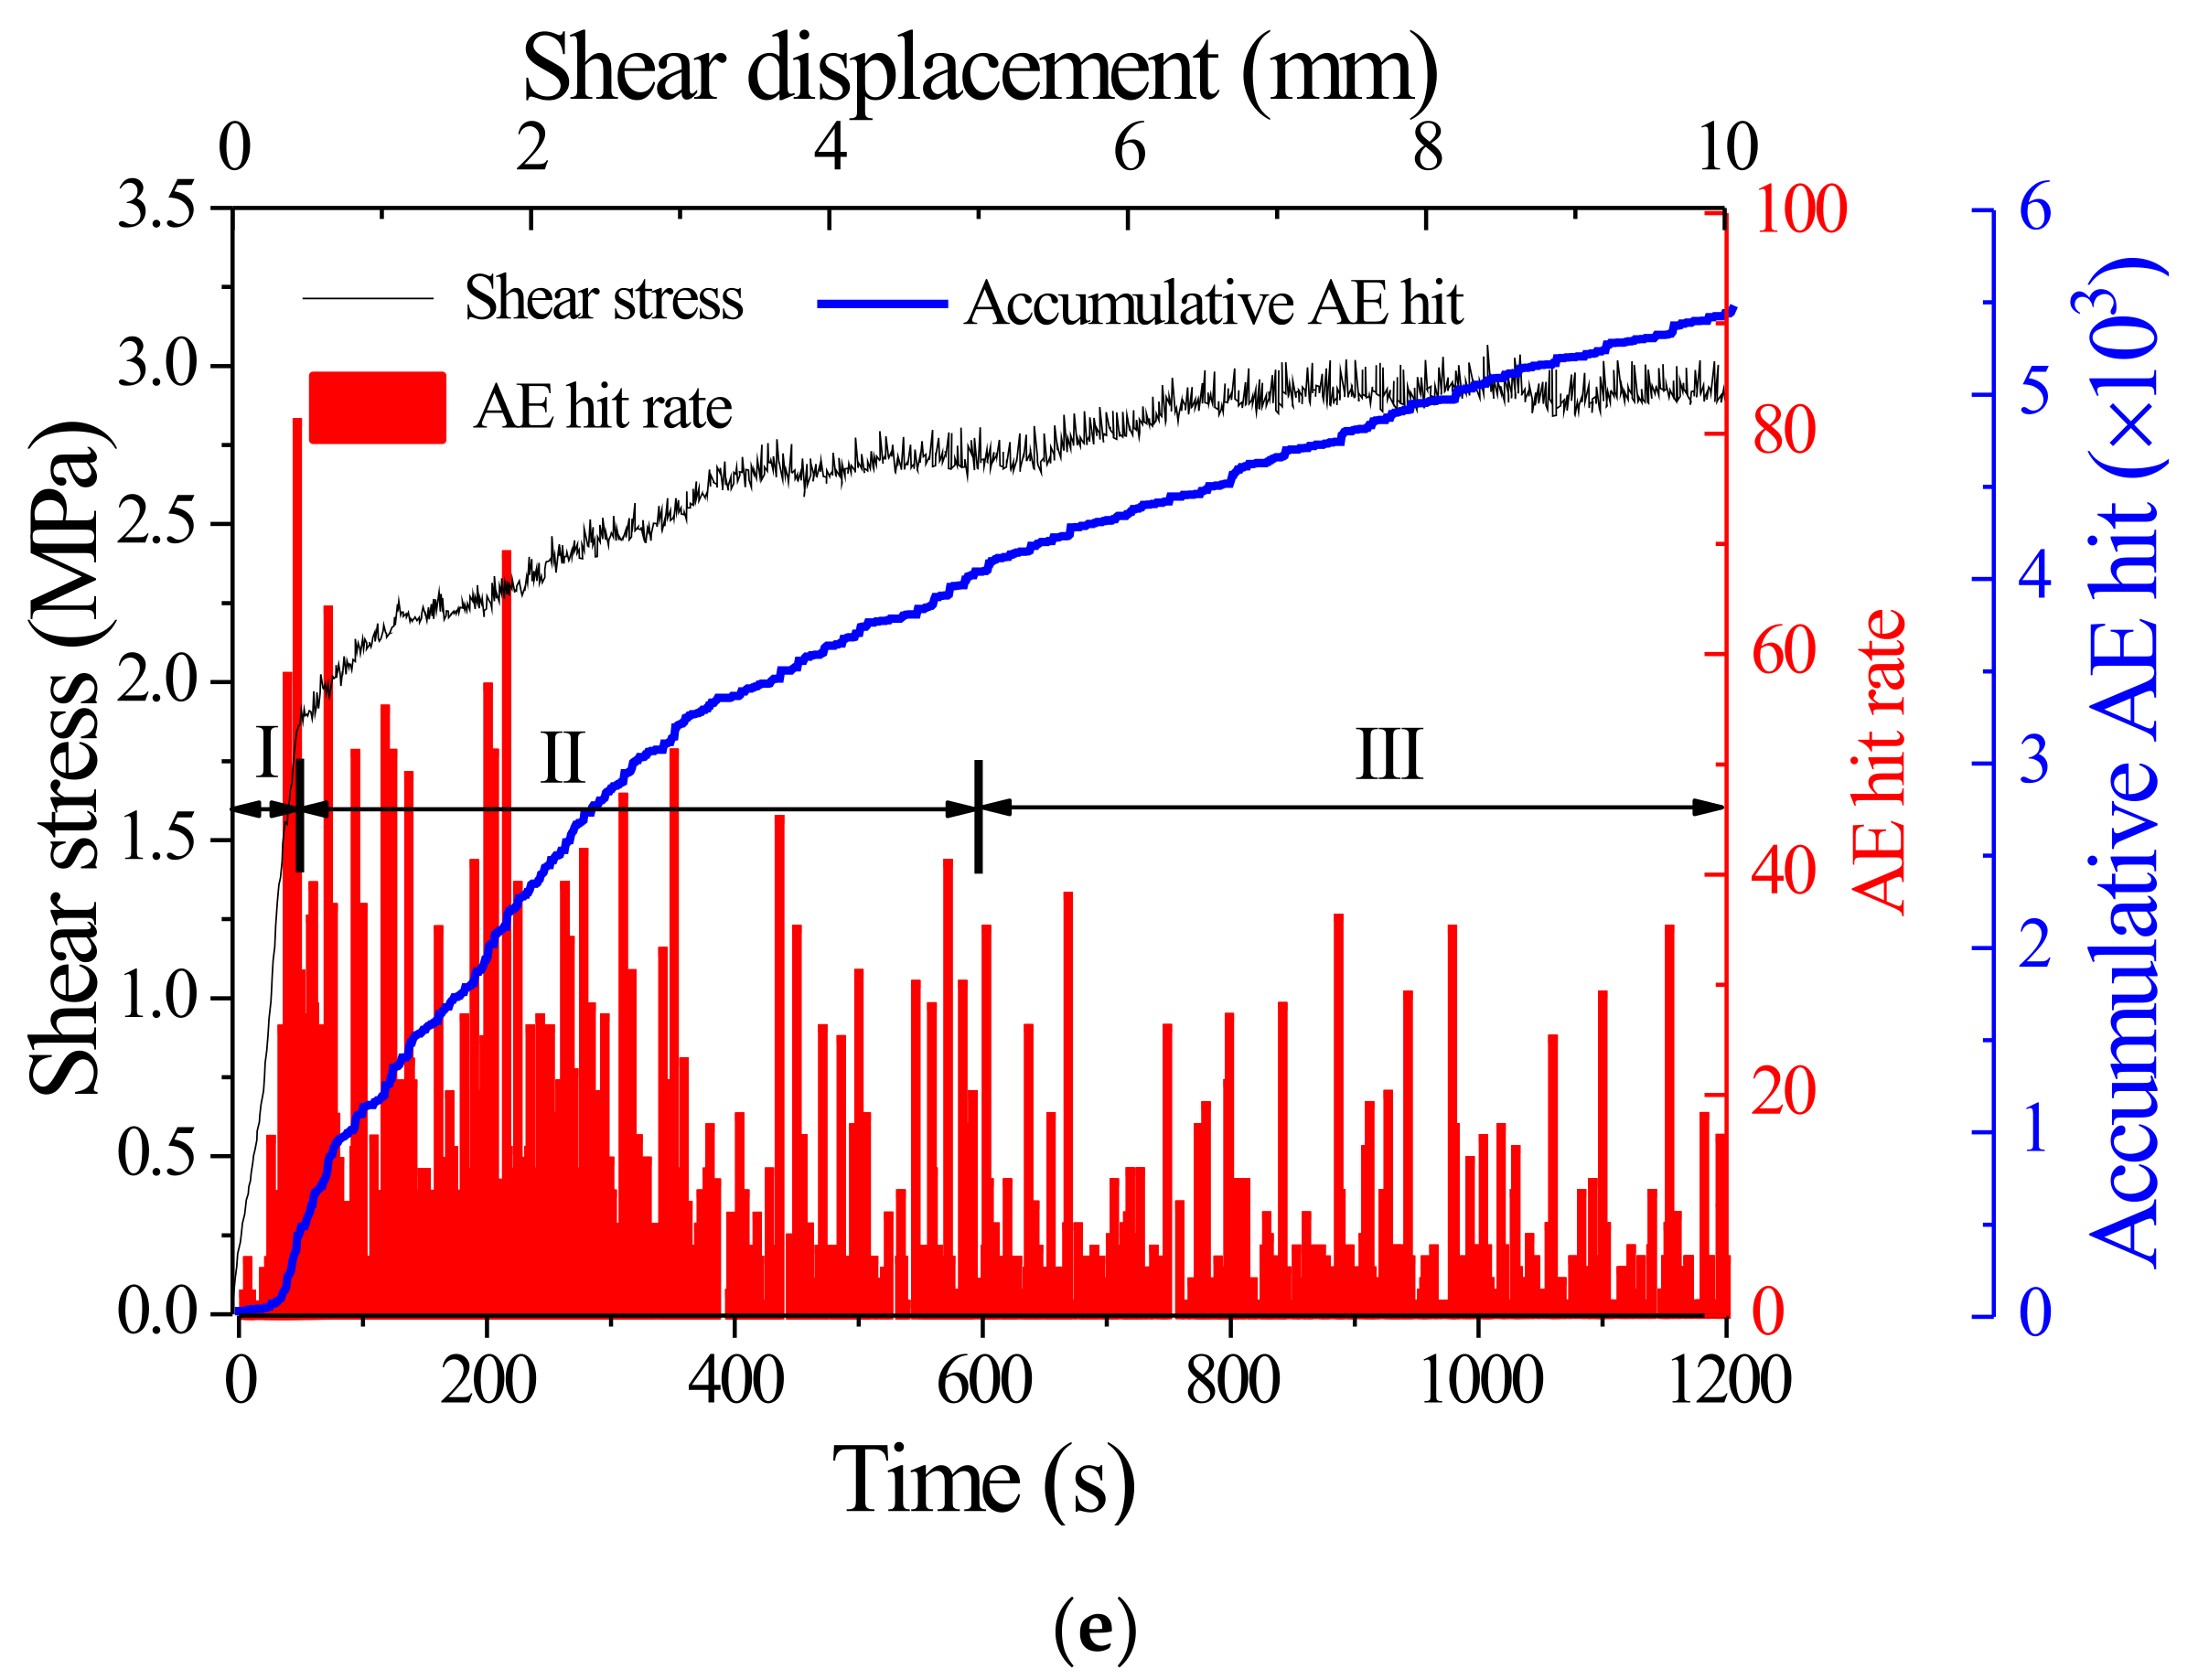
In the shearing process, AE signals are mainly generated in the post-peak stage. Generally speaking, the cumulative number of AE impacts and cumulative energy rise with the increase of normal stiffness, which demonstrates that the greater the normal stiffness is, the more serious the failure of the rough surface of the joint.
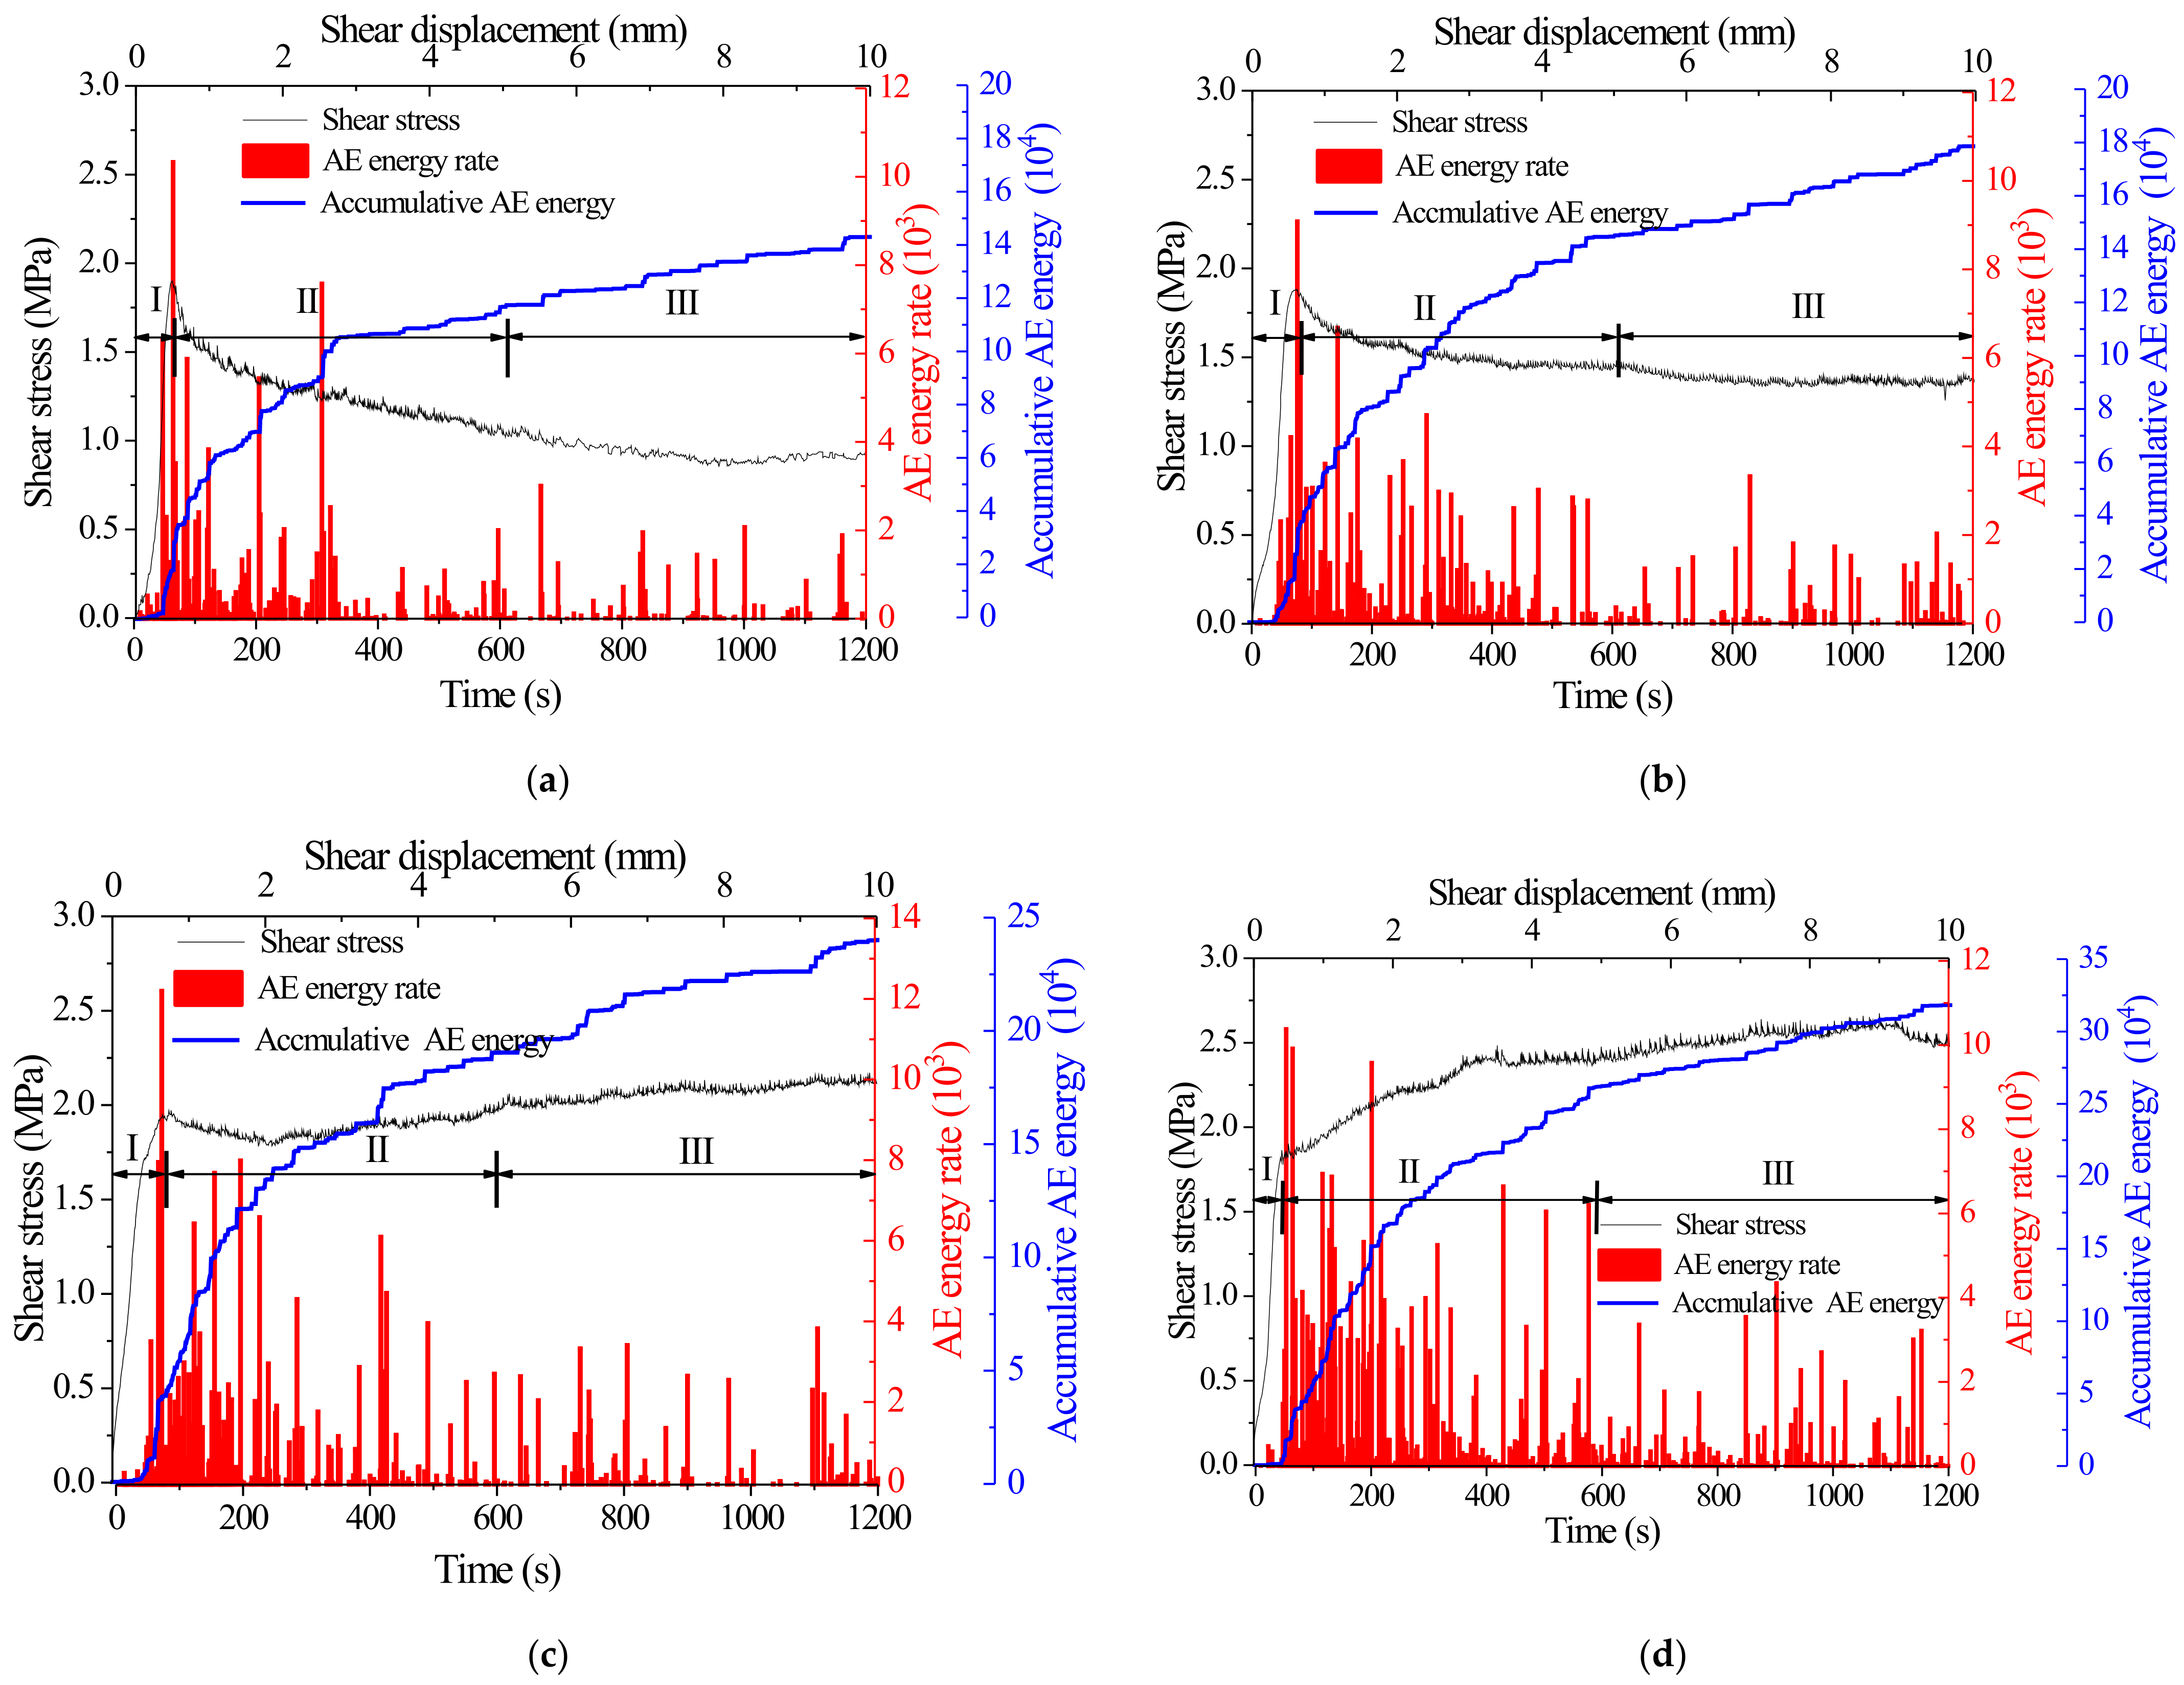
(6)
When the shear rate is low (0.5~5 mm/min), the accumulated AE energy increases from 239,235 to 362,421 with the increase of shear rate; when the shear rate is high (5~20 mm/min), the accumulated AE energy decreases from 362,421 to 241,423 with the increase of shear rate.

Author Contributions

Conceptualization, formal analysis, methodology, writing and editing, Y.J. and X.L.; data curation, writing and editing, C.W. and H.L.; software, S.Z.; review and editing, G.W. and P.W. All authors have read and agreed to the published version of the manuscript.

Funding

This study was funded by the National Natural Science Foundation of China (No. 52104093, 52209141) and Shandong Provincial Natural Science Foundation China (No. ZR2021QE069, ZR2020QE120).

Institutional Review Board Statement

Not applicable.

Informed Consent Statement

Not applicable.

Data Availability Statement

Data associated with this research are available and can be obtained by contacting the corresponding author upon reasonable request.

Conflicts of Interest

The authors declare no conflict of interest.

References

  1. Ban, L.R.; Qi, C.Z.; Dan, R.L.; Tao, Z.G.; Xia, C.; Jiang, K. Softening model of shear stiffness before joint peak and analysis of its influencing factors. J. China Coal Soc. 2018, 43, 2765–2772. [Google Scholar]
  2. Hu, S.Y.; Liu, Q.S.; Li, S.H.; Sang, H.M.; Kang, Y.S. Advance and review on grouting critical problems in fractured mass. Coal Sci. Technol. 2022, 50, 112–126. [Google Scholar]
  3. Zhao, K. Numerical simulation of shear mechanical properties of coal structural plane. Coal Sci. Technol. 2021, 49, 89–95. [Google Scholar]
  4. Jiang, Y.J.; Zhang, S.H.; Luan, H.J.; Chen, L.; Zhang, G.; Wang, C. Effects of cyclic loading on rock joints Simulation study of the effect of cyclic loading on the macroscopic shear properties of rock joints. J. China Coal Soc. 2022. [Google Scholar] [CrossRef]
  5. Jing, H.W.; Zhu, T.T.; Su, H.J.; Yin, Q.; Zhao, H.H.; Han, G.S. Experimental study on anchoring force evolution characteristics of mortar anchor in joint rock mass. Coal Sci. Technol. 2017, 45, 16–21. [Google Scholar]
  6. Zhao, Z.; Peng, H.; Wu, W.; Chen, Y.-F. Characteristics of shear-induced asperity degradation of rock fractures and implications for solute retardation. Int. J. Rock Mech. Min. Sci. 2018, 105, 53–61. [Google Scholar] [CrossRef]
  7. Jiang, Y.J.; Zhang, S.H.; Luan, H.J.; Wang, C.S.; Wang, D.; Han, W. Numerical simulation of dynamic contact characteristics of rock mass structural planes under shear load. J. China Coal Soc. 2022, 47, 233–245. [Google Scholar]
  8. Yin, Q.; Jing, H.W.; Meng, B.; Liu, R.C.; Wu, Y.J. Shear mechanical properties of 3D rough rock fracture surfaces under constant normal stiffness conditions. Chin. J. Rock Mech. Eng. 2020, 39, 2213–2225. [Google Scholar]
  9. Liu, R.C.; Yin, Q.; Yang, H.Q.; Jing, H.; Yu, L. Cyclic shear mechanical properties of 3D rough joint surfaces under constant normal stiffness boundary conditions. Chin. J. Rock Mech. Eng. 2021, 40, 1092–1109. [Google Scholar]
  10. Zhou, G.-L.; Xu, T.; Konietzky, H.; Zhu, W.; Heng, Z.; Yu, X.-Y.; Zhao, Y. An improved grain-based numerical manifold method to simulate deformation, damage and fracturing of rocks at the grain size level. Eng. Anal. Bound. Elements 2021, 134, 107–116. [Google Scholar] [CrossRef]
  11. Zhao, Z.; Dou, Z.; Xu, H.; Liu, Z. Shear behavior of Beishan granite fractures after thermal treatment. Eng. Fract. Mech. 2019, 213, 223–240. [Google Scholar] [CrossRef]
  12. Meng, F.; Zhou, H.; Wang, Z.; Zhang, C.; Li, S.; Zhang, L.; Kong, L. Characteristics of Asperity Damage and Its Influence on the Shear Behavior of Granite Joints. Rock Mech. Rock Eng. 2017, 51, 429–449. [Google Scholar] [CrossRef]
  13. Moradian, Z.; Ballivy, G.; Rivard, P. Correlating acoustic emission sources with damaged zones during direct shear test of rock joints. Can. Geotech. J. 2012, 49, 710–718. [Google Scholar] [CrossRef]
  14. Meng, F.; Zhou, H.; Li, S.; Zhang, C.; Wang, Z.; Kong, L.; Zhang, L. Shear Behaviour and Acoustic Emission Characteristics of Different Joints Under Various Stress Levels. Rock Mech. Rock Eng. 2016, 49, 4919–4928. [Google Scholar] [CrossRef]
  15. Chai, M.; Hou, X.; Zhang, Z.; Duan, Q. Identification and prediction of fatigue crack growth under different stress ratios using acoustic emission data. Int. J. Fatigue 2022, 160, 106860. [Google Scholar] [CrossRef]
  16. Muir, C.; Swaminathan, B.; Almansour, A.S.; Sevener, K.; Smith, C.; Presby, M.; Kiser, J.D.; Pollock, T.M.; Daly, S. Damage mechanism identification in composites via machine learning and acoustic emission. Npj Comput. Mater. 2021, 7, 1–15. [Google Scholar] [CrossRef]
  17. Wang, Y.Y.; Gong, B.; Zhang, Y.J.; Yang, X.Y.; Tang, C.A. Progressive fracturebehavior and acoustic emission release of CJBs affected by joint distance ratio. Mathematics 2022, 10, 4149. [Google Scholar] [CrossRef]
  18. Gong, B.; Wang, Y.; Zhao, T.; Tang, C.; Yang, X.; Chen, T. AE energy evolution during CJB fracture affected by rock heterogeneity and column irregularity under lateral pressure. Geomat. Nat. Hazards Risk 2022, 13, 877–907. [Google Scholar] [CrossRef]
  19. Wang, Y.; Gong, B.; Tang, C. Numerical Investigation on Anisotropy and Shape Effect of Mechanical Properties of Columnar Jointed Basalts Containing Transverse Joints. Rock Mech. Rock Eng. 2022, 55, 7191–7222. [Google Scholar] [CrossRef]
  20. Jiang, Q.; Liu, C.; Feng, G.L.; Yang, Y. Evolution of Natural Joints’ Mesoscopic Failure Modes under Shear Tests: Acoustic Emission Investigation. Int. J. Geomech. 2021, 21, 04021205. [Google Scholar] [CrossRef]
  21. Liu, C.; Jiang, Q.; Xin, J.; Wu, S.; Liu, J.; Gong, F. Shearing Damage Evolution of Natural Rock Joints with Different Wall Strengths. Rock Mech. Rock Eng. 2022, 55, 1599–1617. [Google Scholar] [CrossRef]
  22. Jiang, Y.; Xiao, J.; Tanabashi, Y.; Mizokami, T. Development of an automated servo-controlled direct shear apparatus applying a constant normal stiffness condition. Int. J. Rock Mech. Min. Sci. 2003, 41, 275–286. [Google Scholar] [CrossRef]
  23. Jiang, Y.; Li, B.; Tanabashi, Y. Estimating the relation between surface roughness and mechanical properties of rock joints. Int. J. Rock Mech. Min. Sci. 2006, 43, 837–846. [Google Scholar] [CrossRef]
  24. Wang, C.; Jiang, Y.; Luan, H.; Sugimoto, S. Effect of shearing on hydraulic properties of rough-walled fractures under different boundary conditions. Energy Sci. Eng. 2019, 8, 865–879. [Google Scholar] [CrossRef] [Green Version]
  25. Song, J.-J.; Son, B.-K.; Lee, C.-I.; Rim, H.-R.; Choi, H.-J. Experimental study for shear behavior of pseudo rock joint under constant normal stiffness condition. In Proceedings of the 31st ITAAITES World Tunnel Congress on Underground Space Use, Istanbul, Turkey, 7–12 May 2005. [Google Scholar] [CrossRef]
  26. Stein, R.S. The role of stress transfer in earthquake occurrence. Nature 1999, 402, 605–609. [Google Scholar] [CrossRef]
  27. Yin, Q.; Ma, G.; Jing, H.; Wang, H.; Su, H.; Wang, Y.; Liu, R. Hydraulic properties of 3D rough-walled fractures during shearing: An experimental study. J. Hydrol. 2017, 555, 169–184. [Google Scholar] [CrossRef]
  28. Guo, W.; Gu, Q.; Tan, Y.; Hu, S. Case Studies of Rock Bursts in Tectonic Areas with Facies Change. Energies 2019, 12, 1330. [Google Scholar] [CrossRef] [Green Version]
  29. Ahola, M.P.; Hsiung, S.-M.; Kana, D.D. Experimental study on dynamic behavior of rock joints. Dev. Geotech. Eng. 1996, 79, 467–494. [Google Scholar] [CrossRef]
  30. Cui, G.J.; Zhang, C.Q.; Liu, L.P.; Zhou, H.; Cheng, G.T. Study on Shear Rate Effect on Mechanical Properties of Bolt Body-Mortar Interface. Rock Soil Mech. 2018, 7. [Google Scholar]
  31. Atapour, H.; Moosavi, M. The Influence of Shearing Velocity on Shear Behavior of Artificial Joints. Rock Mech. Rock Eng. 2013, 47, 1745–1761. [Google Scholar] [CrossRef]
  32. Tang, Z.C.; Wong, L.N.Y. Influences of Normal Loading Rate and Shear Velocity on the Shear Behavior of Artificial Rock Joints. Rock Mech. Rock Eng. 2015, 49, 2165–2172. [Google Scholar] [CrossRef]
  33. Wang, G.; Zhang, X.P.; Jiang, Y.K.; Wu, X.; Wang, S. Rate-dependent mechanical behavior of rough rock joints. Int. J. Rock Mech. Min. Sci. 2016, 83, 231–240. [Google Scholar] [CrossRef]
  34. Wang, G.; Zhang, X.P.; Jiang, Y.J.; Zhang, Y.Z. A Shear Strength Criterion for Rough Structures Considering Shear Rate. Chin. J. Geotech. Eng. 2015, 37, 1399–1404. [Google Scholar]
  35. Zhang, Y.; Jiang, Y.; Asahina, D.; Wang, C. Experimental and Numerical Investigation on Shear Failure Behavior of Rock-like Samples Containing Multiple Non-Persistent Joints. Rock Mech. Rock Eng. 2020, 53, 4717–4744. [Google Scholar] [CrossRef]
  36. Tse, R.; Cruden, D.M. Estimating joint roughness coefficients. Int. J. Rock Mech. Min. Sci. Geomech. Abstr. 1979, 16, 303–307. [Google Scholar] [CrossRef]
  37. Jiang, Y.J.; Zhang, S.H.; Luan, H.J.; Wang, C.S.; Wen, Z.J.; Dong, W.; Han, W. Experimental study on shear characteristics of anchored-jointed rock mass under constant normal stiffness boundary conditions. Chin. J. Rock Mech. Eng. 2021, 40, 663–675. [Google Scholar]
  38. Yong, K.L.; Jung, W.P.; Jae, J.S. Model for the shear behavior of rock joints under CNL and CNS conditions. Int. J. Rock Mech. Min. Sci. 2014, 70, 252–263. [Google Scholar]
  39. Yuan, W.; Li, J.C. Effect of Shear Rate on Friction Behavior of Straight Joints and Its Mechanism. Chin. J. Rock Mech. Eng. 2021, 40, 3241–3252. [Google Scholar]
  40. Meng, F.Z.; Wong, L.N.; Zhou, H.; Yu, J.; Cheng, G. Shear Rate Effects on the Post-peak Shear Behaviour and Acoustic Emission Characteristics of Artificially Split Granite Joints. Rock Mech. Rock Eng. 2019, 52, 2155–2174. [Google Scholar] [CrossRef]
Figure 1. The production process of gypsum joint specimen and rough surface morphology of joint. (a) Granite joint obtained from artificial splitting. (b) Cast plaster structure interview piece. (c) scanning graphs of the fracture surface.
Applsci 13 01189 g001
Figure 2. Experimental setup.
Applsci 13 01189 g002
Figure 3. Plan view of the sensor arrangement in the lower shear box; the numbers are sensor ID numbers.
Applsci 13 01189 g003
Figure 4. Shear actions of joints under various normal stiffness statuses. (a) Shear stress versus shear displacement of joints. (b) Normal displacement versus shear displacement of joints. (c) Normal stress versus shear displacement of joints.
Applsci 13 01189 g004
Figure 5. The relationship between normal stiffness and SRI and shear strength of joints. (a) Relation between SRI and shear displacement of the structural plane. (b) Variation of peak and ultimate shear stress for joints under different normal stiffness conditions.
Applsci 13 01189 g005
Figure 6. Failure modes of joints under diverse normal stiffness status. (a) For kn = 0; (b) For kn = 1 MPa/mm; (c) For kn = 3 MPa/mm; (d) For kn = 5 MPa/mm; (e) For kn = 7 MPa/mm.
Applsci 13 01189 g006
Figure 7. Damaged surface area and weight of damaged asperity of the joint surface under different normal stiffness conditions.
Applsci 13 01189 g007
Figure 8. Shear behaviors of joints with different shear rates under CNS conditions. (a) Shear stress versus shear displacement of joints. (b) Normal displacement versus shear displacement of joints. (c) Normal stress versus shear displacement of joints.
Applsci 13 01189 g008
Figure 9. The relationship between the joint peak value and final shear stress and shear rate.
Applsci 13 01189 g009
Figure 10. Failure modes of joints with different shear rates under CNS conditions. (a) Shear rate = 0.5 mm/min; (b) Shear rate = 2.5 mm/min; (c) Shear rate = 5 mm/min; (d) Shear rate = 10 mm/min; (e) Shear rate = 20 mm/min.
Applsci 13 01189 g010
Figure 11. Damaged surface area and weight of the damaged asperity of the joint surface under diverse shear rates.
Applsci 13 01189 g011
Figure 12. Difference of AE hit rate and cumulative AE hit of joints under diverse normal stiffness status. (a) For kn = 0; (b) For kn = 1 MPa/mm; (c) For kn = 3 MPa/mm; (d) For kn = 5 MPa/mm; (e) For kn = 7 MPa/mm.
Applsci 13 01189 g012aApplsci 13 01189 g012b
Figure 13. Difference of AE energy rate and amassed AE energy of joints under diverse normal stiffness status. (a) For kn = 0; (b) For kn = 1 MPa/mm; (c) For kn = 3 MPa/mm; (d) For kn = 5 MPa/mm; (e) For kn = 7 MPa/mm.
Applsci 13 01189 g013aApplsci 13 01189 g013b
Figure 14. Difference between AE hit rate and cumulative AE hit of joints with diverse shear rates under different CNS conditions. (a) Shear rate = 0.5 mm/min; (b) Shear rate = 2.5 mm/min; (c) Shear rate = 5 mm/min; (d) Shear rate = 10 mm/min; (e) Shear rate = 20 mm/min.
Applsci 13 01189 g014aApplsci 13 01189 g014b
Figure 15. Difference between AE energy rate and cumulative AE energy of joints with diverse shear rates under diverse CNS conditions. (a) Shear rate = 0.5 mm/min; (b) Shear rate = 2.5 mm/min; (c) Shear rate = 5 mm/min; (d) Shear rate = 10 mm/min; (e) Shear rate = 20 mm/min.
Applsci 13 01189 g015aApplsci 13 01189 g015b
Table 1. Physico-mechanical properties of rock-like replicas.
Physico-Mechanical PropertiesIndexUnitValue
Densityρg/cm32.066
Compressive strengthσcMPa47.4
Modulus of elasticityEsMPa28.7
Poisson’s ratiov0.23
Tensile strengthσtMPa2.5
CohesioncMPa5.3
Internal friction angleφ°63.3
Table 2. Loading scheme adopted in the test.
NumberInitial Normal Stress (MPa)Normal Stiffness (MPa/mm)Shear Rate (mm/min)
1200.5
21
33
45
57
632.5
735
8310
9320
Table 3. Statistics of AE parameters for joints sheared under different test conditions.
σn (MPa)kn (MPa/mm)v (mm/min)NphNthNh1/NthNh2/NthNh3/NthNpeNteNe1/NteNe2/NteNe3/Nte
1200.58735099.9%63.1%27%10,332143,60912.8%68.9%18.3%
2178389310.5%63.3%26.2%9079178,5539.2%71.9%18.9%
3388429012.2%61.5%26.3%12242239,2359.7%69.5%20.8%
457648424.9%67.3%27.8%10380317,6105.3%77.1%17.6%
578154176.1%68%25.9%10865371,1126.3%75.4%18.3%
632.513337498.4%63.1%28.5%14653264,7654.2%74.4%21.4%
73522432646.9%69.8%23.3%17506362,4213.5%76.1%20.4%
831028527316.4%73%20.6%26295310,4412.4%74.4%23.2%
932031120037.9%68.1%24%31670241,4235.2%70.4%24.4%
Note: Nph, Nth, Nh1, Nh2, Nh3 are acoustic emission impact count at the peak of shear stress, cumulative acoustic emission impact count during the whole shear process, acoustic emission impact count in stage I, acoustic emission impact count in stage Ⅱ, and acoustic emission impact count in stage III. Npe, Nte, Ne1, Ne2, Ne3 are the AE energy at the peak of shear stress, the accumulated AE energy during the whole shear process, the AE energy in the first stage, the AE energy in stage II, and the AE energy in the III stage, respectively.
Disclaimer/Publisher’s Note: The statements, opinions and data contained in all publications are solely those of the individual author(s) and contributor(s) and not of MDPI and/or the editor(s). MDPI and/or the editor(s) disclaim responsibility for any injury to people or property resulting from any ideas, methods, instructions or products referred to in the content.

