Article

Integrated Carbonate-Based CO2 Capture—Biofixation through Cyanobacteria

1
Department of Chemical and Geological Sciences, University of Modena and Reggio Emilia, Via G. Campi 103, 41125 Modena, Italy
2
Interdipartimental Centre H2-MORE, University of Modena and Reggio Emilia, Via Università 4, 41121 Modena, Italy
3
INSTM Research Unit of Modena, Via G. Campi 103, 41125 Modena, Italy
4
Algae S.p.A., Via Tacito 5/E, 41123 Modena, Italy
5
Department of Life Sciences, University of Modena and Reggio Emilia, Via G. Campi 103, 41125 Modena, Italy
*
Author to whom correspondence should be addressed.
Appl. Sci. 2023, 13(19), 10779; https://doi.org/10.3390/app131910779
Submission received: 2 August 2023 / Revised: 11 September 2023 / Accepted: 22 September 2023 / Published: 28 September 2023
(This article belongs to the Special Issue CCUS: Paving the Way to Net Zero Emissions Technologies)

Abstract

:
Microalgae, renowned for their high photosynthetic efficiency and minimal competition with land-based crops, hold great promise in the biofixation of CO2 from waste sources, making them valuable for diverse applications, including biofuels, food production, and biomaterials. An innovative technology, the integrated carbonate-based carbon capture and algae biofixation system is emerging as an alternative to traditional carbon capture and sequestration (CCS) methods. This closed-loop system utilizes bicarbonates as inorganic carbon sources, which can directly enter microalgae photosynthesis, subsequently regenerating carbonates for another cycle of carbon capture. This system offers significant advantages, including cost savings in carbon supply, simplified photobioreactor development, and reduced labor and energy requirements. Nevertheless, further research is essential to evaluate the suitability of various microorganisms and search for optimal growth conditions. In this study, we assessed the performance of two strains of Spirulina within the integrated system. Employing a Design of Experiments approach, we simultaneously varied temperature, bicarbonate concentration, and light irradiation while operating within a lab-scale photobioreactor. We achieved remarkable results, with a biomass productivity of 875 mg/L·d and an impressive CO2 utilization efficiency of 58%. These findings indicate a genuine opportunity for further exploration and scaling of this approach in industrial settings.

1. Introduction

Since mankind transitioned from wood to fossil fuels as their primary energy source, global energy demand has continued to rise exponentially. This shift has resulted in a heavy reliance on the combustion of gas, coal, or oil, accounting for approximately 79% of energy production in 2019 [1]. However, the use of fossil fuels has been linked to detrimental effects on the environment due to the significant amounts of pollutants and greenhouse gases released into the atmosphere. For instance, in 2019 alone, anthropogenic activities generated a staggering 40 gigatons of CO2, according to the International Energy Agency [2].
The accumulation of greenhouse gases in the atmosphere acts as a thick blanket, effectively trapping infrared radiation and preventing it from escaping into outer space. This phenomenon triggers a steady rise in temperatures of the Earth’s atmosphere and surface, commonly referred to as global warming, along with several related consequences, such as an enhanced frequency and intensity of extreme weather events, prolonged droughts, and heatwaves [3,4].
In order to partly compensate for anthropogenic CO2 emissions, one promising solution is the implementation of carbon capture and sequestration (CCS) systems. These systems typically involve capturing CO2 from low-concentration gaseous sources (including the atmosphere itself, industrial flue gases, or output from anaerobic digesters) using solid or liquid alkaline absorbents, such as alkali (hydr)oxides or organic amines. These absorbents can be regenerated through thermal treatment, allowing for the subsequent utilization of the released CO2 [5]. Carbonates have been widely used as CO2 absorbents, rapidly forming bicarbonates as indicated by Equation (1). Upon heating above around 80 °C (depending on the counter ion), these bicarbonates can regenerate carbonates (reverse arrow). The use of a liquid CO2 carrier offers several advantages in various applications, primarily due to its ease of handling, such as pumping, in comparison to solid carriers. Therefore, it is often preferable to use an aqueous solution of a soluble carbonate (often sodium, potassium, or ammonium), prepared either before or after transporting the carrier.
CO 3   2 + CO 2 + H 2 O 2   HCO 3
Several avenues exist for the application of captured CO2. A prevalent option is the chemical reduction of CO2 into simple organic molecules, such as CO or methane, which can serve as a valuable fuel source [6]. Despite its clear concept, CCS methods present significant challenges due to the overall expenses of CO2 management, including the energy requirements for absorbent thermal regeneration, CO2 compression, and distribution. For example, Kadam et al. estimated that the capital and operating costs for compressing, drying, and transporting CO2 through a pipeline over a distance of 100 km would amount to approximately EUR 11.3 per metric ton [7]. These costs can be even higher in the absence of existing infrastructure.
An integrated carbon capture and utilization (ICCU) system, which combines CO2 capture with its direct utilization, offers several advantages in comparison to systems featuring separate stages [8]. This results not only in reduced CO2 management costs but also leads to process intensification [9], wherein multiple unit operations can be incorporated in simpler machinery. This can lead to synergist simplification.
The integration of a carbonate-based CCS system with microalgal cultivation, referred to as “Bicarbonate-based Integrated Carbon Capture and Algae Production System” (BICCAPS) or “CO2 Absorption and Microalgae Conversion” (CAMC) [9], serves as an attractive example. This integration is enabled by microalgae’s capacity to directly uptake bicarbonate, facilitated by the “CO2 concentrating mechanism”, which involves membrane-bound and intracellular carbonic anhydrases [10,11]. Figure 1 illustrates the concept of the system, using sodium salts as an example. Initially, the CO2-rich flue gas is chemically fixed in an aqueous carbonate solution (pH~12, Liquid Carbon Carrier in its “discharged” form, LCC−), resulting in the formation of a bicarbonate solution (Equation (1)) with double the concentration (pH~8.0, Liquid Carbon Carrier in its “charged” form, LCC+).
Bicarbonate can enter metabolic pathways of microalgae, where it is converted into CO2 for fixation by rubisco inside the pyrenoid [12,13]. Hydroxyl ions are also co-produced (Equation (2)). The released CO2 can then be fixed as reduced carbon compounds, leading to biomass growth (Equation (3)), which exemplifies the case of bioreduction to glucose). However, the interaction of hydroxyl ions with bicarbonate causes carbonate to progressively become the dominant inorganic carbon species in solution (Equation (4)), a form that microalgae cannot metabolize. Consequently, the solution remaining after biomass harvesting can be directly recycled as LCC− and can further be used to chemically adsorb more CO2 (Equation (1)).
HCO 3 CO 2 + OH
6   CO 2 + 6   H 2 O   C 6 H 12 O 6 + 6   O 2
HCO 3 + OH   CO 3   2 +   H 2   O
A number of advantages are offered by this biotechnological process, such as:
  • Energy efficiency. The integrated system eliminates the need for thermal desorption of CO2, compression, and distribution, thereby reducing the CO2 management costs. Biofixation occurs at near room temperature, making it more energy efficient than conventional chemical processing at higher temperatures.
  • Process intensification. The process features fewer components, resulting in a reduction in capital expenditures (CapEx), labor required for operation, and maintenance costs.
  • Resource recycling. Operating as a closed-loop system, it allows for the reuse of the liquid carbonate carrier in multiple carbon capture cycles, reducing the need for continuous input of alkaline species and water. Additionally, a portion of the required nutrients can often be recycled.
  • Flue gas purification. Many attempts to directly use flue gas as an economical source of CO2 gas come with several critical issues, including low biofixation efficiency due to low CO2 water solubility, and a potential hindrance to algal growth caused by toxic substances such as SOX, NOX, and heavy metals. Using a carbonate carrier enables the selective fixation of CO2, resulting in purification from harmful species present in flue gas, such as SOX, NOX, and heavy metals.
  • Limitation of CO2 outgassing. At pH values lower than around 8.0, part of the CO2 is present as dissolved gas [14], which has very low solubility in water (approximately 1.25 × 10⁻⁵ mol/L in standard conditions), resulting in rapid CO2 loss to the atmosphere. Working at pH values higher than 8.0 converts CO2 into stable dissolved inorganic carbon (bicarbonate and carbonate).
  • Biomass production. The produced microalgae biomass has various potential applications, depending on the specific strain, including biofuels, food production, biochemicals, and biomaterials.
However, some limitations and challenges also exist:
  • Algae suitability. The effective operation of the system depends on the identification of suitable microalgae strains capable of ensuring consistent performance. Specifically, the microalgae strain must thrive in highly alkaline environments, corresponding to the complete shift in pH from bicarbonate (pH = 8) to carbonate (pH = 12). It is worth noting that the pH buffering ability of the HCO3/CO32− couple could aid in adapting the culture. In addition, the algae strain must tolerate a high ionic strength [15] as this will define the maximum tolerated bicarbonate concentration, and consequently, the maximum carbon density (minimum volume) of the carrier. The solubility of NaHCO3 in water (96 g/L at 20 °C) exceeds the saline tolerance limit of known algae cultures.
  • Biofixation rate and efficiency. For an optimal operation, both the CO2 absorption rate (R) and CO2 utilization efficiency (U) are essential. As the rate-determining step, this defines the overall processing speed of the integrated system (Figure 1). The operativity of the carbon capture step must be modulated based on the biofixation speed to avoid the need for storing large volumes of LCC+ (awaiting biofixation). Factors such as temperature, pH, light intensity, and nutrient availability need to be carefully controlled and optimized. Cultivation is often harvested near the end of the exponential growth phase, where the increased turbidity of the cell suspension begins to limit the amount of diffused light, affecting the photosynthetic process [16].
  • Harvesting easiness. The system requires an efficient harvesting method to separate the microalgae biomass from the cultivation medium, which can be challenging and costly [17].
  • Economic viability. The system involves important CapEx, which includes the purchase and set-up of equipment for algae cultivation and for the carbon capture stage. The system also requires a significant amount of energy, water, and materials (e.g., nutrients) [11]. The higher the carrier concentration tolerated by the culture, the lower the volume, together with lower capital and operational expenses. The value of the produced biomass can improve the overall economic balance.
  • Carrier recyclability. Aqueous carbonates and bicarbonates are not degraded during the cycling, but the accumulation of certain metabolites may require periodic purification.
  • Scaling up issues. Maintaining system efficiency and productivity on a larger scale requires significant engineering and logistical considerations, especially regarding light irradiation efficiency. Moreover, for consistent performance at scale, it is necessary to develop strategies to prevent and control microalgae contamination. Alkaline pH should limit some kind of contamination.
  • Closed loop vs. open loop plant design. Each biofixed CO2 molecule is accompanied by the production of one molecule of oxygen (Equation (3)). It is known that an increase in dissolved oxygen can lead to microalgae growth inhibition due to photorespiration [18], a condition where O2 competes with CO2 in the interaction with the rubisco enzyme [19]. Increased oxygen levels in closed-loop systems can also pose plant safety issues. Open-loop systems appear to be a simpler solution, but the outgassing of some CO2, especially during the initial phases of operation when the pH is lower, must be evaluated.
From the above considerations, it can be deduced that the development of an efficient microalgae-based ICCU system strongly relies on identifying an alkaline-tolerant, saline-tolerant strain capable of high growth rates. However, isolating industrially useful alkaliphilic green algae can be a complex undertaking. While prokaryotic cyanobacteria can thrive under high pH conditions, they may not be as versatile or suitable for broader industrial applications as eukaryotic green algae. Although obtaining ideal green algae from extreme environments such as Soda Lake is a possibility, implementing alkaline cultivation as a universal microalgae culture method remains challenging due to the unique requirements and limitations associated with such microorganisms. Therefore, further research should focus on evaluating microorganisms and identifying optimal growth conditions. This is essential to enable the overall techno-economic assessment of a microalgae-based ICCU system, even before considering scaling up.
After conducting an initial screening of available strains, including intentionally acquired strains such as Euhalothece ZM001 [15], it was found that the “regular” Spirulina species exhibits high potential for the intended application [20,21,22]. Spirulina sp. boasts the highest worldwide production volume of microalgal biomass and is renowned for its alkaliphilic nature, alongside its substantial protein content and a variety of other valuable byproducts [23].
The industrial readiness of these strains prompted us to conduct a performance assessment of two Spirulina strains, a type of blue-green algae cyanobacteria, within a laboratory-scale integrated photobioreactor. Employing a Design of Experiments (DoE) statistical approach, the simultaneous variation of three independent growth parameters such as temperature, light intensity, and bicarbonate concentration was studied. While conducting the evaluation, we also considered the outgassing of CO2 into the atmosphere, which led us to explore the implementation of a closed-loop design. This design modification resulted in significantly improved CO2 utilization efficiency.

2. Materials and Methods

2.1. General Information

Reagents and solvents were commercial grade and used as received. The micronutrient solution was prepared as described by the Culture Collection of Algae at the University of Gottingen [24]. One liter of the modified Spirulina medium was prepared according to reference 25 [25]. The following compounds were first dissolved, under stirring, in bidistilled water (Merck Millipore, ~100 mL): NaHCO3 (7.56 g), KH2PO4 (0.5 g), NaNO3 (2.5 g), K2SO4 (1.0 g), NaCl (1.0 g), MgSO4·7H2O (0.2 g), CaCl2·2H2O (0.04 g), FeSO4·7H2O (0.01 g), and Na2EDTA (0.08 g). The described micronutrient solution (5.0 mL) was added to this solution, then the volume was brought to 1000 mL with bidistilled water.
The Optical Density at λ = 680 nm (OD680) of the culture samples was measured using a Biochrom Ultrospec® III UV/Visible spectrophotometer. The chosen wavelength (680 nm) corresponds to a typical absorbance peak of Chlorophyll a [26], which provides a reading proportional to the concentration of suspended cells.

2.2. Microalgae Strains

The cyanobacterium Spr01 was a Spirulina strain donated by a company from Bergamo (Italy). The strain Spirulina platensis Spr02 was kindly donated by Algae S.p.A., a company devoted to the development and supply of industrial photobioreactors. Both strains were maintained with the described modified Spirulina medium in a 100 mL inoculum inside a 250 mL Erlenmeyer flask. The inoculums were kept at room temperature (25 ± 2 °C) under a cool white LED lamp and were stirred with an orbital agitator at 80 rpm. The inoculums were made fresh every 14 to 21 days.
Elemental analysis of a number of Spr01 samples allowed us to define its mean composition, that is, 44 ± 1 wt% in carbon, and 10 ± 1 wt% in nitrogen. Considering the mean nitrogen-to-protein conversion factor (=6.25) [27], the protein content is estimated to be 63 wt%. Analysis of Spr02 samples gave the following values: 48 ± 1 wt% in carbon and 9 ± 2 wt% in nitrogen. The estimated protein content is 56 wt%. These values are in good agreement with the average carbon content of microalgal biomass, which typically ranges from 37% to 52% [28], and with the expected protein content of blue-green cyanobacteria [29]. Representative elemental analyses of the samples are collected in Table S1.
Cell morphology was observed on a temporary slide at ×400 and ×1000 magnification by means of a light microscope with differential interference (Leica Leitz BMRD, equipped with an Amscope MU1803 camera). Representative images are shown in Figure S1. The temporary slide was prepared as follows: 0.5 mL of culture solution was centrifuged and the obtained biomass pellets were diluted with 0.5 mL of distilled water, then a single droplet was placed on the slide. The slide was then dried at 37 °C and a 30 wt% aqueous solution of glycerin was added to suspend the biomass. Spr01 is constituted of round cells with a diameter ranging from 2 to 2.5 µm, which forms small clusters in solution. On the other hand, Spr02 is composed of cells with a diameter between 2.5 and 4 µm, forming straight filaments measuring 300—900 µm in length. This significant difference in morphology is consistent with the macroscopic appearance of respective aqueous suspensions. Spr01 forms fine and uniform systems that require a long time to settle, while Spr02 suspensions appear cloudy and settle quickly when mixing is stopped. These features also explain the different harvesting methods employed for the two strains.

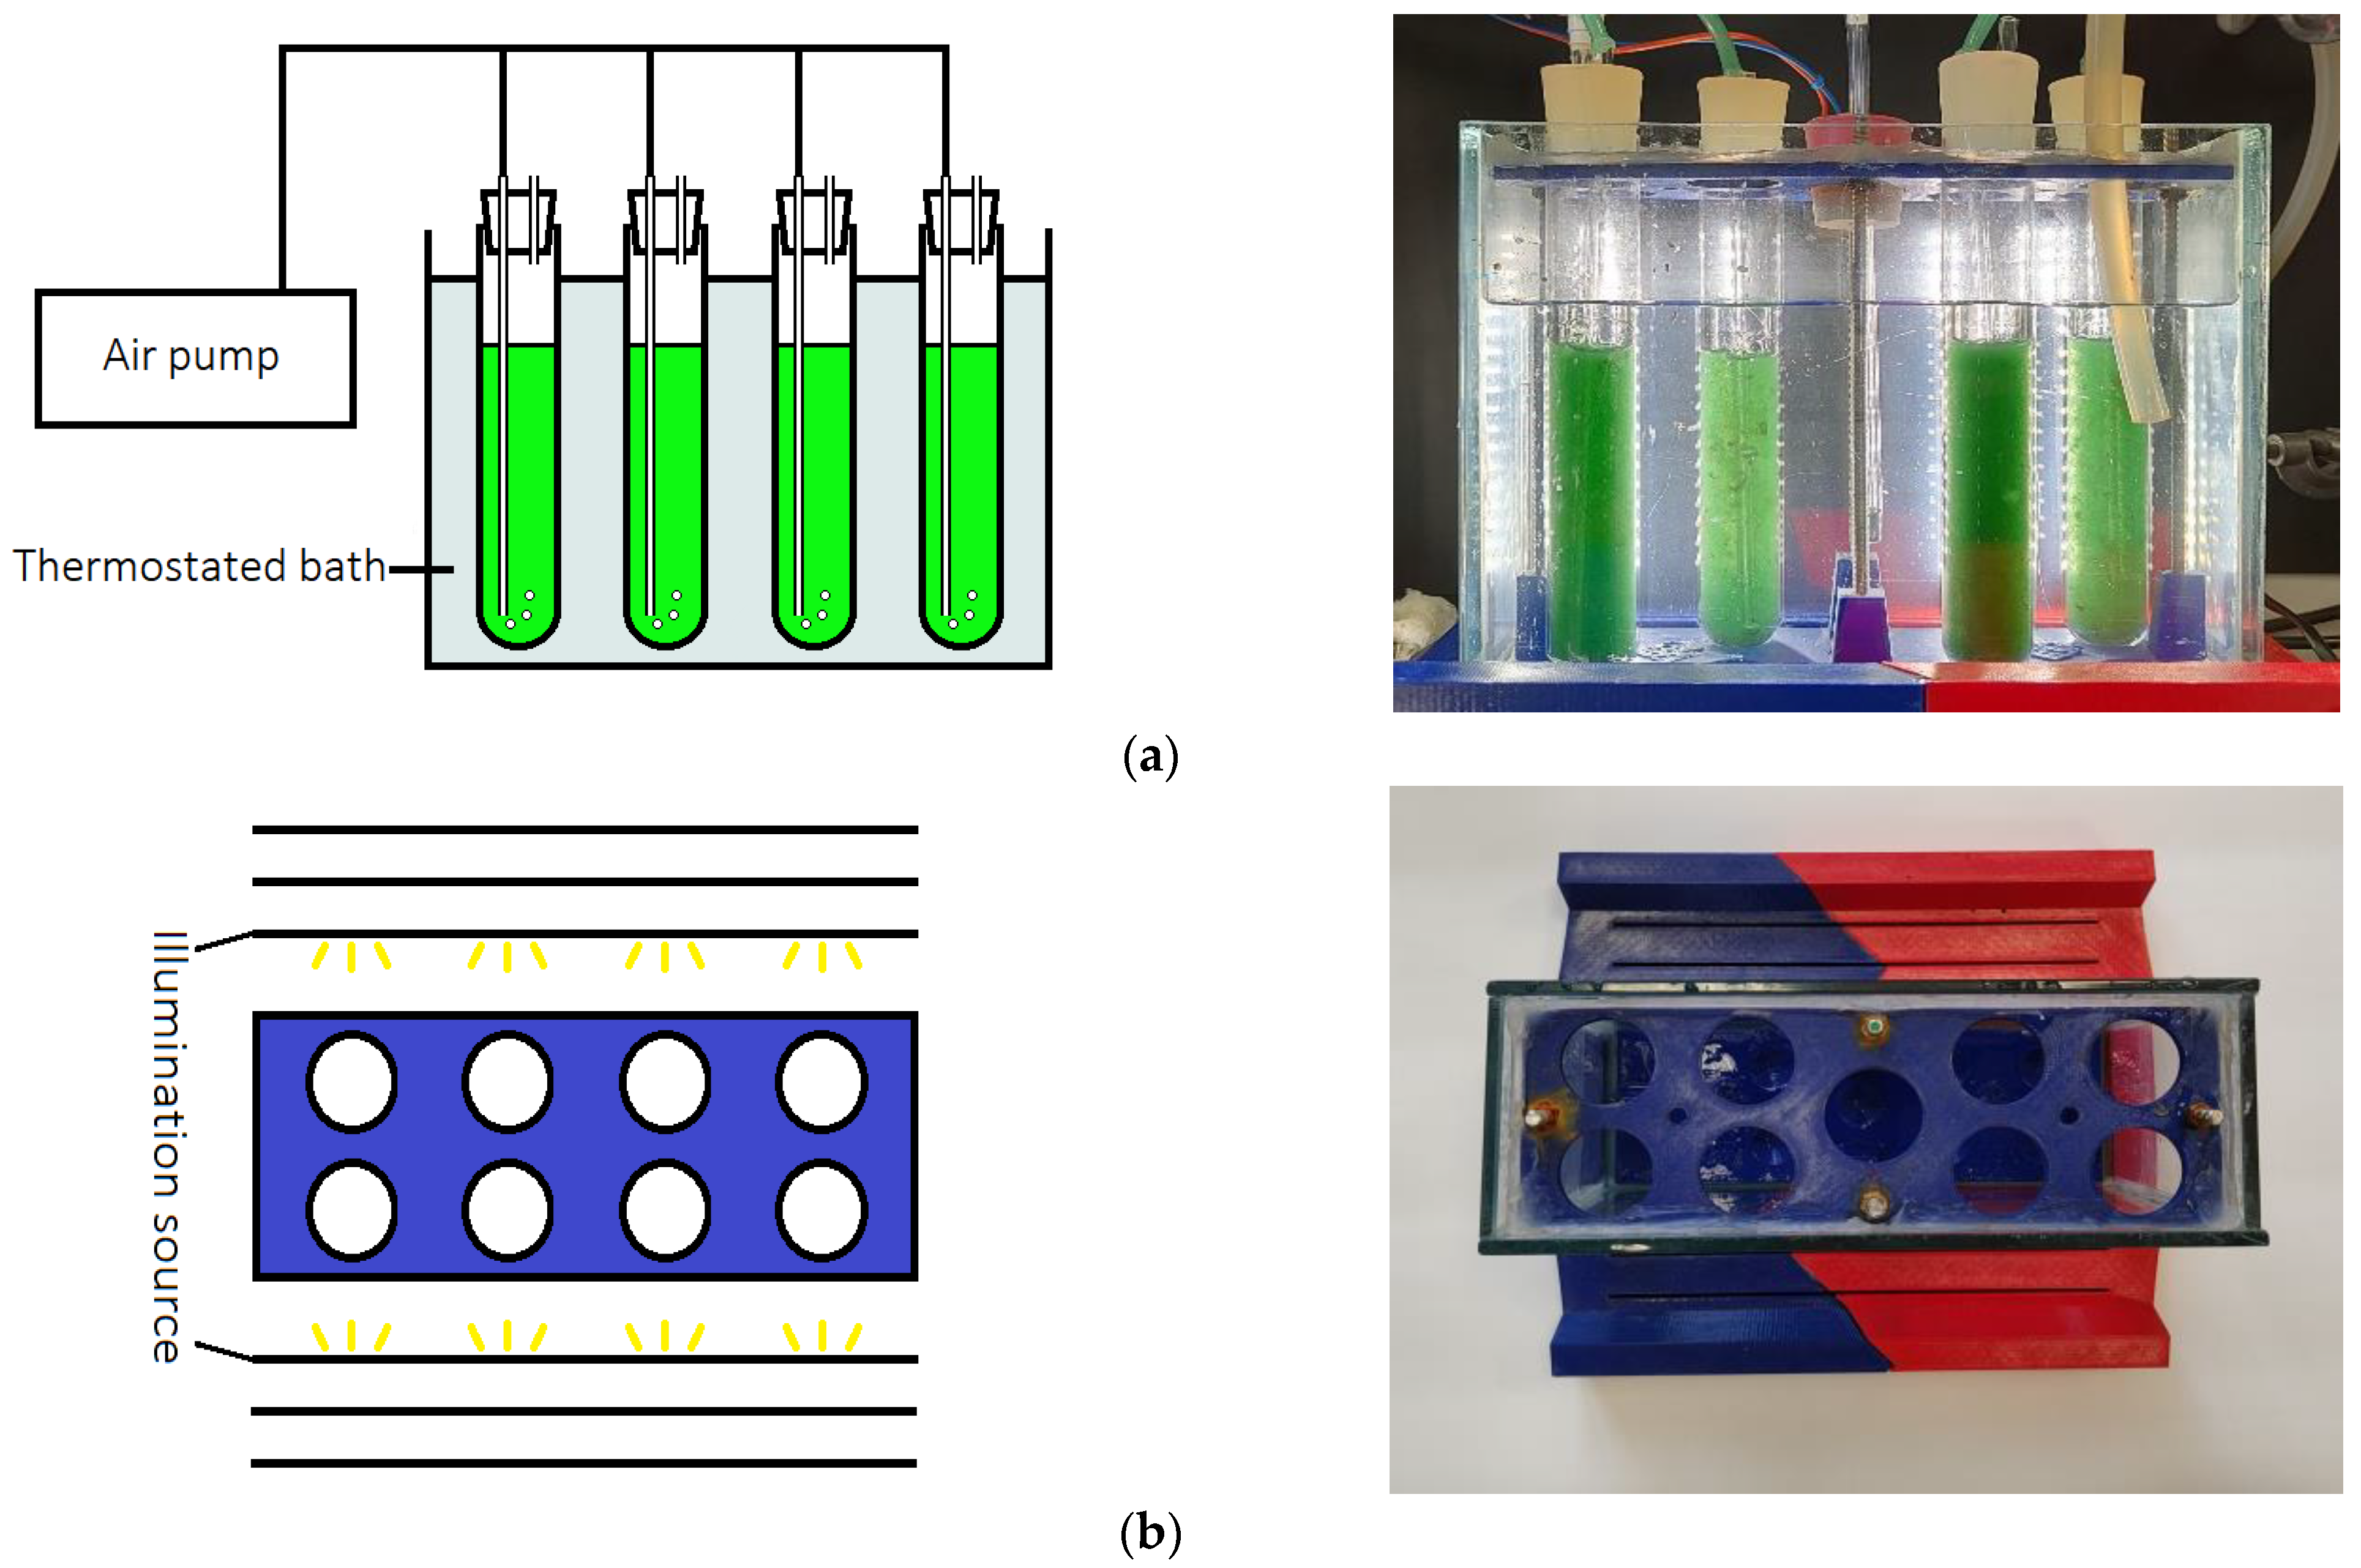
2.3. PBR Design and Operation

The photobioreactor (PBR) employed for this study was custom-built and consisted of a thermostatic recirculated water glass tank, constructed by bonding together five glass plates (each 5 mm thick) using silicon glue. Within the tank, eight biological glass tubes were positioned as culture slots, with each tube having an inner diameter of 3.0 cm, a height of 20 cm, and a working volume of approximately 70 mL. These culture tubes were arranged in two rows, and placed in the two longer sides of the tank. For illumination purposes, two LED panels are employed, with one panel positioned on each side of the PBR. Each LED panel comprised four LED strips, and each strip was aligned with the corresponding culture tube. The LED elements offer a lighting capacity of 18 W/m, producing 6300 lumens of cold white light with a color temperature of 4000 K. Power to the LED is supplied by a 24 V DC power supply unit.
To ensure stability and proper alignment of the system, two 3D-printed holders in PET polymer were designed: one external and one internal. The internal support comprises two parts: an upper component with eight holes and a bottom component with eight concave sockets, perfectly aligned with four M4 stainless steel threaded bars. These components work together to securely hold the culture tubes in place. Additionally, a central hole on the top part is included to accommodate a thermometer. On the other hand, the external support is designed with a central zone to hold the glass tank and three slots on each side to accommodate the LED panels. Using these three slots, the LED panel can be positioned at various distances from the tank, enabling the adjustment of illuminance levels.
The PBR is illustrated in Figure 2, which includes both a schematic representation and a photograph of the system.
Lux measurements were taken using an M1 professional portable lux-meter from OxyTech, adhering to reference standards EN 13032, with a photocell measuring 34 × 21 mm in dimensions. The recorded lux values for the three distances were as follows: 14,000 ± 600 lux for the farthest slot, 18,000 ± 800 lux for the middle slot, and 27,000 ± 1000 lux for the slot nearest to the tank. These measurements were conducted in the air, with the lux-meter placed at the same distances from the LED panels as the outer surface of the culture tubes. The values, averaging five measurements, were gathered at different heights of the LED strips, demonstrating excellent illumination uniformity. Photosynthetic Photon Flux Density (PPFD) values were derived through numerical conversion, accounting for the emission spectra of the light source [30]. The resulting PPFD values were as follows: 200 ± 9 µmol/s·m2 for the farthest slot, 260 ± 11 µmol/s·m2 for the middle slot, and 390 ± 14 µmol/s·m2 for the slot closest to the tank.
Temperature control was achieved by utilizing an external thermostatic fluid circulator using a mixture of water and propylene glycol. The local temperature inside the glass tank was monitored using a standard mercury thermometer. To ensure gentle mixing of the cultures, an air flux was introduced through 2 mm inner diameter glass tubes, one tube inserted in each culture tube. The air was supplied at a controlled rate of 0.8 cm3/s by a pump, which has proven to ensure proper mixing, even in the later stages of growth where the highest viscosity occurs.
Before entering the culture tubes, the air passed through a 2 M NaOH aqueous solution. This step serves two purposes: first, to remove naturally occurring CO2, and second, to achieve proper humidification.

2.4. Design of Experiments (DoE)

Two sets of microalgal growth experiments, one for each strain, were designed and the relative output data were statistically analyzed by means of Design Expert® v.12 software (Stat-Ease Inc., 1300 Godward Street NE, Suite 6400, Minneapolis, MN 55413, USA). A two-level, three-factor full factorial design with three replicates of the central point was implemented. The investigated independent parameters were temperature, ranging from 29 to 35 °C, light intensity, ranging from 260 to 390 µmol/s·m2, and bicarbonate concentration, ranging from 0.09 to 0.36 M. Light intensity value on the middle point was set at 260 µmol/s·m2 since it was not possible to modulate light intensity in a continuous way due to the PBR setup. The output parameter used for the analysis was biomass productivity (P), measured in mgbiomass/L·d. Figure S2 shows a schematic representation of the DoE domain. All the experiments were conducted by the same operator to minimize systematic errors, while the order of experiments was randomized.

2.5. Growth Experiments, Biomass Quantification, and Characterization
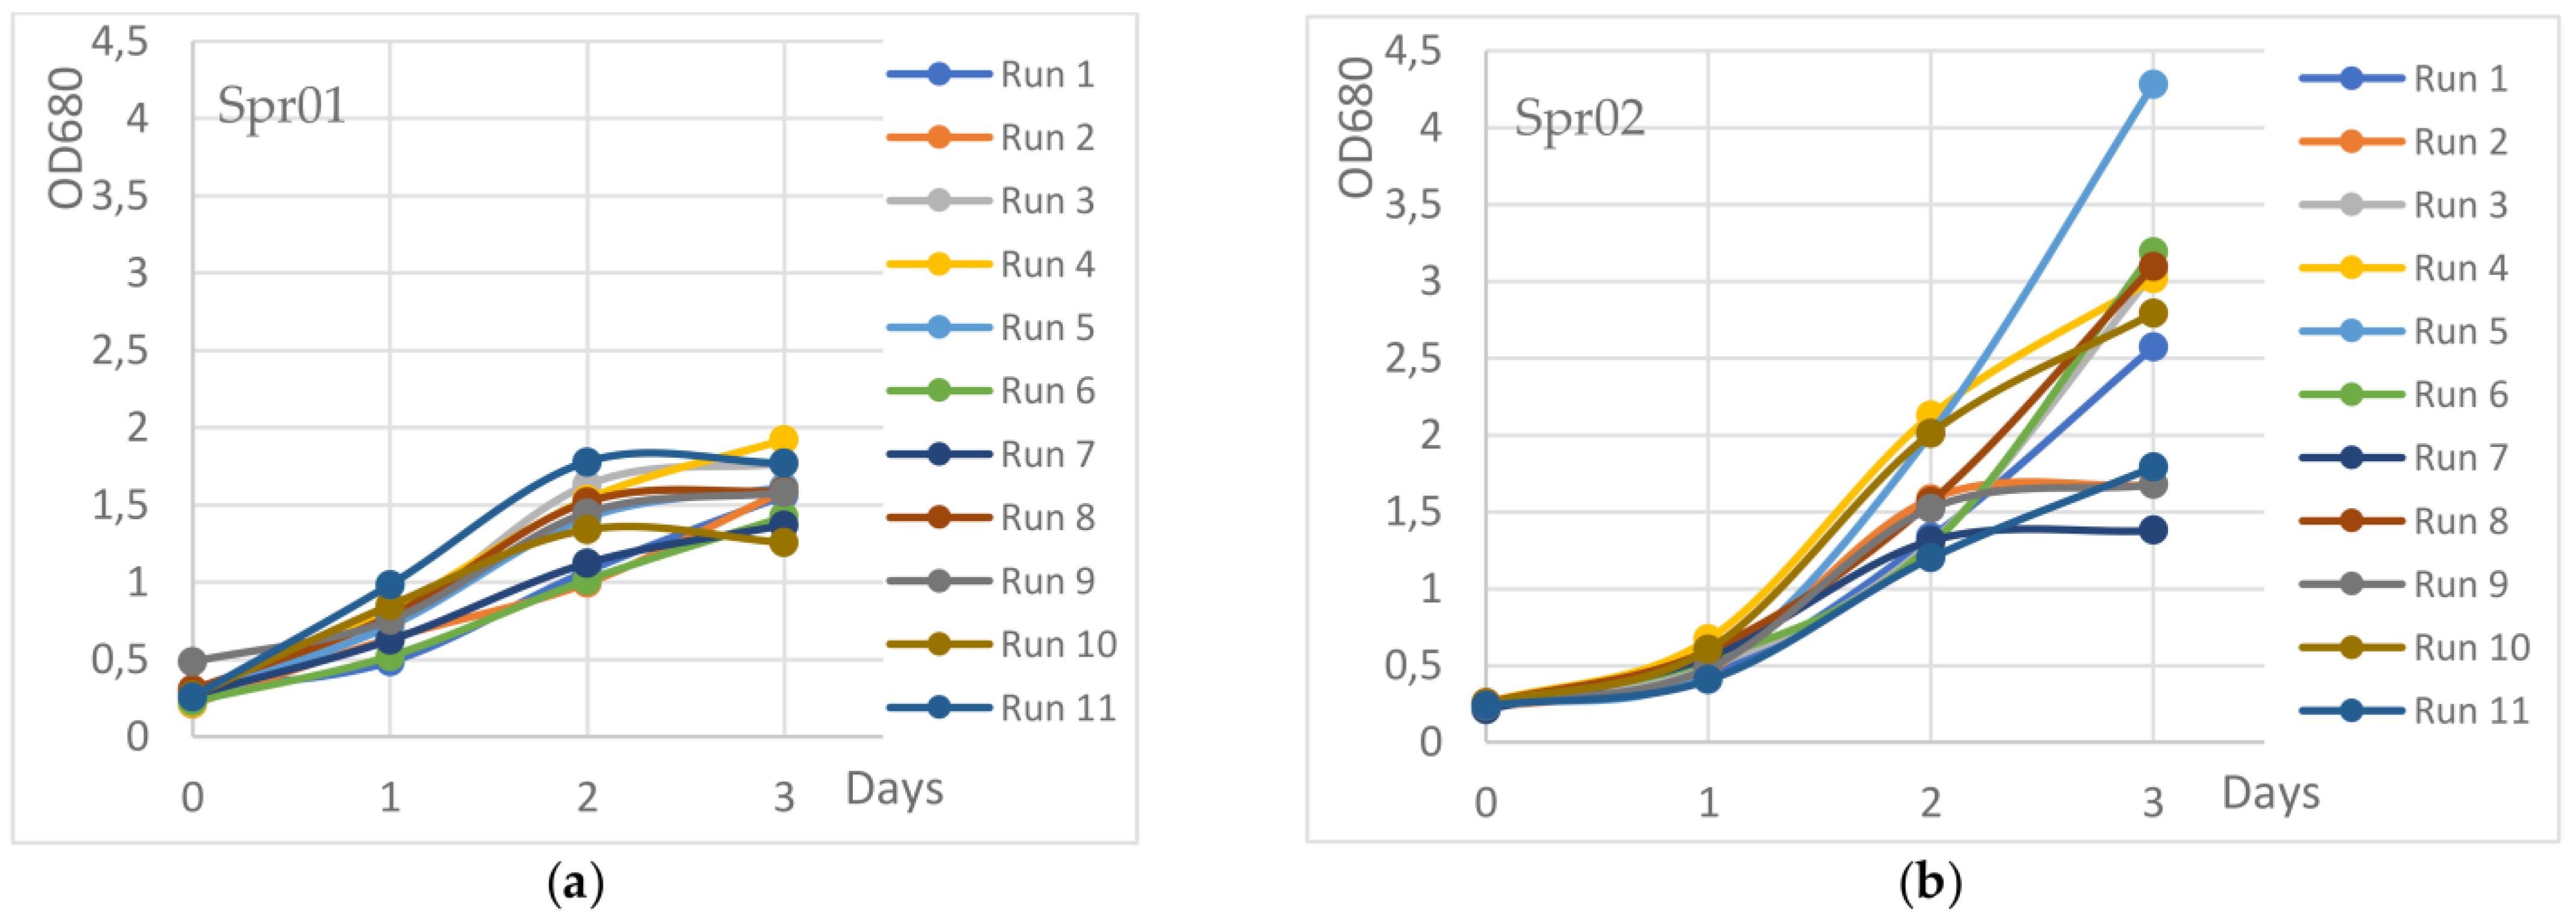
Each biomass growth test was conducted in duplicate, with each test using a single cultivation tube of the PBR (Figure 2) and was followed for 72 h. Initially, each cultivation had a working volume of 65 mL and an initial OD680 of approximately 0.25. Every 24 h, a small sample of suspension (1.5 mL) was taken from the culture to monitor microalgal growth via OD680. At the end of the 72 h experiment, Spr01 was harvested through two centrifugation cycles at 8000 rpm, with an intermediate washing step using distilled water (35 mL). In the case of Spr02, its morphology (Figure S1b) allowed for a simple harvesting method: filtration on a polyamide membrane (Sartolon®, 0.45 µm pore size) and washing of the residue with distilled water (35 mL).
The biomass obtained from strains was dried at 65 °C for 24 h and weighed to determine its dry mass. The dry biomass was characterized through elemental analysis to determine its carbon, nitrogen, and hydrogen content (see Section 2.2).
Biomass Productivity (P) was calculated from the final mass ( m t 1 ) with respect to the starting mass ( m t 0 ), which was obtained by the OD680 ratio (initial value divided by final value), according to Equation (5). t0 and t1 are the initial (0 h) and final (72 h) times, respectively. V is the working volume, expressed in liters.
P ( m g b i o m a s s L · d ) = m t 1 m t 0 V · ( t 1 t 0 ) = m t 1 m t 1 · O D 680 t 0 O D 680 t 1 V · ( t 1 t 0 )
The CO2 absorption rate (R) is proportional to P, and expressed as depicted in Equation (6), where CC is carbon wt% of the biomass dry weight. The equation accounts for the molecular weight ratio of CO2 and the atomic weight of the carbon element (= 44/12 = 3.67).
R ( m g C O 2 L · d ) = P · C C · M W ( C O 2 ) M W ( C )
Finally, the CO2 utilization efficiency (U, Equation (7)) was obtained from the moles of biofixed carbon ( n O C ) and the moles of maximum theoretical biofixable carbon ( n O C ( 100 ) ), that is, the moles of CO2 carried by the carbonate and equal to half of the moles of the bicarbonate (see Figure 1).
U = n O C n O C ( 100 ) · 100 = n O C n H C O 3 / 2 · 100

3. Results

Some preliminary growth tests were first conducted in the PBR (Figure 2) with both Spr01 and Spr02 strains to define the most significant operating variables and their ranges. Three independent parameters were chosen: culture temperature, light PPFD, and bicarbonate concentration. Biomass culture temperature is one of the most significant operating parameters [15] as variations can lead to significant shifts in metabolic pathways. Additionally, certain microalgae or cyanobacterium strains may have an optimal growth temperature [31]. The operating temperature is also linked to the energy input of the process. Light intensity strongly affects the growth and metabolism of photosynthetic organisms, including different Spirulina species [32,33]. Increased light irradiation can result in enhanced growth rates [34]. Moreover, bicarbonate concentration is a crucial parameter, not as a growth enhancer, but because it is linked to the inorganic carbon density in the solution. Working at high bicarbonate concentration means having a lower chemofixation volume for CO2, with substantial advantages in both PBR dimensions and the CO2 adsorption column. These parameters were included in a multivariate statistical DoE evaluation using the following ranges: from 29 to 35 °C for cultivation temperature, from 260 to 390 μmol/s·m2 for light PPFD, and from 0.09 to 0.36 mol/L (7.6–30.2 g/L) for bicarbonate concentration. As suggested by the DoE full factorial model, eleven experiments for each strain were performed, and the obtained outputs, in terms of P (Equation (5)) and R (Equation (6)), are reported in Table 1.
A significant productivity difference was observed between the two strains: while Spr01 reaches a productivity of 249 mg/L·d at its best (n. 3, Table 1), Spr02 achieves the excellent value of 760 mg/L·d (n. 5). Big differences between the two strains can also be observed in the corresponding daily growth rates (Figure 3). The lag, exponential, and stationary growth phases of Spr01 are difficult to define (Figure 3a), while Spr02 clearly shows a 36 h long lag phase, followed by a steeper exponential phase and then a short stationary phase (Figure 3b). OD680 values higher than 2.0 were never observed in the case of the Spr01 strain, while values exceeding 4.0 were observed in some instances of the Spr02 strain.
Accurate pH measurements of the best experiment (n. 5, Table 1), verified by titration with HCl 0.1 M, allowed us to assess a pH shift from 8.1 (at the start) to 12.2 (at the end), corresponding to the complete conversion of bicarbonate (LCC+) to carbonate (LCC−, Figure 1). This also indicates that, after 72 h of growth, no more biofixable carbon is present for the Spr02 strain. Therefore, extending the growth experiments beyond 72 h was judged to be of little interest.
From the statistical assessment of the correlation between (single or a combination of) independent parameters and the output variable, it came out that none of the studied parameters gave a significant correlation to P, in the case of the Spr01 strain (Figure S3a). On the other hand, the bicarbonate concentration and the interaction between bicarbonate concentration and temperature (AC, Figure S3b) give a significant correlation with productivity for the Spr02 strain.
Temperature significance, when considered alone, was uncertain, i.e., showing a borderline correlation with P, according to the statistical model. Based on these data and considering the easier separation due to favorable morphology (Figure S1b), our attention from hereon was focused on the Spr02 strain only. The strong dependence of P on bicarbonate concentration suggests a favorable match between carbon capture on carbonate and biofixation on Spirulina. Moreover, the statistical non-correlation between light intensity and productivity suggests that light saturation was reached. In this condition, the plastoquinone reduction rate exceeds the electron delivery rate, and an excess number of photons remains unused as all the charge carriers are busy [35]. Due to these results, in all the following experiments, the light PPFD was set at the lowest explored value of 260 µmol/s·m2, with a benefit on the energy requirements and replication of the lab-scale performances during (future) scale-up. The influences of individual parameters on P for the Spr02 strain are shown in Figure 4, from which it can be observed that there is a strong dependency on bicarbonate concentration and a slight dependence on temperature.
The influence of simultaneous variation of significant parameters on P is shown in Figure 5 (see also Figure S4). A strong interaction between the two parameters can be detected (AC, Figure S3b). In fact, at low bicarbonate conc. values (0.09 M), the dependence of P on T is small, while at higher values (0.36 M), P depends strongly on temperature. In other words, a positive synergistic effect occurs between temperature and bicarbonate concentration.
The best productivity values were obtained at the highest values of both NaHCO3 (0.36 M) and T (35 °C). This could mean that an increased P value could correspond to ranges external to the investigated domain, an eventuality also suggested by growth rates reported in Figure 3b. Anyway, as the final pH value of 12.2 suggests, the maximum seemed very near. While exploring temperatures greater than 35 °C was judged of little interest due to the energy requirement in the case of further scale-up of the integrated CCS-biofixation system, using higher bicarbonate concentrations is desirable, as it is linked to the reduction in operating volumes required to transport the same amount of CO2.

4. Discussion

Based on the previous considerations, further biofixation experiments with constant light PPFD (260 µmol/s·m2) and higher bicarbonate concentrations (0.45 M and 0.56 M) were set up. Unfortunately, these tests revealed a decreased productivity (n. 1–4, Table 2). This decline can be attributed to abiotic stresses due to high ionic strength, a known growth inhibitor for most microalgal strains [36].
The tolerance of high salinity appears to be enhanced at higher temperatures (n. 4, 5 vs. 1, 2), a behavior also observed for Spirulina platensis [37]. Anyway, productivity was never higher than that obtained with 0.36 M aqueous bicarbonate (n. 5 of Table 1, reported as n. 3 in Table 2 for better comparison). Not much more was obtained at the concentration of 0.45 mol/L when part of the NaHCO3 was changed with the respective potassium salt (n. 6, 7 Table 2). This suggests that the limitations in strain proliferation depend on the overall ionic strength rather than a cation-specific one [38].
In order to favor strain adaptation and possibly reduce the initial lag phase observed for Spr02 (Figure 3b), a new inoculum featuring a higher NaHCO3 concentration (0.36 M instead of 0.09 M) was prepared and subjected to three consecutive renewals, one every 14 days. When employed to start a new Spr02 culture under the best-known conditions (n. 8, Table 2), a shorter lag time was observed. The OD680 of the biomass suspension reached 2.59 after 48 h, an improved value compared to before (Figure 3b). Unfortunately, the OD680 at 72 h stopped at 3.25, corresponding to a productivity limited to 620 mgbiomass/L·d.
Dealing now with the CO2 utilization efficiency (U, Equation (7)), its calculation reveals a maximum value of 46% (right column of Table 2). This means that, in the best- conditions (n. 3), more than half of the inorganic carbon moles were lost during the biofixation process. Moreover, the final pH value of 12.2 indicates that no residual bicarbonate was present. This is a clear confirmation of the occurrence of CO2 outgassing, which is probably more pronounced during the initial growth phase when the pH is lower. We thought that the continuous air bubbling used to keep the cultures in agitation may cause the removal of the dissolved CO2, leading to a continuous equilibrium shift towards the loss of other inorganic carbon species.
A possible solution to this issue could involve recirculating the gas used for mixing the biomass culture, thereby achieving a sealed PBR design. In our small-scale setting, this was easily accomplished using a peristaltic pump (depicted in Figure 6), with the added simplification of removing the gas humidification stage (see Section 2.3).
Spr02 growth experiments were then repeated in the closed cycle system using the standard 0.09 M NaHCO3 inoculum (n. 2, Table 3). Oddly, an extended lag phase of 48 h was observed, compared to that of around 36 h of the reference experiment (n. 1, Table 3 or n. 5, Table 1). The following rapid exponential phase resulted in a productivity of 640 mgbiomass/L·d, an adsorption rate of 1030 mgCO2/L·d, and a 43% utilization efficiency. However, the pH value (11.7) after 72 h suggested incomplete carbon conversion, corresponding to a slower overall growth. This case likely benefits from additional time, an undesired feature that negatively affects the mean P and R. As previously seen, the use of a more concentrated inoculum offers an effective way to reduce adaptation times of Spr02, so a second experiment was conducted with the 0.36 M aqueous NaHCO3 inoculum (n. 3, Table 3). This approach proved to be successful, attaining higher productivity and adsorption rate, as well as a remarkable CO2 utilization efficiency. The final pH reading of 12.2 indicated that the carrier had undergone almost total conversion from the charged form (LCC+) to its discharged form (LCC−, Figure 1).
The closed cycle configuration allowed the containment of the gaseous CO2, resulting in improved growth. As the same configuration also produces an unwanted increase in gaseous oxygen coming from photosynthetic activity (Equation (3)), it became evident that a favorable balance between the two phenomena was achieved.

5. Conclusions

One of the primary challenges in processes mediated by microorganisms is the requirement to operate in dilute solutions. This necessitates the construction of large-scale plants (incurring high CapEx) and significant energy consumption to manage the substantial liquid volumes.
Our work has provided robust support for the suitability of Spirulina strains in ICCU systems, as depicted in Figure 1. We achieved high growth rates (P = 0.875 gbiomass/L·d, R = 1.41 gCO2/L·d), and a substantial CO2 utilization efficiency (U of 58%), along with ease of biomass harvesting. Replicating the performance observed in the laboratory-scale PBR, as shown in Figure 2, during scale-up can be challenging, especially for light irradiation. Fortunately, our data indicate that Spr02 can efficiently grow even under relatively low PPFD values.
Nevertheless, before contemplating scaling up to industrial settings, further research needs to be conducted to reduce process volumes and/or further increase growth rates. Several topics can be suggested as possible advancements:
  • The employment of non-saline carriers in addition to carbonate should address the reduction in process volumes as not linked to an increase in ionic strength. For example, the use of organic amines compatible with algae cultivation can be considered [39].
  • The implementation of an oxygen reduction/fixation method, even in the gas phase, could result in a growth boost [18], which would be especially useful in closed-loop systems.
  • Our work has shown some advantages in the pre-adaptation of Spr02 strains to 0.36 M bicarbonate. A re-evaluation of the nutrient solution should be performed. For example, it was reported that the addition of small amounts of acetates could favorably improve the growth rate [20].
  • Pulsed illumination should also be evaluated [35].

Supplementary Materials

The following supporting information can be downloaded at: https://www.mdpi.com/article/10.3390/app131910779/s1, Table S1: Representative elemental analysis of cyanobacteria strains; Figure S1: Optical microscope photographs of cell morphology for (a) Spr01, and (b) Spr02; Figure S2: Schematic representation of the DoE; Figure S3: Pareto charts relative to Spr01 (a) or Spr02 (b) growth experiments; Figure S4: Additional representations of the influence of simultaneous variation of NaHCO3 concentration and T on P, for Spr02 strain.

Author Contributions

Conceptualization, F.R. and A.U.; methodology, L.F.; software, B.A. and A.U.; validation, V.D., B.A. and F.R.; investigation, A.U.; resources, F.R. and A.L.R.; data curation, V.D. and A.U.; writing—original draft preparation, F.R. and A.U.; writing—review and editing, F.R.; visualization, A.U.; supervision, F.R. and L.F.; funding acquisition, F.R. All authors have read and agreed to the published version of the manuscript.

Funding

This research was partially funded by Algae S.p.A. under the PON Ph.D. MUR program (DM 1061, 2021).

Institutional Review Board Statement

Not applicable.

Informed Consent Statement

Not applicable.

Data Availability Statement

The data presented in this study are available within the article itself or in the related supplementary material.

Acknowledgments

We thank “Vetreria Punto Vetro S.n.C.”, Vignola (MO), Italy, for the gifted glass plates, employed for the realization of the PBR of Figure 2.

Conflicts of Interest

The authors declare no conflict of interest.

References

  1. Ritchie, H.; Roser, M.; Rosado, P. Energy 2022. Available online: https://ourworldindata.org/energy (accessed on 10 August 2023).
  2. IEA. World Energy Outlook 2021; IEA: Paris, France, 2021; Available online: https://www.iea.org/reports/world-energy-outlook-2021 (accessed on 10 August 2023).
  3. Kweku, D.; Bismark, O.; Maxwell, A.; Desmond, K.; Danso, K.; Oti-Mensah, E.; Quachie, A.; Adormaa, B. Greenhouse Effect: Greenhouse Gases and Their Impact on Global Warming. JSRR 2018, 17, 1–9. [Google Scholar] [CrossRef]
  4. Core Writing Team; Lee, H.; Romero, J. (Eds.) IPCC Climate Change 2023: Synthesis Report; Contribution of Working Groups I, II and III to the Sixth Assessment Report of the Intergovernmental Panel on Climate Change; IPCC: Geneva, Switzerland, 2023; pp. 35–115. [Google Scholar] [CrossRef]
  5. Figueroa, J.D.; Fout, T.; Plasynski, S.; McIlvried, H.; Srivastava, R.D. Advances in CO2 Capture Technology—The U.S. Department of Energy’s Carbon Sequestration Program. Int. J. Greenh. Gas Control 2008, 2, 9–20. [Google Scholar] [CrossRef]
  6. Bhavsar, A.; Hingar, D.; Ostwal, S.; Thakkar, I.; Jadeja, S.; Shah, M. The Current Scope and Stand of Carbon Capture Storage and Utilization—A Comprehensive Review. Case Stud. Chem. Environ. Eng. 2023, 8, 100368. [Google Scholar] [CrossRef]
  7. Kadam, K.L. Power Plant Flue Gas as a Source of CO2 for Microalgae Cultivation: Economic Impact of Different Process Options. Energy Convers. Manag. 1997, 38, S505–S510. [Google Scholar] [CrossRef]
  8. Sun, H.; Wang, Y.; Xu, S.; Osman, A.I.; Stenning, G.; Han, J.; Sun, S.; Rooney, D.; Williams, P.T.; Wang, F.; et al. Understanding the Interaction between Active Sites and Sorbents during the Integrated Carbon Capture and Utilization Process. Fuel 2021, 286, 119308. [Google Scholar] [CrossRef]
  9. Song, C.; Han, X.; Yin, Q.; Chen, D.; Li, H.; Li, S. Performance Intensification of CO2 Absorption and Microalgae Conversion (CAMC) Hybrid System via Low Temperature Plasma (LTP) Treatment. Sci. Total Environ. 2021, 801, 149791. [Google Scholar] [CrossRef] [PubMed]
  10. Moroney, J.V.; Ynalvez, R.A. Proposed Carbon Dioxide Concentrating Mechanism in Chlamydomonas reinhardtii. Eukaryot. Cell 2007, 6, 1251–1259. [Google Scholar] [CrossRef]
  11. Li, G.; Xiao, W.; Yang, T.; Lyu, T. Optimization and Process Effect for Microalgae Carbon Dioxide Fixation Technology Applications Based on Carbon Capture: A Comprehensive Review. J. Carbon Res. 2023, 9, 35. [Google Scholar] [CrossRef]
  12. Badger, M.R. CO2 Concentrating Mechanisms in Cyanobacteria: Molecular Components, Their Diversity and Evolution. J. Exp. Bot. 2003, 54, 609–622. [Google Scholar] [CrossRef]
  13. Ramazanov, Z.; Rawat, M.; Henk, M.C.; Mason, C.B.; Matthews, S.W.; Moroney, J.V.V. The Induction of the CO2 Concentrating Mechanism Is Correlated with the Formation of the Starch Sheath around the Pyrenoid of Chlamydomonas Reinhardtii. Planta 1994, 195, 210–216. [Google Scholar] [CrossRef]
  14. Pedersen, O.; Colmer, T.D.; Sand-Jensen, K. Underwater Photosynthesis of Submerged Plants—Recent Advances and Methods. Front. Plant Sci. 2013, 4, 140. [Google Scholar] [CrossRef] [PubMed]
  15. Chi, Z.; Xie, Y.; Elloy, F.; Zheng, Y.; Hu, Y.; Chen, S. Bicarbonate-Based Integrated Carbon Capture and Algae Production System with Alkalihalophilic Cyanobacterium. Bioresour. Technol. 2013, 133, 513–521. [Google Scholar] [CrossRef] [PubMed]
  16. Onyeaka, H.; Miri, T.; Obileke, K.; Hart, A.; Anumudu, C.; Al-Sharify, Z.T. Minimizing Carbon Footprint via Microalgae as a Biological Capture. Carbon Capture Sci. Technol. 2021, 1, 100007. [Google Scholar] [CrossRef]
  17. Zhu, C.; Zhang, R.; Cheng, L.; Chi, Z. A Recycling Culture of Neochloris Oleoabundans in a Bicarbonate-Based Integrated Carbon Capture and Algae Production System with Harvesting by Auto-Flocculation. Biotechnol. Biofuels 2018, 11, 204. [Google Scholar] [CrossRef] [PubMed]
  18. Franco-Morgado, M.; Tabaco-Angoa, T.; Ramírez-García, M.A.; González-Sánchez, A. Strategies for Decreasing the O2 Content in the Upgraded Biogas Purified via Microalgae-Based Technology. J. Environ. Manag. 2021, 279, 111813. [Google Scholar] [CrossRef]
  19. Stitt, M.; Schulze, D. Does Rubisco Control the Rate of Photosynthesis and Plant Growth? An Exercise in Molecular Ecophysiology. Plant Cell Environ. 1994, 17, 465–487. [Google Scholar] [CrossRef]
  20. Li, P.; Hu, Z.; Yin, Q.; Song, C. Improving the Growth of Spirulina in CO2 Absorption and Microalgae Conversion (CAMC) System through Mixotrophic Cultivation: Reveal of Metabolomics. Sci. Total Environ. 2023, 858, 159920. [Google Scholar] [CrossRef]
  21. Zhu, C.; Chen, S.; Ji, Y.; Schwaneberg, U.; Chi, Z. Progress toward a Bicarbonate-Based Microalgae Production System. Trends Biotechnol. 2022, 40, 180–193. [Google Scholar] [CrossRef]
  22. Singh, R.P.; Yadav, P.; Kujur, R.; Pandey, K.D.; Gupta, R.K. Cyanobacteria and Salinity Stress Tolerance. In Cyanobacterial Lifestyle and Its Applications in Biotechnology; Elsevier: Amsterdam, The Netherlands, 2022; pp. 253–280. ISBN 978-0-323-90634-0. [Google Scholar]
  23. Costa, J.A.V.; Freitas, B.C.B.; Rosa, G.M.; Moraes, L.; Morais, M.G.; Mitchell, B.G. Operational and Economic Aspects of Spirulina-Based Biorefinery. Bioresour. Technol. 2019, 292, 121946. [Google Scholar] [CrossRef]
  24. Sammlung von Algenkulturen Göttingen 02 Spirulina Medium 2008. Available online: http://sagdb.uni-goettingen.de/culture_media/02%20Spirulina%20Medium.pdf (accessed on 10 August 2023).
  25. Aiba, S.; Ogawa, T. Assessment of Growth Yield of a Blue-Green Alga, Spirulina Platensis, in Axenic and Continuous Culture. J. Gen. Microbiol. 1977, 102, 179–182. [Google Scholar] [CrossRef]
  26. Guidi, L.; Tattini, M.; Landi, M. How Does Chloroplast Protect Chlorophyll Against Excessive Light? In Chlorophyll; Jacob-Lopes, E., Zepka, L.Q., Queiroz, M.I., Eds.; InTech: London, UK, 2017; ISBN 978-953-51-3107-6. [Google Scholar]
  27. Chronakis, I.S.; Galatanu, A.N.; Nylander, T.; Lindman, B. The Behaviour of Protein Preparations from Blue-Green Algae (Spirulina Platensis Strain Pacifica) at the Air/Water Interface. Colloids Surf. A Physicochem. Eng. Asp. 2000, 173, 181–192. [Google Scholar] [CrossRef]
  28. Halder, P.; Azad, A.K. Recent Trends and Challenges of Algal Biofuel Conversion Technologies. In Advanced Biofuels; Elsevier: Amsterdam, The Netherlands, 2019; pp. 167–179. ISBN 978-0-08-102791-2. [Google Scholar]
  29. Marrez, D.A.; Naguib, M.M.; Sultan, Y.Y.; Daw, Z.Y.; Higazy, A.M. Evaluation of Chemical Composition for Spirulina Platensis in Different Culture Media. Res. J. Pharm. Biol. Chem. Sci. 2014, 5, 1161–1171. [Google Scholar]
  30. Ashdown, I. Photometry and Photosynthesis: From Photometry to PPFD 2015. Available online: https://www.researchgate.net/publication/284157299_Photometry_and_Photosynthesis_From_Photometry_to_PPFD_Revised (accessed on 10 August 2023).
  31. Ras, M.; Steyer, J.-P.; Bernard, O. Temperature Effect on Microalgae: A Crucial Factor for Outdoor Production. Rev. Environ. Sci. Biotechnol. 2013, 12, 153–164. [Google Scholar] [CrossRef]
  32. Markou, G.; Chatzipavlidis, I.; Georgakakis, D. Effects of Phosphorus Concentration and Light Intensity on the Biomass Composition of Arthrospira (Spirulina) Platensis. World J. Microbiol. Biotechnol. 2012, 28, 2661–2670. [Google Scholar] [CrossRef]
  33. Chaiklahan, R.; Chirasuwan, N.; Srinorasing, T.; Attasat, S.; Nopharatana, A.; Bunnag, B. Enhanced Biomass and Phycocyanin Production of Arthrospira (Spirulina) Platensis by a Cultivation Management Strategy: Light Intensity and Cell Concentration. Bioresour. Technol. 2022, 343, 126077. [Google Scholar] [CrossRef] [PubMed]
  34. Danesi, E.D.G.; Rangel-Yagui, C.O.; Carvalho, J.C.M.; Sato, S. Effect of Reducing the Light Intensity on the Growth and Production of Chlorophyll by Spirulina Platensis. Biomass Bioenergy 2004, 26, 329–335. [Google Scholar] [CrossRef]
  35. Zarmi, Y.; Gordon, J.M.; Mahulkar, A.; Khopkar, A.R.; Patil, S.D.; Banerjee, A.; Reddy, B.G.; Griffin, T.P.; Sapre, A. Enhanced Algal Photosynthetic Photon Efficiency by Pulsed Light. iScience 2020, 23, 101115. [Google Scholar] [CrossRef]
  36. Paliwal, C.; Mitra, M.; Bhayani, K.; Bharadwaj, S.V.V.; Ghosh, T.; Dubey, S.; Mishra, S. Abiotic Stresses as Tools for Metabolites in Microalgae. Bioresour. Technol. 2017, 244, 1216–1226. [Google Scholar] [CrossRef]
  37. Soe, K.M.; Soe-Htun, U. Effects of Temperature, Salinity, Light Intensity and Media on the Growth of Spirulina Platensis (Nordstedt) Geitler Using Seawater-Based Media. Univ. Res. J. 2010, 3, 1–16. [Google Scholar]
  38. Zhang, P.; Sun, Q.; Dong, Y.; Lian, S. Effects of Different Bicarbonate on Spirulina in CO2 Absorption and Microalgae Conversion Hybrid System. Front. Bioeng. Biotechnol. 2023, 10, 1119111. [Google Scholar] [CrossRef]
  39. Al-Zuhair, S.; AlKetbi, S.; Al-Marzouqi, M. Regenerating Diethanolamine Aqueous Solution for CO2 Absorption Using Microalgae. Ind. Biotechnol. 2016, 12, 105–108. [Google Scholar] [CrossRef]
Figure 1. Schematic representation of the integrated carbonate-based CCS biofixation system, where the blue line refers to the capture of CO2 from the flue gas, the black lines refer to the carbonate-bicarbonate cycle, and the green line refers to microalgae growth and harvesting.
Applsci 13 10779 g001
Figure 2. Scheme and real prototype of the custom-built PBR: (a) side view, (b) top view.
Applsci 13 10779 g002
Figure 3. Daily growth rates for Spr01 (a) or Spr02 (b).
Applsci 13 10779 g003
Figure 4. Influence of NaHCO3 conc. (a) and temperature (b) on P for Spr02 strain.
Applsci 13 10779 g004
Figure 5. Contour plot (a) and surface plot (b) of the dependence of P from NaHCO3 concentration and T for Spr02 strain.
Applsci 13 10779 g005
Figure 6. Schematic of the PBR closed cycle design.
Applsci 13 10779 g006
Table 1. DoE conducted experiments and output data a.
n.T
(°C)
Light Intensity
(µmol/s·m2)
NaHCO3
(mol/L)
P Spr01
(mg/L·d)
R Spr01
(mgCO2/L·d)
P Spr02
(mg/L·d)
R Spr02
(mgCO2/L·d)
1292600.36180 ± 16300 ± 28500 ± 17870 ± 30
2293900.09220 ± 20360 ± 35350 ± 12610 ± 21
3352600.36240 ± 21390 ± 37720 ± 251250 ± 43
4322600.23220 ± 20360 ± 35580 ± 201010 ± 35
5353900.36200 ± 17310 ± 30760 ± 261320 ± 45
6293900.36140 ± 13230 ± 22600 ± 211050 ± 36
7353900.09190 ± 17300 ± 29290 ± 10500 ± 17
8322600.23150 ± 13240 ± 23530 ± 18920 ± 32
9352600.09190 ± 17310 ± 30290 ± 10500 ± 17
10322600.23150 ± 13240 ± 23470 ± 16820 ± 28
11292600.09210 ± 19340 ± 32290 ± 10500 ± 17
a Common conditions: 72 h, 0.09M NaHCO3 inoculum. Mean values of two replicates.
Table 2. Higher bicarbonate concentration experiments a.
n.T (°C)NaHCO3
(mol/L)
KHCO3
(mol/L)
P
(mgbiomass/L·d)
R
(mgCO2/L·d)
U
(mol%)
1290.45052 ± 283 ± 32
2290.540---
3350.360760 ± 261323 ± 4546
4350.450550 ± 19958 ± 3329
5350.540350 ± 12610 ± 2115
6350.270.18600 ± 211045 ± 3632
7350.360.09590 ± 201027 ± 3631
8 b350.360620 ± 191110 ± 3640
a PPFD = 260 µmol/s·m2, T = 35 °C, t = 72 h; 0.09 M NaHCO3 inoculum; b PPFD = 260 µmol/s·m2, T = 35 °C, t = 72 h; 0.36 M NaHCO3 inoculum.
Table 3. Closed cycle growth experiments a.
n.Inoculum NaHCO3
(mol/L)
P
(mgbiomass/L·d)
R
(mgCO2/L·d)
U
(mol%)
1 b0.09760 ± 261320 ± 4546
20.09640 ± 231030 ± 3943
30.36875 ± 231410 ± 4058
a 0.36 M NaHCO3, 260 µmol/s·m2, 35 °C, 72 h.; b open cycle reference (n. 5, Table 1).
Disclaimer/Publisher’s Note: The statements, opinions and data contained in all publications are solely those of the individual author(s) and contributor(s) and not of MDPI and/or the editor(s). MDPI and/or the editor(s) disclaim responsibility for any injury to people or property resulting from any ideas, methods, instructions or products referred to in the content.

